geert driessen (1993) see socio-economic or ethnic determinants of educational opportunities?...
TRANSCRIPT
Studies in Educational Evaluation. Vol. 19, pp. 265-280, 1993 0191-491XF33 $24.00 Printed in Great Britain. All rights reserved. © 1993 Pergamon Press Ltd
SOCIAL OR ETHNIC DETERMINANTS OF EDUCATIONAL OPPORTUNITIES? RESULTS FROM THE EVALUATION OF THE EDUCATION PRIORITY POLICY PROGRAMME IN THE
NETHERLANDS
Geert W. d. M. Driessen
Institute for Applied Social Sciences, Nijmegen, The Netherlands
Introduction
The central question addressed in this article concerns the relative importance of social background and ethnic origin in explaining differences in the position of immigrant and native Dutch pupils in the Dutch education system. The article is in two parts. The first part explores the migration of ethnic groups to the Netherlands, the reaction of the Dutch government and educational policies towards immigrant groups. A major element in these policies is the educational priority policy programme (OVB); specific attention is given to one of the cornerstones of the OVB, viz. the classification of disadvantaged pupils into different categories on the basis of socio-economic and ethnic family characteristics. A concise overview is given of the major research findings in respect of the educational opportunities of immigrant pupils in the Netherlands. The second part of the article presents the results of a large-scale study that has been conducted in the context of the national evaluation of the OVB. On the basis of recently collected data, the question of the relative weight of social background and ethnic origin is considered once more, from an empirical point of view. The answer to this question is not only relevant for the theoretical debate on determinants of differences in educational opportunities, but also for a reappraisal of the criteria that are being used within the framework of the OVB to classify disadvantaged pupils from different backgrounds. Points for discussion are suggested by way of conclusion.
Background
Migration to the Netherlands
The people who migrated to the Netherlands after World War II can be divided into three categories. In the first place, there are the immigrants from the former Dutch colonies: people from the former Dutch East Indies, Moluccans, Surinamese and Antilleans. These groups have beencoming to the Netherlands since the end of World War
265
266 G. W. J. M. Driessen
II. Although their ties with the Netherlands go back a long way, there are wide differences between them as regards the rate at which and the degree to which they have been assimilated into Dutch society. The second category is composed of immigrant workers. The majority of this group came to the Netherlands during theearly 1960s, driven by economic motives. Initially, this group consisted mainly of men who came to the Netherlands as unskilled workers. At that time the Dutch government assumed that these immigrants would eventually return to their home country. However, this proved to be an illusion. The majority stayed in the Netherlands; besides, more and more women and children came to the Netherlands to be re-united with their husbands and fathers. The third category is made up of political refugees. This group consists mainly of people from South America, Africa and Eastern Europe. They have little in common, except for the reason for their migration.
Educational Policies
Educational policies towards immigrants in the Netherlands have a short history and in their comparatively short period of existence they have repeatedly been subject to change. Eldering (1989) recognizes three distinct phases: a. The period before 1980 was characterized by a so-called two-track approach. The government assumed that the children of immigrant workers would stay only temporarily. In consequence, efforts were directed simultaneously towards the integration of children into the Dutch education system and the preparation for their return to their home country. In classroom practice this meant that these children received instruction in their home language besides extra tuition in Dutch. b. Around 1980 the government abandoned the idea that the immigrants would return to their home country; from then on, education was to prepare immigrants for their role in Dutch society by enabling them to participate socio-economically, socially, and democratically as full members of that society and to do so from their own cultural background. Educational policies were designed that were specifically targeted at cultural minority groups. This meant, among other things, that schools with immigrant pupils received extra facilities. In addition to these policies towards cultural minorities, there was a separate "social priority policy programme" which aimed at improving the opportunities of Dutch working-class children. c. The final phase, from 1985 to the present, has seen the educational priority policy programme (OVB) taking effect. In the OVB, policies towards cultural minorities and the social priority policy programme have been integrated. The underlying idea is that immigrant pupils and Dutch working-class children have comparable disadvantages and that the causes of their disadvantages are very similar. For instance, it is argued that both groups are often found to live in the same neighbourhoods in large cities, they attend the same schools and their parents are in the same socio-economic position. Through the OVB it is attempted to eliminate or to reduce these pupils' disadvantages. In the practical implementation of the OVB, two main components can be distinguished: the areas component and the staff establishment component. "Areas" are educational priority areas in which a cumulation of disadvantaging factors produces a high rate of educational deprivation and in which primary schools, secondary schools and welfare institutions (e.g., libraries, day nurseries) cooperate at the local or regional level to combat disadvantages. The staff establishment component will be discussed below.

The Staff Establishment Component of the OVB
Educational Opportunities 267
Under the staff establishment component of the OVB the number of staff that is allocated to a primary school is related to the socio-economic and ethnic composition of the school population. In concrete terms this means that schools with a high proportion of disadvantaged pupils are allocated more teachers. Disadvantaged pupils are classified into a number of categories. These categories were established in 1984, partly in response to the findings of a study into the relationship between family characteristics and pupils' position in education (Mens, 1984). On the basis of the budget available for the OVB, a "weighting" was subsequently assigned to each category. This way, pupils with serious disadvantages are given a higher weighting than pupils with less serious disadvantages or without disadvantages. As the number of staff to which a school is entitled is calculated on the basis of these weightings, this means in practice that schools with many disadvantaged pupils are able to appoint more teachers. For the pupils concerned this often means that they are placed in relatively small classes in which teachers can give them more individual attention.
The following family characteristics are important for the classification of pupils into different categories:
the educational level of the father; - the educational level of the mother; - the occupational level of the breadwinner; - the ethnic origin of the parents. The main categories that have been defined on the basis of combinations of these factors
Pupils from a particular ethnic background of whom at least one parent has a low educational or occupational level; these pupils are assigned a 1.90 weighting.
- Pupils of whom the parents have a low educational or occupational level, but who do not have an ethnic minority background. These are the so-called working-class children; they are given a 1.25 weighting.
- Other pupils, i.e., pupils whose parents do not have a poor educational or occupational level; these pupils are given a 1.00 weighting.
Up-to-date figures on the exact distribution of primary school pupils among these categories are lacking. It is possible, however, to make the following rough estimate on the basis of a study that has been conducted as part of the evaluation of the OVB (Tesser, Mulder & Van der Werf, 1991):
1.00 pupils: 52 % 1.25 pupils: 39 % 1.90 pupils: 9 %.
The three largest groups of 1.90 pupils are Surinamese and Antillean pupils, Turkish pupils and Moroccan pupils. The percentages above suggest that the proportion of pupils who are considered to be disadvantaged is incredibly large: in all, nearly half of all pupils. Therefore, one can justifiably ask whether the criteria that are applied to classify pupils are still appropriate.
a r e :

268 G. W. J. M. Driessen
The Position of Immigrant Pupils in Education
Research into the position of immigrant pupils in the Dutch education system did not really start in earnest until the early 1980s. One reason for this is that before that time the government assumed that the presence of immigrants in the Netherlands would only be temporary. It was believed that the educational problems of immigrants would disappear automatically when they returned to their home country. They stayed, however, and the problems only increased. In a recent study, stock has been taken of the ten years of research into the position of immigrant pupils in education (Driessen, 1990a). On the basis of that study, the following conclusions can be drawn: - Within the population of immigrant pupils it is possible to rank-order distinct ethnic
groups by their position in education. Southern European children (Spaniards, Italians, etc.) come first, followed by children from the former colonies and finally, at a large distance, Turks and Moroccans.
- Test results and teacher assessments show that the achievement levels of immigrant pupils are lower than those of their Dutch classmates. The difference is particularly noticeable in verbal performance.
- Upon completion of primary education, immigrant pupils transfer to the lower levels of secondary education, the majority enrolling in junior secondary vocational education. Immigrant pupils and students are strongly underrepresented in senior secondary vocational education, higher vocational education and university education. Truancy rates are relatively high among Turkish and Moroccan girls. There are indications that immigrant secondary school pupils are more likely to take "easy" options and lower-level courses, which reduces their chances of finding employment. Immigrant pupils are more likely to repeat a year. Immigrant pupils are considerably more likely to be older than the average age of their class; these pupils achieve below their age level. There are indications that the position of immigrant pupils is gradually improving. Already some groups (e.g., Chinese and Greeks) are achieving on a par with Dutch pupils. Other groups however (e.g., Turks and Moroccans), clearly still have a long way to go.
Social Background or Ethnic Origin?
Few people would deny that immigrant pupils find themselves in a considerably worse position in education than Dutch pupils. However, there is less consensus about the relative weight of the factors that should be held responsible for these differences. The debate on this issue which has raged during the past few years has concenlrated mainly on the factors of "social background" and "ethnic origin", which have been given explicit attention in several studies.
De Jong (1987) concludes on the basis of his study of primary school pupils that the relationship between IQ and socio-economic status is slightly stronger than that between IQ and ethnic origin. As regards the type of secondary school recommended at the end of primary education and the level of education attained after two years of secondary
Educational Opportunities 269
education, it appears that these factors are weakly connected with ethnic origin, while there is a considerably stronger connection with social background.
The study conducted by Kerkhoff (1988) focuses on the language achievements of primary school pupils. Kerkhoff comes to the conclusion that language background does not play a decisive role in the educational opportunities of children from ethnic minority backgrounds; the discrepancies found between different groups of pupils seem to be connected rather with differences in social background.
Tesser, Van der Werf & Mulder (1989a) use a path-analytical explanatory model to explore the connections between the recommendation received at the end of primary education and the country of origin, the father's education and occupation. The father's education turns out to be the central variable in this model; ethnic origin and occupation do not play a significant independent role.
Driessen (1990b) considers in his analyses the test scores on Dutch language tests and mathematics of pupils in the final primary school year and the level of secondary education which they attend one year later. He concludes that the influence of ethnic origin, as compared with that of social background, is not relevant. In other words: there are no differences between immigrant pupils and Dutch pupils from a comparable socio- economic background in respect of test results or the type of secondary school to which they eventually transfer.
In a recent report, Tesser, Mulder & Van der Werf (1991) show that ethnic origin does have an additional effect--even a strong effect. Their analyses show that the additional percentage of variance in Secondary school language achievement levels explained by ethnic origin is almost as large as the percentage of variance explained by the father's education, the mother's education and the father's occupation together. The additional percentage of variance in maths achievement levels explained by ethnic origin amounts to about half of the percentage accounted for by social background characteristics. However, further analyses reveal that if the type of secondary school recommended at the end of primary education is taken as the dependent variable, the effect of ethnic origin disappears.
Summarizing the results of the studies discussed above, it can be concluded that social background seems to have a stronger effect on differences in aspects of the position in education of different groups of pupils than ethnic origin; however, it is possible that an ethnic minority background reinforces the negative effect of a lower-class family environment.
The studies on which these conclusions are based virtually all focus on primary education. It is not clear, however, to what extent these conclusions also hold for secondary education. In the context of the national evaluation of the OVB, data have recently been collected on pupils, their socio-economic and ethnic background and aspects of their position in secondary education. With the help of these data it is possible to gain a better understanding of the relative importance of socio-economic and ethnic family characteristics.
Method
Data and Variables
The study (Driessen & Van der Weft, 1992b) involved 19,524 first-year pupils from 381 secondary schools. Due to sensitivities that appear to play a role in the collection

270 G. W. J. M. Driessen
of information on family characteristics, data on pupils' ethnic origin are available for only 16,356 pupils. Analyses show, however, that in scores on the independent variables no relevant differences exist between pupils for whom this information is available and pupils for whom it is not available. It also appears that on relevant characteristics no differences exist between the pupils and the schools in the sample and the entire population. One exception must be made: the city of Amsterdam is slightly underrepresented and--probably as a consequence of this--the percentage of immigrant pupils in the sample is slightly below that of the entire population (Driessen & Van der Werf, 1992a). Pupils and their parents, teachers and management staff of the schools that participated supplied information on family, pupil and educational characteristics. In addition, the pupils did several achievement tests. The data were collected halfway the 1989/1990 school year.
The variables relevant for the research problem set out above were operationalized in the following manner.
Pupils' ethnic origin was determined on the basis of the native country of the parents. If one of the parents was born outside the Netherlands, the pupil was regarded as having a non-Dutch background. The following categories were distinguished: (1) Morocco, (2) Turkey, (3) former colonies, (4) other OVB, (5) other non-Dutch (6) Netherlands. The first three categories are the three largest categories defined under the OVB. The fourth category--other OVB--consists of countries such as Spain, Italy and Yugoslavia. The category "former colonies" comprises Surinamese, Antillean and Moluccan pupils. The category "other non-Dutch" consists of countries that are not regarded as target groups in the OVB, e.g., Belgium, Germany and Great Britain.
Social background was operationalized through questions on the parents' educational and occupational level. As regards level of education, the highest level of education completed was taken into account in the analyses. The following classification was used: (1) no primary education, (2) primary education, (3) lower secondary education, (4) upper secondary education, (5) higher education, first phase, (6) higher education, second phase. The educational level of both the father and the mother was included in the analyses. The parents' occupational level was classified into six categories, which can roughly be labelled as follows: (1) non-working persons, (2) manual workers, (3) heads of a company (especially in the agricultural sector), (4) low-level employees and heads of a company (outside the agricultural sector), (5) intermediate-level employees, (6) senior employees. The highest occupational level within the family was considered in the analyses.
Pupils' achievement levels were ascertained with the help of a specially designed test which was based on an existing test (the Entry test developed by the National Institute for Educational Measurement, CITO). The test comprises three subtests: Dutch language, mathematics and information processing. Each subtest consists of 20 items, so the total number of items was 60. The scores were eventually converted into standardized scores with a mean of 50 and a standard deviation of 10.
Nine categories were used to classify pupils' secondary school recommendation, i.e., the recommendation they received at the end of primary education with regard to the most suitable type of secondary school: 1(1) IBO (individualized secondary vocational education), (2) IBO/LBO (IBO/junior secondary vocational education), (3) LBO, (4) LBO/MAVO (LBO/junior general secondary education), (5) MAVO, (6) MAVO/HAVO (MAVO/senior general secondary education), (7) HAVO, (8) HAVO/VWO (HAVO/pre- university education), (9) VWO. Double categories (e.g., IBO/LBO) refer to a situation in
Educational Opportunities 271
which pupils do not have to make a definitive choice for either of the two types of education until they have completed their first year in secondary school.
School choice was defined as the level of secondary education on which pupils actually are in the first secondary school year, i.e., at the moment the study was conducted. The following levels were distinguished: (1) IBO, (2) LBO, (3) LBO/MAVO, (4) MAVO, (5) MAVO/HAVO/VWO, (6) HAVO/VWO, (7) VWO.
Secondary School Recommendation, Secondary School Choice, and Test Performance
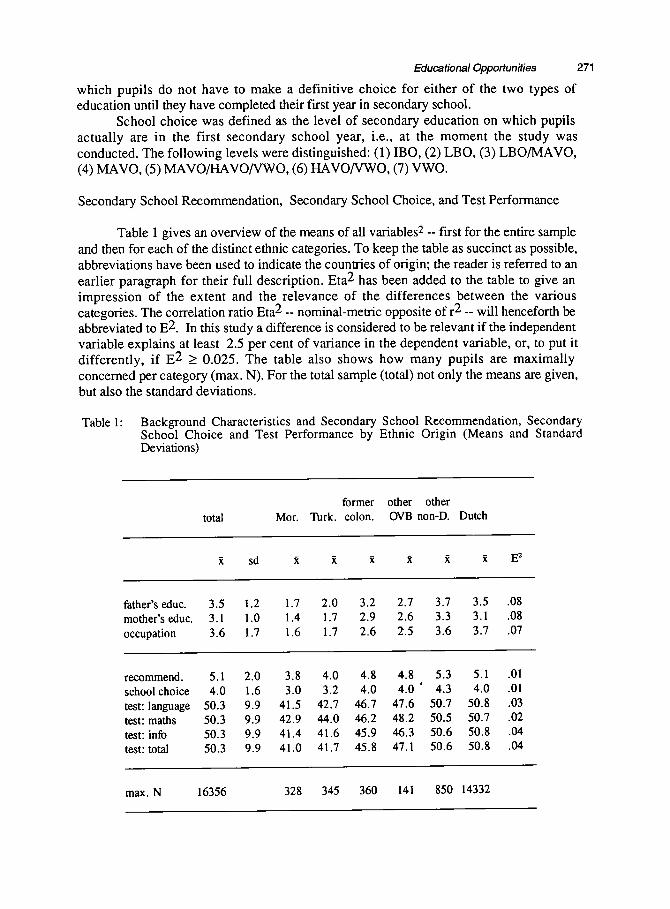
Table 1 gives an overview of the means of all variables 2 -- first for the entire sample and then for each of the distinct ethnic categories. To keep the table as succinct as possible, abbreviations have been used to indicate the countries of origin; the reader is referred to an earlier paragraph for their full description. Eta 2 has been added to the table to give an impression of the extent and the relevance of the differences between the various categories. The correlation ratio Eta 2 -- nominal-metric opposite of r 2 -- will henceforth be abbreviated to E 2. In this study a difference is considered to be relevant if the independent variable explains at least 2.5 per cent of variance in the dependent variable, or, to put it differently, if E 2 > 0.025. The table also shows how many pupils are maximally concerned per category (max. N). For the total sample (total) not only the means are given, but also the standard deviations.
Table 1: Background Characteristics and Secondary School Recommendation, Secondary School Choice and Test Performance by Ethnic Origin (Means and Standard Deviations)
former other other total Mor. Turk. colon. OVB non-D. Dutch
sd ~ ~ ~ i ~ ~ E 2
father's educ. 3.5 1.2 1.7 2.0 3.2 2.7 3.7 3.5 .08 mother's educ. 3.1 1.0 1.4 1.7 2.9 2.6 3.3 3.1 .08 occupation 3.6 1.7 1.6 1.7 2.6 2'.5 3.6 3.7 .07
recommend. 5.1 2.0 3.8 4.0 4.8 4.8 5.3 5.1 .01 school choice 4.0 1.6 3.0 3.2 4.0 4.0 ' 4.3 4.0 .01 test: language 50.3 9.9 41.5 42.7 46.7 47.6 50.7 50.8 .03 test: maths 50.3 9.9 42.9 44.0 46.2 48.2 50.5 50.7 .02 test: info 50.3 9.9 41.4 41.6 45.9 46.3 50.6 50.8 .04 test: total 50.3 9.9 41.0 41.7 45.8 47.1 50.6 50.8 .04
max. N 16356 328 345 360 141 850 14332

272 G. W. J. M. Driessen
The table shows that there are clear differences between immigrants and Dutch pupils in respect of their socio-economic background characteristics. Apart from that, there are differences within each ethnic category between the fathers' and the mothers' levels of education. The educational and occupational levels of Moroccan and Turkish parents are the lowest: more than one standard deviation below those of Dutch parents. On average, Moroccan and Turkish parents have not been educated beyond the primary school level. For many of them -- especially the mothers -- this means that they are illiterate, both in their own language and in Dutch. Dutch parents have on average completed at least lower secondary education. The educational level of the category "other non-Dutch" is comparable to that of Dutch parents. It is striking that people from the former colonies have a relatively high level of education, but nevertheless find themselves in low occupational categories. Further analyses show that this is due to the fact that a large proportion of them (42 per cent) do not work. Incidentally, for Moroccans and Turks this percentage is even higher: 60 and 53 per cent, respectively. In the Dutch category only 10 per cent do not work.
From the lower part of the table it appears that, in spite of the relatively low E 2 values, wide differences exist between immigrants and Dutch pupils in respect of several aspects of their position in education. For instance, the type of secondary school recommended to Dutch pupils is on average one level higher than that recommended to Moroccan and Turkish pupils. As these recommendations are generally followed, the type of secondary school to which Dutch pupils transfer is also one level higher. Also remarkable in this part of the table is that "other non-Dutch" pupils receive a recommendation for, and transfer to, a relatively high level of secondary education--higher than that of Dutch pupils. The upper part of the table indicates that the mean educational and occupational level of the parents of these children is higher than that of Dutch parents. Particularly large differences occur in pupils' test performance levels. The difference between Moroccans and Turks on the one hand and Dutch pupils on the other amounts to nearly one standard deviation.
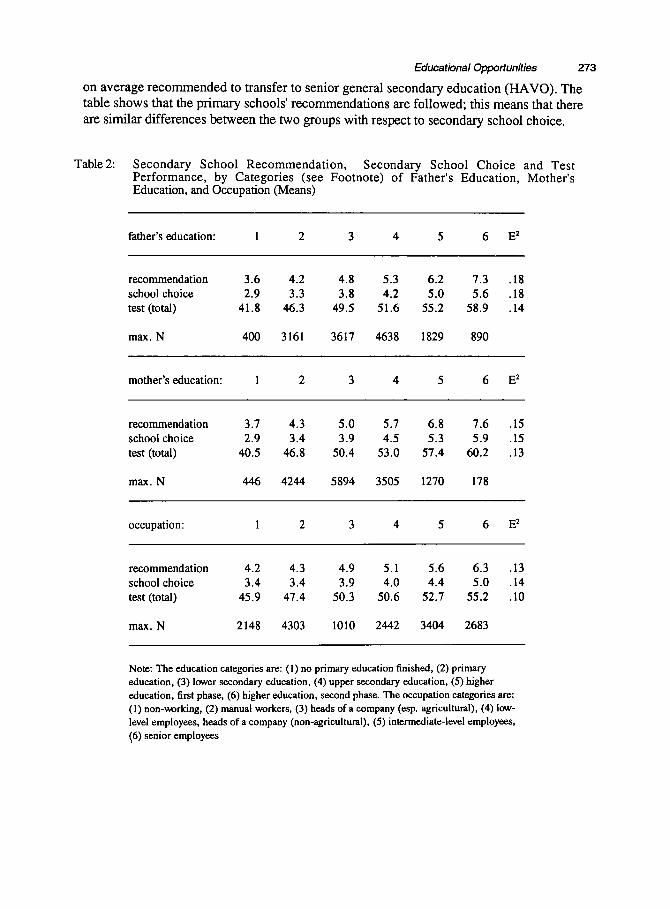
Following the overview of scores by ethnic origin presented in Table 1, Table 2 shows mean scores on secondary school recommendation, secondary school choice and test performance by socio-economic background characteristics. The test results that are given are total scores. The different educational and occupational categories are indicated by a number; the higher the number, the higher the educational or occupational level of the parents. For a full description of these categories the reader is referred to the note at the foot of the table. Total mean scores and standard deviations are not shown, as these have already been given in Table 1.
The table clearly shows that there is a direct relation between, on the one hand, secondary school recommendation, secondary school choice and test performance and, on the other, the parents' educational and occupational level. In fact, all these relationships are linear (E - r 2 <.01), which incidentally also holds for the relationships between these variables and ethnic origin. In other words: the higher the educational and occupational level of the parents, the higher the level of secondary education recommended and chosen, and the higher the children's level of test performance. The following two examples will serve to give an impression of the differences that exist: children of parents who did not complete primary education are on average recommended to transfer to junior secondary vocational education (LBO); children of parents with a university education are
Educational Opportunities 273
on average recommended to transfer to senior general secondary education (HAVO). The table shows that the primary schools' recommendations are followed; this means that there are similar differences between the two groups with respect to secondary school choice.
Table 2: Secondary School Recommendat ion, Secondary School Choice and Test Performance, by Categories (see Footnote) of Father's Education, Mother's Education, and Occupation (Means)
father's education: 1 2 3 4 5 6 E 2
recommendation 3.6 4.2 4.8 5.3 6.2 7.3 .18 school choice 2.9 3.3 3.8 4.2 5.0 5.6 .18 test (total) 41.8 46.3 49.5 51.6 55.2 58.9 .14
max. N 400 3161 3617 4638 1829 890
mother's education: 1 2 3 4 5 6 E 2
recommendation 3.7 4.3 5.0 5.7 6.8 7.6 .15 school choice 2.9 3.4 3.9 4.5 5.3 5.9 .15 test (total) 40.5 46.8 50.4 53.0 57.4 60.2 .13
max. N 446 4244 5894 3505 1270 178
occup~ion: 1 2 3 4 5 6 E 2
recommendation 4.2 4.3 4.9 5.1 5.6 6.3 .13 school choice 3.4 3.4 3.9 4.0 4.4 5.0 .14 test (total) 45.9 47.4 50.3 50.6 52.7 55.2 .10
max. N 2148 4303 1010 2442 3404 2683
Note: The education categories are: (1) no primary education finished, (2) primary education, (3) lower secondary education, (4) upper secondary education, (5) higher education, first phase, (6) higher education, second phase. The occupation categories are: (1) non-working, (2) manual workers, (3) heads of a company (esp. agricultural), (4) low- level employees, heads of a company (non-agricultural), (5) intermediate-level employees, (6) senior employees
274 G. W. J. M. Driessen
As regards test performance, a difference of nearly 20 points, or almost two standard deviations, exists between the performance levels of children from parents with the highest level of education and children from parents with the lowest level of education. The table also shows that the differences among the distinct categories of parental level of education are larger than those between the occupational categories.
Social Background or Ethnic Origin?
Various analytical techniques were used to determine which of the two variables of social background and ethnic origin plays the most important role in explaining differences in the three aspects of pupils' position in education here considered. Below follows a discussion of the findings with regard to, respectively, secondary school recommendation, secondary school choice and test performance.
First, one-way analyses of variance were performed. Within each category of parental level of education and level of occupation, the secondary school recommendations given to immigrant pupils were compared with those given to Dutch pupils. Two different classifications were used: a dichotomy--all Dutch pupils versus all non-Dutch pupils--and a classification in which besides the group of Dutch pupils five subgroups of immigrant pupils were distinguished. In these analyses, too, a difference between groups was considered relevant if at least 2.5 per cent of variance was explained.
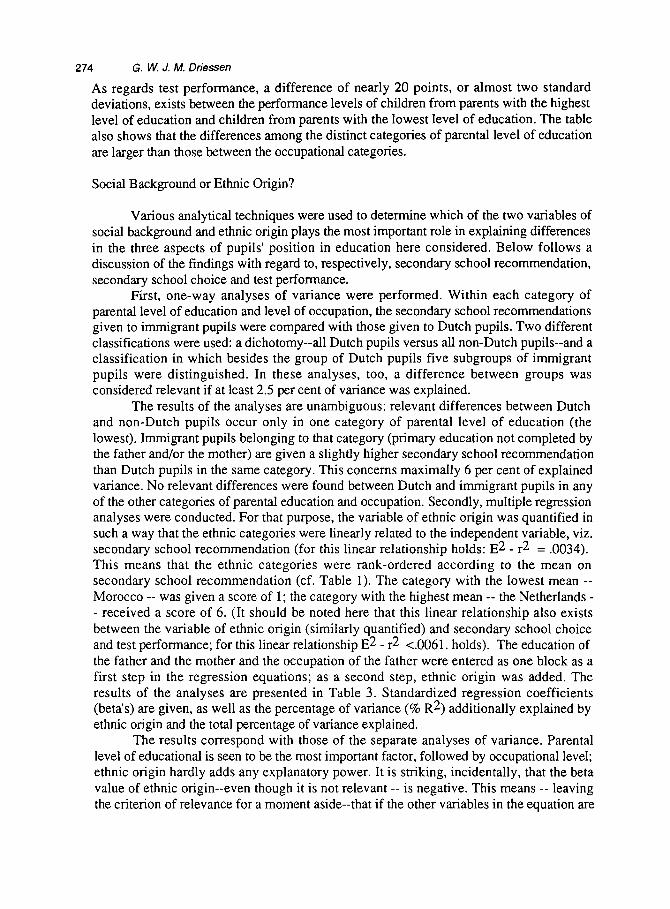
The results of the analyses are unambiguous: relevant differences between Dutch and non-Dutch pupils occur only in one category of parental level of education (the lowest). Immigrant pupils belonging to that category (primary education not completed by the father and/or the mother) are given a slightly higher secondary school recommendation than Dutch pupils in the same category. This concerns maximally 6 per cent of explained variance. No relevant differences were found between Dutch and immigrant pupils in any of the other categories of parental education and occupation. Secondly, multiple regression analyses were conducted. For that purpose, the variable of ethnic origin was quantified in such a way that the ethnic categories were linearly related to the independent variable, viz. secondary school recommendation (for this linear relationship holds: E 2 - r 2 = .0034). This means that the ethnic categories were rank-ordered according to the mean on secondary school recommendation (cf. Table 1). The category with the lowest mean -- Morocco -- was given a score of 1; the category with the highest mean -- the Netherlands - - received a score of 6. (It should be noted here that this linear relationship also exists between the variable of ethnic origin (similarly quantified) and secondary school choice and test performance; for this linear relationship E 2 - r 2 <.0061. holds). The education of the father and the mother and the occupation of the father were entered as one block as a first step in the regression equations; as a second step, ethnic origin was added. The results of the analyses are presented in Table 3. Standardized regression coefficients (beta's) are given, as well as the percentage of variance (% R 2) additionally explained by ethnic origin and the total percentage of variance explained.
The results correspond with those of the separate analyses of variance. Parental level of educational is seen to be the most important factor, followed by occupational level; ethnic origin hardly adds any explanatory power. It is striking, incidentally, that the beta value of ethnic origin--even though it is not relevant -- is negative. This means -- leaving the criterion of relevance for a moment aside--that if the other variables in the equation are
Educational Opportunities 275
kept constant, immigrant pupils are given a higher secondary school recommendation -- i.e. are advised to transfer to a higher level of secondary education -- than Dutch pupils.
Table 3: Regressions of Secondary School Recommendation on Social and Ethnic Backgroun Characteristics (Beta's and Per Cent of Variance Explained)
education ethnic father mother occup, origin
background add. total characteristics I~ I! ll Ii % R 2 % R 2
(a) social .23 .20 .14 21.8 (b) social + ethnic .23 .21 .14 -.04 .2 22.0
This may be connected with a phenomenon that has been labelled "over-recommendation" or "positive discrimination in favour of immigrants" in the literature (De Jong, 1987; Driessen, 1991).
In order to find out what happens if, instead of parental education and occupation, ethnic origin is first entered into the equation, the analysis was repeated. The question now is: how much of the differences in test scores is explained by parental education and occupation, after the effect of ethnic origin has already been eliminated? The results of the analysis differ little from those presented above: ethnic origin explains 1.1 per cent of variance; the percentage additionally explained by parental education and occupation is 20.9.
Since methodological objections might be raised against the way in which the variable of ethnic origin was constructed, yet another approach was taken. The problem here referred to concerns the possible contamination of the dependent variable "secondary school recommendation" by the independent variable "ethnic origin". After all, the latter variable was quantified on the basis of the rank ordering of the countries of origin by the level of secondary education recommended. This means that the recommendations are in fact part of the variable ethnic origin. To eliminate this problem, use was made of so-called dummies. This means that the one variable of ethnic origin was decomposed into several new variables -- one per category. Given the numbers involved, five categories were formed: (1) Dutch, (2) pupils from former colonies, (3) Moroccans and Turks, (4) other OVB target group pupils, (5) other non-Dutch pupils. Subsequently, the regression analyses were repeated. The dependent variable, i.e., the one to be explained, was "secondary school recommendation"; as independent, explanatory variables the block consisting of parental education and occupation was first entered into the equation, followed by four of the five ethnic categories -- the category of Dutch pupils functioning as a reference group. Again, the results of the analyses confirm what was found earlier via a different way, viz. that the effect of ethnic origin is virtually non-existent after the effect of social origin has been controlled for. The standardized regression coefficients of the four dummies of country of origin are maximally .04, whereas the coefficients for parental education and occupation have the same value as in Table 3. In terms of percentages of

276 G. W. J. M. Driessen
explained variance this means that the social characteristics explain 21.8 per cent and that ethnic origin additionally explains no more than .2 per cent. When the order in which the variables are entered into the equation is reversed, i.e. first the dummies for ethnic origin and then the social characteristics, ethnic origin explains 1.5 per cent and the social characteristics add 20.6 per cent. (Incidentally, this result not only confirms earlier findings; it also shows the appropriateness of the method that was followed, as replacing one quantified, metrically defined ethnic background variable by dummies for ethnic background appears to yield exactly the same results.)
The above described analyses which used secondary school recommendation as the dependent variable were repeated using secondary school choice and test performance as dependent variables. As the procedures as well as the findings were very similar, a brief description will suffice.
As regards school choice, the analyses of variance show that only slight differences (E 2 =.03) exist among ethnic groups in the lowest category of parental education, i.e., primary education not completed.
The results of the regression analyses are given in Table 4, which presents the standardized regression coefficients, the percentage of variance additionally explained by ethnic origin and the total percentage of variance explained.
Table4: Regressions of Secondary School Choice on Social and Ethnic Background Characteristics (Beta's and Per Cent of Variance Explained)
education ethnic father mother occup, origin
background add. total characteristics fl lI II g % R 2 % R 2
(a) social .23 .19 .15 22.4 (b) social + ethnic .24 .20 .16 -.06 .3 22.7
The standardized regression coefficients and the percentages of explained variance in Table 4 are virtually identical with those in Table 3, which deals with "secondary school recommendation" as the dependent variable. Similarly, the results are hardly affected when dummies are used for ethnic origin or when the order in which the independent variables are entered into the equation is reversed.
The results of the analyses of variance in respect of pupils' test performance are also unambiguous: relevant differences between Dutch and non-Dutch pupils appear only in one occupational category -- the lowest, i.e., the head of the family is unemployed. This concerns maximally 7 per cent of explained variance.
Subsequently, regression analyses were performed. Table 5 presents the results of these analyses. Standardized regression coefficients are given, as well as the percentages of variance additionally explained by ethnic origin and the total percentages of variance explained.

Table 5:
Educational Opportunities 277
Regressions of Test Scores on Social and Ethnic Background Characteristics (Beta's and Per Cent of Variance Explained)
education ethnic father mother occup, origin
(sub-) background I~ 6 I~ 6 add. total test characteristics % R 2 % R 2
total (a) social (b) social + ethnic
language (a) social (b) social + ethnic
maths (a) social (b) social + ethnic
info (a) social (b) social + ethnic
19 .20 .11 18.0 19 .19 .10 .07 .4 18.4 17 .17 .10 13.4 16 .16 .09 .07 .4 13.9 16 .18 .10 13.4 16 .17 .10 .04 .2 13.5 18 .19 .10 15.6 17 .18 .09 .08 .5 16.1
It appears that, after controlling for social background characteristics, ethnic origin hardly adds to the explanation of differences in test performance. The figures in the column "add. % R 2" show that the amount of variance additionally explained by ethnic origin is maximally .5 per cent. This is true for each of the three subtests. Comparison of the standardized regression coefficients reveals that the mother's level of education has the strongest predictive power, followed by the father's level of education; the relative contribution of occupation and ethnic origin is very slight.
When ethnic origin is entered into the equation before parental education and occupation, the results change little: ethnic origin explains 3.7 per cent of variance and parental education and occupation adds 14.7 per cent. Again, social characteristics are found to be of considerably greater importance than ethnic origin.
Using dummies for ethnic origin does not alter these findings. The standardized regression coefficients of the four dummies for country of origin are maximally .05, whereas the coefficients for parental education and occupation are of the same level as those in Table 5. In terms of amounts of variance explained this means that the social characteristics explain 18.0 per cent, while ethnic origin adds no more than .5 per cent. When the order in which the variables are entered into the equation is reversed, i.e., the ethnic origin dummies first and then the social characteristics, ethnic origin explains 3.9 per cent, while the social characteristics account for an additional 14.6 per cent.
After this elaborate discussion, the question is: How can the big difference between the findings presented above and those of Tesser et al. (1991) be explained? The fact that the findings differ only in respect of levels of test performance -- not in respect of secondary school recommendation -- suggests that the cause of this difference should be sought in the difficulty level of the tests. Indeed, Tesser et al. report larger differences between, for instance, Moroccans and Turks on the one hand and Dutch pupils on the other. The wider range in test performance levels implies stronger correlations between
278 G. W. J. M. Dries,sen
performance levels and ethnic origin, which is probably why ethnic origin assimilates more explanatory power. Another cause may be that the sample used by Tesser et al. is not representative for the entire population: immigrant pupils are overrepresented which might explain why the ethnic factor gets more weight in the regression analyses.
Discussion
The results of the analyses show that the influence of ethnic origin, as compared with that of social background, is not relevant. In other words: immigrant pupils and native Dutch pupils from comparable socio-economic backgrounds do not differ in respect of the type of secondary school to which they are advised to transfer at the end of primary education, the type of secondary school they choose, and their levels of test performance. This means that the findings from previous research conducted in the primary education sector (De Jong, 1987; Kerkhoff, 1988; Tesser et al., 1989a; Driessen, 1990b) also hold for secondary education. The fact that Tesser et al. (1991) obtained different findings on pupils' test scores can possibly be explained by differences in the difficulty level of the tests and the overrepresentation of immigrant pupils in their sample.
A remark is in order here put the findings in their proper perspective: the findings of the present study do not mean that immigrant pupils as a group perform on a par with native Dutch pupils. The very fact that immigrant parents are concentrated in the lowest educational and occupational categories means that at the end of primary school their children receive recommendations for the lowest levels of secondary education, that they subsequently transfer to these types of school and that they attain the lowest test scores. From this perspective, one could argue that educational opportunities are not solely determined by the educational level of the parents; it would be equally just to say that educational disadvantage is to a large extent an ethnic phenomenon.
The findings have consequences for the OVB. So far, target groups of the OVB have been classified on the basis of four indicators: educational level of the father and the mother, occupational level of the head of the family and ethnic origin. The analyses clearly show that there is no need for more than one or, at the most, two indicators for this purpose: the educational level of the father and, less importantly, the educational level of the mother. This would simplify the present system considerably, both for schools and for the Ministry of Education. Moreover, and this is not less important, it would lead to a more valid distribution of the resources that are allocated under the staff establishment component of the OVB.
l .
2.
Notes
A glossary of the acronyms used can be found at the end of this article. One of the principles in school career research is that types of secondary education can be distinguished by level or degree of difficulty. Although, strictly speaking, this gives the concept of educational level an ordinal character, it is nonetheless customary to consider this variable as being of interval level and to use the statistic analysis techniques allowed for that level (Blok & Saris, 1980).
Acknowledgements
Educational Opportunities 279
The presented research results were obtained on the basis of data collected and made available by the Netherlands Central Bureau of Statistics (CBS).
The study on which this article is based was supported by a grant from the Institute for Educational Research in the Netherlands (SVO) in The Hague. The text was translated by C.N. Broekhof, SVO, The Hague.
References
Blok, H., & Saris, W. (1980). Relevante variabelen bij het doorverwijzen na de lagere school; een structureel model [Relevant variables in the transition from primary to secondary education: a structural model]. Tijdschrift voor Onderwijsresearch, 5, 63-79.
De Jong, M.-J. (1987). Origins, knowledge and opportunities. Immigrant and Dutch children during the transition from primary to secondary education (English summary). Lisse: Swets & Zeitlinger.
Driessen, G. (1990a). The educational attainments of non-indigenous pupils. The role of socio-economic and ethnic-cultural factors, with special attention to the Teaching of Migrant Language and Culture (English summary). Nijmegen: ITS.
Driessen, G. (1990b). Socio-economic milieu and ethnic origin as an explanation of differences in educational attainments (English summary). Pedagogisch Tijdschrift, 6, 349-357.
Driessen, G. (1991). Discrepancies between test results and level of transfer. Positive discrimination during the transition from primary to secondary education? (English summary). Pedagogische Studi~n, 1, 27-35.
Driessen, G., & Van der Weft, G. (1992a). Hetfunctioneren van het voortgezet onderwijs. Beschrijving steekproefen psychometrische kwaliteit instrumenten. [The functioning of the secondary education system. Sample and instruments]. Groningen/Nijmegen: RIONflTS.
Driessen, G., & Van der Weft, G. (1992b). Het functioneren van her voortgezet onderwijs. De positie van leerlingen in het eerste leerjaar. [The functioning of the secondary education system. The position of pupils in the first year]. Nijmegen/Groningen: ITS/RION.
Eldering, L. (1989). Ethnic minority children in Dutch schools: underachievement and its explanations. In L. Eldering, & J. 'Kloprogge (Eds.), Different cultures, same school. Ethnic minority children in Europe (pp. 107-136). Amsterdam/Lisse/Berwyn: Swets & Zeitlinger.
Kerkhoff, A. (1988). Language proficiency and school achievement. The relationship between Dutch language proficiency and school achievement of indigenous and non-indigenous children at the end ofprimary school (English summary). Amsterdam/Lisse: Swets & Zeitlinger.
Kloprogge, J. (1989). The evaluation of the new Dutch national education priority programme. Studies in Educational Evaluation, 15, 207-218.
Mens, A. (1984). Een studie naar een criterium ten behoeve van her onderwijsvoorrangsbeleid [A study of a criterion for the educational priority policy programme]. Nijmegen: ITS.
280 G. W. J. M. Dries, sen
Netherlands Central Bureau of Statistics (1991). SchooUoopbaan en achtergrond van leerlingen. Deel 1; cohort 1989, instroom. [School career and background of pupils, cohort 1989]. 's-Gravenhage: SDU/Uitgeverij / CBS-publikaties.
Tesser, P., Van der Weft, G. & Mulder, L. (1989a). Het onderwijsvoorrangsbeleid en de onderwijskansen van etnische groepen [Educational priority policy and educational opportunities of non-indigenous groups]. Paper presented at the Onderwijsresearchdagen 1989, Leiden. Nijmegen, ITS.
Tesser, P., Van der Weft, G., Mulder, L. & Weide, M. (1989b). De beginfase van het Voorrangsbeleid in het Basisonderwijs. Verslag van het ori~nterend onderzoek van de landelijke OVB-evaluatie [The initial phase of the educational priority policy programme in primary education. Report of the preliminary study for the national evaluation of the OVB]. Nijmegen/Groningen, ITS/RION.
Tesser, P., Mulder, L. & Van der Weft, G. (1991). De eerste fase van de longitudinale OVB- onderzoeken. Het leerlingenonderzoek [The first stage of the longitudinal OVB studies: the pupils]. NijmegergGroningen: ITS/RION.
CBS
CITO
HAVO
IBO
ITS
LBO
MAVO
OVB
SVO
VWO
Glossary
Netherlands Central Bureau of Statistics (Centraal Bureau voor de Statistiek)
National Institute for Educational Measurement (Centraal Instituut voor Toetsontwikkeling)
Senior general secondary education (hoger algemeen voortgezet onderwijs)
Individualized secondary vocational education (individueel beroepsonderwijs)
Institute for Applied Social Sciences (Instituut voor ~Toegepaste Sociale Wetenschappen)
Junior secondary vocational education (lager beroepsonderwijs)
Junior general secondary education (middelbaar algemeen voortgezet onderwijs)
Educational priority policy programme (Onderwijsvoorrangsbeleid)
Institute for Educational Research in the Netherlands (Instituut voor Onderzoek van bet Onderwijs)
Pre-university education (voorbereidend wetenschappelijk onderwijs)
The Author
GEERT W.J.M. DRIESSEN is an educational researcher at the Institute for Applied Social Sciences (ITS) at the Catholic University of Nijmegen, the Netherlands. His major research interests are: first and second language acquisition; teaching of migrant language and culture, and the position of non-indigenous pupils in education.