geant4-based simulation study of pep-ii beam backgrounds in the babar detector at the slac b-factory...
TRANSCRIPT

GEANT4-BASED SIMULATION STUDY OF PEP-II BEAM BACKGROUNDS IN GEANT4-BASED SIMULATION STUDY OF PEP-II BEAM BACKGROUNDS IN THE BABAR DETECTOR AT THE SLAC B-FACTORYTHE BABAR DETECTOR AT THE SLAC B-FACTORY
GEANT4-BASED SIMULATION STUDY OF PEP-II BEAM BACKGROUNDS IN GEANT4-BASED SIMULATION STUDY OF PEP-II BEAM BACKGROUNDS IN THE BABAR DETECTOR AT THE SLAC B-FACTORYTHE BABAR DETECTOR AT THE SLAC B-FACTORY
W. S. Lockman, SCIPP, University of California, Santa Cruz, California 95064, USAW. Kozanecki, CEA/DSM/DAPNIA, 91991 Gif-sur-Yvette, France
B. Campbell, S. H. Robertson, McGill University, Montreal H3A 2T8, Quebec, CanadaM. Bondioli†, G. Calderini, INFN-Pisa, I-56127 Pisa, Italy
N. Barlow, C. L. Edgar, Manchester University, Manchester M13 9PL, United KingdomD. Aston, G. Bower, M. Cristinziani, T. Fieguth, D. H. Wright, SLAC, Menlo Park, CA 94025, USA
B. A. Petersen, Stanford University, Stanford, CA 94305, USAN. L. Blount, D. Strom, University of Oregon, Eugene, OR 97403, USA
WPAE056
ABSTRACTTo improve the understanding of accelerator-induced backgrounds at the SLAC B-Factory,
we simulate lost particle backgrounds in the BABAR detector originating from beam-gas interactions and radiative Bhabha scatters. We have extended the GEANT4-based BABAR detector simulation to include beam-line components and magnetic fields up to 8.5 m away
from the interaction point. We describe the simulation model and then compare preliminary predicted background levels with measurements from dedicated single- and
colliding-beam experiments.
Fig. 3: z positions of LER vacuum chamber hits as predicted by the G4 and LPTURTLE simulations, from an ensemble of
bremsstrahlung- and Coulomb-scattered e+.
Optics and Geometry Validation:
Horizontal positions of on-energy LPTURTLE particles at downstrewam outboard end of final doublet (z=790 cm) predicted by G4 (vertical axis) and by LPTURTLE
(horizontal axis).
Fig. 4: Single-beam SVT £p chip occupancies measured with a 1A e+ beam (solid circles) and predicted by G4 (histograms) for layer
1 (top) and layer 2 (bottom). The simulationassumes a 1 nTorr pressure around the ring.
SVT Layer 1
SVT Layer 2
SV
T c
hip
occu
panc
y (%
)Fig. 1: Layout of the PEP-II interaction region, top view. The
beam separation dipoles (B1) are shown together with the quadrupoles QD1, QF2, QD4 and QF5. The 9.0 GeV e- beam
enters from the left, the 3.0 GeV e+ from the upper right.
Fig. 2: G4 description of PEP-II interaction geometry. The B1 and QD1 magnets appear in red, QF2, QD4 and QF5 magnets in light blue. Part of the LER
vacuum chamber (gray) is visible adjacent to QD4 and QF5.
Interaction Region:
G4 forward Q2 septum model: LER (green), HER (red)
G4 description of IR components:
Data Monte Carlo comparison:
Modeling Lost-Particle Backgrounds in PEP-II Using LPTURTLEModeling Lost-Particle Backgrounds in PEP-II Using LPTURTLEModeling Lost-Particle Backgrounds in PEP-II Using LPTURTLEModeling Lost-Particle Backgrounds in PEP-II Using LPTURTLE
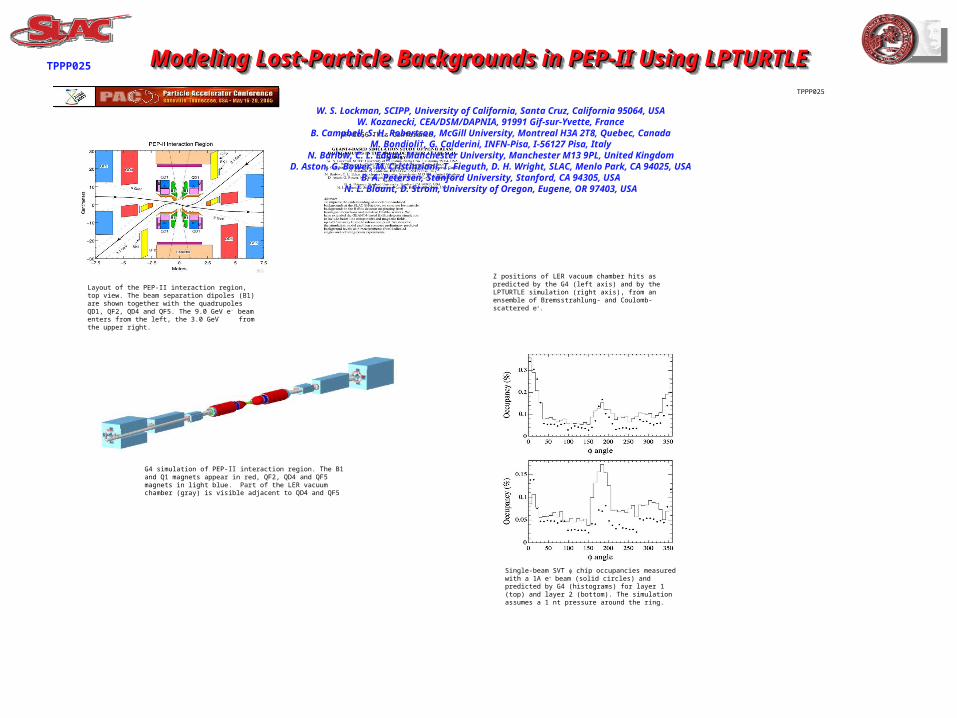
Z positions of LER vacuum chamber hits as predicted by the G4 (left axis) and by the LPTURTLE simulation (right axis), from an ensemble of Bremsstrahlung- and Coulomb-scattered e +.
Layout of the PEP-II interaction region, top view. The beam separation dipoles (B1) are shown together with the quadrupoles QD1, QF2, QD4 and QF5. The 9.0 GeV e - beam enters from the left, the 3.0 GeV from the upper right.
WPAE056 This Conference
TPPP025
Single-beam SVT chip occupancies measured with a 1A e+ beam (solid circles) and predicted by G4 (histograms) for layer 1 (top) and layer 2 (bottom). The simulation assumes a 1 nt pressure around the ring.
G4 simulation of PEP-II interaction region. The B1 and Q1 magnets appear in red, QF2, QD4 and QF5 magnets in light blue. Part of the LER vacuum chamber (gray) is visible adjacent to QD4 and QF5
TPPP025
W. S. Lockman, SCIPP, University of California, Santa Cruz, California 95064, USAW. Kozanecki, CEA/DSM/DAPNIA, 91991 Gif-sur-Yvette, France
B. Campbell, S. H. Robertson, McGill University, Montreal H3A 2T8, Quebec, CanadaM. Bondioli†, G. Calderini, INFN-Pisa, I-56127 Pisa, Italy
N. Barlow, C. L. Edgar, Manchester University, Manchester M13 9PL, United KingdomD. Aston, G. Bower, M. Cristinziani, T. Fieguth, D. H. Wright, SLAC, Menlo Park, CA 94025, USA
B. A. Petersen, Stanford University, Stanford, CA 94305, USAN. L. Blount, D. Strom, University of Oregon, Eugene, OR 97403, USA

Modeling Lost-Particle Backgrounds in PEP-II Using LPTURTLEModeling Lost-Particle Backgrounds in PEP-II Using LPTURTLEModeling Lost-Particle Backgrounds in PEP-II Using LPTURTLEModeling Lost-Particle Backgrounds in PEP-II Using LPTURTLET. Fieguth, T. Fieguth, SLAC, USASLAC, USA
R. Barlow, Manchester University, EnglandR. Barlow, Manchester University, EnglandW. Kozanecki, CEA/DSM/DAPHNIA, FranceW. Kozanecki, CEA/DSM/DAPHNIA, France