gasping for breath - clean air task force...
TRANSCRIPT

Gasping for BreathAn analysis of the health effects from ozone
pollution from the oil and gas industry

Gasping for Breath:
An analysis of the health effects from ozone pollution from the oil and gas industry
Lead Author: Lesley Fleischman, Clean Air Task Force
Contributing Authors:
David McCabe, Clean Air Task Force John Graham, Clean Air Task Force
© AUGUST 2016 This report is available online at:
http://catf.us/resources/publications/files/Gasping_for_Breath.pdf
Cover photo: © KristyFaith

1
Contents: Page 2 Acknowledgements 3 Abbreviations 4 Executive Summary 6 Smog-Forming Emissions Sources in the Oil and Gas Industry 8 Results 8 National 12 Colorado 13 Pennsylvania 14 Ohio 15 California 16 Technologies and Practices to Reduce VOC Emissions 18 Methodology 18 Emissions Characterization 19 Air Quality Model 20 Health Impact Estimation 21 Appendix Tables 24 References Maps and Tables Page 3 Map ES-1: Asthma Attacks by Metropolitan Area 9 Map 1: Asthma Attacks by State 10 Map 2: Asthma Attacks by Metropolitan Area 10 Table 1: Top 10 Metropolitan Areas by Number of Asthma Attacks 11 Map 3: Asthma Attack Risk by County 12 Map 4: Colorado Asthma Attacks by Metropolitan Area 13 Map 5: Pennsylvania Asthma Attacks by Metropolitan Area 14 Map 6: Ohio Asthma Attacks by Metropolitan Area 15 Map 7: California Asthma Attacks by Metropolitan Area 19 Map 8: VOC Emissions from Oil and Gas Sources by County 21 Appendix A: Top 20 States by Health Impact 22 Appendix B: Top 25 Metropolitan Areas by Health Impact 23 Appendix C: Top 30 Counties by Asthma Attack Risk

2
Acknowledgements:
This work was made possible through the generous support of the: Betsy and Jesse Fink Foundation, Blue Marble Fund, Climate and Health Research Network, ClimateWorks Foundation, Energy Foundation, Pisces Foundation, and the Turner Foundation.
The authors would like to thank the following individuals for their invaluable contributions and counsel: Tammy Thompson (Colorado State University), Paul Billings (American Lung Association), Alan Septoff, Molly Dunton (Earthworks), Conrad Schneider, Sarah Uhl, and Darin Schroeder (Clean Air Task Force).

3
Abbreviations: BenMAP Benefits Mapping and Analysis Program CAMx Comprehensive Air Quality Model with Extensions CRF Concentration-Response Function CTG Control Technique Guidelines EPA Environmental Protection Agency LDAR Leak Detection and Repair NAA Nonattainment Area NAAQS National Ambient Air Quality Standard NEI National Emissions Inventory NOAA National Oceanic and Atmospheric Administration NOx Nitrogen Oxides OTR Ozone Transport Region SMOKE Sparse Matrix Operator Kernel Emissions modeling system VOC Volatile Organic Compound

4
Executive Summary
The oil and gas industry dumps more than 9 million tons of methane and other pollutants like benzene into our air each year. Methane is a greenhouse gas 87 times more potent than carbon dioxide at driving climate change in the near term and the oil and gas industry is now the largest source of methane in the U.S. As we recently described in Fossil Fumes, many of the toxic air pollutants from oil and gas are linked to increased risk of cancer and respiratory disorders. But, air pollutants from the oil and gas supply chain also contribute to the ozone smog pollution that blankets the U.S. in the warmer months. Volatile organic compounds (VOCs) and methane vented and leaked from the oil and gas supply chain and nitrogen oxides (NOx) generated by gas flaring and engines at natural gas facilities react together in the presence of sunlight to form ozone smog. What’s more, methane pollution from oil and gas facilities also worsens climate change, resulting in hotter weather and stagnant air — conditions that make ozone smog levels worse.
When inhaled, ozone smog can impair lung function, trigger asthma attacks, and aggravate diseases such as bronchitis and emphysema, in some cases leading to premature death. Children, the elderly, and people with existing respiratory conditions are the most at risk from ozone smog pol lution, which can drive them to stay indoors in the warmer months when smog levels are highest, robbing children of their summers and others of their ability to work and recreate out of doors. However, the health impacts associated with ozone smog produced by pollution solely from the oil and gas industry have never before been quantified.
For the first time, this report, based on independent analysis by a researcher at Colorado State University, quantifies the national health impacts in the U.S. from ozone smog produced by the pollution from the oil and gas industry. The analysis describes the contribution of these emissions to ozone season ozone levels in 2025 and quantifies health effects of ozone smog from this industry.
Ozone smog that results from oil and gas industry pollution poses a real threat to children who suffer from asthma.
x Nationally, there are more than 750,000 summertime asthma attacks in children under the age of 18 due to ozone smog resulting from oil and gas pollution.
x Each summer, there are more than 2,000 asthma-related emergency room visits and over 600 respiratory related hospital admissions nationally due to ozone smog resulting from oil and gas pollution.
Ozone smog that results from oil and gas industry pollution has a real impact on many Americans’ daily lives.
x Children miss 500,000 days of school each year due to ozone smog resulting from oil and gas pollution.
x Each year, adults must deal with 1.5 million person-days when they are forced to rest or reduce activity due to high ozone smog levels resulting from oil and gas pollution.
Air pollution from oil and gas facilities can have a significant impact on public health – even in areas far from oil and gas production. Once emitted, air pollution from oil and gas facilities travels far downwind, contributing to elevated ozone levels and affecting people in all of the lower 48 states.

5
Map ES-1: Asthma Attacks by Metropolitan Area
Air pollution from oil and gas facilities travels far downwind, contributing to elevated ozone levels and affecting people in all of the lower 48 states.
Number of Asthma Attacks
This smog-forming pollution is emitted from dozens of types of equipment and processes throughout the oil and gas sector, such as wells, completion equipment, storage tanks, compressors, and valves. Many proven, low-cost technologies and practices are available to reduce these emissions, while also reducing emissions of methane, the main constituent of natural gas. Thus, policies that aim to reduce pollution from the oil and gas industry will help protect the health of local communities while addressing global climate change. Waste Not, a report by Clean Air Task Force, the Natural Resources Defense Council, and the Sierra Club, called for EPA regulations to cut methane emissions from the oil and gas industry in half. Implementing these methane standards would also significantly cut ozone smog-forming VOC pollution. In June 2016, EPA finalized strong methane standards covering new and modified oil and gas facilities, but these standards do not apply to the 1.2 million existing oil and gas facilities around the county.
In addition, EPA has committed to issue Control Technique Guidelines (CTGs), which will provide guidance to state and local air regulators on how to control smog-forming pollution from the oil and gas industry in the near future. These guidelines will apply to existing oil and gas facilities in certain regions of the country that currently experience high ozone levels: Nonattainment Areas (NAAs) classified as “moderate” or worse, and the Ozone Transport Region (OTR). It is critical that EPA finalize strong guidelines for this sector.

6
Smog-Forming Emissions Sources in the Oil and Gas Industry
Natural gas development and transmission release a host of pollutants—such as toxics, smog forming pollutants, and greenhouse gases—that take a toll on our environment and our health. In this analysis, we focus specifically on ozone-forming pollutants. Volatile organic compounds (VOCs) and methane vented and leaked from the oil and gas supply chain and nitrogen oxides (NO x) formed by sources such gas flaring and engines at natural gas facilities react together in the presence of sunlight to form ozone smog. Smog can impair lung function, trigger asthma attacks, and aggravate bronchitis and emphysema.1 Children, the elderly, and people with existing respiratory conditions are the most at ri sk from ozone pollution.
Raw natural gas (i.e., gas as it is produced from underground formations, before significant processing is done) usually contains significant amounts of VOCs. VOC content of gas varies in composition from source to source,2 and these pollutants are also emitted from crude oil production operations. While natural gas processing plants separate much of the toxic and smog-forming components from raw natural gas, some of those pollutants remain in the gas even after processing. As such, emissions from facilities further downstream in the natural gas supply chain, like transmission compressor stations and local distribution equipment, still include some of these pollutants (and emissions from al l natural gas facilities contain large amounts of climate-warming methane).
There are four segments of the oil and gas industry, and pollutants are emitted from each one, though in varying amounts:
x Oil and Gas Production: The oil and gas production segment includes many diverse activities, such as production of hydrocarbons from underground geologic formations; separation of natural gas, oil, and, water; and collection of gas from multiple wells through natural gas gathering pipeline and compressor systems. These activities in turn involve processes such as well drilling, hydraulic fracturing or other well stimulation, and well workovers; and they require equipment such as tanks, piping, valves, meters, separators, dehydrators, pipelines, and gathering compressors.
x Natural Gas Processing: Gas processing plants separate raw natural gas into natural gas l iquids and processed natural gas that meets specifications for transport in high-pressure pipelines and consumption in furnaces and power plants. Natural gas l iquids are hydrocarbons such as propane, butane, etc., which are valuable products of gas processing. The processing remove s most of the VOC components from the natural gas, but some VOC remains.
x Transmission and Storage: Natural gas transmission pipelines carry gas from production regions to markets. This segment also includes facilities where gas is stored, either underground or in tanks. Compressor stations along pipelines maintain pressure and provide the energy to move the gas.
x Natural Gas Distribution: Finally, natural gas is delivered to customers (residential, commercial, and light industrial) via low-pressure underground distribution pipelines.
In this analysis, we estimate the health impacts, in 2025, attributable to oil and gas during “ozone season”, the five month period from May through September when most high ozone days occur in much of the county. We did this by comparing the health impacts in calculated in a “baseline case”—that i s, a case based on current trends in air quality that also accounts for expected growth in oil and gas

7
production—to health impacts in a case with no emissions from the oil and gas industry. The difference between these two cases is health impacts that can be directly attributed to oil and gas pol lution (See Methodology section for more details).

8
Results
Here, we present the final results of our analysis in terms of health impacts from ozone smog attributable to oil and gas on populations during the ozone season: asthma attacks, lost school days, emergency room visits for asthma attacks, hospital admissions for respiratory symptoms, and reduced activity days. See the Methodology section below for more details.
Air pollution from oil and gas facilities can have a significant impact on public health – even in areas far from oil and gas production. Once emitted, air pollution from oil and gas facilities travels far downwind, contributing to elevated ozone levels and affecting people in all the lower 48 states. When inhaled, ozone smog can impair lung function, trigger asthma attacks, and aggravate conditions of people with bronchitis and emphysema, in some cases leading to premature death. Children, the elderly, and people with existing respiratory conditions are the most at risk from ozone smog pollution, which can drive them to shelter indoors in the warmest months of the year when smog levels are highest, robbing children of their summers and others of their ability to work and recreate out of doors.
The EPA uses peer-reviewed literature to estimate how these changes in ozone will affect public health. Using the same studies and methodology as the EPA used in its recent Ozone NAAQS rulemaking process, we calculated the increased incidence of several health impacts that can be directly attributable to ozone caused by emissions from the oil and gas sector.*
Like EPA, we looked at the public health impacts during the “ozone season”, the five-month period from May 1st through September 30th when ozone smog levels in most of the country are highest due to increase photochemical production of ozone in the warmer temperatures and longer daylight hours. Many areas have high ozone levels outside of the defined ozone season and so the human health results presented here represent a lower bound to the full human health impacts associated oil and gas pollution.3
A recently published research provides evidence for the link between oil and gas pollution and respiratory problems. The paper “Association Between Unconventional Natural Gas Development in the Marcellus Shale and Asthma Exacerbations”, published in JAMA Internal Medicine , found a corre lation between increased risk of asthma attacks and proximity to unconventional natural gas development in Pennsylvania.4 This and other studies provide increasing support for the link between oil and gas pollution and the public health outcomes that we present in this report.
National Results
The following health impacts are due to increases in ozone levels in 2025 resulting from oil and gas pollution:
x Nationally, there will be more than 750,000 summertime asthma attacks in children under the age of 18 due to ozone smog resulting from oil and gas pollution.
x Each summer, there will be more than 2,000 asthma-related emergency room visits and over 600 respiratory related hospital admissions nationally due to ozone smog resulting from oi l and gas pollution.
* EPA also looked at mortality associated with ozone pollution. We excluded mortality from our analysis because there is a higher degree of uncertainty associated with this estimate.

9
x Children will miss 500,000 days of school nationally each year due to ozone smog resulting from oil and gas pollution.
x Each year, adults must deal with 1.5 million days when they are forced to rest or reduce activi ty due to ozone smog resulting from oil and gas pollution.
States with the largest number of asthma attacks attributable to oil and gas pollution are: Texas, Oklahoma, Colorado, and Pennsylvania.
Map 1: Asthma Attacks by State
See Appendix for health impact data for top 20 states.
These health endpoint results correspond directly to changes in ozone concentrations. However, since most residents of the United States live in metropolitan areas, the majority of the ozone -related health impacts attributable to oil and gas will be felt by people in metropolitan and urban areas – including urban areas far from oil and gas, such as in the southeastern U.S. – as shown in Map 2 and Table 1. Significant levels of ozone smog attributable to oil and gas occurs in regions of the U.S. that are hundreds of miles from the sources of the sources of the pollution that cause the smog. As a res ult, health impacts from oil and gas reaches most corners of the contiguous United States, including areas far from large scale oil and gas development.

10
Map 2: Asthma Attacks by Metropolitan Area
Air pollution from oil and gas facilities travels far downwind, contributing to elevated ozone levels and affecting people in all of the lower 48 states.
Number of Asthma Attacks
Table 1: Top 10 Metropolitan Areas by Number of Asthma Attacks
Children Full Population Seniors Adults
State Asthma Attacks
School Days Lost
Asthma-Related Emergency Room
Visits
Respiratory-related Hospital
Admissions
Acute Respiratory Symptoms
(person-days)
Dallas-Fort Worth, TX 45,880 33,569 101 31 93,608 New York 25,793 18,805 105 20 59,162
Washington DC-Baltimore 25,173 18,374 67 17 55,432 Houston, TX 21,712 15,876 46 13 41,459
Denver, CO 20,466 14,986 41 10 44,220
Atlanta, GA 20,411 14,886 47 13 44,441 Chicago, IL 18,756 13,694 64 19 40,493
Oklahoma City, OK 15,655 11,513 33 13 29,806
San Antonio, TX 15,429 11,309 34 9 31,796 Philadelphia, PA 12,206 8,890 40 9 26,294

11
Small changes in ozone smog concentrations in areas with large total populations can have a large total health impact numbers. However, small health impact numbers in rural or more sparsely populated areas does not indicate a lower health risk, it simply reflects a smaller total number of incidents. As shown by Map 3, increased asthma attack risk due to oil and gas pollution is still highest in areas closest to oil and gas pollution sources.
Map 3: Asthma Attack Risk by County
See Appendix for data on top 30 counties by asthma attack risk.

12
Colorado According to our baseline case, over 250,000 tons of volatile organic compounds will be emitted by oi l and gas facilities in Colorado in 2025.5 This is the anticipated level of emissions even after taking into account the significant expected reductions from Colorado’s 2014 oil and gas air emissions standard.6
In Colorado, the following health impacts are due to increases in ozone levels in 2025 resulting from oi l and gas pollution:
x There will be more than 32,000 summertime asthma attacks in children under the age of 18 due to ozone smog resulting from oil and gas pollution.
x Children will miss nearly 24,000 days of school each year due to ozone smog resulting from oi l and gas pollution.
x Each year, adults will have to deal with nearly 70,000 person-days when they are forced to rest or reduce activity due to ozone smog resulting from oil and gas pollution.
x The vast majority of the health impacts in Colorado will occur in three metropolitan areas: Denver, Fort Collins, and Colorado Springs.
Map 4: Colorado Asthma Attacks by Metropolitan Area
Number of Asthma Attacks

13
Pennsylvania According to EPA’s projection of its NEI, over 30,000 tons of volatile organic compounds will be emitted by oil and gas facilities from facilities in Pennsylvania in 2025, and ozone from oil and gas pollution wi l l have significant impacts on public health in the state. In 2025, the following health impacts from ozone smog resulting from oil and gas pollution are anticipated in Pennsylvania:
x There will be more than 30,000 summertime asthma attacks in children under the age of 18 due to ozone smog resulting from oil and gas pollution.
x Children will miss more than 22,000 days of school each year due to ozone smog resulting from oil and gas pollution.
x Each year, adults will have to deal with more than 67,000 person-days when they are forced to rest or reduce activity due to ozone smog resulting from oil and gas pollution.
x The health impacts will be particularly felt in the more densely populated areas of the state, including Philadelphia, Pittsburgh, and Harrisburg.
Map 5: Pennsylvania Asthma Attacks by Metropolitan Area
Number of Asthma Attacks

14
Ohio According to EPA’s projection of its NEI, over 10,000 tons of volatile organic compounds will be emitted by oil and gas facilities from facilities in Ohio in 2025. In Ohio, increased ozone from oil and gas pollution will have significant impacts on public health. The following health impacts are due to increases in ozone levels in 2025 resulting from oil and gas pollution:
x There will be nearly 30,000 summertime asthma attacks in children under the age of 18 due to ozone smog resulting from oil and gas pollution.
x Children will miss nearly 22,000 days of school each year due to ozone smog resulting from oi l and gas pollution.
x Each year, adults will have to deal with more than 61,000 person-days when they are forced to rest or reduce activity due to ozone smog resulting from oil and gas pollution.
x The health impacts will be particularly felt in the more densely populated areas of the state, including Columbus, Cleveland, Dayton, and Cincinnati.
Map 6: Ohio Asthma Attacks by County Area
Number of Asthma Attacks

15
California According to EPA’s projection of its NEI, over 20,000 tons of volatile organic compounds will be emitted by oil and gas facilities from facilities in California in 2025. In California, the following health impacts are due to increases in ozone levels resulting from oil and gas pollution:
x There will be more than 12,000 summertime asthma attacks in children under the age of 18 due to ozone smog resulting from oil and gas pollution.
x Children will miss more than 9,000 days of school each year due to ozone smog resulting from oil and gas pollution.
x Each year, adults will have to deal with more than 26,000 person-days when they are forced to rest or reduce activity due to ozone smog resulting from oil and gas pollution.
x More than half of the health impacts in California occur in the Los Angeles metro area.
Map 7: California Asthma Attacks by Metropolitan Area
Number of Asthma Attacks

16
Technologies and Practices to Reduce VOC Emissions
As outlined in the 2014 report Waste Not, readily-available technologies and practices can cut methane emissions dramatically in just a few years.7 These technologies and practices will reduce the total amount of natural gas that leaks and is released from facilities throughout the oil and gas supply chain. Thus, these policy recommendations will also reduce emissions of smog-forming air pollutants from the oil and gas industry. Ozone smog and other air pollution resulting from oil and gas production pose a serious threat to public health. We need strong federal safeguards to limit pollution from the oil and gas industry—methane, toxic air pollution, and pollutants that form ozone smog—to keep our communities healthy.
x Finding and Fixing Leaks: Unintentional leaks of natural gas from static components such as connectors, valves, regulators, and hatches throughout the oil and natural gas sector are widespread. Leaks will eventually occur at all oil and gas facilities; failing to fix them in a timely manner is a wasteful and harmful practice that leads to clearly avoidable emissions. Leak emissions can be reduced with rigorous leak detection and repair (LDAR) programs. These programs require frequent, regular surveying of facilities for leaks using instruments that detect methane and other hydrocarbons in natural gas.
x Reducing or eliminating venting from natural gas-driven pneumatic equipment: Gas-driven pneumatic equipment uses the pressure energy of natural gas in pipelines to do work, such as control, open, and shut valves, or operate pumps. This equipment is ubiquitous at oil and gas facilities, and emits natural gas to the atmosphere by design. Replacing high-emitting pneumatic equipment with low- or zero-emitting equipment will greatly reduce smog-forming emissions.
x Controlling Emissions from Oil and Condensate Storage Tanks : Storage tanks are used to hold oil, condensate, and produced water from oil and gas wells. During normal operations, VOCs separate from the liquids and, if not controlled, vent into the atmosphere. Tanks are a very large source of smog-forming air pollutants – we estimate that tanks are emitting two-thirds of the VOCs from the oil and gas industry.8 Control measures such as vapor recovery units (small compressors which capture these vapors and inject them into natural gas pipelines) can greatly reduce emissions of VOCs.
x Reducing Compressor Seal Emissions: Seals on the moving parts of natural gas compressors are a significant source of preventable VOC emissions. These emissions can be very large when the seals are not regularly maintained or replaced, and when operators use older designs for certain compressors. Fortunately, these emissions can easily be reduced or eliminated by employing a mix of modern seal design, capture of gas that escapes from seals so it can be utilized, and proper maintenance practices.
x Reducing Dehydrator Venting: Dehydrators remove water from the natural gas stream. When their emissions are not controlled, dehydrators vent large amounts of pollution alongside the water they are intended to remove.
x Reducing venting from oil wells: Venting of gas during completion of oil wells, following hydraulic fracturing, can be a significant source of VOCs. In 2012, EPA established standards to address emissions from gas wells during flowback after hydraulic fracturing or re -fracturing requiring operators to flare or capture the gas,9 and in 2016, EPA issued standards that will extend this requirement to hydraulically fractured oil wells.10 Some oil well operators also vent

17
off the “casinghead” natural gas, which they may consider to be an unwanted by -product of oi l production; this venting is another significant source of VOCs.
x Reducing venting from gas wells during liquids unloading : When water from the underground formations that produce gas accumulates in a mature gas well, it can slow or stop gas production from that well. In order to maintain production, operators remove, or “unload ”, liquids through a variety of methods, some of which vent natural gas to varying degrees. While a variety of technologies and practices can reduce or eliminate this venting and the resulting pollution, some operators forego these proven, affordable approaches and crudely “blow down” the well by opening it to the atmosphere. This approach is inefficient, as it vents large quantities of gas, including VOCs, while only removing a small portion of the liquids in the well. 11

18
Methodology
This report, based on independent analysis by a researcher at Colorado State University, quantifies health impacts in the U.S. from ozone smog produced by the pollution from the oil and gas industry. It outlines the health consequences associated with ozone changes due to oil and gas activity. It separates the health impacts from ozone that can be directly attributed to emissions from oil and gas facilities , by comparing ozone levels in a 2025 “Baseline” case and a 2025 “Zero Oil and Gas Emissions” case.
The study was conducted in three separate steps, each with its own methodology: (1) emissions characterization with SMOKE, (2) air quality simulation using CAMx, and (3) health effects estimation with BenMAP. The report “Modeled Impacts of Oil and Gas On Air Quality and Human Health” describes each of these steps in detail.12
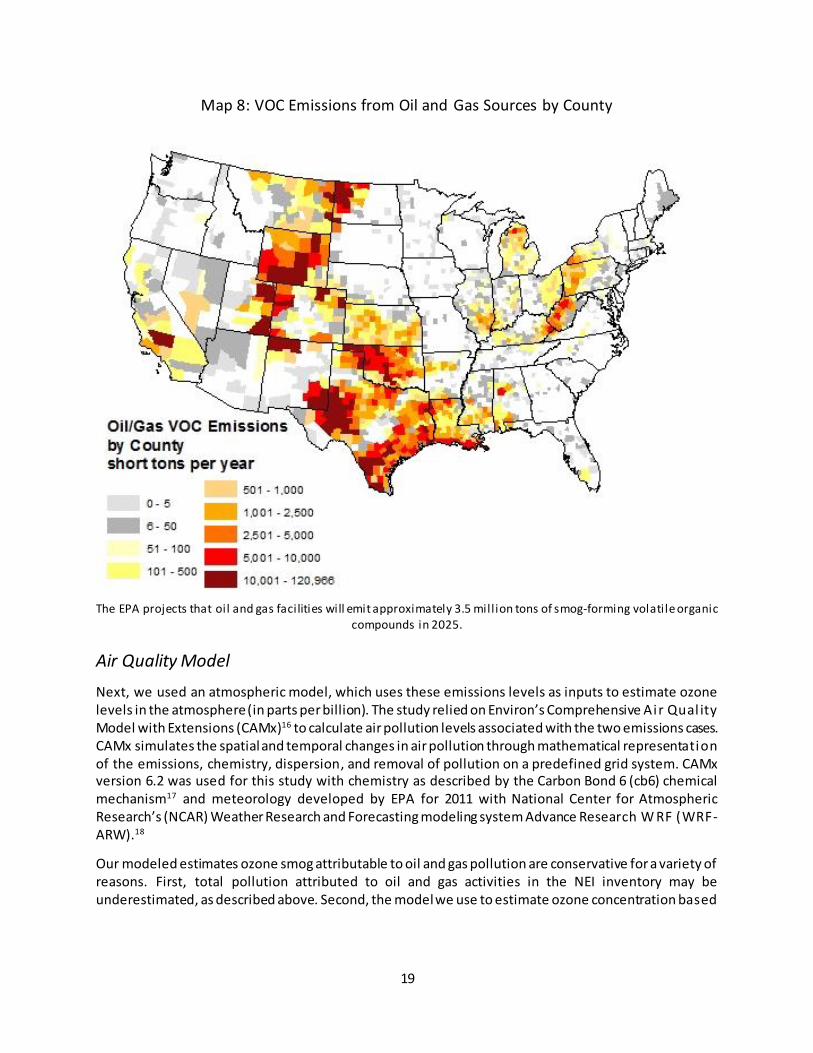
Emissions Characterization First, we looked at the total amount of VOCs emitted by oil and gas sources in our 2025 baseline case. These emissions map very closely with the patterns of oil and gas development that we expect to see in 2025. The emissions estimates are based on a U.S. EPA 2025 projection of the National Emissions Inventory (NEI) for 2011. Using the 2011 NEI v6.2 as a baseline, EPA developed the 2025 inventory by projecting population, other trends affecting air quality, oil and gas production growth, and the impact of federal emissions regulations promulgated by December 2014.13 This includes the impact of EPA’s 2012 new source standards for oil and gas VOCs, but not EPA’s recently finalized 2016 new source performance standards for VOCs and methane from oil and gas. We also modified this future inventory to include expected future oil and gas sector emission reductions due to state rules for existing sources in Colorado (2014) and Wyoming (2015). The emissions in this 2025 inventory represent the future emissions under ‘business as usual’ conditions.
A second inventory, the ‘zero oil and gas’ 2025 inventory, includes all of the emissions of the basel ine 2025 inventory except for emissions of air pollutants identified as originating from the oil and gas sector. Therefore, by comparing the modeled ozone concentrations of the 2025 Baseline case to the 2025 Zero Oil and Gas scenario, the estimated air quality and human health impacts of the entire oil and gas sector can be separated and calculated.
Both emissions inventories were prepared for air quality modeling using the Sparse Matrix Operator Kernel Emissions (SMOKE) Modeling System.14 The emissions model creates daily files that represent the spatial and temporal emissions variations of all modeled pollutants for direct input i nto an air quality model.
There are several factors that introduce uncertainty into our estimate for the total pollution impact of the oil and gas industry. First, some pollution from oil and gas activities is not classified as originating from the oil and gas sector in the EPA emissions databases we used (for example, the heavy truck traffic associated with oil and gas development), so they are not included in the oil and gas emissions discussed here. Moreover, even for oil and gas sources included in the EPA emissions database, there is evidence that emissions of smog-forming pollutants are underestimated.15 As a result, the health impacts from oil and gas we present in this report are likely to be underestimated.
19
Map 8: VOC Emissions from Oil and Gas Sources by County
The EPA projects that oil and gas facilities will emit approximately 3.5 mill ion tons of smog-forming volatile organic
compounds in 2025.
Air Quality Model Next, we used an atmospheric model, which uses these emissions levels as inputs to estimate ozone levels in the atmosphere (in parts per billion). The study relied on Environ’s Comprehensive Air Qual ity Model with Extensions (CAMx)16 to calculate air pollution levels associated with the two emissions cases. CAMx simulates the spatial and temporal changes in air pollution through mathematical representation of the emissions, chemistry, dispersion, and removal of pollution on a predefined grid system. CAMx version 6.2 was used for this study with chemistry as described by the Carbon Bond 6 (cb6) chemical mechanism17 and meteorology developed by EPA for 2011 with National Center for Atmospheric Research’s (NCAR) Weather Research and Forecasting modeling system Advance Research W RF (WRF-ARW).18
Our modeled estimates ozone smog attributable to oil and gas pollution are conservative for a variety of reasons. First, total pollution attributed to oil and gas activities in the NEI inventory may be underestimated, as described above. Second, the model we use to estimate ozone concentration based

20
on emissions levels somewhat underestimates the amount of ozone that will be formed from oil and gas emissions, because the model does not capture the effects of methane emissions and climate change.†
In addition, in certain areas with high levels of oil and gas development — such as Utah’s Uintah basin, and Wyoming’s Green River Basin — ozone levels can be quite high in the wintertime. Typically, ozone is formed in the summer when temperatures are higher and sunlight is more direct. However, in certain areas, stagnant air resulting from an atmospheric inversion can allow VOCs to build up and facilitate ozone production when snow covers the ground.19 The processes that create this wintertime ozone are not captured in the atmospheric model that we used.‡
A recent study by the National Oceanic & Atmospheric Administration (NOAA) looked specifically at the impact of oil and gas pollution on ozone production in the Denver region. Based on both direct measurements and a localized model of current conditions, it concluded that VOC emissions from oil and gas contributed approximately 17 percent to regional ozone production in Denver,20 confirming the substantial impact from oil and gas emissions.
Health Impact Estimation Finally, we assessed the impacts from ozone attributed to oil and gas has on a variety of public health endpoints, including asthma attacks, lost school days, and asthma related emergency room visi ts. The human health impacts associated with changes in ozone concentrations are estimated using the Benefits Mapping and Analysis Program Community Edition 1.0 (BenMAP). 21 The approach used to calculate benefits in this study follows the methodology of the US EPA’s Regulatory Impact Analysis (RI A) developed in support of the most recent update to the NAAQS for ozone. 22 Calculated changes to the modeled ozone concentrations are overlaid with forecast U.S. census data representing 2025 and projected county-level 2025 baseline incidence data, and applied to the concentration-response functions (CRFs) corresponding to the specific pollutant. CRFs are statistical relationships between small changes in ambient concentrations of pollution and human health endpoints. The CRFs used in this study are all from published, peer-reviewed literature. BenMAP has built in population projections (including 2025) that incorporate economic predictions of changing population spatial distributions, which could be important given that pollution is often not spatially homogeneous. Thus, the incidence rates represent ozone season health impacts in the year 2025, with and without oil and gas emissions.
† Methane, l ike VOC, is a precursor of ozone smog, although methane reacts to form ozone more slowly than VOC (so the ozone generated by methane is more geographically spread out than ozone from VOC). However, the model does not include the effects of emitted methane (the model treats methane concentration as a constant, for simplicity, despite the fact that high emissions from sources l ike oil and gas will raise the local concentration of methane, increasing ozone production in that area). The model also uses weather and climate conditions from 2011 for the simulation of 2025 air quality, which neglects the fact that climate change makes air quality worse (for a given level of emissions) because it makes the stagnant weather conditions, when air quality is poorest, more common. And of course, methane emissions are a key driver of climate change. These effects are small, but real. ‡ The model results do show that oil and gas emissions lead to greater ozone levels in the winter in some areas (such as in parts of Texas, where sunlight levels are not as low in winter). Nevertheless, as described below, the results we present are for impacts to public health during “ozone season” (May through September), because the impacts of ozone smog on human health are best understood during the summer months.

21
Appendix
A: Top 20 States by Health Impact Children Full Population Seniors Adults
State Asthma Attack
School Days Lost
Asthma Related Emergency Room
Visits
Respiratory Related Hospital
Admission
Acute Respiratory Symptoms (person-
days) Texas 144,496 105,824 313 95 283,461
Oklahoma 39,308 28,896 83 35 73,384 Colorado 32,477 23,776 65 17 69,518
Pennsylvania 30,270 22,011 105 25 67,009 Georgia 29,961 21,842 68 21 63,435
Ohio 29,817 21,726 93 30 61,311 North Carolina 28,468 20,737 80 23 60,210
Illinois 27,568 20,101 96 31 58,971 Tennessee 24,947 18,205 71 24 52,213
Virginia 24,505 17,843 57 22 54,193 Louisiana 23,999 17,580 52 19 46,768 Missouri 23,041 16,832 64 14 45,858 New York 21,080 15,350 79 17 47,800 Arkansas 20,313 14,876 44 21 40,209 Kansas 19,996 14,669 53 16 36,150
Alabama 19,489 14,233 43 17 40,216 Indiana 19,064 13,881 53 20 37,810
Michigan 18,050 13,133 52 17 38,681 Florida 16,758 12,193 47 16 38,552
Kentucky 16,429 11,994 44 21 33,616
22
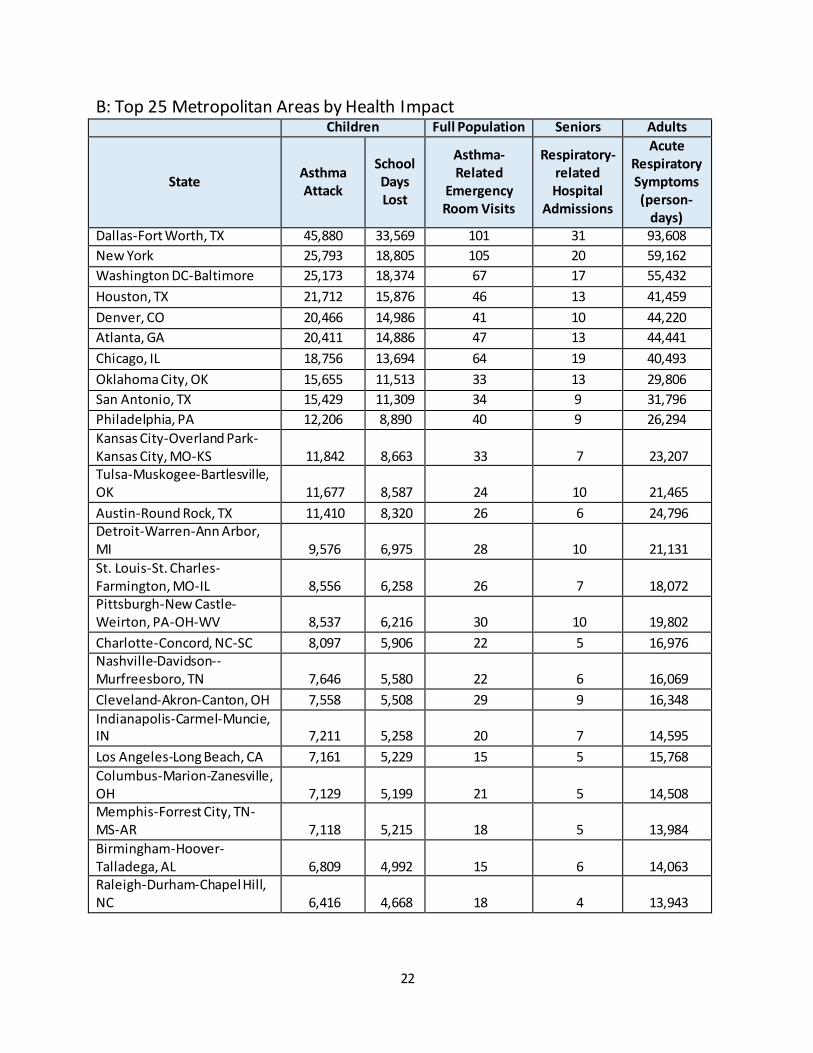
B: Top 25 Metropolitan Areas by Health Impact Children Full Population Seniors Adults
State Asthma Attack
School Days Lost
Asthma-Related
Emergency Room Visits
Respiratory-related Hospital
Admissions
Acute Respiratory Symptoms (person-
days) Dallas-Fort Worth, TX 45,880 33,569 101 31 93,608 New York 25,793 18,805 105 20 59,162 Washington DC-Baltimore 25,173 18,374 67 17 55,432 Houston, TX 21,712 15,876 46 13 41,459 Denver, CO 20,466 14,986 41 10 44,220 Atlanta, GA 20,411 14,886 47 13 44,441 Chicago, IL 18,756 13,694 64 19 40,493 Oklahoma City, OK 15,655 11,513 33 13 29,806 San Antonio, TX 15,429 11,309 34 9 31,796 Philadelphia, PA 12,206 8,890 40 9 26,294 Kansas City-Overland Park-Kansas City, MO-KS 11,842 8,663 33 7 23,207 Tulsa-Muskogee-Bartlesville, OK 11,677 8,587 24 10 21,465 Austin-Round Rock, TX 11,410 8,320 26 6 24,796 Detroit-Warren-Ann Arbor, MI 9,576 6,975 28 10 21,131 St. Louis-St. Charles-Farmington, MO-IL 8,556 6,258 26 7 18,072 Pittsburgh-New Castle-Weirton, PA-OH-WV 8,537 6,216 30 10 19,802 Charlotte-Concord, NC-SC 8,097 5,906 22 5 16,976 Nashville-Davidson--Murfreesboro, TN 7,646 5,580 22 6 16,069 Cleveland-Akron-Canton, OH 7,558 5,508 29 9 16,348 Indianapolis-Carmel-Muncie, IN 7,211 5,258 20 7 14,595 Los Angeles-Long Beach, CA 7,161 5,229 15 5 15,768 Columbus-Marion-Zanesville, OH 7,129 5,199 21 5 14,508 Memphis-Forrest City, TN-MS-AR 7,118 5,215 18 5 13,984 Birmingham-Hoover-Talladega, AL 6,809 4,992 15 6 14,063 Raleigh-Durham-Chapel Hill, NC 6,416 4,668 18 4 13,943

23
C: Top 30 Counties by Asthma Attack Risk State County Asthma Attacks per
10,000 Children Texas Gaines County 798 New Mexico Lea County 786 Texas Andrews County 750 Texas Yoakum County 742 Texas Midland County 706 Texas Ector County 704 Texas Martin County 685 Texas Winkler County 679 Louisiana Webster Parish 637 Colorado Garfield County 631 Louisiana Bossier Parish 628 Texas Dawson County 627 Oklahoma Woodward County 623 Oklahoma Ellis County 622 Oklahoma Woods County 621 Texas Terry County 618 Texas Hemphill County 615 Oklahoma Harper County 613 Texas Lipscomb County 607 Louisiana Caddo Parish 605 Louisiana Union Parish 605 Oklahoma Dewey County 604 Texas Ward County 600 Texas Borden County 598 Oklahoma Roger Mills County 589 Louisiana Claiborne Parish 585 Oklahoma Beaver County 582 Texas Loving County 580 New Mexico Eddy County 580 Texas Howard County 578

24
References
1 US Environmental Protection Agency (EPA). “Ozone Basics” Available at: http://www.epa.gov/groundlevelozone/health.html .
2 Brown, H.P. (2011) “Composition of Natural Gas for use in the Oil and Natural Gas Sector Rulemaking.” Available at http://www.regulations.gov/#!documentDetail;D=EPA-HQ-OAR-2010-0505-0084. 3 Regulatory Impact Analysis of the Final Revisions to the National Ambient Air Quality Standards for Ground -Level Ozone. Pg. 6-27. Available at: https://www3.epa.gov/ttn/naaqs/standards/ozone/data/20151001ria.pdf. 4 Rasmussen, Sarah, et al. (2016) “Association Between Unconventional Natural Gas Development in the Marcellus Shale and Asthma Exacerbations.” JAMA Internal Medicine, July 18, 2016. Available at: http://archinte.jamanetwork.com/article.aspx?articleid=2534153.
5 Thompson, Tammy. (2016) “Modeled Impacts of Oil and Gas On Air Quality and Human Health.” 6 Colorado Department of Public Health and Environment (CDPHE), 2014a. Regulation Number 7, Sections II, XVII and XVIII. Air Quality Control Division. Available at: https://www.colorado.gov/pacific/sites/default/fi les/5-CCR-1001-9_0.pdf.
7 McCabe, David, et al. (2015) “Waste Not: Common Sense Ways to Reduce Methane Pollution from the Oil and Natural Gas Industry.” Available at: http://www.catf.us/resources/publications/fi les/WasteNot.pdf.
8 Calculations based on the US GHG Inventory and ratios of VOCs to methane and toxic air pollutants to methane from various emission streams from US EPA Regulatory Impact Statement.
9 When a well (gas or oil) is hydraulically fractured, large volumes of water and other substances are pumped down the well to break up (fracture) the rock holding the gas / oil. After fracturing is completed, the water is allowed to flow back to the surface during the “flowback” phase of well completion. Natural gas, including VOCs, from the fractured rock mixes in with this water, and if not controlled, will be vented into the air.
10 EPA. (2016) “Final Rule: Oil and Natural Gas Sector: Emissions Standards for New and Modified Sources.” Available at: https://www.federalregister.gov/articles/2016/06/03/2016-11971/oil-and-natural-gas-sector-emission-standards-for-new-reconstructed-and-modified-sources.
11 EPA. (2006) “Lessons Learned from Natural Gas STAR Partners, Install ing Plunger Lift Systems in Gas Wells.” Available at: https://www3.epa.gov/gasstar/documents/ll_plungerlift.pdf.
12 Thompson (2016). 13 EPA. (2015) “Technical Support Document (TSD) Preparation of Emissions Inventories for the Version 6.2, 2011 Emissions Modeling Platform.” Available at: https://www.epa.gov/sites/production/files/2015-10/documents/2011v6_2_2017_2025_emismod_tsd_aug2015.pdf.
14 Community Modeling and Analysis System, Sparse Matrix Operator Kernel Emissions (SMOKE) Modeling System. See: https://www.cmascenter.org/smoke/.
15 Many peer-reviewed studies based on independent measurements conducted in both oil and gas producing basins and urban areas consuming natural gas have concluded that official emissions inventories, such as NEI, underestimate actual emissions from oil and gas. See McCabe, David, et al. (2015) “Waste Not: Common Sense Ways to Reduce Methane Pollution from the Oil and Natural Gas Industry.” Available at: http://www.catf.us/resources/publications/fi les/WasteNot.pdf, pp. 9 – 11, and EPA Office of Inspector General (2013), “Report: EPA Needs to Improve Air Emissions Data for the Oil and Natural Gas Production Sector.”

25
Available at: https://www.epa.gov/office-inspector-general/report-epa-needsimprove-air-emissions-data-oil-and-natural-gas-production. More recent work, including work carried out in cooperation with the industry, has come to similar conclusions. See Harriss, R., et al., (2015) “Using Multi -Scale Measurements to Improve Methane Emission Estimates from Oil and Gas Operations in the Barnett Shale Region, Texas,” Environ. Sci. Technol. 49, 7524−7526, and references therein. Recent work to update and improve emissions inventories, particularly for methane, is improving this situation. For example, the 2016 EPA Greenhouse Gas Inventory increased the estimate of methane emissions from oil and natural gas systems significantly. Although the Greenhouse Gas Inventory and the NEI, which our analysis is based on, are developed separately, it is l ikely that the NEI underestimates VOC from oil and gas just as the GHG inventory underestimates methane from oil and gas, for similar reasons - underestimated emissions factors and undercounts of equipment.
16 Comprehensive Air Quality Model with Extensions (CAMx). See: http://www.camx.com/about/default.aspx. 17 Yarwood, Greg, et al. Updates To The Carbon Bond Mechanism For Version 6 (CB6). Presented at the 9th Annual CMAS Conference, Chapel Hil l , NC, October 11-13, 2010. Available at: https://www.cmascenter.org/conference//2010/abstracts/emery_updates_carbon_2010.pdf.
18 EPA. (2014) “Meteorological Model Performance for Annual 2011 WRF v3.4 Simulation.” Available at: https://www3.epa.gov/scram001/reports/MET_TSD_2011_final_11-26-14.pdf.
19 National Oceanic and Atmospheric Administration. (2014 ) “New study explains wintertime ozone pollution in Utah oil and gas fields.” Available at: http://www.noaanews.noaa.gov/stories2014/20141001_utahwinterozonestudy.html. 20 McDuffie, Erin, et al. (2016) “Influence of oil and gas emissions on summertime ozone in the Colorado Northern Front Range.” Journal of Geophysical Reseach Atmospheres. Volume 121, Issue 14 Pages 8712–8729. Available at: http://dx.doi.org/10.1002/2016JD025265.
21 EPA. “Environmental Benefits Mapping and Analysis Program - Community Edition (BenMAP-CE).” See https://www.epa.gov/benmap. 22 EPA. (2015) “Regulatory Impact Analysis of the Final Revisions to the National Ambient Air Quality Standards for Ground-Level ozone, Office of Air and Radiation.” Available at: https://www3.epa.gov/ttn/ecas/ria.html .