gas hydrate formation and control by the use of chemicalsgas hydrates formation and plugging of...
TRANSCRIPT

Gas Hydrate Formation and Control by the Use of
Chemicals
Master Thesis
by
Chittawan Nakarit
Faculty of Science and Technology
Department of Mathematics and Natural Science
June, 2012

Faculty of Science and Technology
MASTER’S THESIS
Study program/ Specialization:
MSc in Environmental Technology/
Specialization in Offshore Environmental
Engineering
Spring semester, 2012
Open / Restricted access
Writer: Chittawan Nakarit
………………………………………… (Writer’s signature)
Faculty supervisor: Malcolm Kelland
External supervisor(s): -
Titel of thesis:
Gas Hydrate Formation and Control by the Use of Chemicals
Credits (ECTS): 30
Key words:
Gas hydrates
Flow assurance
Low dosage hydrate inhibitors
Kinetic hydrate inhibitors
Pages: ………67………
+ enclosure: ……CD……
Stavanger, ….15/06/2012…..
Date/year

i
ABSTRACT
Gas hydrates formation and plugging of pipelines is becoming an even more serious
problem in the oil and gas industry due to the exploration and development moving to more
extreme locations. Kinetic hydrate inhibitors (KHIs) are one class of low dosage hydrate
inhibitors (LDHIs) which are used to prevent hydrate plug in pipelines. They work by
delaying gas hydrate formation by time periods dependent mainly on the subcooling (driving
force) in the system.
The effect of various parameters on different kinetic hydrate inhibitors (KHIs) has
been examined with high pressure rocking cell equipment (RC5 unit) in this thesis. Since no
one has published a study to compare KHI performance between rocking rigs and autoclaves
this has been investigated in this study. Constant slow cooling experiments were conducted
until hydrate formation started (To value) and hydrate plug formation (Ta value) occurred. All
the different apparatuses gave similar performance trends with high performance KHIs, but
To was different with low performance chemicals. This may be due to the stochasticity of gas
hydrate formation. The reproducibility of To and Ta values from RC5 are as good as both
autoclaves.
The RC5 experiment at constant cooling showed that the KHI efficiency increased
when concentration dose was increased from 2500 ppm to 5000 ppm. For all the experiments,
the present of small amounts NaCl in aqueous solution decreased the onset and catastrophic
hydrate formation temperature by 0.1-2.1oC compared with using DI water alone. This is
beyond the thermodynamic hydrate inhibition effect of the salt and shows varying degrees of
synergy with added salt. For ranking inhibitors at dosed 2500 ppm, the test results indicated
the best chemicals is Inhibex Bio800 followed by Inhibex 101, Hybrane, PVCap 12k+TBAB,
and Inhibex 501. Whereas at dosage of 5000 ppm, Inhibex Bio-800 inhibited hydrate
formation as well as Inhibex 101.

ii
ACKNOWLAGEMENT
This thesis would not have been successful without my supervisor, Malcolm Kelland
who gave me an opportunity to do this research work. I wish to express gratitude to him for
his abundantly helpful and offered invaluable assistance, support and guidance throughout the
study. Special thanks also to PhD student Pei Cheng Chua for her assistant in the lab and for
all the help.
I would also like to convey thanks to Elizaveta Dmitrievna Stepennova for sharing the
results.
I am grateful to all graduate friends who alway been there.
It is a pleasure to thank my friends in Thailand and Norway for their warm and moral
support.
Deepest gratitude is also to my husband for his understanding, untiring effort in
encouraging, supporting and loving.
Last but not the least, I wishes to express my love and gratitude to my beloved father
and mother for their unconditional and endless love.
Chittawan Nakarit

iii
TABLE OF CONTENTS
Page
ABSTRACT
1 INTRODUCTION .............................................................................................................. 1
2 LITERATURE REVIEW ................................................................................................... 3
2.1 Gas hydrates definition and discovery ........................................................................ 3
2.2 Gas hydrates structure ................................................................................................. 4
2.2.1 Structure I............................................................................................................. 5
2.2.2 Structure II ........................................................................................................... 5
2.2.3 Structure H ........................................................................................................... 5
2.3 Hydrate formation and dissociation process ............................................................... 7
2.3.1 Hydrate nucleation ............................................................................................... 7
2.3.2 Hydrate growth .................................................................................................... 7
2.3.3 Hydrate dissociation............................................................................................. 8
2.4 Chemical inhibition and hydrate removal ................................................................... 9
2.4.1 Thermodynamic hydrate inhibitors (THIs) .......................................................... 9
2.4.2 Low Dosage Hydrate Inhibitors (LDHIs) .......................................................... 11
2.5 Test apparatuses for inhibitors .................................................................................. 13
2.5.1 Screening method............................................................................................... 13
2.5.2 High pressure autoclave ..................................................................................... 13
2.5.3 Rocking cell ....................................................................................................... 15
2.5.4 Circulating loop ................................................................................................. 17
2.6 Classes of KHIs ......................................................................................................... 18
2.7 The onset of hydrate formation, to and the catastrophic growth process, ta .............. 21
2.8 The cooling methods ................................................................................................. 22
2.8.1 The isothermal method (constant temperature) ................................................. 23
2.8.2 The constant cooling method ............................................................................. 23
2.8.3 The ramping method .......................................................................................... 24
3 EXPERIMENTAL............................................................................................................ 25
3.1 Chemicals and gas ..................................................................................................... 25
3.2 The Rocking Cell RC 5 test equipment (PSL Systemtechnik, Germany) ................. 26

iv
TABLE OF CONTENTS (Continue)
Page
3.2.1 The rocking cell test equipment. ........................................................................ 26
3.2.2 The test procedure .............................................................................................. 28
3.3 Standard parameter. ................................................................................................... 37
4 RESULT AND DISCUSSION ......................................................................................... 39
4.1 Effect of different RC5 on KHIs performance .......................................................... 39
4.2 Effect of the cells conditioning ................................................................................. 41
4.3 Effect of rocking cell and autoclave apparatus on KHIs performance ..................... 42
4.4 Effect of magnet on KHIs performance .................................................................... 44
4.5 Effect of concentration on KHIs performance .......................................................... 46
4.6 Effect of adding sodium chloride in the solution on KHIs performance .................. 48
4.7 Ranking of inhibitors at 2500 ppm ............................................................................ 50
4.8 Ranking of inhibitors at 5000 ppm ............................................................................ 54
5 CONCLUSION ................................................................................................................ 56
REFERENCES ........................................................................................................................ 57
APPENDIX A Results of RC5 test .......................................................................................... 61
APPENDIX B Results of autoclave test .................................................................................. 63
APPENDIX C Percentage deviation from average of To and Ta ............................................. 64
APPENDIX D Abbreviation .................................................................................................... 66

v
LIST OF FIGURES
Page
Figure 2.1 Formation of gas hydrate plugged in a subsea pipeline
Picture from Petrobras (Brazil)............................................................................................ 3
Figure 2.2 Molecular structures of gas hydrate.................................................................... 4
Figure 2.3 The inclusion of gas molecules in the gas hydrate lattice
The molecular-sized “cages” are composed of hydrogen-bonded water molecules
(reproduced from SETARAM)............................................................................................. 4
Figure 2.4 The three hydrate crystal structure...................................................................... 6
Figure 2.5 Hydrate formation hypothesis............................................................................. 7
Figure 2.6 Diagram of temperature and pressure trace for methane hydrate formation........8
Figure 2.7 Pressure-temperature diagram for a typical natural gas hydrates........................ 9
Figure 2.8 Sapphire cell high-pressure test apparatus.........................................................14
Figure 2.9 Top view of a stainless steel autoclave and screw-top...................................... 14
Figure 2.10 Rocking cell equipment....................................................................................15
Figure 2.11 The sapphire cell..............................................................................................15
Figure 2.12 Rocking cells used by Shell GSI. The photo at the left shows an individual
cell and the main parts of which compost of: the 1’’ tee (1), the end-nuts (2), the pressure
transducer (5), a HP quick-connect gas inlet (6), a ball valve (8) and O-ring tightened
blind flanges (11). The picture at the right shows the whole cell that containing 24 cells,
as it is mounted to the seesaw...............................................................................................16
Figure 2.13 A micro loop hydrate testing apparatus............................................................17
Figure 2.14 A wheel-shaped flowloop (Sintef, Norway)....................................................18
Figure 2.15 The “Lyre loop” multiphase flowloop for the study of hydrates in pipelines
at IFP (French Petroleum Institute) near Lyon, France..........................................................18
Figure 2.16 Poly-N-vinyllactam polymers: polyvinylpyrrolidone (PVP),
polyvinylcaprolactam (PVCap) and vinylpyrrolidone:vinylcaprolactam copolymer
(VP:VCap)............................................................................................................................19
Figure 2.17 N-methyl-N-vinyl acetamide: vinyl caprolactam copolymer (VIMA:VCap)
and vinyl caprolactam:dimethylaminoethylmethacrylate copolymer (VCap:DMAEMA).....19

vi
LIST OF FIGURES (Continue)
Page
Figure 2.18 Chemical structural of an anti-freeze protein (or ice-structuring protein)
from the winter flounder.......................................................................................................20
Figure 2.19 The three main steps of the hydrate formation process.....................................21
Figure 2.20 A tested result of the isothermal KHI method (Luvicap 55W from BASF,
containing a 1:1 vinylcaprolactam:vinyl pyrrolidone copolymer)........................................23
Figure 2.21 The typical graph of a constant cooling KHI method........................................24
Figure 2.22 A ramping KHI test graph.................................................................................24
Figure 3.1 The rocking cell test equipment that consists of SNG gas bottle (1),
control panel (2), gas booster (3), the protection cover (4), RC5 main unit (5),
and the tempering bath (6)....................................................................................................27
Figure 3.2 The 5 test cells of rocking cell.............................................................................28
Figure 3.3 The main window of WinRC..............................................................................33
Figure 3.4 The schedule of WinRC......................................................................................34
Figure 3.5 The sample data file of Inhibex 101 at concentration 2500 ppm (part)...............36
Figure 3.6 A graph of pressure and temperature vs. time of 2500 ppm Inhibex 101
with constant cooling method...............................................................................................37
Figure 4.1 The onset temperature for KHIs from 2012 and 2011 RC5................................40
Figure 4.2 Graphic results of the cells conditioning with several inhibitors........................42
Figure 4.3 Experimental data showing To of different KHIs at 2500 ppm with RC5
and autoclave apparatus....................................................................................................... 44
Figure 4.4 The usage and position of magnets in tempering bath of new RC5.....................45
Figure 4.5 The use of magnet results compare with without magnet at 2500 ppm of
Luvicap 55W........................................................................................................................46
Figure 4.6 The results comparison of different inhibitors at concentration between
2500 and 5000 ppm..............................................................................................................48
Figure 4.7 Average onset temperature for inhibitors in DI water and 0.5 wt% NaCl..........50
Figure 4.8 Inhibitor ranking results at concentration 2500 ppm...........................................53
Figure 4.9 Inhibitor ranking results at concentration 5000 ppm...........................................55

vii
LIST OF TABLES
Page
Table 2.1 Physical constants of inhibitors............................................................................10
Table 3.1 The SNG composition.........................................................................................26
Table 3.2 The concentrations of the gas hydrate inhibitors..................................................26
Table 3.3 Standard parameter..............................................................................................38
Table 4.1 The effects of different RC5 on gas hydrate formation with several KHIs...........39
Table 4.2 The Average To/Ta (oC) of the cells conditioning with various KHIs..................41
Table 4.3 Measured the onset temperature (To) and catastrophic hydrate formation
temperature (Ta) of several KHIs in rocking cell and autoclave equipment.........................43
Table 4.4 Average To and Ta of Luvicap 55W at 2500 ppm with/without magnet in
RC5 equipment.....................................................................................................................45
Table 4.5 Average To and Ta of various inhibitors at 2500 ppm and 5000 ppm..................47
Table 4.6 Influence of NaCl added to KHIs performance....................................................49
Table 4.7 KHIs performance ranking at concentration 2500 ppm..........................................52
Table 4.8 KHIs performance ranking at concentration 5000 ppm........................................54
1
1 INTRODUCTION
The formation of water and gas molecules into a solid phase known as clathrates are
called gas hydrates [1]. Gas hydrates are one of the serious economic and safety problems in
petroleum industry during the exploration, production, processing and transportation of
natural gas and liquid [2]. Pipelines and processing equipment can be blocked by their
formation [3]. These blockages reduce and stop flow potential that means production loss or
operation shut down. Formation of gas hydrates can take place during operation and shut in
periods [4]. It can be very difficult and costly to remove them [5].
Normally appearance of gas hydrates are under high pressure (>30 bar) and low
temperature (<20oC) condition. The fluid compositions also affect its formation [6]. These are
regular situations for seabed or cold climate wet gas or multiphase flow lines (oil/water/gas)
[4]. Nowadays, exploration and production of petroleum are moving to more extreme
conditions. Hence, the problem of gas hydrates formation is more challenging [7]. Numerous
approaches have been developed to protect against gas hydrate plugging. The four
preventative methods of gas hydrates plugging in industry are removing the water
(dehydration), heating the gas to temperature above the hydrate equilibrium at the operating
pressure, keeping pressure below the hydrate equilibrium at the operating temperature, and
using chemicals [8].
Although all of these procedures theoretically prevent hydrate formation, some of
them are not suitable for the field. For example, dehydration may not be desirable for
offshore operation because of space limitation for process equipment, therefore operators
usually rely on chemical inhibitors [9]. Within the method of chemical control,
thermodynamic inhibitors (THIs) are the most popular. THIs work by shifting the hydrate
equilibrium curve to lower temperature and higher pressure condition [10]. However, these
inhibitors are not only economical at high water cuts but also pose many environmental and
logistical issues [11]. A Recent chemical method is usage of low dosage hydrate inhibitors
(LDHIs) which have been utilized in the last two decades to accommodate the economical
and HSE concerns. LDHIs are sub-divided into kinetic hydrate inhibitors (KHIs) and anti-
agglomerates (AAs) [12-14]. Both of them do not change the thermodynamic condition of
hydrate formation, but they limit or delay nucleation and growth [7]. In order to test LDHIs

2
performance, different testing equipment have been verified such as miniloop, large loop,
autoclave and rocking rig [15].
In the present study, the performance of KHIs is evaluated in rocking cells. The
objectives are verification and validation of results from a new rocker rig instrument by
comparing with the old one that is already available in UIS. Effect and efficiency of several
KHIs studies are also included. Furthermore, many studies have focused on new inhibitors
and have demonstrated enhanced performance in the autoclave and rocking cell tests.
However no studies have compared the performance of inhibitors between these two
apparatuses. Thereby one of the purposes in this thesis is comparison of the results with 2
sizes of autoclave equipment under the same conditions of KHI concentration, SNG gas,
pressure, and temperature. This study will be useful for further education or industry.

3
2 LITERATURE REVIEW
2.1 Gas hydrates definition and discovery
Gas hydrates are solid ice-like crystalline structures which consist of natural gas
molecules are entrapped within cavities of water molecules. The crystalline compounds
typically form at low temperature and high pressure conditions [4, 8].
In 1810, Sir Humphrey Davy discovered hydrates. It became an important issue in
natural gas industry five decades later [16]. In 1934, Hammersmidt found that a hydrate
blocked a flowline of oil and gas during transportation and production, like the one presented
in Figure 2.1. Hydrates are not only a danger to oil and gas production installations, but they
are also harmful to the people who work with them [17]. Since hydrates can plug the pipe, the
pressure in pipe can be separated into two sections. The first part is upstream part that has
high pressure and the other is downstream area which has low pressure. This different
pressure can cause a rupture in the pipe segment by causing a plug solid projectile which is
very dangerous and can lead to loss of human lives [18]. Therefore hydrate prevention and
elimination methods with various approaches have been investigated and developed.
Figure 2.1 Formation of gas hydrate plugged in a subsea pipeline. Picture from Petrobras
(Brazil) [19].

4
2.2 Gas hydrates structure
Hydrates are formed by hydrogen bond among water molecules. Results of these
compounds molecule align to stabilize and precipitate into solid mixture [3]. Formation of
gas hydrates cause by contacting of small guest molecule (< 0.9 nm.) such as methane or
carbon dioxide with host under optimum temperature and pressure [1]. The host and guest
molecules are defined as water molecules and the other compounds those stabilize the crystal
[3]. Individual small guest molecule is entrapped in a cage of water molecules that has
hydrogen bond between them as shown in Figure 2.2 and 2.3 [4, 8, 19]. A guest molecule is
free to rotate within the cavity of water molecules because they have no bonding between
host and guest molecule [3].
Figure 2.2 Molecular structures of gas hydrate [19].
Figure 2.3 The inclusion of gas molecules in the gas hydrate lattice. The molecular-sized
“cages” are composed of hydrogen-bonded water molecules (reproduced from
SETARAM) [19].

5
Gas hydrates can form in three different crystalline structures depending on the
composition of natural gas implicated during forming [8, 20]. These three structures are
discussed in sections 2.2.1-2.2.3 below.
2.2.1 Structure I
Structure I (SI), Type I, and cubic structure I (CSI) are the same structure. SI holds
small guest molecules (0.4-0.55 nm.) [1] or gases smaller than propane [21]. SI predominates
in natural environments [1]. Figure 2.4a illustrated SI that is 6 large 512
64 water cages and 2
small 512
water cages per unit cell. (An
can be interpreted as, A is the face sides number of a
cage and n is the number of faces in the cage holding) [14].
2.2.2 Structure II
Structure II (SII) is sometimes called a Type II or cubic structure II (CSII). SII
contains gas guest molecule which are larger than SI (0.6-0.7 nm.) [1]. SII typically occurs
with a few percent of molecules larger than ethane [13, 21]. This kind of structure is the most
plentiful structure in the oil field environment that has 8 large 512
68 water cages and 16 small
units of 512
water cages per unit cell [14]. This is probably because larger hydrocarbons are
present such as pentane and can fill in larger 512
68 cages, whereas smaller hydrocarbons for
example CO2 and H2S can fill in smaller 512
cages [22]. Molecules which are less than ~0.35
nm. in size are too small to stabilize into any cavities, while molecules size that are larger
than 0.75 nm. are too large to fill within any cages to form structure I and II [13]. The other
smallest gas molecules such as Ar, Kr, O2 and N2 those have diameter lower than 0.44 nm.
form SII as well. The guest molecule size with SI and SII are shown in Figure 2.4b [1].
2.2.3 Structure H
Structure H (SH), Type H, or Hexagonal structure H (HSIII) is more complex than SI
and SII [3]. In the oil and gas industry, this structure it is rarely found [4]. They form only
when gas (guest molecules) are consisting of both small and large in sizes (0.8-0.9 nm.) [1].

6
All of three structures commonly contain only one non-polar guest molecule within
each cage. A size of guest molecule has to be big enough to stabilize in cavity, but not too big
to fill the cavity [13]. However, under unusual conditions such as at very high pressure they
can have multiple cage occupancy with unusually small guest molecules e.g. hydrogen and
noble gasses [1, 23].
Figure 2.4 The three hydrate crystal structure [1].

7
2.3 Hydrate formation and dissociation process
Hydrate nucleation and growth may have the same process as crystallization process
such as precipitation of salt from solution. Gas hydrate formation is a time dependent process
that can be divided into hydrate nucleation, hydrate growth and dissociation as illustrated in
Figure 2.5 [8].
2.3.1 Hydrate nucleation
Hydrate nucleation is the process that produces a small labile cluster. It is called a
hydrate nuclei. This cluster consists of water and gas molecules. It grows, disperses and tries
to grow further because a labile cluster is unstable and ready for continuous changing [8].
The general hydrate gas formation formula is expressed by equation below.
M (g) + nH2O (l) ↔ M•nH2O (s) (1)
Where M is natural gas molecules, n is number of water molecules required to form a gas
hydrate per one molecule of gas, and M•nH2O is gas hydrate [7, 16].
Figure 2.5 Hydrate formation hypothesis [7, 13].
2.3.2 Hydrate growth
After the hydrate crystal nucleation step, the crystal growth process occurs continuity
to agglomerate gas hydrate as in Figure 2.5. The combination of three parameters should be
considered. These are the kinetics of crystal growth at the surface of hydrate, mass transfer
components to the growing surface, and heat transfer away from the growing surface. The

8
major factors are mass and heat transfer of growth process as illustrated in Figure 2.6. They
carry out at constant volume and temperature changes during an experiment. From point 1,
that gas reacts with water after that the pressure is reducing linearly with temperature. There
is no hydrate formation during 1 and 2 period which is defined as induction time (nucleation
time, induction period or lag time) because of metastability [8, 13]. Induction time is time
taken from entering to hydrate forming region and the onset of hydrate formation [9]. Point 2
is the beginning of hydrate formation. After that pressure dramatically falls to point 3, the
result in rapid hydrate growth through the end of growth for hydrate formation at point 3.
After the system is heated, hydrate dissociation start from point 3 to A. Hence, the pressure
slightly increases at the beginning and then sharply rises until point A. This point is called the
hydrate equilibrium temperature and pressure [8]. However, the information for the crystal
growth rate after nucleation still has limited.
Figure 2.6 Diagram of temperature and pressure trace for methane hydrate formation [13].
2.3.3 Hydrate dissociation
Hydrate dissociation is an endothermic and vital process to eliminate hydrate crystal
which blocks pipelines in oil and gas industry. Thus decomposition of gas hydrate to water
and gas molecules can be success by supply external heat to destroy hydrogen bond between
water molecule and van der Waals interaction between host and guest molecule [8]. There are

9
different approaches which can be applied to mitigation a plug of gas hydrate such as
dehydration, heat management, and chemical inhibition [8, 24].
All of three methods have been used in the field. Among these methods, chemical
inhibition is the most common to prevent and reduce gas hydrate formation [25].
2.4 Chemical inhibition and hydrate removal
Chemical inhibitors are generally classified to two different forms for preventing
hydrate blockage in pipeline. These two classes are as follow [4].
2.4.1 Thermodynamic hydrate inhibitors (THIs)
THIs or hydrate antifreezes are the most common chemicals used for hydrate
inhibition. They act by modifying the bulk thermodynamic properties of the fluid system.
Hence, the equilibrium condition for a gas hydrate formation temperature and pressure
becomes lower and higher, respectively [4] as depicted in Figure 2.7. If the application of
THIs are enough in concentration, hydrate will no further form at the operating temperature
and pressure [12].
Figure 2.7 Pressure-temperature diagram for a typical natural gas hydrates [4].
0.0
50.0
100.0
150.0
200.0
250.0
300.0
-5.0 0.0 5.0 10.0 15.0 20.0 25.0 30.0 35.0
Press
ure [
Bar]
Temp. [°C]
Hydrate stability region
No hydrates
present
Hydrate eq.
curve
T (sub-cooling)

10
Alcohols, glycols, and salts are well known chemicals, used for thermodynamic
hydrate inhibition for example methanol (CH3OH) and monoethylene glycol (MEG,
HOCH2CH2OH) are widespread used in production, workover, process operation, and for
melting hydrate plugs. Diethylene glycol (DEG) and triethylene glycol (TEG) are rarely used
for hydrate prevention because of lower efficiency [4] but TEG is the most popular for
dehydration processes [3].
The industry uses the Hammerschmidt equation to estimate the hydrate depression
temperature for THIs in the aqueous liquid as shown in the equation below.
(2)
Where is subcooling, oF
K is constant, depending on the type of solution
X is the required concentration of an inhibitor in an
aqueous solution
M is the inhibitor's molecular weight
K values and molecular weights of inhibitors are given in Table 2.1 [26].
Table 2.1 Physical constants of inhibitors.
Component Molecular weight K-value
Methanol 32 2335
Ethylene Glycol 62.07 2700
Diethylene Glycol (DEG) 106.12 4000
Triethylene Glycol (TEG) 150.17 5400
From the equation, the key parameter for inhibition performance is molecular weight.
For example, MeOH (methanol) has lower molecular weight than DEG so MeOH has better
inhibitor performance than DEG.
Among the THIs, methanol is generally used once and not recovered but discharged
into the environment. Glycol is a little more expensive and is therefore usually regenerated
[3]. Although methanol and glycol are relatively cheap, these chemicals are used at high

11
concentrations in the water phase (10-60 wt.%) [27]. Thereby the recovery and reuse of THIs
are usually considered. Another class of THIs are water-soluble salts, for example sodium
chloride, calcium chloride, and potassium formate. They are used for hydrate prevention in
drilling fluids. Some drilling applications use a combination of salt and glycols. Nevertheless,
high concentration of salt in drilling fluid can increase the corrosion potential. Other THIs
chemicals have been tested but they are currently not used in the field because of more
expensive and lower inhibitor performance than methanol and MEG. Some examples of these
chemicals are dimethylformamide, N-methyl pyrrolidone, ethanolamines and isopropanol [4].
However, there are various problems from these chemicals class e.g. corrosion,
Health, Safety and Environment (HSE) and logistic concerns, high Capital Expenditure
(CAPEX) and Operational Expenditure (OPEX) costs [3, 21, 28]. Due to the disadvantages of
THIs, numerous researchers attempt to develop a new generation of chemicals. The Low
Dosage Hydrate Inhibitors (LDHIs) are the new developed inhibitors. They are called LDHIs
because they can be used in lower concentration than THIs. LDHIs are divided into two main
classes: Kinetic inhibitor (KHIs) and Anti-agglomeration (AAs). The main differences
between THIs and KHIs are the lower concentration needed for KHIs and the mechanism of
hydrate inhibition [17].
2.4.2 Low Dosage Hydrate Inhibitors (LDHIs)
1) Kinetic inhibitor (KHIs)
KHIs are water soluble polymers. They usually consist of other small organic
molecules which are added for efficiency enhancement (synergists). KHIs generally have
small cyclic amide groups as the active units [4, 14, 29]. The purpose of KHIs is to delay gas
hydrate nucleation and crystal growth. The induction time or delay time usually depends on
the degree of subcooling (subcooling, ΔT, is the temperature difference between the hydrate
dissociation temperature and the operating temperature at a given pressure, and is the driving
force for the hydrate formation) [3, 4]. The commercial KHIs generally have maximum
subcooling around 9-10oC (16-18
oF). The main advantage of KHIs are low concentration
usage (<1 wt.%) [4].

12
Due to lower consumption of KHIs compared to THIs, KHIs are becoming more and
more widely used which will affect OPEX/CAPEX saving and extended in the field lifetime
[21]. Moreover, KHIs are cleaner and safer than THIs for the environment. KHIs have both
advantages and limitation. The drawback of KHIs is less than 13oC subcooling application
[17] and short shut-in period when compared to AAs [27, 30]. Common examples of KHIs
are polyvinylpyrrolidone (PVP) and polyvinylcaprolactam (PVCap) [12, 31]. A copolymer of
vinylmethylacetamide (VIMA) and vinylcaprolactam (VCAP), or poly (VIMA/VCAP) show
more advantage of this copolymer than methanol and safer for discharging [9]. The
comparison between PVP and GHI1 (composed of polyvinylpyrrolidone and diethylene
glycol monobutylether in the weight ratio 1:1) was observed in 2010 by Tang CuiPing et.al.
They found that GHI1 had stronger inhibition ability than PVP [7].
The effort has led to development to increase the inhibition performance by the
combination of two approaches or various molecules. For instance, the mixture of KHIs and
corrosion inhibitor (CI) are used in the North Sea [11]. The combination of THIs and KHIs
gives better result [10]. For example, the new hybrid of KHIs and THIs can give longer
induction time (8-12 days) and higher subcooling (17.7oC) than THIs or KHIs alone [14, 28].
2) Anti-agglomeration (AAs)
AAs are one of the LDHI classes. The effective concentration is lower than 1 wt.%
[17]. They work by preventing agglomeration of hydrate crystal into a large size. The
formation of gas hydrate formation still occurs but the crystals do not plug and can be
transported through the pipeline because the size of the gas hydrate crystals is small.
However, they only work when a liquid hydrocarbon phase is present, i.e. crude oil or
condensate. AAs are less independent of time and the degree of subcooling of the system
compared to KHIs. They can be used in deepwater applications [4] but effecting in low water
cut systems [29].
At present, combination of KHIs and AAs are alternatives for delaying hydrate
formation and hydrate plug prevention respectively [17].

13
2.5 Test apparatuses for inhibitors
Gas hydrate inhibition performances of newly synthesized polymers have been
verified by various procedures. These are roughly classified into 2 techniques, screening and
real field fluid/gas flow simulation. Each of them has a specific apparatus. However, results
cannot be compared [32]. These apparatuses are discussed in section 2.5.1-2.5.4 below.
2.5.1 Screening method
This method is simpler than simulating of real flow conditions. Performance testing is
conducted by using a mixture of Tetrahydrofuran (THF) and water for wet gas simulation.
Within the same temperature range, this mixture solution can form hydrate crystals as wet gas
[32]. In the mixtures of THF and water, THF hydrate crystals occur at around 4.4oC at
atmospheric pressure. THF forms SII hydrate which is usually formed by natural gases from
most oil or gas fields [33].
The hydrate crystal growth inhibitions of a single THF have been observed by mixing
sodium chloride (NaCl), THF and distilled water. This solution produces an appropriate
stoichiometric form of THF SII hydrate. In this solution, hydrate formed around 3.2oC [33].
The tested additives are added in solution and kept in a beaker at the atmospheric pressure.
After that, the beaker is immersed in a cooling bath. At thermal equilibrium, the ice crystals
are introduced to THF hydrate formation and growth. Then, the weight and morphology of
the crystal is measured and determined [32, 33].
2.5.2 High pressure autoclave
There are 2 types of autoclave used for hydrate inhibition performance tests: the
sapphire cell equipment and stainless cell steel as shown in Figure 2.8 and 2.9 respectively
[34]. Hydrate formation in autoclave is detected by three apparatuses. These are: 1. visual
detection of hydrate crystals, 2. pressure decline in vessel owing to gas consumption, and 3.
temperature increase (exothermal) since heat is released during the formation of hydrates.
Nevertheless, exothermal detection of hydrate formation is not easy because of the high water
mass used in autoclave [28].

14
Figure 2.8 Sapphire cell high-pressure test apparatus [34].
Figure 2.8 illustrates the sapphire cell in a water bath. A sapphire tube is fitted
between two stainless steel holders with end pieces. The sapphire cell is prepared with a
stirrer mechanism. At the bottom, a stirrer blade is connected to the magnet housing via an
axle. A magnet drive is used to create rotating magnetic field. Sometimes torque exerted on
blade is measured [12]. Visual detection through transparent carbonate plastic cylinders can
be seen by four separate windows at 0o, 90
o, 180
o and 270
o. The temperature control unit
connected with cooler/heater unit. Figure 2.9 shows the stainless steel autoclave which has all
steel parts [34].
Figure 2.9 Top view of a stainless steel autoclave and screw-top [33].

15
2.5.3 Rocking cell
Rocking cell, rocker rig or the ball stop rig is one piece of the LDHIs testing
equipment. The performance tests can be carried out in the sapphire cell (Figure 2.10) or the
stainless steel cell (Figure 2.12). A sapphire rocking cell consists of four individual cells
enclosed in stainless steel (Figure 2.11) [14].
Figure 2.10 Rocking cell equipment [14].
Figure 2.11 The sapphire cell [14].
Another type of rocking cells was made from SS316 (for sweet testing) or a Hastelloy
C276 (for sour testing) as illustrated in Figure 2.12. Each cell contains an SS316 (for sweet

16
testing) or glass (for sour testing) ball which freely rolls inside the horizontal leg when the
cell is rocked.
Small cells or test tubes that contain mixtures of deionized water (DI)/KHIs solution
are pressurized with gas mixture. Then, the cells are located in the cooling bath and rocked. A
ball in each cell will not be moved after the cell is plugged with hydrates [12]. Pressure and
temperature are recording while testing to determine condition of hydrate formation. Hydrate
formation temperature is identified by dropping of pressure inside the cell because of the gas
is entrapped within the ice-like cavities. Hydrate formation temperature can be determined by
dropping pressure point. Hydrate formation can be observed visually as well [14]. The time
when liquid becomes cloudy and/or the time when gas consumption occurred is called the
induction time. The study of THF hydrate and natural gas hydrate can be conducted in
rocking cells. This equipment is simple but effective natural gas hydrate test apparatus for
AAs [12].
Figure 2.12 Rocking cells used by Shell GSI. The photo at the right shows an individual cell
and the main parts, which are comprised by: the 1’’ tee (1), the end-nuts (2), the
pressure transducer (5), a HP quick-connect gas inlet (6), a ball valve (8) and O-
ring tightened blind flanges (11). The picture at the left shows the whole cell
that contains 24 cells, as it is mounted to the seesaw [35].

17
2.5.4 Circulating loop
A complicated piece of equipment used to simulate real field flow conditions is the
vertical placed pipe-wheel or loop-wheel [21]. The pipe usually has a diameter of about 1-3
in and has window for visual observation. It is pressurized and rotated in a cooling bath [12].
Recently, mini loops or micro loops have been developed. A stainless steel pipe loop and a
gear pump with a mixing tank for inhibitors are used to circulate a mixture of water and
liquid hydrocarbon through the loop. The pipe loop is divided to numerous parts where each
part has a thermometer and a differential pressure meter. The pressure drop over a single part
(hydrate formation) is allowed and monitored by the pressure meter [32]. The micro loop
testing, as shown in Figure 2.13, has been tested to match the conventional loop. It is smaller
in size, simpler to operate and easier to maintain. Moreover, it is easy to disassemble and
clean [21].
High pressure loops are most used today with a natural gas, condensate, or oil and an
aqueous phase. They can range from the mini loop such as ¼ in (diameter) to the full scale
pilot loop of 4 in (diameter) or more. The limitation of this equipment is that the pump can
crush hydrates making AA experiments difficult to interpret [12]. Examples of a flowloop
that are larger than miniloop are presented in Figure 2.14 and 2.15.
Figure 2.13 A micro loop hydrate testing apparatus [21].

18
Figure 2.14 A wheel-shaped flowloop (Sintef, Norway) [19].
Figure 2.15 The “Lyre loop” multiphase flowloop for the study of hydrates in pipelines at
IFP (French Petroleum Institute) near Lyon, France [19].
2.6 Classes of KHIs
Several water-soluble polymers have been shown to work as KHI. They prevent
nucleation of hydrate crystals by preventing the growth of gas hydrate embryos to the critical
nuclear size. At that point, the Gibbs free energy becomes negative (ΔG<0). This means the
process of hydrate crystallization goes spontaneous [36]. There are two main keys in KHIs
polymer. The first key factor is requirement of functional group which is typically amide
groups. They have hydrogen-bond with water molecules or gas hydrate particle surface. The
second, a hydrophobic group which is adjacent to or bonded directly to each of the amide
groups [4]. KHIs polymer consist of polyethylene strands with suspended lactam (a N atom
and a C=O group) chemical rings which are approximately spherical in shape and polar.

19
The first KHIs to be discovered was polyvinylpyrrolidone (PVP) at Colorado School
of Mines (CSM) in 1991 [12]. PVP is a five-ring of the series of polyvinyllactams. PVP
without any synergists has subcooling around 3-4oC (5.4-7.2
oF) at 70-90 bar.
The chemical structures of PVP, PVCap and vinyl caprolactam copolymer are shown
in Figure 2.16 and 2.17.
NO
CHCH2
N
CHCH2
O
m n
NO
CHCH2
n
N
CHCH2
O
n
Figure 2.16 Poly-N-vinyllactam polymers: polyvinylpyrrolidone (PVP),
polyvinylcaprolactam (PVCap) and vinylpyrrolidone:vinylcaprolactam copolymer
(VP:VCap) [4].
NO
CHCH2
N
CHCH2 CCH2
O
O
m n n
NO
CHCH2
m
CH3
N
CH3
CH3
H3C
CH3
O
Figure 2. 17 N-methyl-N-vinyl acetamide: vinyl caprolactam copolymer (VIMA:VCap) and
vinyl caprolactam:dimethylaminoethylmethacrylate copolymer
(VCap:DMAEMA) [4].
The key of these KHIs polymer performance is that they adsorb onto the surface of
growing hydrate particles with the polymer pendant group as a “pseudo-guest” in a hydrate
cavity at the crystal surface.
The pendant lactam groups act to “anchor” the polyethylene polymer backbone to the
512
64 hydrate trap surface. The polymer will not allow dislodge. The key properties of KHIs

20
are (1) that the pendant group on the polymer shall fit into a growing of 512
64 cage and (2) the
pendant groups spacing on the polymer backbone have to match the spacing of the growing
512
64 cages on the hydrate crystal surface [15].
The development of current KHIs came originally from a research on an anti-freeze
protein (APFs) or an ice-structuring protein (ISPs) (Figure 2.18) that found in some species
of fish, insects, plants and bacteria. APFs or ISPs compose of polypeptides, they bind to
small ice crystals to inhibit growth and re-crystallization of ice, which would be fatal to the
species. Molecular weight of ISPs are normally about 2-12 kDaltons.
Researcher’s general assumption is that the amide and hydroxyl groups in ISPs bind
with the ice crystal surface which limit and deform their growth. This requires an appropriate
spacing of amide and hydroxyl groups to align with water molecules on the ice surface [36].
Figure 2.18 Chemical structural of an anti-freeze protein (or ice-structuring protein) from the
winter flounder [36].
The system which consists of a high concentration of H2S or CO2 will reduce the
performance of polymeric KHIs. It relates to the relatively high solubility in water when
compared with small hydrocarbon and the fact that these gases are also clatrate hydrate
formers.

21
However, most KHIs field applications are based on polymers from these two classes
(1) vinyl lactam polymer or its copolymer, and (2) hyperbranched polyesteramides [4]. The
detail of classes of KHIs is given in the literature [36].
2.7 The onset of hydrate formation, to and the catastrophic growth process, ta
A performance of kinetic hydrate inhibitors is typically considered in terms of an
induction time. Experiments are usually operated at isothermal and/or isobaric conditions,
which are usually stated in the field operation [2]. The process of hydrate formation can be
divided into three steps; these are a conduction period, a slow growth period and a
catastrophic fast growth period as show in Figure 2.19 [37]. Isothermal test (but not for
constant cooling), kinetic hydrate inhibitors delay the nucleation and typically the growth of
gas hydrates as well [34]. The induction time (the nucleation delay time) is the most critical
factor. It depends on a subcooling (∆T) in the system. The subcooling is usually evaluated as
the driving force for the hydrate formation [2, 34]. When the subcooling is high, the induction
time will be low. An absolute pressure is also an important factor [34].
Figure 2.19 The three main steps of the hydrate formation process. [37]

22
The induction time is defined as the time from the start of stirring in an experiment
until the first sign of hydrate formation or the first sign of gas consumption by hydrate
formation. The induction time can be evaluated by an equation presented below [37, 38].
ti = to-ts (3)
ti = induction time
to = onset time for hydrate formation in the system
ts = time from the start of stirring, defined zero time for the experiment
The slow growth period is measured by the onset time, to, until the onset of
catastrophic growth process, ta. Thus, the definition of the total delay, ttot, at the catastrophic
process is [37]
ttot = induction + slow growth = ta-ts (4)
Since hydrae nucleation is a stochastic process, the induction time has variable values.
In order to avoid the variability, repetition is necessary for each test condition. The inhibitors
usage ranged from 0.5 wt% to 5 wt% and the concentration at 2.5 wt% is the most frequently
used [39].
2.8 The cooling methods
The performance of kinetic hydrate inhibitors test on gas hydrate can be used in
various ways such as
i. The isothermal method [2, 37, 40-44]
ii. The constant cooling method [38, 45] and
iii. The ramping method [31, 46].

23
These three methods are discussed in section 2.8.1-2.8.3 below.
2.8.1 The isothermal method (constant temperature)
In the isothermal method, fluids are cooled down to a certain subcooling with or
without stirring. This condition is maintained at this temperature and held until hydrates
form. The start time of the pressure drop is the induction time (ti) or hold time, although
nucleation may have occurred before but it is not detected. The total time, ttot , can be also
determined. ta is the time when a hydrate plug forms. The period between ti and ta is interval
that hydrate crystals are slowly growing (Figure 2.20). It is called the slow growth time, St-1
[34].
Figure 2.20 A tested result of the isothermal KHI method (Luvicap 55W from BASF,
containing a 1:1 vinylcaprolactam:vinyl pyrrolidone copolymer) [34].
2.8.2 The constant cooling method
This method is performed by cooling down with agitation to very low temperature
(high subcooling) as illustrated in Figure 2.21. If this method is executed in a closed-system
over a short period of time (such as several oC/h rate), ti (induction time) will be difficult to
define because the pressure is also dropping while cooling down the fluids [34].

24
Figure 2.21 The typical graph of a constant cooling KHI method. [34]
A typical graph of pressure and temperature against time from a constant cooling
method experiment in a closed vessel is given in Figure 2.21 [34]. Hydrate formation onset
(to) can usually be observed by the sudden drop in pressure since gas uptake, as well as a
temperature spike due to the heat generated by the exothermic crystallization reaction of
hydrate formation [34, 39].
2.8.3 The ramping method
This method is run by stepwise cooling. By cooling the fluids down to a certain
subcooling then held at this step for a few hours, after that rapidly decrease temperature to a
higher subcooling and held again. This ramping step can be repeated again for several times
until hydrate have formed. (Figure 2.22)
Figure 2.22 A ramping KHI test graph [34].

25
3 EXPERIMENTAL
3.1 Chemicals and gas
- Inhibex 101 (low Mw poly(N-vinylcaprolactam) PVCap in BGE)
- Inhibex 501 (Poly VP/Vcap in BGE)
- Inhibex 713 (Poly VP:VCap:DMAEMA terpolymer in EtOH)
- Luvicap 55W (VP:VCap copolymer)
- Luvicap EG (low Mw PVCap in MEG)
- Luvicap Bio (Poly VCap copolymer inBGE)
- PNIPAM 10k (poly(N-isopropylacrylamide))
- AP-1000 10k (acryloylpyrrolidine)
- Paspartamide (A polyaspartamide-based product)
- Casein Peptone Plus
- Hybrane (hyper-branched polyesteramides)
- PVP 30k (poly(N-vinylpyrrolidone)s)
- PVP 120k
- PVP Plasdone k-12
- PVCap 8.5k
- PVCap 12k
- PVCap 60k
- Pyroglutamate
- Inhibex Bio 800
- Antaron P904 (Agrimer P904 or butylated PVP)
- VIMA (N-methyl-N-vinylacetamide)
- TBAB (Tetrabutylammonium bromide)
- VIM (Vinylimmidazole)
- Sodium chloride (NaCl)
- Synthetic Natural Gas (SNG). The composition of SNG is shown in Table 3.1.

26
Table 3.1 The SNG composition.
Component Concentration (mole %)
Methane 80.4
Ethane 10.3
Propane 5.0
Iso-butane 1.65
n-butane 0.72
N2 0.11
CO2 1.82
The concentrations of the relevant gas hydrate inhibitors are given in Table 3.2.
Table 3.2 The concentrations of the gas hydrate inhibitors.
Hydrate inhibitor Concentration (weight %)
Luvicap 55W 53.8 % in water
Luvicap EG 41.1 % in monoethylene glycol (MEG)
Luvicap Bio 40 %
Inhibex 101 50 % in butyl glycol ether (BGE)
Inhibex 501 50 % in butyl glycol ether (BGE)
Inhibex 713 37 %
Inhibex Bio 800 36 %
3.2 The Rocking Cell RC 5 test equipment (PSL Systemtechnik, Germany)
3.2.1 The rocking cell test equipment.
In this experiment, KHIs performance tests are carried out in RC5 equipment. This
RC 5 was pre-calibrated by the manufacturer before it was delivered to University of
Stavanger (UIS). The set–up of the rocking rig cell test equipment comprises of 5 test cells,

27
RC5 main unit, control panel with gas booster, vacuum pump, the tempering bath, and PC-
accessories with the WinRC software as presented in Figure 3.1.
The booster was used to reach the right pressure when the pressure in the bottle had
lower than operational pressure.
The temperature throughout the test can be seen from the WinRC (computer software)
or/and directly from the cooling bath.
Figure 3.1 The rocking cell test equipment that consists of SNG gas bottle (1), control panel
(2), gas booster (3), the protection cover (4), RC5 main unit (5), and the tempering bath (6).
RC 5 base unit composes of 1. Pressure supply tubes (peek-tube), 2. Temperature
sensor connectors and 3. Test cells that each of test cell consists of the cell body with the
temperature sensor, nut bolts on both sides and a ball (Figure 3.2).
RC 5 has 5 test cells, the volume of each cell is 40 ml, which are able to perform
simultaneous runs. The first RC 5 rocking rig uses a magnetic mechanism to fasten the test
cells in the cooling bath. Whereas, the new RC5 rocking rig used for this experiment does not
have magnets at the bottom of the test cells. Instead, the rocking cells are placed by inserting
the fixing rod below each cell into small drill hole on the cell holder in the cooling bath.

28
Figure 3.2 The 5 test cells of rocking cell.
The movement of the ball inside the test cell from one side to the other blends the test
solution during the rocking. The ball shear forces and turbulences from this movement is the
simulation of fluid flow situation in the pipeline.
3.2.2 The test procedure
The preparation of the chemical experiment and filling of the steel cell is performed
using the same procedure in all high pressure experiment:
1) Preparing KHIs solution
The chemicals to be tested are dissolved in aqueous fluid (0.5% NaCl solution or de-
ionized water) to the desired concentration which are 2500 and 5000 ppm.

29
2) Starting the RC5 equipment
a) Turn the tempering bath on.
b) Switch on the RC5 main unit by pressing the button (on) from front panel. Hold
for more than 3 seconds to avoid problems controlling the temperature from the
WinRC software.
c) Open the software WinRC.
3) Preparing the cells
In the experiment, the cells should be placed on the same platform in the RC5 bath
and should use the same ball and screw cap for their body cell every time. The same
procedure for preparing of inhibitors and filling of the cells is as follows:
a) Place a ball in a cell before filling the solution to prevent loss of fluid.
b) 20 ml of the aqueous solution is added to each cell. Starting from cell 5 will be
easier to place the cells in the RC5 bath. Be careful that the solution may spill
through gas inlet tube when the cell tilts.
c) Fasten the screw-cap (nut bolt) of the cell and liquid by hand tight and by spanner
respectively to avoid leakages.
d) Set the temperature of cooling bath to 20.5oC, 0.9
oC above the hydrate
equilibrium temperature, at the pressure conditions to be used in the test (76 bar).
The results from experiment using the RC5, SNG, and DI water in 2011 gave the
subcooling around 19.8oC at 77 bar (calculated by PVTSim software from Calsep,
Denmark) [47].
e) Use the provided pressure supply tube (Peek tube) to connect the test cell to the
RC5.
f) The cell is placed into the bath containing mainly water with a small amount of
glycol. A cell can be mounted on the axis in the RC5 bath by inserting the fixing
rod of the cell to the corresponding drill hole in the platform. Push and move the
cell a little to ensure that the pin on the platform is locked to the drill hole on the
cell.
30
g) Connect the temperature sensor of the cell to the corresponding socket on the
RC5.
h) Place the protection cover over the bath until finished from testing for safety.
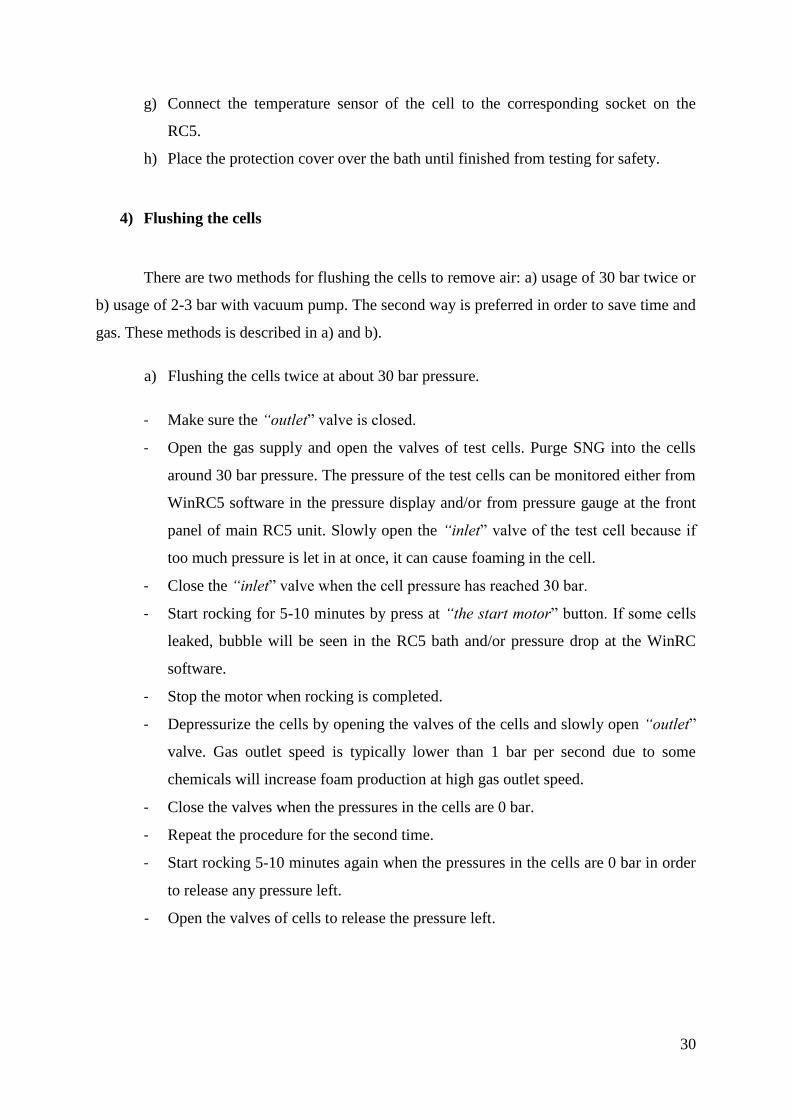
4) Flushing the cells
There are two methods for flushing the cells to remove air: a) usage of 30 bar twice or
b) usage of 2-3 bar with vacuum pump. The second way is preferred in order to save time and
gas. These methods is described in a) and b).
a) Flushing the cells twice at about 30 bar pressure.
- Make sure the “outlet” valve is closed.
- Open the gas supply and open the valves of test cells. Purge SNG into the cells
around 30 bar pressure. The pressure of the test cells can be monitored either from
WinRC5 software in the pressure display and/or from pressure gauge at the front
panel of main RC5 unit. Slowly open the “inlet” valve of the test cell because if
too much pressure is let in at once, it can cause foaming in the cell.
- Close the “inlet” valve when the cell pressure has reached 30 bar.
- Start rocking for 5-10 minutes by press at “the start motor” button. If some cells
leaked, bubble will be seen in the RC5 bath and/or pressure drop at the WinRC
software.
- Stop the motor when rocking is completed.
- Depressurize the cells by opening the valves of the cells and slowly open “outlet”
valve. Gas outlet speed is typically lower than 1 bar per second due to some
chemicals will increase foam production at high gas outlet speed.
- Close the valves when the pressures in the cells are 0 bar.
- Repeat the procedure for the second time.
- Start rocking 5-10 minutes again when the pressures in the cells are 0 bar in order
to release any pressure left.
- Open the valves of cells to release the pressure left.

31
b) Flushing the cells around 2-3 bar by using vacuum pump for depressurization.
- Make sure the “outlet” and “inlet” valve are closed.
- Turn the valve at the outlet pipe to the vacuum pump line. For safety concern, this
valve should be pointed to the ventilation channel when vacuum pump is not used.
- Open the valves of the cells.
- Turn on the vacuum pump.
- Open the “outlet” valve and let it pump ca. 5-10 minutes. (Vacuum pump can
remove 99% of air from the cells as the instruction manual)
- Close the “outlet” valve.
- Turn off the vacuum pump.
- Purge SNG into the cells ca. 2-3 bar and use the same procedure in method a).
- Close the valves after the pressures in the cells are 0 bar.
- Rock the cells for 5-10 minutes.
- Use vacuum pump again by open the valves of the cells. Turn on the vacuum
pump, open the “outlet” valve and let it pump ca. 5-10 minutes.
- The SNG ca. 2-3 bar in the cells is released into the laboratory room.
- Close the “outlet” valve.
- Turn off the vacuum pump.
- Turn the valve at the outlet tube to the ventilation line.
The test cells are ready for pressurization process.
5) Pressurizing
a) Make sure all the valves are closed.
b) Open the gas bottle then open “gas 1” valve on control panel and let pressure
reach to the required total pressure.
c) Close “gas 1” valve.
d) Open “gas out” valve
e) Open the cells vales on RC5 main unit.
f) Slowly open the “inlet” valve to be filled.
g) Fill the cells with ca. 76 bar of SNG. Monitor the pressure inside the test cells in
the pressure display of the software WinRC5.

32
h) Close the “outlet” and “inlet” valve of RC5 main unit when the cell pressure has
reached 76 bar.
i) Close “gas out” valve of the control panel.
j) Close the gas bottle.
In case of SNG gas in the bottle has lower than desire, boosting will be use.
6) Boosting
A control panel with gas booster can be provided to add the test cells with gas. The
gas booster is a pneumatic device and can be used to increase the pressure in the test cells.
For example, the booster will be used to set an inlet pressure of only 30 bar (in the bottle) to a
cell pressure of 100 bar. Boosting usage is given in sections a-c below.
a) Make sure that all valves are closed before starting the booster.
b) Start the booster. An increasing pressure can be seen on the pressure gauge on the
RC5 front panel.
c) Turn the booster off when the pressure reaches the desired pressure.
There is high pressure in RC5 main unit for purging SNG into the cells in further
experiment.
7) Computer setting
The computer program setting is depended on the different method of cooling. After
open WinRC program, the main window will show as in Figure 3.3. This window consists of
two sheets (“Parameter” and “Monitor”) and numeral control sections.
The “Monitor” sheet comprises graphs and tables for the measure of pressure and
temperature values. The first five rows of the table are the pressure values from cell 1-cell 5
(P1 – P5). The second five rows of the table display are the temperature of temperature
sensor for cell 1-cell 5 (T1 – T5) and the sixth rows display is the bath temperature.

33
Figure 3.3 The main window of WinRC.
To create a new setting selects the “Parameter” sheet in the main window (Figure
3.4). The schedule can be set in a table. Each row of the table represents an experimental
step. The settings in Figure 3.4 are used for constant cooling method and the test procedure as
follows:
Step 1: The cooling bath temperature is adjusted to 20.5oC which is the start
temperature in the experiment. The cell fluids are cooled slowly from 20.5oC to 2.0
oC over
18.30 h with a constant cooling rate.
There are two types of command in the “Command” column: 1. Flowing and 2. Shut-
in. At flowing commands can be set for the rocking rate and angle but for shut-in program
only the angle to hold the test cells positions can be set. Standard conditions for this
experiment are flowing command, 20 rocking rates (the number of full swings per minutes
for the test cell) and 40 angles (the angle that the test cells are tilted). Select the “Ramp” to
set the target temperature, step width and step duration. In this test, the temperature is
decreased by 0.1oC per 6 minutes throughout the step 1.

34
Step 2: Leave hydrate to grow at 2oC for 1 h. This step usually gives a hydrate plug.
For some chemicals which have higher concentrations, more time than 1 h is needed to plug
the cells.
Step 3: Heat the cells fast up to 25oC and hold at this temperature for 1 h to melt the
hydrate formation.
Step 4: Cool the cells down to 20.5oC for 20 min. This condition is ready for next
experiment.
Select “Start recording” button.
These four steps are used throughout the experiment.
Figure 3.4 The schedule of WinRC.

35
8) Depressurizing
a) To avoid the gas release into the lab room, make sure that the T-valve at the outlet
pipe turns to ventilation chamber.
b) Open the cell valves at RC front panel.
c) Slowly open the “outlet” valve (around 1 bar per second).
d) Monitor the pressure of the test cells in the pressure display of WinRC software.
Close the valve when the pressure is 0.
e) Remove and clean the test cells.
9) Cleaning the cells
a) For safety, the pressure inside the cells should be 0. Opening the test cells when
they are still under pressure can lead material damage and/or injures.
b) Disconnect the pressure line from the cell.
c) Disconnect the temperature sensor of the test cell.
d) Remove the test cells from RC5 bath. For simplicity, start from cell 1.
e) Open the screw-cap on one side of the test cell by using spanner.
f) Empty the cell.
g) Clean the cell, the ball and the nut bolt follow by these steps:
i. Detergent (ex. Zalo) + water
ii. Tap water (All the detergent should be removed from the cell because
zalo is surfactant which may be effect to the test result.)
iii. Acetone
iv. Distilled water
h) Dry the cell by using an air gun.
10) Result/Evaluation
Data recorded during the test is saved in a data file (csv-format). The values of this
data are separated by semicolon. A data file comprises a file header and a table with the
measurement values as illustrated in Figure. 3.5.

36
Figure 3.5 The sample data file of Inhibex 101 at concentration 2500 ppm (part).
The onset of hydrate formation is determined by the beginning of the deviation from
the constant pressure drop due to the decrease of temperature. The temperature at this point is
recorded (To). Whereas the temperature at the fast catastrophic hydrates formation (Ta) takes
place at the start of the dramatic pressure drop. An example of the data recorded has shown in
Figure 3.6.

37
Figure 3.6 A graph of pressure and temperature vs. time of 2500 ppm Inhibex 101 with
constant cooling method.
Pressure and temperature inside the test cells are recorded throughout the experiment.
In Figure 3.6, a blue color line showed the temperature data. This temperature can be read
from the right of Y-axis. The red line on the top represents pressure value. At the point that
pressure start to deviate from a black tiled line, the pressure, time (to) and temperature (To) is
around 67 bar, 970 minutes and 5oC respectively. Fast pressure drop occurs after ca. 1100
minutes (ta) at pressure and temperature (Ta) about 63 bar and 2oC respectively.
3.3 Standard parameter
Standard parameter is used in this experiment is given in Table 3.3.

38
Table 3.3 Standard parameter
Parameter Value
Volume of solution 20 ml
Rocking rate 40 rocks per minute
Rocking angle 40o
Concentration 2500 ppm and 5000 ppm
Rocking ball Steel ball

39
4 RESULT AND DISCUSSION
The following discussions are experimental results, which are categorized by the
effects of various parameters and the study objectives. This study was performed to
determine the average onset temperature (To) and catastrophic hydrate formation temperature
(Ta) of KHIs by using rocking cell. All of the results can be seen in Appendix A.
4.1 Effect of different RC5 on KHIs performance
To verify and validate the results of a new rocker rig instrument, the comparison
between the RC5-2012 and the RC5-2011 was used in this experiment. The RC5-2011
equipment has been available in UIS since 2011. Both of RC5s are the same model but they
have a few internal differences. The old one has magnet on platform in the RC5 bath and
under the cell body to fasten them together, but the new one does not.
The results of the KHIs performance tests are given in Table 4.1.
Table 4.1 The effects of different RC5 on gas hydrate formation with several KHIs.
Inhibitor, concentration Average To/Ta (oC)
RC5-2012 RC5-2011
Inhibex101, 5000 ppm 0/0 3.1/-
Luvicap 55W, 5000 ppm 3.6/2.8 6.2/3.4
Inhibex101, 2500 ppm 3.9/2.2 4.8/3.1
Inhibex501, 5000 ppm 4.1/2.3 7.1/2.4
Inhibex501, 2500 ppm 6.0/4.0 8.4/4.9
Luvicap 55W, 2500 ppm 6.5/5.4 7.8/5.8
Luvicap EG, 2500 ppm 8.3/7.7 8.7/8.1
PVP 120k, 5000 ppm 11.6/10.1 13.6/12.9
Agrimer 30(PVP 30k), 5000 ppm 12.7/11 12.2/11.7
DI water 17.5/17.5 17.6/17.6
*The cooling down method was maintained at 2oC for 1 hour.
**(-) means cannot find the fast growth temperature at 2oC with 1 hr holding time.

40
To and Ta of inhibex 101 (5000 ppm) are zero because there was no hydrate formation
in the new RC5. For the other one, hydrates formed at 3.1oC but it did not plug at 2
oC even
with an hour holding period at that temperature.
The onset temperatures from experimental are presented in Figure 4.1. The RC5-2012
shows a lower onset temperature than the old RC5 for high performance inhibitors such as
Inhibex 101, Inhibex 501 and Luvicap 55W at concentration 2500 and 5000 ppm. Whereas
the To from new RC5 are nearly the same with the old RC5 for the chemicals which are low
performance KHIs.
* The cooling down method was maintained at 2 oC for 1 hour.
Figure 4.1 The onset temperature for KHIs from 2012 and 2011 RC5.
0
3.6 3.9 4.1
6.0 6.5
8.3
11.6 12.7
17.5
3.1
6.2
4.8
7.1
8.4 7.8
8.7
13.6
12.2
17.6
0
2
4
6
8
10
12
14
16
18
20
Inh
ibex
10
1, 5
00
0 p
pm
Lu
vic
ap 5
5W
, 5
00
0 p
pm
Inh
ibex
10
1, 2
50
0 p
pm
Inh
ibex
50
1, 5
00
0 p
pm
Inh
ibex
50
1, 2
50
0 p
pm
Lu
vic
ap 5
5W
, 2
50
0 p
pm
Lu
vic
ap E
G,
25
00
pp
m
PV
P 1
20
k, 5
00
0 p
pm
Agri
mer
30
(PV
P 3
0k
), 5
00
0 p
pm
DI
wat
er
On
set
tem
per
atu
re,
To (
oC
)
Inhibitor
RC5-2012
RC5-2011

41
4.2 Effect of the cells conditioning
To understand the effect of the residual internal chemicals from manufacturing, the
experiment was conducted with numerous chemicals at the same condition after receiving
RC5 (early) and three months later (later). The results are shown in Table 4.2 and Figure 4.2.
Table 4.2 The Average To/Ta (oC) of the cells conditioning with various KHIs.
Inhibitor Average To/Ta (oC)
Later Early
Inhibex Bio800, 2500 ppm 2.6/- 2.6/-
Luvicap 55W, 5000 pppm 3.6/2.8 4.5/4.0
Inhibex101, 2500 ppm 3.9/2.2 5.2/2.6
Hybrane, 2500 ppm 4.5/4.5 6.0/5.6
Inhibex501, 2500 ppm 6.0/4.0 6.7/4.7
Luvicap 55W, 2500 ppm 6.5/5.4 6.8/5.9
Luvicap EG, 2500 ppm 8.3/7.7 9.1/7.7
DI water 17.5/17.5 18.7/18.7
*(-) means cannot find the fast growth temperature at 2oC with 1 hr holding time
From Table 4.2, 2500ppm Inhibex Bio800 formed hydrate at ~2.6oC but catastrophic
hydrate formation did not occur after holding for an hour at 2oC for both tests. DI water,
which does not contain any additive, has started to form hydrate and plug very fast at the
same temperature (17.5oC).
Figure 4.2 shows that almost all of To values from the first month (early) are higher
than the three month later (later)’s. The reason is impurities from manufacturing and/or losing
of the internal cell’s roughness [47]. Thereby, To and Ta from subsequent experiments were
used for comparative studies of other test parameters.

42
Figure 4.2 Graphic results of the cells conditioning with several inhibitors
4.3 Effect of rocking cell and autoclave apparatus on KHIs performance
Results from the same test conditions (2500 ppm KHI, 76 bar) were compared among
RC5, 200 ml. autoclave and 23 ml. autoclave. Quantities of test samples were 20 ml. (RC5),
100 ml. (200 ml. autoclave) and 11 ml. (23 ml. autoclave). The constant cooling method was
used to cool the solution down from 20.5oC to 2
oC within 18.5 hours with 600 rpm stirring.
The results of autoclave test are presented in Appendix B.
Table 4.3 presents the results with numerous KHIs at 2500 ppm concentration. The
last constant cooling test was conducted without additive (DI water). The average To and Ta
are given in the table. For example, for five tested of Inhibex 501, To values for hydrate
formation were 5.8, 6.2, 6.1, 5.9, and 6.0oC (average 6.0
oC) and the Ta values were 3.9, 4, 4,
4, and 4oC (average 4.0
oC) indicating good reproducibility. Reproducibility was calculated in
percentage by subtracting the result of each cell from the average value of each chemical then
dividing with average value. For all the inhibitors tested in this RC5 study, the reproducibility
2.6 3.6 3.9
4.5
6.0 6.5
8.3
17.5
2.6
4.5 5.2
6.0 6.7 6.8
9.1
18.7
0.0
2.0
4.0
6.0
8.0
10.0
12.0
14.0
16.0
18.0
20.0
Inh
ibex
Bio
80
0, 2
50
0 p
pm
Lu
vic
ap 5
5W
, 5
00
0 p
pp
m
Inh
ibex
10
1, 2
50
0 p
pm
Hyb
ran
e, 2
50
0 p
pm
Inh
ibex
50
1, 2
50
0 p
pm
Lu
vic
ap 5
5W
, 2
50
0 p
pm
Lu
vic
ap E
G,
25
00
pp
m
DI
wat
er
On
set
Tem
per
atu
re,
To (
oC
)
Inhibitor
later
early

43
of To and Ta values are ±18-30% scattering. Reproducibility results of this study are given in
Appendix C.
For autoclave tests, the deviation from average of To and Ta values are ±10-15% in
200 ml steel cell which is better than the smaller size (±20-25%) since the stochasticity of gas
hydrate formation being reduced in the larger cell [33]. Small and clean laboratory apparatus
are most influenced by the stochastic nature of hydrate formation [4].
Table 4.3 Measured the onset temperature (To) and catastrophic hydrate formation
temperature (Ta) of several KHIs in rocking cell and autoclave equipment.
Inhibitor Concentration Average To/Ta (oC)
(ppm) RC5
Autoclave
(200 ml)
Autoclave
(23 ml)
Inhibex 501 2500 6.0/4.0 6.2/4.9 5.4/3.6
Luvicap 55W 2500 6.5/5.4 6.6/6.0 6.7/6.2
Luvicap EG 2500 8.3/7.7 7.5/6.7 8.0/7.3
PVP Plasdone K-12 2500 11.2/10.5 10.5/10.0 10.0/9.5
Agrimer 30(PVP 30k) 2500 13.1/10.8 12.0/10.9 11.5/6.7
DI water 17.5/17.5 13.3/13.3 11.2/11.2
KHIs performance test in RC5 and autoclave was conducted under 76 bar at 2oC in DI
solution. The results from the high performance KHIs such as Inhibex 501, Luvicap 55W and
Luvicap EG were similar with these three equipments whereas the low performance polymers
gave difference To. From figure 4.3, RC5 presents the highest To in the meantime the small
autoclave (23 ml) shows the lowest.

44
Figure 4.3 Experimental data showing To of different KHIs at 2500 ppm with RC5 and
autoclave apparatus.
4.4 Effect of magnet on KHIs performance
As mentioned earlier in section 4.1, the old RC5 has strong magnet on platform and
cell body. This magnet may have an effect on KHIs efficiency. To understand the effect of
magnet, a new RC5 without magnets was ordered from PSL Systemtechnik.
Luvicap 55W at 2500 ppm was used in the test. Figure 4.4 presents five square
magnets that were attached on each platform. The test was performed twice, with and without
magnets.
6.0 6.5
8.3
11.2
13.1
17.5
6.2 6.6 7.5
10.5 12.0
13.3
5.4 6.7 8.0 10.0 11.5 11.2
0.0
2.0
4.0
6.0
8.0
10.0
12.0
14.0
16.0
18.0
20.0
Inhibex 501,
2500 ppm
Luvicap 55W,
2500 ppm
Luvicap EG,
2500 ppm
PVP Plasdone
K-12, 2500
ppm
Agrimer
30(PVP 30k),
2500 ppm
DI water
On
set
Tem
per
atu
re,
To (
oC
)
Inhibitor
RC5
Autoclave (200 ml)
Autoclave (23 ml)

45
Figure 4.4 The usage and position of magnets in tempering bath of new RC5.
The results are summarized in Table 4.4 and depicted in Figure 4.5.
Table 4.4 Average To and Ta of Luvicap 55W at 2500 ppm with/without magnet in RC5
equipment.
Parameter Average To/Ta (oC)
without magnet 6.5/5.4
with magnet 1 6.0/4.9
without magnet 6.5/5.2
with magnet 2 6.6/5.3
From the test, average To of with and without magnet are in the range from 6.0 to 6.6
which are similar. These results show that like the magnet in this experiment has no effect on
the onset temperature, but it is not the final conclusion yet regarding magnets. It may be
because the position of magnet was not put on the right way, or they need to have a stronger
field. More study is necessary to conclude this assumption.

46
Figure 4.5 The use of magnet results compare with without magnet at 2500 ppm of Luvicap
55W.
4.5 Effect of concentration on KHIs performance
Since the active dose of LDHI such as the actual inhibitor alone is often in the range
from 0.2 to 1.0 wt.% (2000-10000 ppm) [36]. Therefore, concentration at 2500 and 5000 ppm
have been chosen for this study. Effect of concentration was examined with various
chemicals. The efficiencies of KHIs at two concentrations are presented in Table 4.5 and
Figure 4.6.
For all of the chemicals, the higher concentration would result in better performance.
Onset temperature of hydrate formation slightly decreased when the concentration increased
for all additive solutions. At 5000 ppm, Inhibex Bio-800 and Inhibex 101 inhibited the
formation of hydrate crystal throughout the test. Inhibitor with higher concentration was not
only preventing hydrate formation but also delaying the fast growth of hydrate. For instance,
when Luvicap 55W was used, the onset temperature reduced from 6.5oC to 3.6
oC and the
catastrophic hydrate formation temperature decreased from 5.4oC to 2.8
oC at 2500 and 5000
6.5
6.0
6.5 6.6
2.0
2.5
3.0
3.5
4.0
4.5
5.0
5.5
6.0
6.5
7.0
without magnet with magnet 1 without magnet with magnet 2
On
set
Tem
per
atu
re,
To (
oC
)
Magnet
with magnet 1
without magnet
with magnet 2

47
ppm respectively. The reasons are; 1) The more inhibitor in the system, the more water is
prevented from participating in the structure of hydrate, thus higher pressures and lower
temperatures are required for hydrate formation from the remaining, uninhibited water [15].
2) The rising of polymer concentration induces a significant increase of solution viscosity
[42]. If the viscosity increases, the solubility of gas in water will be decreased.
Table 4.5 Average To and Ta of various inhibitors at 2500 ppm and 5000 ppm.
chemical Average To/Ta (oC)
5000 ppm 2500 ppm
Inhibex Bio-800 0/0 2.6/-
Inhibex 101 0/0 3.9/2.2
Luvicap 55W 3.6/2.8 6.5/5.4
Inhibex 501 4.1/2.3 6.0/4.0
Paspartamide 187C 6.6/6.6 7.9/7.6
Luvicap EG 7.4/6.5 8.3/7.7
Luvicap Bio 8.4/8.2 11.7/11.1
PVP 120k 11.6/10.1 13.5/11.2
Agrimer 30(PVP 30k) 12.7/11.0 13.1/10.8
*The cooling down method was maintained at 2oC for 1 hour.
**(-) means cannot find the fast growth temperature at 2oC with 1 hr holding
time

48
*The cooling down method was maintained at 2oC for 1 hour.
Figure 4.6 The results comparison of different inhibitors at concentration between 2500 and
5000 ppm
4.6 Effect of adding sodium chloride in the solution on KHIs performance
The most commonly used of THIs classes are alcohols and glycols that are widely
used to protect against hydrate formation and for melting hydrate plugs. Besides these two
chemicals, the other common used chemical class is salts such as sodium chloride, calcium
chloride and potassium formate [4].
In this experiment, application of NaCl in KHI solution was used at 0.5 wt% to
compare with the inhibitor efficiency in DI water solution. Since THIs require at high dosage
(10-50 wt.%) [48] will shift the equilibrium conditions of gas hydrate formation. Hence this
0.5 wt.% NaCl concentration was very low so the bulk thermodynamic properties of the fluid
system will be maintained. Then it can be compared with DI water solution at the same
equilibrium condition.
0 0
3.6 4.1
6.6 7.4
8.4
11.6
12.7
2.6
3.9
6.5 6.0
7.9 8.3
11.7
13.5 13.1
0
2
4
6
8
10
12
14
16
Inh
ibex
Bio
-80
0
Inh
ibex
10
1
Lu
vic
ap 5
5W
Inh
ibex
50
1
Pas
par
tam
ide
18
7C
Lu
vic
ap E
G
Lu
vic
ap B
io
PV
P 1
20
k
Agri
mer
30
(PV
P 3
0k
)
On
set
Tem
per
atu
re,
To
(oC
)
Inhibitor
5000 ppm
2500 ppm

49
The comparison of results between DI water solution and 0.5 wt% NaCl are presented
in Table 4.6 and Figure 4.7.
Table 4.6 Influence of NaCl added to KHIs performance.
Inhibitor Concentration Average To/Ta (oC)
(ppm) 0.5% NaCl DI water
Inhibex Bio-800 2500 2.2/2.0 2.6/-
PVCap 12k+TBAB 2500 4.3/- 5.7/4.7
PVCap 60k+TBAB 2500 5.5/4.5 7.6/6.6
Luvicap 55W 2500 6.2/5.0 6.5/5.4
PVCap 12k 2500 8.3/8.0 8.7/8.4
Vcap:VIM 1:1 2500 9.1/8.2 11.9/11.6
Vcap:VIM 9:1 2500 9.3/8.0 10.1/9.6
PVCap 8.5k 2500 9.7/8.5 9.8/8.8
PVCap 60k 2500 10.0/9.2 11.4/10.8
*Inhibex Bio-800: kept 1 hour at 2oC for DI water solution
kept longer at 2oC for 0.5% NaCl
**(-) means cannot find the fast growth temperature at 2oC with 1 hr holding
time
From Table 4.6, Most of the chemicals have To slightly better in NaCl solution than in
DI water. For example, Inhibex Bio-800 in brine solution gave a slightly lower (2.2oC) onset
temperature than in DI water solution (2.6oC). Ta in DI water case could not be exactly
defined until the 1171st minute because this experiment was maintained at 2
oC only for 1 hr.
On the other hand, Ta in 0.5% NaCl solution is 2oC at the 1276
nd minute due to the longer
holding time at 2oC.
The To of chemicals in the salts solution could be prolonged longer than the chemicals
in water as presented in Figure 4.7 because salts dissociate into ions which form strong
coulombic attractions with water, preventing the water inclusion into the hydrate cages [15].

50
Figure 4.7 Average onset temperature for inhibitors in DI water and 0.5 wt% NaCl.
4.7 Ranking of inhibitors at 2500 ppm
The several chemicals and synergist at concentration 2500 ppm in the Table 4.7 were
ranked in this experiment according to their average onset temperature. The results are given
in Figure 4.8.
From the experiment, the best To value was Inhibex Bio-800 (PVCap copolymer in
BGE). The second to the seventh chemical were Inhibex 101 (PVCap in BGE, Mw=2-5*103),
Hybrane (Hyper-branched polyesteramides), PVCap 12k (Mw=12*103)+TBAB, Inhibex 501
(PVCap:VP 1:1 molar ratio in BGE, Mw=5-8*103), Luvicap 55W (VCap:VP copolymer
1:1)and PVCap 60k (Mw=60*103)+TBAB, respectively. All of the six chemicals are based
on PVCap polymer except Hybrane. The reason is the inhibition mechanism of PVCap-based
KHIs that are: 1) A lactam group fits vertically into an incomplete cage 2) Oxygen in the
carbonyl group forms a hydrogen bonds to water molecules 3) The backbone of polymer lines
between sections or on the surface of the hydrate crystal, and 4) The hydrate crystal structure
is defected because large cages are unable to close [49]
2.2
4.3
5.5
6.2
8.3
9.1 9.3 9.7
10.1
2.6
5.7
7.6
6.5
8.7
11.9
10.1 9.8
11.4
0.0
2.0
4.0
6.0
8.0
10.0
12.0
14.0
Inh
ibex
Bio
-80
0
PV
Cap
12
k+
TB
AB
PV
Cap
60
k+
TB
AB
Lu
vic
ap 5
5W
PV
Cap
12
k
Vca
p:V
IM 1
:1
Vca
p:V
IM 9
:1
PV
Cap
8.5
k
PV
Cap
60
k
On
set
Tem
per
atu
re,
To
(oC
)
Inhibitor
0.5% NaCl solution
DI water

51
According to literature, the two main classes of KHIs field applications in common
commercial are based on PVCap mono-/copolymer and hyperbranched polyester amides [4].
However, these polymer themselves have limitations on the degree of subcooling, induction
time and compatibility with field operating conditions [28]. Therefore, many researches
develop new inhibitors with enhanced properties compared to conventional PVCap-based
KHIs.
Inhibex Bio-800 and Inhibex 501 are the new synergist products. Inhibex Bio-800
gave better result in induction time and max subcooling than Inhibex 501 [28, 50]. Currently
information and detail of these inhibitors are rarely published.
From PVCap-based KHIs, Inhibex 101 had lower To than PVCap 12k+TBAB and
Inhibex 501 since the molecular weight of their chemicals as illustrated in Figure 4.8. The
Mw of Inhibex 101, PVCap 12k, and Inhibex 501 are 2-5*103, 12*10
3 and 5-8*10
3,
respectively. Inhibex 101 has lower Mw than Inhibex 501, thus inhibition performance of
Inhibex 101 is better. The results show that there is an optimum molecular weight that gives
best performance. If molecular weight is below optimum, inhibition effect will not much
because fewer interactions with hydrate surface per polymer chain. If the molecular weight
increases, the number of polymer strands in solution will decrease and some of the
alkylamide side chains will not available for interaction with hydrate surfaces. Therefore,
high molecular weight polymers also have lower efficiency [48].
The ideal molecular weight (Mw) for the performance of a KHI polymer (or
oligomer), is around 1500-3000. Performance of polymer will dramatically drop when
molecular weight is below 1000. However polymer with above 3000-4000 molecular weight
slowly dropping without disappearing. The advantage of low molecular weight polymer is
maintaining a low viscosity of the injected formulation. Thus, samples of commercial
PVCap, the highest performing currently commercial vinyl lactam polymer, have molecular
weights of about 2000-4000 [4].
For PVCap 12k+TBAB and Inhibex 501, PVCap 12k+TBAB had lower To than
Inhibex 501 although PVCap 12k had higher Mw than Inhibex 501. This is caused by TBAB.
Small quaternary salts such as tetrabutylammonium bromide (TBAB) have been used as
VCap polymer synergists in the field [4].

52
Table 4.7 KHIs performance ranking at concentration 2500 ppm
Inhibitor Average To/Ta Inhibitor Average To/Ta
(oC) (
oC)
Inhibex Bio800 2.6/- PVCap 8.5k 9.8/8.8
Inhibex 101 3.9/2.2 Inhibex 713 9.9/9.2
Hybrane 4.5/4.5 AP-1000 10k 10.0/9.3
PVCap 12k+TBAB 5.7/4.7 Vcap:Vlm_9:1 10.0/9.6
Inhibex 501 6.0/4.0 Antaron P904 10.5/9.6
Luvicap 55W 6.5/5.4 PVCap 60k 11.4/10.8
PVCap 60k+TBAB 7.6/6.6 Luvicap Bio 11.7/11.1
Paspartamide 187C 7.9/7.6 Vcap:Vlm _1:1 11.9/11.6
Luvicap EG 8.3/7.7 Agrimer 30 13.1/10.8
PNIPAM 8.5/7.9 PVP 120k 13.5/11.2
Casein Peptone Plus 8.6/8.3 Pyroglutamate 15.5/14.9
PVCap 12k 8.7/8.4 Poly Vlm 16.9/14.5
Vcap:BVIMBr_9:1 9.3/8.8 DI water 17.5/17.5
*(-) means cannot find the fast growth temperature at 2oC with 1 hr

53
Figure 4.8 Inhibitor ranking results at concentration 2500 ppm
2.6
3.9 4.5
5.7 6.0
6.5
7.6 7.9 8.3 8.5 8.6 8.7
9.3 9.8 9.9 10.0 10.1
10.5
11.4 11.7 11.9
13.1 13.5
15.5
16.9 17.5
0.0
2.0
4.0
6.0
8.0
10.0
12.0
14.0
16.0
18.0
20.0
Inhib
ex B
io800
Inhib
ex 1
01
Hybra
ne
PV
Cap
12k+
TB
AB
Inhib
ex 5
01
Lu
vic
ap 5
5W
PV
Cap
60k+
TB
AB
Pas
par
tam
ide
187
C
Luvic
ap E
G
PN
IPA
M
Cas
ein P
epto
ne
Plu
s
PV
Cap
12k
Vca
p:B
VIM
Br_
9:1
PV
Cap
8.5
k
Inhib
ex 7
13
AP
-1000 1
0k
Vca
p:V
lm_9:1
Anta
ron P
904
PV
Cap
60k
Luvic
ap B
io
Vca
p:V
lm _
1:1
Ag
rim
er 3
0
PV
P 1
20
k
Pyro
glu
tam
ate
Po
ly V
lm
DI
wat
er
On
set
Tem
per
atu
re,
To
(oC
)
Inhibitor
Average To

54
4.8 Ranking of inhibitors at 5000 ppm
The seven chemicals with concentration 5000 ppm were ranked in the experiment as
their average onset temperature. The results are given in Table 4.8 Figure 4.9.
Inhibex 101 and Inhibex Bio-800 are the best KHIs because hydrate did not form after
keeping for 1 hour at 2oC. Luvicap 55W and Inhibex 501 have To/Ta at 3.6/2.8 and 4.1/2.3
respectively. The reason is described in section 4.8. All chemicals decrease in To with
increasing the concentrations. The explanation is in section 4.5.
Table 4.8 KHIs performance ranking at concentration 5000 ppm
Inhibitor Average To/Ta (oC)
Inhibex 101 0/0
Inhibex Bio-800 0/0
Luvicap 55W 3.6/2.8
Inhibex 501 4.1/2.3
Paspartamine 187c 6.6/6.6
Luvicap EG 7.4/6.5
Luvicap Bio 8.4/8.2
PVP 120k 11.6/10.1
Agrimer 30(PVP 30k) 12.7/11.0
*The cooling down method was maintained at 2oC for 1 hour.

55
*The cooling down method was maintained at 2oC for 1 hour.
Figure 4.9 Inhibitor ranking results at concentration 5000 ppm
0 0
3.6 4.1
6.6
7.4
8.4
11.6
12.7
0
2
4
6
8
10
12
14
Inh
ibex
10
1
Inh
ibex
Bio
-80
0
Lu
vic
ap 5
5W
Inh
ibex
50
1
Pas
par
tam
ine
18
7c
Lu
vic
ap E
G
Lu
vic
ap B
io
PV
P 1
20
k
Agri
mer
30
(PV
P 3
0k
)
On
set
Tem
per
atu
re,
To
(oC
)
Inhibitor
Average To

56
5 CONCLUSION
In this work, a variety of KHIs’ efficiency had been tested for hydrate inhibition by
using the rocking cell apparatus. The inhibition performances in term of an onset temperature
are determined. The following conclusions can be drawn:
Test results in the first few weeks may be a little worse as the new equipment
is not yet “conditioned”.
The onset temperatures from a new RC5 rocking cell equipment are a little
lower for the high performance inhibitors. Whereas the To from both RC5
units is approximately the same with low performance inhibitors.
RC5 and autoclave cell experiments have similar To trends with the high
performance KHIs such as Inhibex 501, Luvicap 55W and Luvicap EG.
However To is significantly different with the low performance polymers,
especially for the smallest 23ml autoclave. RC5 has a small scattering of an
average To deviation.
Magnets attached to the cells do not affect To.
KHI performance is increased when raising KHI concentration from 2500 ppm
to 5000 ppm.
Blends of these polymers with low NaCl concentration will slightly enhance
the performance beyond the thermodynamic effect of the salt.
Regarding ranking of KHIs, it is found that Inhibex Bio800 has the lowest
onset temperature follow by Inhibex 101, Hybrane, PVCap 12k+TBAB, and
Inhibex 501 at 2500 ppm. Furthermore, the polymer molecular weight is
shown to be critical for optimal performance.
At 5000 ppm, Inhibex 101 and Inhibex Bio-800 are the best KHIs.
Rocking cells are prescreening equipment suitable only for ranking KHIs. To
determine absolute performance of KHIs, large loops and pipe wheels are normally the last
and best step to be carried out before pilot scale or field implementation [4]. Besides the
performance of chemicals, there are numerous issues to be addressed in field applications
such as overall cost, compatibility (cloud point, viscosity, foam, emulsions, other production
chemicals etc.), and environmental impact [48].

57
REFERENCES
1. Sloan, E.D., Fundamental principles and applications of natural gas hydrates.
Nature, 2003. 426(6964): p. 353-363.
2. Arjmandi, M., et al., Is subcooling the right driving force for testing low-dosage
hydrate inhibitors? Chemical Engineering Science, 2005. 60(5): p. 1313-1321.
3. Carroll, J.J., Natural gas hydrates: a guide for engineers. 2009, Amsterdam: Elsevier.
XVII, 276 s.
4. Kelland, M.A., Production chemicals for the oil and gas industry. 2009, Boca Raton,
Fla.: CRC Press. XVII, 437 s.
5. BÁEz, L.A. and P. Clancy, Computer Simulation of the Crystal Growth and
Dissolution of Natural Gas Hydratesa. Annals of the New York Academy of
Sciences, 1994. 715(1): p. 177-186.
6. Lavallie, O., et al., Successful Field Application of an Inhibitor Concentration
Detection System in Optimising the Kinetic Hydrate Inhibitor (KHI) Injection Rates
and Reducing the Risks Associated with Hydrate Blockage, in International
Petroleum Technology Conference. 2009, International Petroleum Technology
Conference: Doha, Qatar.
7. Tang, C., et al., Kinetic studies of gas hydrate formation with low-dosage hydrate
inhibitors. Science China Chemistry, 2010. 53(12): p. 2622-2627.
8. Sloan, E.D. and C.A. Koh, Clathrate hydrates of natural gases. 2008, Boca Raton,
Fla.: CRC Press. XXV, 721 s., pl.
9. Fu, S.B., L.M. Cenegy, and C.S. Neff, A Summary of Successful Field Applications of
A Kinetic Hydrate Inhibitor, in SPE International Symposium on Oilfield Chemistry.
2001, Society of Petroleum Engineers Inc.: Houston, Texas.
10. Wu, M., S. Wang, and H. Liu, A Study on Inhibitors for the Prevention of Hydrate
Formation in Gas Transmission Pipeline. Journal of Natural Gas Chemistry, 2007.
16(1): p. 81-85.
11. Phillips, N.J. and M. Grainger, Development and Application of Kinetic Hydrate
Inhibitors in the North Sea, in SPE Gas Technology Symposium. 1998, Society of
Petroleum Engineers Inc.: Calgary, Alberta, Canada.
12. Kelland, M.A., History of the Development of Low Dosage Hydrate Inhibitors.
Energy & Fuels, 2006. 20(3): p. 825-847.

58
13. Christiansen, R.L. and E.D. Sloan, Mechanisms and Kinetics of Hydrate Formation.
Annals of the New York Academy of Sciences, 1994. 715(1): p. 283-305.
14. Guan, H., The Inhibition of Gas Hydrates and Synergy of the Inhibiting Molecules, in
International Oil and Gas Conference and Exhibition in China. 2010, Society of
Petroleum Engineers: Beijing, China.
15. Sloan, E.D., Natural gas hydrates in flow assurance. 2011, Amsterdam: Elsevier.
XXII, 200 s.
16. Cox, J.L., Natural gas hydrates: properties, occurrence and recovery. 1983, Boston:
Butterworth. viii, 125 s.
17. Igboanusi U.P., A.C.O., The Advancement from Thermodynamic Inhibitors to Kinetic
Inhibitors and Anti-Agglomerants in Natural Gas Flow Assurance. International
Journal of Chemical and Environmental Engineering, 2011. 2(2): p. 131-134.
18. Chatti, I., et al., Benefits and drawbacks of clathrate hydrates: a review of their areas
of interest. Energy Conversion and Management, 2005. 46(9-10): p. 1333-1343.
19. Giavarini, C. and K. Hester, Gas Hydrates: Immense Energy Potential and
Environmental Challenges. 2011, London: Springer London.
20. Sloan, E.D., Hydrate engineering SPE Monograph Series, 2000. 21: p. 1-82.
21. Tian, J., et al., Low Dosage Hydrate Inhibitors (LDHI): Advances and Developments
in Flow Assurance Technology for Offshore Oil and Gas Productions, in Offshore
Technology Conference. 2011, Offshore Technology Conference: Houston, Texas,
USA.
22. Susilo, R., et al., Interactions between Structure H Hydrate Formers and Water
Molecules. The Journal of Physical Chemistry C, 2008. 112(24): p. 9106-9113.
23. Mao, W.L., et al., Hydrogen Clusters in Clathrate Hydrate. Science, 2002. 297(5590):
p. 2247-2249.
24. Makogon, J.F., Hydrates of hydrocarbons. 1997, Tulsa, Okla.: PennWell Books.
XXX, 482 s.
25. Mokhatab, S., W.A. Poe, and J.G. Speight, Handbook of natural gas transmission and
processing. 2006, Oxford: Gulf Professional Publ. XXXI, 636 s.
26. Hammerschmidt, E.G., Gas Hydrate Formations: A Further Study on Their
Prevention and Elimination from Natural Gas Pipe Lines. GAS, 1939. 15(5):
p. 30-35.

59
27. Kelland, M.A., T.M. Svartaas, and L. Dybvik, A New Generation of Gas Hydrate
Inhibitors, in SPE Annual Technical Conference and Exhibition. 1995, Society of
Petroleum Engineers, Inc.: Dallas, Texas.
28. Zheng, J., et al., Innovative KHI Polymers for Gas Hydrate Control, in Offshore
Technology Conference. 2011, Offshore Technology Conference: Houston, Texas,
USA.
29. Storr, M.T., et al., Kinetic Inhibitor of Hydrate Crystallization. Journal of the
American Chemical Society, 2004. 126(5): p. 1569-1576.
30. Fu, B., et al., Novel Low Dosage Hydrate Inhibitors for Deepwater Operations, in
SPE Annual Technical Conference and Exhibition. 2001, Society of Petroleum
Engineers Inc.: New Orleans, Louisiana.
31. Villano, L.D., et al., A Study of the Kinetic Hydrate Inhibitor Performance and
Seawater Biodegradability of a Series of Poly(2-alkyl-2-oxazoline)s. Energy & Fuels,
2009. 23(7): p. 3665-3673.
32. Fink, J.K., Petroleum engineer's guide to oil field chemicals and fluids. 2011,
Amsterdam: Elsevier. XXII, 785 s.
33. Sefidroodi, H., P. Cheng Chua, and M.A. Kelland, THF hydrate crystal growth
inhibition with small anionic organic compounds and their synergistic properties with
the kinetic hydrate inhibitor poly(N-vinylcaprolactam). Chemical Engineering
Science, 2011. 66(10): p. 2050-2056.
34. Del Villano, L. and M.A. Kelland, An investigation into the laboratory method for the
evaluation of the performance of kinetic hydrate inhibitors using superheated gas
hydrates. Chemical Engineering Science, 2011. 66(9): p. 1973-1985.
35. Klomp, U.C. and A.P. Mehta, Validation of Kinetic Inhibitors for Sour Gas Fields, in
International Petroleum Technology Conference. 2007, International Petroleum
Technology Conference: Dubai, U.A.E.
36. Kelland, M.A., A review of kinetic hydrate inhibitors-tailor-made water-soluble
polymers for oil and gas industry applications. Advances in materials science
research, 2012. 8: p. 171-209.
37. Svartaas, T.M., M.A. Kelland, and L. Dybvik, Experiments Related to the
Performance of Gas Hydrate Kinetic Inhibitors. Annals of the New York Academy of
Sciences, 2000. 912(1): p. 744-752.

60
38. Kelland, M.A., T.M. Svartaas, and L.A. Dybvik, Control of Hydrate Formation by
Surfactants and Polymers, in SPE Annual Technical Conference and Exhibition.
1994, Society of Petroleum Engineers, Inc.: New Orleans, Louisiana.
39. Balson, T. Chemistry in the oil industry VII: performance in a challenging
environment. in International Symposium on Chemistry in the Oil, Industry. 2002.
London: The Society.
40. Sloan, E.D., et al., Quantifying Hydrate Formation and Kinetic Inhibition. Industrial
& Engineering Chemistry Research, 1998. 37(8): p. 3124-3132.
41. Cohen, J.M., P.F. Wolf, and W.D. Young, Enhanced Hydrate Inhibitors: Powerful
Synergism with Glycol Ethers. Energy & Fuels, 1998. 12(2): p. 216-218.
42. Cingotti, B., et al., Study of Methane Hydrate Inhibition Mechanisms Using
Copolymers. Annals of the New York Academy of Sciences, 2000. 912(1): p. 766-
776.
43. Lee, J.D. and P. Englezos, Unusual kinetic inhibitor effects on gas hydrate formation.
Chemical Engineering Science, 2006. 61(5): p. 1368-1376.
44. Del Villano, L., R. Kommedal, and M.A. Kelland, Class of Kinetic Hydrate Inhibitors
with Good Biodegradability. Energy & Fuels, 2008. 22(5): p. 3143-3149.
45. Ajiro, H., et al., Study of the Kinetic Hydrate Inhibitor Performance of a Series of
Poly(N-alkyl-N-vinylacetamide)s. Energy & Fuels, 2010. 24(12): p. 6400-6410.
46. Colle, K.S., Oelfke, R.H., Kelland, M.A.,, US Patent 5874660. 1999.
47. Lone, A., Establishing a new high pressure steel multi-cell rocker rig for kinetic
hydrate inhibitor testing. 2011, A. Lone: Stavanger.
48. Kelland, M.A., et al., A New Class of Kinetic Hydrate Inhibitor. Annals of the New
York Academy of Sciences, 2000. 912(1): p. 281-293.
49. Anderson, B.J., et al., Properties of inhibitors of methane hydrate formation via
molecular dynamics simulations. Journal of the American Chemical Society, 2005.
127(50): p. 17852-17862.
50. Zheng, J., et al., Development of innovative polymers as kinetic hydrate inhibitors.
Proceedings of the 7th International Conference on Gas Hydrates (ICGH 2011),
Edinburgh, Scotland, United Kingdom, July 17-21, 2011.

61
APPENDIX A Results of RC5 test
cooling constant method
Temp. (oC) time (hh:mm)
T start 20.5-2 18.30
T low 2 1
T melt 25 1
T end 20.5 0.2
Total time 20 hrs 50 mins
volume 20 ml
rocking rate 20
rocking angle 40
steel ball
date chemical conc.(ppm) To1 To2 To3 To4 To5 Av To Ta1 Ta2 Ta3 Ta4 Ta5 Av Ta to1 to2 to3 to4 to5 Av to ta1 ta2 ta3 ta4 ta5 Av ta comments
2011.11.09 DI water 18.2 19.8 18.8 18.2 18.3 18.7 186 89 145 166 171 151 to=ta and To=Ta
2012.04.04 DI water 17.1 18.0 18.1 17.3 17.2 17.5 205 157 154 202 213 186 to=ta and To=Ta
2011.11.10 Luvicap 55W 5000 4.6 4.1 4.7 5.1 4.1 4.5 4.1 3.4 4.3 4.6 3.8 4.0 1091 1101 1055 1018 1092 1071 1112 1121 1088 1043 1112 1095
2012.01.27 Luvicap 55W 5000 3.2 3.1 4.2 3.4 3.9 3.6 2.4 2.5 3.2 2.6 3.3 2.8 1090 1094 1025 1074 1049 1066 1112 1107 1089 1101 1086 1099
2011.12.16 Luvicap 55W 2500 6.6 6.8 6.1 6.5 7.8 6.8 6.3 5.7 5.0 5.8 6.5 5.9 879 864 910 876 797 865 895 930 976 923 872 919
2012.04.03 Luvicap 55W 2500 5.8 7.4 6.6 6.2 6.3 6.5 4.9 6.6 5.3 5.2 5.2 5.4 930 832 884 906 900 890 980 881 963 967 967 952
2011.12.19 Luvicap EG 2500 8.6 9.3 9.1 9.3 9.3 9.1 7.2 7.7 7.7 8 8 7.7 750 714 715 709 709 719 836 805 802 789 789 804
2012.04.10 Luvicap EG 2500 7.9 7.8 8.3 8.7 8.9 8.3 7.6 7.6 7.9 7.8 7.6 7.7 796 796 973 737 729 806 814 813 797 801 808 807
2011.12.20 Inhibex101 2500 5 5.1 5.4 5.4 5.1 5.2 2.1 2.5 2.5 3.2 2.6 2.6 973 971 953 950 966 963 1117 1108 1107 1095 1101 1106
2012.04.11 Inhibex101 2500 3.8 3.8 3.9 4.1 4.1 3.9 2.1 2 2.1 2.5 2.1 2.2 1062 1055 1047 1035 1033 1046 1117 1118 1112 1108 1114 1114
2011.12.21 Inhibex501 2500 6 7 7 6.7 4.3 4.8 5 4.7 913 855 854 874 1021 995 967 994
2012.04.23 Inhibex501 2500 5.8 6.2 6.1 5.9 6 6.0 3.9 4 4 4 4 4.0 928 899 913 930 914 917 1048 1045 1039 1040 1042 1043
2011.12.22 Hybrane 2500 6.4 5.7 5.8 6.5 5.5 6.0 6 5.4 5.4 6.2 5.2 5.6 900 934 933 885 942 919 917 947 948 901 954 933
2012.04.25 Hybrane 2500 4 4.8 4.7 4.6 4.2 4.5 4 4.8 4.7 4.6 4.2 4.5 1036 982 994 1000 1024 1007 1036 982 994 1000 1024 1007 to=ta and To=Ta
2012.01.09 Pyroglutamate 2500 15.1 15.8 14.8 15.3 16.6 15.5 14.7 15 14.4 14.7 15.9 14.9 336 298 363 320 248 313 359 339 385 355 287 345
2012.01.10 Inhibex Bio800 2500 2.5 2.4 2.6 2.6 2.8 2.6 1110 1104 1101 1099 1098 1102 not plug yet
2012.04.24 Inhibex Bio800 2500 2.7 2.5 2.5 2.6 2.8 2.6 1105 1108 1108 1108 1108 1107 not plug yet
2012.01.11 Inhibex 713 2500 9.4 9.2 10.5 10.1 10.3 9.9 9 8.8 9.5 9.2 9.3 9.2 695 706 637 664 645 669 725 723 693 713 696 710
2012.01.12 PVP Plasdone K-12 2500 10.4 11.3 10.9 11.8 11.8 11.2 9.8 10.5 10.3 10.9 11 10.5 638 580 607 550 551 585 685 629 643 603 598 632
2012.01.13 Agrimer 30(PVP 30k) 2500 12.6 12.2 13.4 13.5 13.8 13.1 10.7 10.5 11 10.7 11.3 10.8 495 524 448 439 418 465 615 630 595 613 574 605
2012.01.16 PVP 120k 2500 13.3 13.9 13.2 13.8 13.5 13.5 10.8 11.1 11 11.6 11.6 11.2 456 419 460 421 444 440 612 592 602 565 562 587
2012.01.17 Casein Peptone Plus 2500 8.8 8.8 8.3 8.9 8.4 8.6 8.5 8.4 8 8.4 8.1 8.3 739 742 766 737 763 749 758 762 784 760 781 769 window auto-restart after 896 mins
2012.01.18 PNIPAM 2500 8.5 8.5 8.5 8.6 8.4 8.5 7.9 7.9 8 8 7.8 7.9 758 756 755 752 761 756 792 788 785 785 802 790 5.44 bar leak from cell5
2012.01.19 Antaron P904 2500 10.2 10.6 10.8 10.3 10.4 10.5 9.5 9.6 9.7 9.5 9.6 9.6 650 672 621 639 642 645 690 689 680 689 687 687
2012.01.20 Paspartamide 187C 2500 7.5 8 8 8 8.1 7.9 7.3 7.7 7.6 7.6 7.8 7.6 821 790 801 790 782 797 836 808 823 812 802 816
2012.01.23 AP-1000 10k 2500 9.4 10.1 10 10.6 9.7 10.0 8.8 9.5 9.1 10 9.3 9.3 698 658 664 620 680 664 734 696 721 661 700 702
2012.01.24 Luvicap 55W with magnet 2500 5.8 6.1 6.1 6 5.8 6.0 5 4.8 5.1 5 4.8 4.9 923 907 905 909 926 914 978 981 965 971 979 975 1 magnet per cell
2012.01.25 Luvicap 55W without magnet 2500 6 6.6 6.9 6.4 6.5 5.1 5.1 5.4 5.2 5.2 916 883 855 887 885 972 966 953 961 963 cell 5 leaked
2012.01.26 Luvicap 55W with magnet 2500 6.2 6.6 6.4 6.9 6.9 6.6 5.1 5.3 5.2 5.3 5.4 5.3 902 875 890 861 867 879 963 956 965 950 947 956 5 magnets at cell 1
2012.01.30 Luvicap EG 5000 7.8 7 7.2 7.4 7.4 7.4 6.2 6.5 6.4 6.5 6.8 6.5 804 851 839 826 833 831 897 883 886 882 864 882
2012.01.31 Inhibex 101 5000 no hydrate formation
2012.02.01 Inhibex 501 5000 3.8 3.4 4.7 4.3 4.1 2 2 2.7 2.6 2.3 1056 1080 998 1031 1041 1160 1137 1103 1107 1127
2012.02.02 PVP 120k 5000 13.1 10.9 11.3 10.5 12.2 11.6 11 9.9 9.9 9.3 10.5 10.1 468 609 580 629 526 562 598 667 673 710 630 656
2012.02.03 Agrimer 30(PVP 30k) 5000 13 11.8 12.3 13.8 12.8 12.7 10.9 10.5 11.2 11.4 10.9 11.0 473 556 513 425 484 490 611 636 581 569 606 601
2012.02.06 PVP Plasdone k-12 5000 13.2 11.7 12.1 13.1 12.7 12.6 11.5 10.5 11.2 11.7 11.5 11.3 645 553 530 470 487 537 570 631 589 554 565 582
2012.05.10 Luvicap Bio 5000 8.2 8.8 8.5 8.4 7.9 8.4 8 8.7 8.3 8.4 7.7 8.2 772 737 759 762 799 766 784 746 769 762 807 774 To=Ta, to=ta in cell 4
not plug yet
not plug yet
not plug yet
not plug yet
no hydrate formation

62
APPENDIX A Results of RC5 test (Continue)
cooling constant method
Temp. (oC) time (hh:mm)
T start 20.5-2 18.30
T low 2 1
T melt 25 1
T end 20.5 0.2
Total time 20 hrs 50 mins
volume 20 ml
rocking rate 20
rocking angle 40
steel ball
date chemical conc.(ppm) To1 To2 To3 To4 To5 Av To Ta1 Ta2 Ta3 Ta4 Ta5 Av Ta to1 to2 to3 to4 to5 Av to ta1 ta2 ta3 ta4 ta5 Av ta comments
2012.02.07 Luvicap Bio 2500 11.9 11.5 11.3 12.3 11.4 11.7 11.3 10.9 10.9 11.5 11 11.1 547 577 589 515 582 562 582 608 609 567 602 594
2012.02.08 Inhibex Bio-800 5000 no hydrate formation
2012.02.15 PVCap 12k 2500 8.4 8.4 9.4 8.7 9.5 8.1 8.2 9.1 8.5 9.1 760 762 699 743 695 774 775 718 755 714
2012.02.23 PVCap 12k 2500 8.5 8.2 8.7 8.3 8.6 8.7 8.2 7.9 8.4 8 8.4 8.4 754 769 742 767 741 743 769 788 759 786 754 759
2012.02.16 PVCap 60k 2500 11.1 11 11.1 11.5 11.3 10.5 10.5 10.6 10.8 10.6 594 600 604 571 585 630 628 627 609 624
2012.02.24 PVCap 60k 2500 11.8 11.6 11.5 11.5 11.5 11.4 11 10.9 10.8 11 10.9 10.8 545 567 567 571 570 577 593 610 616 606 604 615
2012.03.12 PVCap 8.5k 2500 10.1 9.8 9.3 10 9.4 8.4 8.7 8.7 9.3 8.8 653 674 701 668 694 762 736 737 711 729
2012.03.19 PVCap 8.5k 2500 10.5 10.5 9.3 9.3 9.3 9.8 8.6 8.7 8.9 8.9 8.9 8.8 630 632 709 706 701 677 748 746 734 734 730 737
2012.03.13 Vcap:BVIMBr_9:1 2500 9.6 9.4 9.6 9.7 8.3 9.2 9 9.1 9.1 8.2 690 698 683 683 772 715 728 713 717 783
2012.03.20 Vcap:BVIMBr_9:1 2500 9.6 10.6 9.1 8.7 8.3 9.3 9.1 9 8.6 8.4 8.2 8.8 693 630 726 751 771 710 724 729 750 766 778 740
Vcap:Vlm _1:1 2500 11.8 11.9 11 11.6 13.1 11.9 11.4 11.6 10.8 11.3 12.8 11.6 retest
2012.03.15 Vcap:Vlm_9:1 2500 9.6 9.4 10.8 10.9 9.5 9.3 9 10 10 9.2 679 689 618 609 695 704 715 664 657 708
2012.03.26 Vcap:Vlm_9:1 2500 9.7 10.4 10.5 10.1 9.8 10.1 9.3 9.7 10 9.5 9.5 9.6 680 634 634 660 675 657 697 676 665 690 688 686
2012.03.16 Poly Vlm 2500 16.3 16.8 16.7 17.4 17 13.9 13.9 14.6 14.6 14.3 261 237 237 200 220 412 420 377 380 391
2012.03.27 Poly Vlm 2500 17.4 16.9 17.6 16.7 16.6 16.9 14.2 14.2 15.3 14.7 15.6 14.5 201 219 186 244 250 226 397 394 333 367 313 378
2012.03.22 PVCap 60k+TBAB 2500 7.3 7.8 8 7.9 7.8 6.5 6.6 6.8 7 6.7 834 815 799 800 811 887 871 859 853 870
2012.03.29 PVCap 60k+TBAB 2500 8 8.5 8 5.8 7.3 7.6 6.8 6.9 6.9 4.6 6.8 6.6 792 762 787 928 838 817 860 855 853 1002 863 877
2012.03.23 PVCap 12k+TBAB 2500 6 5.9 6.3 6.4 6.6 4.4 4.8 4.8 4.9 4.9 923 920 895 888 873 1013 988 987 980 980
2012.03.30 PVCap 12k+TBAB 2500 5.3 6 4.6 5 4.9 5.7 4.6 4.7 4.4 4.6 4.7 4.7 956 914 1006 972 977 932 1004 998 1018 999 997 996
2012.04.26 PVCap 60k_NaCl 2500 10.4 9.8 10 10.1 10 10.1 9.3 9 9.2 9.2 9.3 9.2 633 676 662 656 659 657 708 722 710 711 708 712 in 0.5% NaCl solution
2012.04.27 PVCap 12k_NaCl 2500 8.4 9 8 8.2 8 8.3 8 8.7 7.7 7.9 7.7 8.0 760 728 784 775 789 767 784 751 805 793 808 788 in 0.5% NaCl solution
2012.04.30 PVCap 8.5k_NaCl 2500 10.2 9.5 9.6 9.8 9.6 9.7 8.2 8.7 8.7 8.5 8.3 8.5 654 701 690 676 687 682 774 752 748 758 768 760 in 0.5% NaCl solution
2012.05.02 Luvicap 55W_NaCl 2500 6.2 6.2 6.3 6.5 5.6 6.2 4.7 4.8 5.3 5.3 4.8 5.0 905 899 896 879 939 904 996 988 959 952 989 977 in 0.5% NaCl solution
2012.05.03 VCap_Vlm 9_1_NaCl 2500 9 9.4 9.4 9.5 9.1 9.3 7.9 8 8.1 8.2 8 8.0 721 702 707 696 716 708 794 790 787 784 789 789 in 0.5% NaCl solution
2012.05.04 VCap BVIMBr_NaCl 2500 7.8 7.2 8.1 7.8 8.8 7.9 7.4 6.9 7.7 7.5 8.2 7.5 808 842 783 803 741 795 828 858 813 822 777 820 in 0.5% NaCl solution
2012.05.07 VCap_Vlm 1:1_NaCl 2500 8.7 9.1 9.1 9.4 9.3 7.8 8.1 8.1 8.2 8.2 742 720 721 705 711 720 796 782 781 778 778 783 in 0.5% NaCl solution
VCap_Vlm 1:1_NaCl 2500 8.7 9.4 9 9.3 8.9 9.1 8.3 8.6 8.4 8.6 8.1 8.2 retest
2012.05.08 PVCap 60k+TBAB_NaCl 2500 5.3 5.5 5.5 5.5 5.5 5.5 4.2 4.3 4.7 4.9 4.6 4.5 957 946 947 948 945 949 1029 1015 998 984 1006 1006 in 0.5% NaCl solution
2012.05.09 PVCap 12k+TBAB_NaCl 2500 4.5 4.1 4.7 4.3 3.8 4.3 1005 1031 991 1016 1057 1020 in 0.5% NaCl solution
2012.05.11 Inhibex Bio-800_NaCl 2500 2.3 2.4 2 2.4 2 2.2 2 2 2 2 2 2.0 1110 1108 1121 1105 1147 1118 1314 1204 1302 1217 1343 1276 48 hrs at 2oC
not plug yet
no hydrate formation
not plug yet

63
APPENDIX B Results of autoclave test
Cell 1 Autoclave cell (200ml)
Cell 2 Autoclave cell (23ml)
Conditions constant cooling from 20.5°C to 2°C in 18,5 hours
600 rpm
To1 To2 To3 To4 To5 Av To Ta1 Ta2 Ta3 Ta4 Ta5 Av Ta To1 To2 To3 To4 To5 Av To Ta1 Ta2 Ta3 Ta4 Ta5 Av Ta comments
DI water 2500 13.3 13.3 13.3 13.3 11.2 11.2 11.2 11.2
Luvicap 55W 2500 6.6 6.6 6.8 6.55 6.6 6.63 5.8 5.9 6.28 5.83 6 5.962 6.6 6.9 6.6 6.7 6 6.3 6.2 6.2
Luvicap EG 2500 6.9 7.85 8.35 6.1 8.05 7.45 6.5 7.3 7.6 5.5 6.6 6.7 8 8 7.3 7.3
PVP Plasdone k-12 2500 8.3 10.9 11.09 11.3 10.9 10.498 7.9 10.4 10.5 10.8 10.5 10.02 7.85 10.95 11.1 10.0 7.5 10.5 10.6 9.5
Agrimer 30(PVP 30k) 2500 11.55 12.15 12.4 11.6 12.05 11.95 10.65 11.1 11.25 10.6 10.9 10.9 12.45 10.9 11.4 12.7 10 11.49 6 6.6 6.65 7.6 6.7 6.71
Inhibex 501 2500 6.6 6.2 5.8 6.4 6.2 6.24 5 4.85 4.6 4.7 5.1 4.85 5.9 6 4.1 6 4.9 5.38 4.4 3.2 3.1 3.7 3.6
chemical conc.(ppm)
Cell 1 Cell 2

64
APPENDIX C Percentage deviation from average of To and Ta
cooling constant method
Temp. (oC) time (hh:mm)
T start 20.5-2 18.30
T low 2 1
T melt 25 1
T end 20.5 0.2
Total time 20 hrs 50 mins
volume 20 ml
rocking rate 20
rocking angle 40
steel ball
DV=Deviation
date chemical conc.(ppm) To1 To2 To3 To4 To5 Av To Ta1 Ta2 Ta3 Ta4 Ta5 Av Ta comments To1 To2 To3 To4 To5 Ta1 Ta2 Ta3 Ta4 Ta5
2011.11.09 DI water 18.2 19.8 18.8 18.2 18.3 18.66 to=ta and To=Ta 2.47 -6.11 -0.75 2.47 1.93
2012.04.04 DI water 17.1 18.0 18.1 17.3 17.2 17.54 to=ta and To=Ta 2.51 -2.62 -3.19 1.37 1.94
2011.11.10 Luvicap 55W 5000 4.6 4.1 4.7 5.1 4.1 4.52 4.1 3.4 4.3 4.6 3.8 4.04 -1.77 9.29 -3.98 -12.83 9.29 -1.49 15.84 -6.44 -13.86 5.94
2012.01.27 Luvicap 55W 5000 3.2 3.1 4.2 3.4 3.9 3.56 2.4 2.5 3.2 2.6 3.3 2.80 10.11 12.92 -17.98 4.49 -9.55 14.29 10.71 -14.29 7.14 -17.86
2011.12.16 Luvicap 55W 2500 6.6 6.8 6.1 6.5 7.8 6.76 6.3 5.7 5.0 5.8 6.5 5.86 2.37 -0.59 9.76 3.85 -15.38 -7.51 2.73 14.68 1.02 -10.92
2012.04.03 Luvicap 55W 2500 5.8 7.4 6.6 6.2 6.3 6.46 4.9 6.6 5.3 5.2 5.2 5.44 10.22 -14.55 -2.17 4.02 2.48 9.93 -21.32 2.57 4.41 4.41
2011.12.19 Luvicap EG 2500 8.6 9.3 9.1 9.3 9.3 9.12 7.2 7.7 7.7 8 8 7.72 5.70 -1.97 0.22 -1.97 -1.97 6.74 0.26 0.26 -3.63 -3.63
2012.04.10 Luvicap EG 2500 7.9 7.8 8.3 8.7 8.9 8.32 7.6 7.6 7.9 7.8 7.6 7.70 5.05 6.25 0.24 -4.57 -6.97 1.30 1.30 -2.60 -1.30 1.30
2011.12.20 Inhibex101 2500 5 5.1 5.4 5.4 5.1 5.20 2.1 2.5 2.5 3.2 2.6 2.58 3.85 1.92 -3.85 -3.85 1.92 18.60 3.10 3.10 -24.03 -0.78
2012.04.11 Inhibex101 2500 3.8 3.8 3.9 4.1 4.1 3.94 2.1 2 2.1 2.5 2.1 2.16 3.55 3.55 1.02 -4.06 -4.06 2.78 7.41 2.78 -15.74 2.78
2011.12.21 Inhibex501 2500 6 7 7 6.67 4.3 4.8 5 4.70 10.00 -5.00 -5.00 8.51 -2.13 -6.38
2012.04.23 Inhibex501 2500 5.8 6.2 6.1 5.9 6 6.00 3.9 4 4 4 4 3.98 3.33 -3.33 -1.67 1.67 0.00 2.01 -0.50 -0.50 -0.50 -0.50
2011.12.22 Hybrane 2500 6.4 5.7 5.8 6.5 5.5 5.98 6 5.4 5.4 6.2 5.2 5.64 -7.02 4.68 3.01 -8.70 8.03 -6.38 4.26 4.26 -9.93 7.80
2012.04.25 Hybrane 2500 4 4.8 4.7 4.6 4.2 4.46 4 4.8 4.7 4.6 4.2 4.46 to=ta and To=Ta 10.31 -7.62 -5.38 -3.14 5.83 10.31 -7.62 -5.38 -3.14 5.83
2012.01.09 Pyroglutamate 2500 15.1 15.8 14.8 15.3 16.6 15.52 14.7 15 14.4 14.7 15.9 14.94 2.71 -1.80 4.64 1.42 -6.96 1.61 -0.40 3.61 1.61 -6.43
2012.01.10 Inhibex Bio800 2500 2.5 2.4 2.6 2.6 2.8 2.58 not plug yet 3.10 6.98 -0.78 -0.78 -8.53
2012.04.24 Inhibex Bio800 2500 2.7 2.5 2.5 2.6 2.8 2.62 not plug yet -3.05 4.58 4.58 0.76 -6.87
2012.01.11 Inhibex 713 2500 9.4 9.2 10.5 10.1 10.3 9.90 9 8.8 9.5 9.2 9.3 9.16 5.05 7.07 -6.06 -2.02 -4.04 1.75 3.93 -3.71 -0.44 -1.53
2012.01.12 PVP Plasdone K-12 2500 10.4 11.3 10.9 11.8 11.8 11.24 9.8 10.5 10.3 10.9 11 10.50 7.47 -0.53 3.02 -4.98 -4.98 6.67 0.00 1.90 -3.81 -4.76
2012.01.13 Agrimer 30(PVP 30k) 2500 12.6 12.2 13.4 13.5 13.8 13.10 10.7 10.5 11 10.7 11.3 10.84 3.82 6.87 -2.29 -3.05 -5.34 1.29 3.14 -1.48 1.29 -4.24
2012.01.16 PVP 120k 2500 13.3 13.9 13.2 13.8 13.5 13.54 10.8 11.1 11 11.6 11.6 11.22 1.77 -2.66 2.51 -1.92 0.30 3.74 1.07 1.96 -3.39 -3.39
2012.01.17 Casein Peptone Plus 2500 8.8 8.8 8.3 8.9 8.4 8.64 8.5 8.4 8 8.4 8.1 8.28 window auto-restart after 896 mins -1.85 -1.85 3.94 -3.01 2.78 -2.66 -1.45 3.38 -1.45 2.17
2012.01.18 PNIPAM 2500 8.5 8.5 8.5 8.6 8.4 8.50 7.9 7.9 8 8 7.8 7.92 5.44 bar leak from cell5 0.00 0.00 0.00 -1.18 1.18 0.25 0.25 -1.01 -1.01 1.52
2012.01.19 Antaron P904 2500 10.2 10.6 10.8 10.3 10.4 10.46 9.5 9.6 9.7 9.5 9.6 9.58 2.49 -1.34 -3.25 1.53 0.57 0.84 -0.21 -1.25 0.84 -0.21
2012.01.20 Paspartamide 187C 2500 7.5 8 8 8 8.1 7.92 7.3 7.7 7.6 7.6 7.8 7.60 5.30 -1.01 -1.01 -1.01 -2.27 3.95 -1.32 0.00 0.00 -2.63
2012.01.23 AP-1000 10k 2500 9.4 10.1 10 10.6 9.7 9.96 8.8 9.5 9.1 10 9.3 9.34 5.62 -1.41 -0.40 -6.43 2.61 5.78 -1.71 2.57 -7.07 0.43
2012.01.24 Luvicap 55W with magnet 2500 5.8 6.1 6.1 6 5.8 5.96 5 4.8 5.1 5 4.8 4.94 1 magnet per cell 2.68 -2.35 -2.35 -0.67 2.68 -1.21 2.83 -3.24 -1.21 2.83
2012.01.25 Luvicap 55W without magnet 2500 6 6.6 6.9 6.4 6.48 5.1 5.1 5.4 5.2 5.20 cell 5 leaked 7.34 -1.93 -6.56 1.16 1.92 1.92 -3.85 0.00
2012.01.26 Luvicap 55W with magnet 2500 6.2 6.6 6.4 6.9 6.9 6.60 5.1 5.3 5.2 5.3 5.4 5.26 5 magnets at cell 1 6.06 0.00 3.03 -4.55 -4.55 3.04 -0.76 1.14 -0.76 -2.66
2012.01.30 Luvicap EG 5000 7.8 7 7.2 7.4 7.4 7.36 6.2 6.5 6.4 6.5 6.8 6.48 -5.98 4.89 2.17 -0.54 -0.54 4.32 -0.31 1.23 -0.31 -4.94
2012.01.31 Inhibex 101 5000 no hydrate formation
2012.02.01 Inhibex 501 5000 3.8 3.4 4.7 4.3 4.05 2 2 2.7 2.6 2.33 6.17 16.05 -16.05 -6.17 13.98 13.98 -16.13 -11.83
2012.02.02 PVP 120k 5000 13.1 10.9 11.3 10.5 12.2 11.60 11 9.9 9.9 9.3 10.5 10.12 -12.93 6.03 2.59 9.48 -5.17 -8.70 2.17 2.17 8.10 -3.75
2012.02.03 Agrimer 30(PVP 30k) 5000 13 11.8 12.3 13.8 12.8 12.74 10.9 10.5 11.2 11.4 10.9 10.98 -2.04 7.38 3.45 -8.32 -0.47 0.73 4.37 -2.00 -3.83 0.73
2012.02.06 PVP Plasdone k-12 5000 13.2 11.7 12.1 13.1 12.7 12.56 11.5 10.5 11.2 11.7 11.5 11.28 -5.10 6.85 3.66 -4.30 -1.11 -1.95 6.91 0.71 -3.72 -1.95
2012.05.10 Luvicap Bio 5000 8.2 8.8 8.5 8.4 7.9 8.36 8 8.7 8.3 8.4 7.7 8.22 To=Ta, to=ta in cell 4 1.91 -5.26 -1.67 -0.48 5.50 2.68 -5.84 -0.97 -2.19 6.33
not plug yet
not plug yet
no hydrate formation

65
APPENDIX C Percentage deviation from average of To and Ta (Continue)
cooling constant method
Temp. (oC) time (hh:mm)
T start 20.5-2 18.30
T low 2 1
T melt 25 1
T end 20.5 0.2
Total time 20 hrs 50 mins
volume 20 ml
rocking rate 20
rocking angle 40
steel ball
DV=Deviation
date chemical conc.(ppm) To1 To2 To3 To4 To5 Av To Ta1 Ta2 Ta3 Ta4 Ta5 Av Ta comments To1 To2 To3 To4 To5 Ta1 Ta2 Ta3 Ta4 Ta5
2012.02.07 Luvicap Bio 2500 11.9 11.5 11.3 12.3 11.4 11.68 11.3 10.9 10.9 11.5 11 11.12 -1.88 1.54 3.25 -5.31 2.40 -1.62 1.98 1.98 -3.42 1.08
2012.02.08 Inhibex Bio-800 5000 no hydrate formation
2012.02.15 PVCap 12k 2500 8.4 8.4 9.4 8.7 9.5 8.1 8.2 9.1 8.5 9.1 3.11 3.11 -8.42 -0.35 -9.57 3.46 2.26 -8.46 -1.31 -8.46
2012.02.23 PVCap 12k 2500 8.5 8.2 8.7 8.3 8.6 8.67 8.2 7.9 8.4 8 8.4 8.39 1.96 5.42 -0.35 4.27 0.81 2.26 5.84 -0.12 4.65 -0.12
2012.02.16 PVCap 60k 2500 11.1 11 11.1 11.5 11.3 10.5 10.5 10.6 10.8 10.6 2.55 3.42 2.55 -0.97 0.79 2.42 2.42 1.49 -0.37 1.49
2012.02.24 PVCap 60k 2500 11.8 11.6 11.5 11.5 11.5 11.39 11 10.9 10.8 11 10.9 10.76 -3.60 -1.84 -0.97 -0.97 -0.97 -2.23 -1.30 -0.37 -2.23 -1.30
2012.03.12 PVCap 8.5k 2500 10.1 9.8 9.3 10 9.4 8.4 8.7 8.7 9.3 8.8 -3.59 -0.51 4.62 -2.56 3.59 4.44 1.02 1.02 -5.80 -0.11
2012.03.19 PVCap 8.5k 2500 10.5 10.5 9.3 9.3 9.3 9.75 8.6 8.7 8.9 8.9 8.9 8.79 -7.69 -7.69 4.62 4.62 4.62 2.16 1.02 -1.25 -1.25 -1.25
2012.03.13 Vcap:BVIMBr_9:1 2500 9.6 9.4 9.6 9.7 8.3 9.2 9 9.1 9.1 8.2 -3.34 -1.18 -3.34 -4.41 10.66 -4.66 -2.39 -3.53 -3.53 6.71
2012.03.20 Vcap:BVIMBr_9:1 2500 9.6 10.6 9.1 8.7 8.3 9.29 9.1 9 8.6 8.4 8.2 8.79 -3.34 -14.10 2.05 6.35 10.66 -3.53 -2.39 2.16 4.44 6.71
Vcap:Vlm _1:1 2500 11.8 11.9 11 11.6 13.1 11.9 11.4 11.6 10.8 11.3 12.8 11.6 retest 0.67 -0.17 7.41 2.36 -10.27 1.55 -0.17 6.74 2.42 -10.54
2012.03.15 Vcap:Vlm_9:1 2500 9.6 9.4 10.8 10.9 9.5 9.3 9 10 10 9.2 4.67 6.65 -7.25 -8.24 5.66 2.62 5.76 -4.71 -4.71 3.66
2012.03.26 Vcap:Vlm_9:1 2500 9.7 10.4 10.5 10.1 9.8 10.07 9.3 9.7 10 9.5 9.5 9.55 3.67 -3.28 -4.27 -0.30 2.68 2.62 -1.57 -4.71 0.52 0.52
2012.03.16 Poly Vlm 2500 16.3 16.8 16.7 17.4 17 13.9 13.9 14.6 14.6 14.3 3.78 0.83 1.42 -2.72 -0.35 4.34 4.34 -0.48 -0.48 1.58
2012.03.27 Poly Vlm 2500 17.4 16.9 17.6 16.7 16.6 16.94 14.2 14.2 15.3 14.7 15.6 14.53 -2.72 0.24 -3.90 1.42 2.01 2.27 2.27 -5.30 -1.17 -7.36
2012.03.22 PVCap 60k+TBAB 2500 7.3 7.8 8 7.9 7.8 6.5 6.6 6.8 7 6.7 4.45 -2.09 -4.71 -3.40 -2.09 0.91 -0.61 -3.66 -6.71 -2.13
2012.03.29 PVCap 60k+TBAB 2500 8 8.5 8 5.8 7.3 7.64 6.8 6.9 6.9 4.6 6.8 6.56 -4.71 -11.26 -4.71 24.08 4.45 -3.66 -5.18 -5.18 29.88 -3.66
2012.03.23 PVCap 12k+TBAB 2500 6 5.9 6.3 6.4 6.6 4.4 4.8 4.8 4.9 4.9 -5.26 -3.51 -10.53 -12.28 -15.79 5.98 -2.56 -2.56 -4.70 -4.70
2012.03.30 PVCap 12k+TBAB 2500 5.3 6 4.6 5 4.9 5.70 4.6 4.7 4.4 4.6 4.7 4.68 7.02 -5.26 19.30 12.28 14.04 1.71 -0.43 5.98 1.71 -0.43
2012.04.26 PVCap 60k_NaCl 2500 10.4 9.8 10 10.1 10 10.06 9.3 9 9.2 9.2 9.3 9.20 in 0.5% NaCl solution -3.38 2.58 0.60 -0.40 0.60 -1.09 2.17 0.00 0.00 -1.09
2012.04.27 PVCap 12k_NaCl 2500 8.4 9 8 8.2 8 8.32 8 8.7 7.7 7.9 7.7 8.00 in 0.5% NaCl solution -0.96 -8.17 3.85 1.44 3.85 0.00 -8.75 3.75 1.25 3.75
2012.04.30 PVCap 8.5k_NaCl 2500 10.2 9.5 9.6 9.8 9.6 9.74 8.2 8.7 8.7 8.5 8.3 8.48 in 0.5% NaCl solution -4.72 2.46 1.44 -0.62 1.44 3.30 -2.59 -2.59 -0.24 2.12
2012.05.02 Luvicap 55W_NaCl 2500 6.2 6.2 6.3 6.5 5.6 6.16 4.7 4.8 5.3 5.3 4.8 4.98 in 0.5% NaCl solution -0.65 -0.65 -2.27 -5.52 9.09 5.62 3.61 -6.43 -6.43 3.61
2012.05.03 VCap_Vlm 9_1_NaCl 2500 9 9.4 9.4 9.5 9.1 9.28 7.9 8 8.1 8.2 8 8.04 in 0.5% NaCl solution 3.02 -1.29 -1.29 -2.37 1.94 1.74 0.50 -0.75 -1.99 0.50
2012.05.04 VCap BVIMBr_NaCl 2500 7.8 7.2 8.1 7.8 8.8 7.94 7.4 6.9 7.7 7.5 8.2 7.54 in 0.5% NaCl solution 1.76 9.32 -2.02 1.76 -10.83 1.86 8.49 -2.12 0.53 -8.75
2012.05.07 VCap_Vlm 1:1_NaCl 2500 8.7 9.1 9.1 9.4 9.3 7.8 8.1 8.1 8.2 8.2 in 0.5% NaCl solution 4.29 -0.11 -0.11 -3.41 -2.31 5.34 1.70 1.70 0.49 0.49
VCap_Vlm 1:1_NaCl 2500 8.7 9.4 9 9.3 8.9 9.1 8.3 8.6 8.4 8.6 8.1 8.2 retest 4.29 -3.41 0.99 -2.31 2.09 -0.73 -4.37 -1.94 -4.37 1.70
2012.05.08 PVCap 60k+TBAB_NaCl 2500 5.3 5.5 5.5 5.5 5.5 5.46 4.2 4.3 4.7 4.9 4.6 4.54 in 0.5% NaCl solution 2.93 -0.73 -0.73 -0.73 -0.73 7.49 5.29 -3.52 -7.93 -1.32
2012.05.09 PVCap 12k+TBAB_NaCl 2500 4.5 4.1 4.7 4.3 3.8 4.28 in 0.5% NaCl solution -5.14 4.21 -9.81 -0.47 11.21
2012.05.11 Inhibex Bio-800_NaCl 2500 2.3 2.4 2 2.4 2 2.22 2 2 2 2 2 2.00 48 hrs at 2oC -3.60 -8.11 9.91 -8.11 9.91 0.00 0.00 0.00 0.00 0.00
not plug yet
no hydrate formation

66
APPENDIX D Abbreviation
LDHIs Low Dosage Hydrate Inhibitors
KHIs Kinetic Hydrate Inhibitors
AAs Anti-agglomerant
SI Structure I
CSI Cubic structure I
SII Structure II
CSII Cubic structure II
SH Structure H
HSIII Hexagonal structure H
THIs Thermodynamic Hydrate Inhibitors
MEG Monoethylene glycol
DEG Diethylene glycol
TEG Triethylene glycol
HSE Health, Safety and Environment
CAPEX Capital Expenditure
OPEX Operational Expenditure
VP N-vinylpyrrolidone
PVP Polyvinylpyrrolidone
PVCap Polyvinylcaprolactam
CI Corrosion Inhibitor
VIMA N-methyl-N-vinylacetamide
VCAP Vinylcaprolactam
GHI1 Polyvinylpyrrolidone and diethylene glycol monobutylether in the weight ratio
1:1
THF Tetrahydrofuran
NaCl Sodium chloride
Mw The weight average molecular weight
BGE monobutyl glycol ether
DMAEMA dimethylaminoethyl methacrylate
PNIPAM poly(N-isopropylacrylamide)
TBAB tetrabutylammonium bromide

67
VIM Vinylimmidazole
AP Acryloylpyrrolidine
ΔT Subcooling
To The onset temperature
Ta The temperature of catastrophic growth process
to The onset time
ta The time of catastrophic growth process
ti Induction time