gas-fired generation in michigan: assessment of gas
TRANSCRIPT

Gas-Fired Generation in Michigan: Assessment of Gas Infrastructure
and Generation Costs
March, 1999
Michigan Public Service CommissionGas Division
Electric DivisionExecutive Secretary Division
Licensing and Enforcement Division

PREFACE
Low fuel costs and low emissions have made natural gas the preferred fuel for new electricitygeneration. Expanded use of gas raises questions regarding its impact on Michigan’s natural gasmarkets, including the future supply and price of gas, the ability of the gas pipeline system to delivergas to gas-fired generators, the impact of gas-fired generation on Michigan’s gas distribution andstorage infrastructure, and the expected cost of electricity from gas generators. This report presentsan initial assessment on these questions and the general viability of using natural gas to generateelectricity in Michigan.
This report was prepared by the Gas, Electric, Executive Secretary, and Licensing and EnforcementDivisions of the Michigan Public Service Commission, Michigan Department of Consumer andIndustry Services.
Project Manager Bill Bokram, Gas Division Gas Transportation/Distribution Bill BokramGas Supply, Demand, Reserves Jack Mason, Executive SecretaryCapital Costs Brian Ballinger, Licensing and EnforcementGas Fired Generation Tim Boyd, Electric DivisionReport Prepared by: Bill Bokram, Jack Mason
Comments or questions on this report may be directed to Bill Bokram, Michigan Public ServiceCommission, P.O. Box 30221, Lansing, Michigan 48909, phone: (517) 334-7167, fax: (517)882-1549 or E-mail: [email protected]

March, 1999 Gas-Fired Generation in Michigan Page: iAssessment of Gas Infrastructure and Generation Costs
Executive Summary
The Michigan Public Service Commission Staff provides an initial assessment on the viability ofusing natural gas to generate electricity in Michigan in “Gas-Fired Generation in Michigan:Assessment of Gas Infrastructure and Generation Costs” (March 1999). Low fuel costs and lowemissions have made natural gas the preferred fuel for new electricity generation. In the latestAnnual Energy Outlook, the U.S. Department of Energy projects that gas will fuel 88 percent ofall new generation plants in the U.S. in the 1999-2020 period.
Expanded use of gas raises questions regarding its impact on Michigan’s natural gas markets. Key items addressed in this report are the future supply and prices of gas, the ability of the gaspipeline system to deliver gas to gas-fired generators, the impact of gas-fired generation onMichigan’s distribution and storage infrastructure, and the expected cost of electricity from gasgenerators. In this initial assessment, the Commission Staff finds:
‚ Michigan’s gas pipeline capacity is currently inadequate for servingsignificant gas-fired generation in Michigan, but currently proposedprojects will provide the necessary pipeline capacity.
‚ Gas supplies will be sufficient to provide fuel for gas-fired generation andto serve traditional natural gas markets for the foreseeable future, atreasonable prices.
‚ Michigan’s abundant natural gas storage should provide fuel pricebenefits for gas-fired generators similar to the price benefits alreadyreceived by Michigan’s gas space heating customers.
‚ Michigan’s gas storage combined with its current winter peaking seasonfor gas use suggest that Michigan is a good location for gas-firedelectricity generation, given summer peaking electricity demand.
‚ Natural gas prices should remain favorable for the foreseeable future. However, Commission Staff believes the likelihood of higher thanexpected prices is greater than for lower prices.
‚ Under the U.S. Department of Energy’s reference wellhead natural gasprices, busbar baseload generation using natural gas is approximately 3.4-3.5 cents per kilowatt-hour in 1999, and will increase to about 4.1-4.2cents by 2005.
The assessment period is through 2010. To assess the potential impact of gas-fired generation,100% of the growth in electric demand was assumed to be met using gas-fired generation.
March, 1999 Gas-Fired Generation in Michigan Page: iiAssessment of Gas Infrastructure and Generation Costs
1 The Federal Energy Regulatory Commission (FERC) approved Vector on 10/19/98. "PreliminaryDetermination on Non-Environmental Issues” 19 October 1998, Docket number CP98-131-000. 85 FERC ¶61,083<http://cips.ferc.fed.us/cips/>
2 The FERC approved Alliance Pipeline on 9/17/98. “Order Issuing Certificates, Granting NGA Section 3Authorization, and Granting and Denying Rehearing” 17 September 1998. Docket number CP97-168-000. 84FERC ¶61,239 <http://cips.ferc.fed.us/cips/>
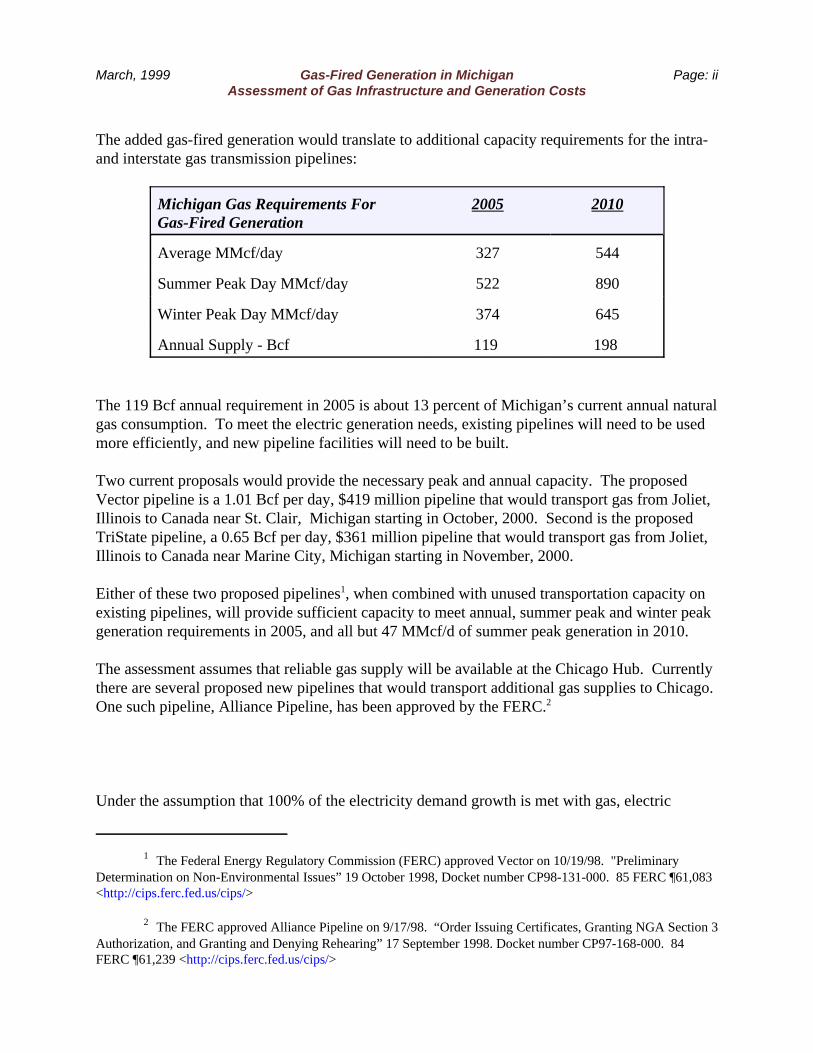
The added gas-fired generation would translate to additional capacity requirements for the intra-and interstate gas transmission pipelines:
Michigan Gas Requirements For Gas-Fired Generation
2005 2010
Average MMcf/day 327 544
Summer Peak Day MMcf/day 522 890
Winter Peak Day MMcf/day 374 645
Annual Supply - Bcf 119 198
The 119 Bcf annual requirement in 2005 is about 13 percent of Michigan’s current annual naturalgas consumption. To meet the electric generation needs, existing pipelines will need to be usedmore efficiently, and new pipeline facilities will need to be built.
Two current proposals would provide the necessary peak and annual capacity. The proposedVector pipeline is a 1.01 Bcf per day, $419 million pipeline that would transport gas from Joliet,Illinois to Canada near St. Clair, Michigan starting in October, 2000. Second is the proposedTriState pipeline, a 0.65 Bcf per day, $361 million pipeline that would transport gas from Joliet,Illinois to Canada near Marine City, Michigan starting in November, 2000.
Either of these two proposed pipelines1, when combined with unused transportation capacity onexisting pipelines, will provide sufficient capacity to meet annual, summer peak and winter peakgeneration requirements in 2005, and all but 47 MMcf/d of summer peak generation in 2010.
The assessment assumes that reliable gas supply will be available at the Chicago Hub. Currentlythere are several proposed new pipelines that would transport additional gas supplies to Chicago. One such pipeline, Alliance Pipeline, has been approved by the FERC.2
Under the assumption that 100% of the electricity demand growth is met with gas, electric
March, 1999 Gas-Fired Generation in Michigan Page: iiiAssessment of Gas Infrastructure and Generation Costs
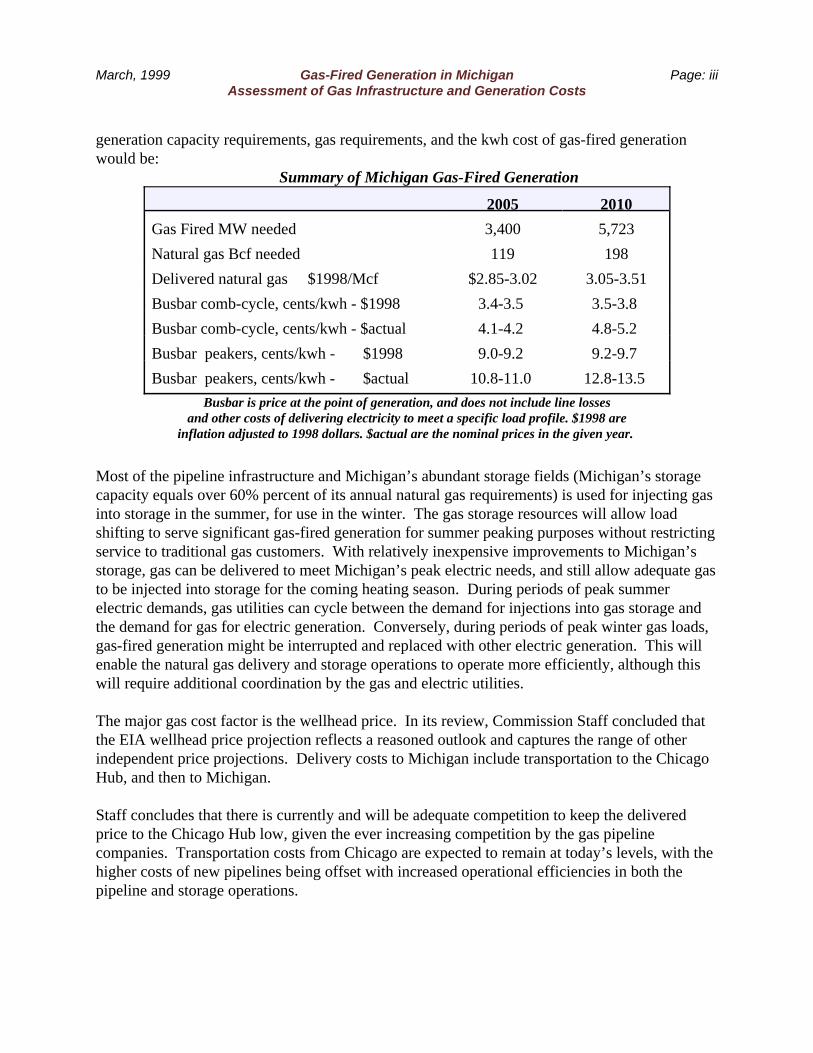
generation capacity requirements, gas requirements, and the kwh cost of gas-fired generationwould be:
Summary of Michigan Gas-Fired Generation
2005 2010
Gas Fired MW needed 3,400 5,723
Natural gas Bcf needed 119 198
Delivered natural gas $1998/Mcf $2.85-3.02 3.05-3.51
Busbar comb-cycle, cents/kwh - $1998 3.4-3.5 3.5-3.8
Busbar comb-cycle, cents/kwh - $actual 4.1-4.2 4.8-5.2
Busbar peakers, cents/kwh - $1998 9.0-9.2 9.2-9.7
Busbar peakers, cents/kwh - $actual 10.8-11.0 12.8-13.5
Busbar is price at the point of generation, and does not include line lossesand other costs of delivering electricity to meet a specific load profile. $1998 are
inflation adjusted to 1998 dollars. $actual are the nominal prices in the given year.
Most of the pipeline infrastructure and Michigan’s abundant storage fields (Michigan’s storagecapacity equals over 60% percent of its annual natural gas requirements) is used for injecting gasinto storage in the summer, for use in the winter. The gas storage resources will allow loadshifting to serve significant gas-fired generation for summer peaking purposes without restrictingservice to traditional gas customers. With relatively inexpensive improvements to Michigan’sstorage, gas can be delivered to meet Michigan’s peak electric needs, and still allow adequate gasto be injected into storage for the coming heating season. During periods of peak summerelectric demands, gas utilities can cycle between the demand for injections into gas storage andthe demand for gas for electric generation. Conversely, during periods of peak winter gas loads,gas-fired generation might be interrupted and replaced with other electric generation. This willenable the natural gas delivery and storage operations to operate more efficiently, although thiswill require additional coordination by the gas and electric utilities.
The major gas cost factor is the wellhead price. In its review, Commission Staff concluded thatthe EIA wellhead price projection reflects a reasoned outlook and captures the range of otherindependent price projections. Delivery costs to Michigan include transportation to the ChicagoHub, and then to Michigan.
Staff concludes that there is currently and will be adequate competition to keep the deliveredprice to the Chicago Hub low, given the ever increasing competition by the gas pipelinecompanies. Transportation costs from Chicago are expected to remain at today’s levels, with thehigher costs of new pipelines being offset with increased operational efficiencies in both thepipeline and storage operations.
Gas-fired Generation in Michigan: Assessment of Gas Infrastructure and Generation Costs
Table of Contents
Chapter 1. Introduction . . . . . . . . . . . . . . . . . . . . . . . . . . . . . . . . . . . . . . . . . . . . . . . . . . . . . . . . . 1
Chapter 2. Future Availability and Prices of Natural Gas . . . . . . . . . . . . . . . . . . . . . . . . . . . . . . . 2World and U. S. Natural Gas Reserves . . . . . . . . . . . . . . . . . . . . . . . . . . . . . . . . . . . . . . . 2Natural Gas Prices . . . . . . . . . . . . . . . . . . . . . . . . . . . . . . . . . . . . . . . . . . . . . . . . . . . . . . . 7
Chapter 3. Natural Gas Demand Outlook . . . . . . . . . . . . . . . . . . . . . . . . . . . . . . . . . . . . . . . . . . 10Introduction . . . . . . . . . . . . . . . . . . . . . . . . . . . . . . . . . . . . . . . . . . . . . . . . . . . . . . . . . . . 10Michigan Natural Gas Demand: History . . . . . . . . . . . . . . . . . . . . . . . . . . . . . . . . . . . . . 10Future Michigan Natural Gas Demand . . . . . . . . . . . . . . . . . . . . . . . . . . . . . . . . . . . . . . 12World Natural Gas Demand Projection . . . . . . . . . . . . . . . . . . . . . . . . . . . . . . . . . . . . . 13U. S. Natural Gas Demand Projection . . . . . . . . . . . . . . . . . . . . . . . . . . . . . . . . . . . . . . . 13
Chapter 4. Natural Gas Infrastructure needed to Serve Michigan’s Electric Needs . . . . . . . . . . 15Current Pipeline and Storage field Infrastructure . . . . . . . . . . . . . . . . . . . . . . . . . . . . . . 15Future Pipeline and Storage field Infrastructure Improvements . . . . . . . . . . . . . . . . . . . 17Details of Current and Future Capacity to Michigan by Pipeline . . . . . . . . . . . . . . . . . . 21
Chapter 5. Cost of Gas-Fired Electricity Generation . . . . . . . . . . . . . . . . . . . . . . . . . . . . . . . . . . 29Assumed Characteristics of Gas-Fired Generation . . . . . . . . . . . . . . . . . . . . . . . . . . . . . 30Natural Gas Fuel Costs . . . . . . . . . . . . . . . . . . . . . . . . . . . . . . . . . . . . . . . . . . . . . . . . . . 33
Transportation to Michigan . . . . . . . . . . . . . . . . . . . . . . . . . . . . . . . . . . . . . . . . . 34Transportation to Chicago . . . . . . . . . . . . . . . . . . . . . . . . . . . . . . . . . . . . . . . . . . 36Storage Costs . . . . . . . . . . . . . . . . . . . . . . . . . . . . . . . . . . . . . . . . . . . . . . . . . . . . 37Wellhead Gas Costs . . . . . . . . . . . . . . . . . . . . . . . . . . . . . . . . . . . . . . . . . . . . . . . 37
Chapter 6. Reliability Issues . . . . . . . . . . . . . . . . . . . . . . . . . . . . . . . . . . . . . . . . . . . . . . . . . . . . 39Price Risks . . . . . . . . . . . . . . . . . . . . . . . . . . . . . . . . . . . . . . . . . . . . . . . . . . . . . . . . . . . . 39Deliverability Risks . . . . . . . . . . . . . . . . . . . . . . . . . . . . . . . . . . . . . . . . . . . . . . . . . . . . . 40
Appendix A Scenario for Needs in Michigan Through 2010 . . . . . . . . . . . . . . . . . . . . . . . . . . . 42

March, 1999 Gas-Fired Generation in Michigan: Page: 1Assessment of Gas Infrastructure and Generation Costs
Chapter 1. Introduction
The current low natural gas prices and adequate gas supplies have made natural gas the fuel ofchoice for new electrical generation in the U.S. and elsewhere. Therefore, the MPSC ChiefAdministrative Officer asked Staff to report on key issues related to the use of gas to meetingMichigan’s electricity needs. First is the question of whether Michigan’s natural gastransmission and supply network is adequate for expanded use of gas to generate electricity.
Second, although current gas prices are low and supplies abundant, what does the future hold with respect to the availability and price of natural gas? And third, what is the approximate costof producing electricity using natural gas-fired generation?
This report is a summary of the key findings pertaining to the future use of natural gas forelectricity generation in Michigan. The future world and U.S. supply and U.S. prices of naturalgas are covered in Chapter 2, and this material is based almost completely on the U.S.Department of Energy’s long-term outlook by DOE’s Energy Information Administration (EIA).
The demand for natural gas in Michigan is addressed in Chapter 3. Included is a scenario offuture Michigan natural gas demand which was developed by the Statistical Analysis Section,Executive Secretary Division. The chapter concludes with a discussion on the expected worldand U.S. natural gas demand which is based on EIA information. This provides the largergeographic context, which is necessary given the fact that the gas market relevant for Michigangoes far beyond Michigan’s borders.
Chapter 4 summarizes the findings regarding Michigan’s gas transportation and distributioninfrastructure. The findings reflect the Gas Division’s assessment of whether the proposedprojects added to the current system will provide sufficient capacity to meet gas demandrequirements for electricity generation. To complete this chapter, Staff discussed the current andproposed infrastructure with Michigan’s gas transportation companies.
Estimates of the busbar kilowatt-hour price of electricity using gas-fired generation in Michiganare presented in Chapter 5. The chapter addresses the major price components in turn andfocuses on two generic generating units, a combined-cycle gas configuration assumed forbaseload generation and a gas combustion turbine assumed for peaking generation. The priceestimates are busbar, which means that system line losses are not included. System losses mightadd about ten percent to these costs. Also, busbar estimates reflect the cost for deliveringelectricity to the electricity grid, and do not reflect the costs of delivering electricity to a customeror group of customers. To deliver to a group of customers, a generator has to match the loadprofile of the customers. The busbar cost for a combined-cycle baseload plant (plus line losses)is therefore lower than any generator can produce for a customer or a group of customers.
Finally, chapter 6 is a brief discussion of the key reliability issues affecting the use of gas forelectricity generation. This discussion is applicable to Michigan and other geographic areas.

March, 1999 Gas-Fired Generation in Michigan: Page: 2Assessment of Gas Infrastructure and Generation Costs
Chapter 2. Future Availability and Prices of Natural Gas
Three factors combine to paint Michigan’s prospects for the use of natural gas: available supply,price, and deliverability. The deliverability of gas is dependent on the pipeline infrastructure inand to Michigan. Deliverability is the topic of Chapter 4. This chapter discusses the expectedsupply availability and prices of natural gas.
It is noteworthy that this chapter does not address the production of natural gas in Michigan. The future of Michigan production was not addressed for this report because it is not seen as amajor factor influencing the broad supply and demand picture for Michigan. However, Michiganproduction is significant in volume terms. Michigan’s production generally provides about onefourth of Michigan’s consumption, and was 277 billion cubic feet (Bcf) in 1997. Production inMichigan has grown in recent years and is not expected to increase further, but rather is expectedto slowly decline in the 1999-2010 period.
World and U. S. Natural Gas Reserves
The size of natural gas markets generally falls between the petroleum market, where there is asingle world market, and the coal markets, which are more regionalized in part because of thehigh cost of coal transportation. Gas is relatively easy to transport in pipelines. Delivered gasprices in the U.S. vary due to differences in gas contracts and differences in the pipelinetransportation costs to specific regions, and also to the local availability of natural gas storagecapability. A single international market for natural gas has not emerged due to the limitations of thepipeline infrastructure and the relatively high cost of liquefying and moving gas on tanker ships. However, market developments have more closely unified natural gas markets around the worldand in North America. New pipelines in North America, in Europe, and in Asia will continue toexpand the size of and increase competition in regional natural gas markets. Also, liquifiednatural gas (LNG) technology is expanding, mostly in the Middle East and Asia, and this canexpand the reach of gas supplies to the entire world.
The North America natural gas supplies and prices will continue to determine the availability andprices of energy in Michigan. Michigan’s gas supply is part of a market including the UnitedStates and Canada. Although Mexico has significant reserves of gas, natural gas supplies are notwell developed in Mexico and there is no significant integration of the U.S. and Mexican supplypipeline networks.
The significant Michigan-specific factor which affects local gas supply and prices is the abundantgas storage capacity in Michigan, as discussed in Chapter 4. Michigan’s gas usage is highlyseasonal, and the storage capability allows gas purchases to be made throughout the year. Thislowers prices for consumers, since gas can be purchased in summer months when prices arelower, then put in underground storage and used in winter months.

March, 1999 Gas-Fired Generation in Michigan: Page: 3Assessment of Gas Infrastructure and Generation Costs
1 Although statistical measures are not applied to the reliability of the reserve estimates, the concept of astatistical confidence interval does illustrate the differences in reliability of the gas reserve estimates. For theestimate for proven reserves, it might be said that future actual production might have an judgmental 90%probability of falling within 20 percent of the estimate. For other reserve categories, a judgmental 90% probabilitymight be future actual production within 100 or even 200 percent of the estimate.
The short-term supply of natural gas in local markets is constrained by the current wellheadproduction and gas pipeline distribution system capacity limits. However, in the longer-term,pipeline capacity can be increased. The wellhead supply of natural gas is dependent on theamount which is potentially recoverable from deposits around the world. The amount of gaswhich is economically recoverable is not unlimited, but according to EIA will be sufficient tomeet the growing World and U.S. demand.
The convention of breaking the recoverable supply into components lends to the ability tocharacterize the supply as a looming shortage or as ample. Proven reserves is the amount of gasexpected to be recovered from existing fields and is the portion of future supply which has thehighest degree of reliability or certainty. Since proven reserves represent only a small portion oftotal reserves, the use of proven reserves alone gives a much less optimistic appraisal of thefuture availability of natural gas. The other categories of natural gas reserves are no less certainto be available than proven reserves, but estimates of the volumes for these categories have amuch lower degree of reliability.1
The basic components of the in-ground supply of gas are:
‘‘ Proven Reserves. This is the amount of gas which geologic and engineering datademonstrate with reasonable certainty to be recoverable in future years from knownconventional gas reservoirs in existing fields under current economic and operatingconditions.
‘‘ Reserve Growth. Reserve growth consists of the additions to proven reserves which arelikely to occur due to additional reservoirs found in existing fields, or to the use ofimproved recovery techniques in existing fields.
‘‘ Undiscovered Conventional Reserves. These are estimates of the amount of gas which istechnically recoverable from undiscovered fields, based on geological information andassuming the use of existing technology but without regard to the economic cost. Thisexcludes gas included in the proven reserves and reserve additions categories.
‘ Undiscovered Unconventional Reserves. These are estimates of gas from sources otherthan gas reservoirs, based on geological information, which are technically recoverable,using existing technology but without regard to the economic cost. This includes gas which

March, 1999 Gas-Fired Generation in Michigan: Page: 4Assessment of Gas Infrastructure and Generation Costs
2 One example is potential future gas production from hydrates under the ocean. The potential U.S.reserves are enormous, 112,765 to 676,110 trillion cubic feet (Tcf), but are not currently economic. Collett,Timothy. Kuuskra, Vello. “Hydrates contain vast store of world gas resources” Oil and Gas Journal. 11 May,1998, pages 90-95.
3 “U.S. Crude Oil, Natural Gas, and Natural Gas Liquids Reserves, 1996 Annual Report” by the EnergyInformation Administration, is the latest available and the 20th annual in this series. The Energy InformationAdministration (EIA), U.S. Department of Energy, is an excellent source of all types of energy related information,including historic data, market summaries, and projections. EIA’s Web site is http://www.eia.doe.gov For thisreport, see ftp://ftp.eia.doe.gov/pub/oil_gas/natural_gas/data_publications/crude_oil_natural_gas_reserves/historical/1996/pdf/021696.pdf
is recoverable from sandstone, shale, and coal.2
Proven reserves can be viewed intuitively as the estimate of the supply of gas which can be madeavailable without additional exploration activity. The EIA publishes annually its world and U.S.estimates of the amount of proven natural gas reserves.3 Figure 1 shows the current EIA provenreserves estimates for the top 10 countries, including the United States. For the U.S., the tablealso shows the number of years the reserves that proven reserves would last at the 1995consumption levels. The World total years supply is 29.6 years at current consumption levels,and for the U.S. is just 6.9 years.
Natural Gas Reserves as of January 1998
Country Reserves (TCF) Percent of Total 1996 Withdrawals Year's Supply World 5,086 100.00% Top 5 Countries Russian Federation 1,700 33.43% Iran 810 15.93% Qatar 300 5.90% United Arab Emirates 205 4.03% Saudi Arabia 190 3.74%
North America U.S. (rank 6th) 166 3.26% 24.1 6.9 Canada (rank 15th) 65 1.28% Mexico (rank 17th) 64 1.26%
Figure 1 Prepared by: Statistical Analysis Section, MPSC, July 1998.
Source: Reserves are in EIA International Energy Outlook, 1998, which cites original source as"Worldwide Look at Reserves and Production," Oil&Gas Journal, Vol. 95, No. 52,
December 29, 1997, pp. 38-39.
However, much of the future supply of natural gas will come from the reserve growth andundiscovered categories. Including other reserve categories along with proven reserves adds

March, 1999 Gas-Fired Generation in Michigan: Page: 5Assessment of Gas Infrastructure and Generation Costs
4 Drilling activity this year has hit record lows. The Associated Press reported that drilling activity forcombined gas and oil was at a record low of 531 on 2/19/99. This is due to very low oil and natural gas prices. “Rig Count.” Associated Press. 19 February 1999
1978 1980 1982 1984 1986 1988 1990 1992 1994 19960
1
2
3
4
5
6
7
8
9
Tril
lion
Cub
ic F
eet
Production
Proven Reserves
Prepared by: Statistical Analysis Section MPSC, July 1998 Data Source: Natural Gas Annual 1996, DOE/EIA, September 1997
U.S. Lower 48 States: Gas Production & Reserves
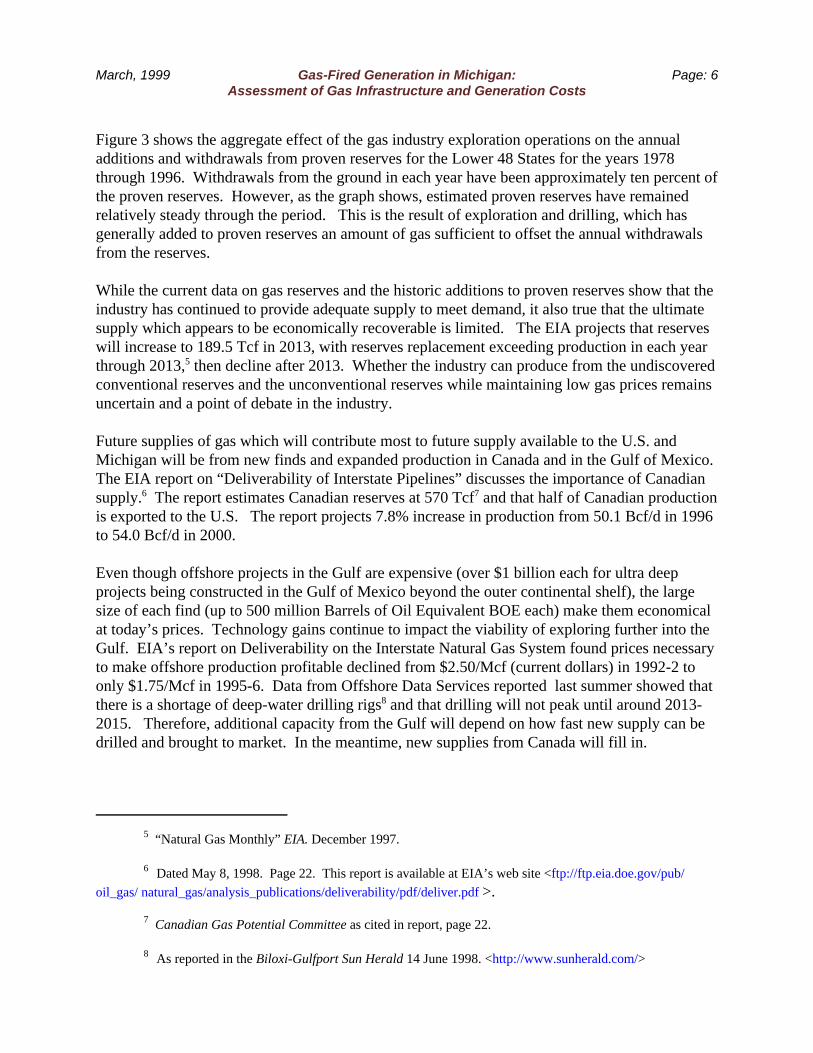
Figure 3 - Comparison of Proven Reserves to Production
greatly to the supply. Figure 2 summarizes the current EIA estimates of U.S. natural gas reservesby reserve category. The U.S. reserve estimates total to about 60 years of gas supply at currentU.S. consumption.
U.S. Natural Gas Reserves 1996
Reserve Category Bcf Reserves Years Supply
Discovered Proved (EIA 1996) 175,147 7.3 Reserve Growth (USGS, 1991) 360,900 15.0 Undiscovered Conventional, onshore (USGS, 1994) 258,690 10.8 Conventional, offshore (MMS, 1994) 268,000 11.1 Continuous-type 357,990 14.9
Subtotal Total, 1996 1,420,727 59.1
Figure 2Prepared by: Statistical Analysis Section, MPSC, July 1998.
Source: Reserve data is from "U.S. Crude Oil, Natural Gas, and Natural Gas Liquids Reserves, 1996Annual Report," Energy Information Administration, November, 1997. The year's supply is based on
1996 U.S. wet gas withdrawals of 24,052 billion cubic feet (Natural Gas Annual 1996, EIA, Table 1)
The petroleum andnatural gas supplyindustries add toproven reserves byexploring and drilling. Proven reserves arecontinuously beingwithdrawn from, andthey are added to bysuccessful explorationand drilling activity. Drilling activity isvery cyclical, higherwhen gas prices arehigh or expected to behigh and lower whenprices are low.4
March, 1999 Gas-Fired Generation in Michigan: Page: 6Assessment of Gas Infrastructure and Generation Costs
5 “Natural Gas Monthly” EIA. December 1997.
6 Dated May 8, 1998. Page 22. This report is available at EIA’s web site <ftp://ftp.eia.doe.gov/pub/
oil_gas/ natural_gas/analysis_publications/deliverability/pdf/deliver.pdf >.
7 Canadian Gas Potential Committee as cited in report, page 22.
8 As reported in the Biloxi-Gulfport Sun Herald 14 June 1998. <http://www.sunherald.com/>
Figure 3 shows the aggregate effect of the gas industry exploration operations on the annualadditions and withdrawals from proven reserves for the Lower 48 States for the years 1978through 1996. Withdrawals from the ground in each year have been approximately ten percent ofthe proven reserves. However, as the graph shows, estimated proven reserves have remainedrelatively steady through the period. This is the result of exploration and drilling, which hasgenerally added to proven reserves an amount of gas sufficient to offset the annual withdrawalsfrom the reserves.
While the current data on gas reserves and the historic additions to proven reserves show that theindustry has continued to provide adequate supply to meet demand, it also true that the ultimatesupply which appears to be economically recoverable is limited. The EIA projects that reserveswill increase to 189.5 Tcf in 2013, with reserves replacement exceeding production in each yearthrough 2013,5 then decline after 2013. Whether the industry can produce from the undiscoveredconventional reserves and the unconventional reserves while maintaining low gas prices remainsuncertain and a point of debate in the industry.
Future supplies of gas which will contribute most to future supply available to the U.S. andMichigan will be from new finds and expanded production in Canada and in the Gulf of Mexico. The EIA report on “Deliverability of Interstate Pipelines” discusses the importance of Canadiansupply.6 The report estimates Canadian reserves at 570 Tcf7 and that half of Canadian productionis exported to the U.S. The report projects 7.8% increase in production from 50.1 Bcf/d in 1996to 54.0 Bcf/d in 2000. Even though offshore projects in the Gulf are expensive (over $1 billion each for ultra deepprojects being constructed in the Gulf of Mexico beyond the outer continental shelf), the largesize of each find (up to 500 million Barrels of Oil Equivalent BOE each) make them economicalat today’s prices. Technology gains continue to impact the viability of exploring further into theGulf. EIA’s report on Deliverability on the Interstate Natural Gas System found prices necessaryto make offshore production profitable declined from $2.50/Mcf (current dollars) in 1992-2 toonly $1.75/Mcf in 1995-6. Data from Offshore Data Services reported last summer showed thatthere is a shortage of deep-water drilling rigs8 and that drilling will not peak until around 2013-2015. Therefore, additional capacity from the Gulf will depend on how fast new supply can bedrilled and brought to market. In the meantime, new supplies from Canada will fill in.

March, 1999 Gas-Fired Generation in Michigan: Page: 7Assessment of Gas Infrastructure and Generation Costs
9 The “Issues in Focus” section, pages 21-22 in EIA’s “Annual Energy Outlook 1998" has a gooddiscussion on this.
10 “Finding, Development Costs Rise 36% For Independents, Less For Majors.” Inside FERC Gas MarketReport. 29 May 1998. Page 15.
11 Barrels of Oil Equivalent, which is calculated by converting the energy content of natural gas and oilproducts into barrels of oil, using the average energy value of oil.
Figure 4- Historic Finding Costs Source: EIA Deliverability of theInterstate Natural Gas Pipeline System, May, 1998, page 27
Natural Gas Prices
The benefits of electric industry restructuring depend in part on the marginal cost of generation. Since gas is the current low cost option, gas-fired generation costs may be vital to the benefits ofa competitive retail direct access market in Michigan.9 This section discusses gas prices ingeneral, while gas prices assumed for natural gas-fired generation costs are developed in Chapter5. While gas prices are not expected to fall in the future as they have in the past 20 years, pricechanges are expected to be slight. The key factor driving future prices is the expected increase intechnology used to find and develop natural gas reserves.
In the 1980's and 1990's,significant gains intechnology have impactedthe industry’s ability toincrease reserves whileholding down gas costs. Figure 4 shows the effectthat technology has had onfinding costs for gas, andis from EIA’s report ongas deliverability. Findingcosts have decreasedsignificantly, falling at arapid rate in the early1980's. Not shown on thegraph are finding costs forthe year 1997, but initialevidence suggests 1997costs were higher than in1996. Paine Webber’s study10 that found a 37% increase in 1997 finding costs for independentproducers, which would be represented on the graph as an upward trend from $4.24/BOE11 in1996 to $5.77/BOE in 1997.
Technology gains are expected to continue, however, and to contribute to keeping gas costs low. ICF Kaiser’s recent study found that “Aggressive implementation of exploration and production

March, 1999 Gas-Fired Generation in Michigan: Page: 8Assessment of Gas Infrastructure and Generation Costs
12 Potential North America Gas Supply” ICF Kaiser Consulting Group. January, 1997. Summarized on
Internet <http://www.icfkaiser.com/kaiserweb/Press97/Jan_1997.htm#1/2/97>
13 Inflation as measured by the Gross Domestic Product (GDP) all index deflator rises at an averageannual rate of 3.1% from 1996 to 2020 in the EIA projection.
WellheadElectric Gen
IndustrialCommercial
ResidentialU.S. Average
0
1
2
3
4
5
6
7R
eal P
rice
per
Mcf
1985
1990
1995
1996
2000
2010
2020
Prepared by: Statistical Analysis Section, MPSC, July 1998Data: Annual Energy Outlook 1998, DOE/EIA, December 1997
U.S. Natural Gas Prices $1996
Figure 5
(E&P) technology advances would result in future savings of 15 to 60 cents/Mcf at the wellheadand could spur over 21 Tcf of new reserve additions in North America.” 12
The EIA, in its Annual Energy Outlook for 1998 (AEO98), presents high and low price scenariosfor natural gas. According to EIA, future natural gas prices are more uncertain, and the pricerange is wider, than for any other major fuel.
Wellhead natural gas pricesare projected to rise 0.5percent faster than inflationfrom 1996 to 2020. The slightincrease in wellhead prices isdriven by the EIA assessmentthat technology gains haveslowed and will continue toslow, combined with the needto add to production from themore difficult and expensivereserve formations.
Although the projectedwellhead gas prices will rise,the price path for the variousmajor end users will varysignificantly, according toEIA. The average delivered real prices of natural gas to end users are expected to fall slightlyduring the 1996-2020 projection period, according to EIA. Figure 5 shows the AEO98 referencecase price projection. The prices shown on the figure are inflation adjusted13 to 1996 dollars. Asthe chart shows, the real price is expected to decline for the residential and commercial sectors. For these sectors, the real price of natural gas is projected to decline about one-half of onepercent per year. This decline is attributed to reduced margins in the distribution component ofthe gas price, which is expected to more than offset the projected increases in wellhead prices.
The electric generation sector already has relatively low transportation/distribution charges, andso the projected rise in wellhead natural gas prices directly translates to higher prices for thedelivered price of natural gas to the electric generation sector. As Figure 5 shows, a similartrend is shown for the industrial sector which also has relatively low delivery charges. Note toothat the electric generation and industrial sector natural gas prices converge slightly in the

March, 1999 Gas-Fired Generation in Michigan: Page: 9Assessment of Gas Infrastructure and Generation Costs
14 EIA’s price projections are based on demand forecasts that assume normal weather. Variations indemand will cause actual prices to be higher or lower than the forecast for brief periods. For example, the mildweather this past winter will result in lower actual prices during 1999.
projection period. EIA expects the historic and current differences in prices to these customers,an artifact of a more regulated gas pricing environment, to be greatly reduced as natural gaspricing becomes more market driven.14

March, 1999 Gas-Fired Generation in Michigan: Page: 10Assessment of Gas Infrastructure and Generation Costs
15 Information is generally from Energy Information Administration reports, available on the Internet <http://www.eia.doe.gov/>
16 “The Current State of the Natural Gas Market” DOE/EIA-0313, December 1991. Page 11.
1960 1965 1970 1975 1980 1985 1990 19950
200
400
600
800
1000
1200
Bill
ion
Cub
ic F
eet
Industrial
Electric Gen
Residential
Commercial
Prepared by: Statistical Analysis Section, MPSC, July 1998Data: State Energy Data System (SEDS), DOE/EIA
Michigan Natural Gas Consumption
Figure 6
Chapter 3. Natural Gas Demand Outlook
Introduction
The Michigan natural gas demand analysis below was prepared by the Statistical AnalysisSection of the Michigan Public Service Commission. The Michigan demand section provides anoverview of the recent historic and possible future path of Michigan natural gas consumption.
The world and U.S. assessments for natural gas demand which follow the Michigan analysis provide a broader perspective of current and future natural gas demand. The information islargely excerpted from U.S. Department of Energy’s publications, and unless otherwise noted theDepartment of Energy is the source of the U.S. overview.15
Michigan Natural Gas Demand: History
Michigan consumption of natural gas by sector for 1960-1996 is shown on Figure 6. Majorfactors affecting consumption in this period include:
1. Steady growth 1960-1974. During thistime, the natural gasdistribution system inMichigan wasexpanding, leading to arapid increase in theuse of gas.
2. Post-Embargo 1974-1977. Natural gasshortages were seen ininterstate markets asearly as 1972, leadingto price increases.16 By1974, the pricesincreases were significant enough to offset demand growth in the industrial sector. Industrial and electric utility use of gas declined as prices rose. To alleviate shortages, theFederal Power Commission in 1976 issued Opinion No. 770, which set ceiling prices almosttwice the previous rates for interstate gas, further reducing demand. Gas shortages

March, 1999 Gas-Fired Generation in Michigan: Page: 11Assessment of Gas Infrastructure and Generation Costs
17 For instance, the average residential customer of Consumers Energy, consumed 178 thousand cubic feet(Mcf) of gas annually in 1972. By 1982, this had dropped to 148 Mcf, and to 132 Mcf in 1992. “Gas Forecast,Consumers Power Company 1992-1996." August 1991.
18 The compiled data by the EIA includes the category “Electric Utility” which does not include non-electric utility use of gas for electric generation. Non-utility gas used for generation is included in the EIA“industrial” category. For Figure 6, the level of annual gas consumption estimates for the Midland CogenerationVenture were removed from the EIA industrial total and added to the EIA electric utility total.
continued, and shortage-induced curtailments (failure to deliver contracted quantities) werehighest in 1977.
3. 1978-1984. Two national laws were passed in 1978 to alleviate the gas supply problem.
The Fuel Use Act of 1978 restricted the use of gas for industrial applications and forelectrical generation. The Natural Gas Policy Act established new price ceilings forwellhead prices of certain types natural gas and, more importantly, provided for the gradualderegulation of wellhead gas prices. These Acts initially reduced consumption directly, andindirectly through the price ceilings. As Figure 10 shows, industrial use continued todecline, and residential and commercial demand was reduced significantly by conservationmeasures of homeowners and businesses.17
4. 1984-1998. FERC initiated open access transportation in Orders 436 and 500 in 1984. Thislead to lower natural gas prices to end-uses and, combined with the phased-in deregulationof wellhead prices in the Natural Gas Policy Act, contributed to renewed growth in gasconsumption, especially in the industrial sector. In 1992, FERC in Order 636 set newrequirements for interstate pipeline companies to expand competition and provide equalaccess in gas transportation.
The consumption trend represented in Figure 6 indirectly shows a key point with respect tocapacity on the gas transportation and distribution system. Transportation and distributioncapacity growth in the 1960's was sufficient to meet annual consumption in 1974. Gasconsumption dropped thereafter, and through the 1970's, 1980's, and into the early 1990's therewas little concern about the capacity of Michigan’s natural gas delivery system. However, therecent increases in gas consumption have pushed Michigan gas use above the peak in 1974. Recent consumption levels have renewed the need to identify potential limitations or bottlenecksto Michigan’s natural gas delivery system. This interest is highlighted because relatively lownatural gas prices have made gas the preferred fuel for new electric generation facilities, which isexpected to lead to additional growth in gas demand.
Michigan’s recent increase in natural gas used for electric generation shown on the Figure isalmost entirely due to the Midland Cogeneration Venture18. In 1997, the MCV plant consumed95 Bcf of gas, which is almost 10 percent of Michigan’s total consumption of 961 Bcf. Withoutthe MCV, Michigan consumption in 1996 would have totaled 866 Bcf -- below the 936 Bcfconsumed in the year 1974.

March, 1999 Gas-Fired Generation in Michigan: Page: 12Assessment of Gas Infrastructure and Generation Costs
19 The EIA projects national annual load growth for 1995 - 2020 of 1.6%, consisting of 0.7% non-electric generating and 5.1% electric generating. “Annual Energy Outlook, 1998" Table A2 <ftp://ftp.eia.doe.gov/pub/forecasting/aeo98/reports/0383(98).pdf>
20 Labeling a forecast or scenario is not a science. In this case, the lack of analysis of Michigan-specifictrends in natural gas consumption suggested the label “scenario” best describes the future year consumption figures.
Future Michigan Natural Gas Demand To analyze the potential impact of increasing use of natural gas on Michigan’s gas transportationand distribution system, natural gas demand is projected by two major categories. The firstcategory is natural gas consumption for uses other than electricity generation. The secondcategory is the potential gas demand for electricity generation. The projection for this secondcategory, gas used for electricity generation, is the focus of concern in this report and is used asthe basis for additional gas demand requirements discussed in Chapter 4.
For purposes of looking at long-term impacts, annual projections are not necessary. Focus yearsor 2000, 2005, and 2010 were developed. Linear interpolation may be used for interim years. The projection results are shown in Figure 7. The residential, commercial, and industrial gasconsumption increases from 855 Bcf in the year 1995 to 1,003 Bcf in the year 2010. Total gasused for electric generation grows from 116 Bcf to 314 Bcf, an increase of 171 percent.
Michigan Natural Gas ConsumptionScenario for Potential Use (Bcf)
Compound Annual Growth Rates 1990 1995 1996 1997 2000 2005 2010 1997-2000 1997-2005 1997-2010
Use Non-Electric 734 855 889 833 929 958 1,003 3.7% 1.8% 1.4% Elect. Gen 83 116 126 128 158 232 314 7.3% 7.7% 7.1% Total Michigan 817 971 1,015 961 1,087 1,190 1,317 4.2% 2.7% 2.5%
Figure 7 - Prepared by: Statistical Analysis Section, MPSC, July 1998.
As discussed in the previous section, the non-electric generation use of natural gas represents themajority of Michigan’s current consumption. In the year 1997, the non-electric generationconsumption of gas in Michigan was 833 Bcf, 86.7 percent of Michigan’s total consumption. This category, consisting of the Residential, Commercial, and Industrial sector total, is projectedby trending the Annual Energy Outlook 1998 Reference case scenario for the U.S.19 Theapproach is simple and easy to implement, and assumes Michigan’s future natural gasconsumption will follow the national trend. The results are best characterized as a scenario, andnot a projection.20 For natural gas used for electricity generation, a projection of Michigan’s totalelectricity demand, sales, and net generation was compiled. Projected electricity demand andgeneration inputs are based on a trend projection for the Lower and Upper Peninsulas. DetroitEdison and Consumers Energy Company projections are used, and the Edison and Consumers

March, 1999 Gas-Fired Generation in Michigan: Page: 13Assessment of Gas Infrastructure and Generation Costs
21 See Appendix A for details of the projection method and data.
22 For simplicity, an average heat rate of 7,000 btu per kwh (kilowatt-hour) is assumed for the projectionin Figure 7 and Appendix A. This represents an average of 6,500 btu per kilowatt-hour combined-cycle baseloadplant and 10,000 btu per kilowatt-hour peaking plant.
1985 1990 1995 1996 2000 2005 2010 20200
50
100
150
200
Tril
lion
Cub
ic F
eet
Total Gas
Electric Gen
Prepared by: Statistical Analysis Section, MPSC, July 1998Data: International Energy Outlook 1998, DOE/EIA, April 1998
World Natural Gas Consumption Tcf
Figure 8
projections are used to determine growth rates for the remainder of the state.21
The scenario for additional gas use assumes that 100 percent of the incremental electricitygeneration from 1998 to 2010 is gas-fired.22 This sets a reasonable upper bound for scenariopurposes, to address potential capacity or supply constraints on the gas supply and transportationsystem.
World Natural Gas Demand Projection
Natural gas is expected to be the fastest-growing primary energy source in the world over thenext 25 years, according to EIA in its 1998 “International Energy Outlook.” As shown in Figure8, world natural gas consumption growth averages 3.3 percent annually to the year 2020 in theEIA reference case, compared to 2.2 percent for coal. By 2020, gas consumption will be 172trillion cubic feet (Tcf) per year,more than double the 1995consumption of 78.3 Tcf. Primarydeterminants of growth of worldgas consumption are resourceavailability, cost, andenvironmental considerations, all ofwhich contribute to favoring gasover other major fuel sources.
Much of the world growth innatural gas consumption will be forelectrical generation. World use ofnatural gas for electrical generationwas 22.2 Tcf in 1995, and this isexpected to increase to 59.5 Tcf by2020.
U. S. Natural Gas Demand Projection
Growth in natural gas consumption in the United States will be slower than world growth, butnever-the-less will be very significant. EIA projects in its Annual Energy Outlook 98 that U.S.

March, 1999 Gas-Fired Generation in Michigan: Page: 14Assessment of Gas Infrastructure and Generation Costs
1985 1990 1995 1996 2000 2005 2010 202005
101520253035
Bill
ion
Cub
ic F
eet
Electric Gen
Other Uses
Prepared by: Statistical Analysis Section, MPSC, July 1998Data: Annual Energy Outlook1998, DOE/EIA, December 1997
U.S. Natural Gas Consumption Bcf
Figure 9
consumption will grow from 21.6 Tcf in 1995 to 33.7 Tcf in 2020, an increase of 12.1 Tcf or 49percent.
Natural gas used for generating electricity is projected to triple from 1995 to 2020, from 3.4 to9.9 Tcf. This 6.5 Tcf increase in the use of natural gas for electrical generation represents 53percent of the projected 12.1 Tcf total increase in gas consumption shown on Figure 9.

March, 1999 Gas-Fired Generation in Michigan: Page: 15Assessment of Gas Infrastructure and Generation Costs
23 References to Chicago in this analysis refer to various points of sale in the northern Illinois area nearChicago, Illinois. One such point, for example, is the Joliet Hub, near Joliet, Illinois.
24 Based on working gas. Michigan’s total storage is over 1 Tcf when non-cycling base gas is included. “Michigan Natural Gas Storage Field Summary” MPSC. 4 March 1999. <http://cis.state.mi.us/mpsc/gas/storage.htm>
Chapter 4. Natural Gas Infrastructure needed to Serve Michigan’sElectric Needs
To study the impact that new gas-fired generation could have on Michigan, and the ability tobring more gas to Michigan, several possibilities were considered. The analysis used for bothpricing scenarios in Chapter 5 assumes that additional gas supplies will be available at or nearChicago23, and that supply sellers will find a way to bring that gas to Chicago at a competitiveprice.
Using projected electric growth (see Appendix A) and assumptions for heat rates (see Chapter 5),the additional gas needed to supply 100% of the additional generation requirements are:
Requirement 2005 2010
Average Capacity - Mcf/day 327 544
Summer Peak Day Capacity - Mcf/day 522 890
Winter Peak Day Capacity - Mcf/day 374 645
Annual Supply - Bcf/year 119 198
While there is currently not sufficient pipeline capacity into Michigan to accomplish this, severalnew pipelines have been proposed. The analysis in this report assumes that one or more of thesepipelines will be built. This chapter looks first at currently available pipeline capacity toMichigan.
Current Pipeline and Storage field Infrastructure
Michigan is uniquely situated, with its extensive natural gas storage, production, and with supplybasins located both to the north (in western Canada) and to the south. While Michigan-producedgas meets about 25% of Michigan’s needs, Michigan must import the remaining gas supply. Because of its extensive storage, pipeline transportation into Michigan is generally moreconstrained in summer than it is in winter. Some of the pipelines actually change flow directionso that gas physically flows out of Michigan in the winter, from Michigan storage, to help meetthe demand in nearby states.
Michigan has 609 Bcf of cyclable storage capacity, more than any other state.24 During the

March, 1999 Gas-Fired Generation in Michigan: Page: 16Assessment of Gas Infrastructure and Generation Costs
25 The design day is the coldest day that could be expected under gas utility purchase plans, which is usedto estimate the maximum gas load that must be contracted for under Michigan gas utilities’ purchase plans.
26 Vector Pipeline Company is a proposed interstate pipeline that would be built from Joliet, Illinoisthrough Indiana and Michigan to Canada near St. Clair, Michigan. Vector’s expected capacity is 1.01 Bcf/d. SeeFERC docket no CP98-131-000. Vector’s proposal was approved by FERC order dated 10/19/98. “PreliminaryDetermination on Non-Environmental Issues” 19 October 1998. 85 FERC ¶61,083 <http://cips.ferc.fed.us/Q/CIPS/GAS/CP/CP98-131.00P.TXT>
27 TriState Pipeline is a proposed interstate pipeline that would be built from Joliet, Illinois throughIndiana and Michigan to Canada near Marine City, Michigan. TriState filed before the FERC November 9, 1998 inFERC Docket Number CP99-61-000. TriState’s expected capacity is 650 MMcf/d additional capacity to Michigan.“Notice of Applications For Certificates And For A Presidential Permit And Section 3 Authorization.” 24November 1998. <http://cips.ferc.fed.us/Q/CIPS/GAS/CP/CP99-61.000.TXT>
28 Potential additional storage includes Washington 10 (with 42 Bcf of working gas), and Leonard (with 4to 7 Bcf of working gas), which are currently being built.
coldest winter day, about 4.7 Bcf of the total 12 Bcf per day of deliverable storage goes toMichigan utility sales, while the remainder serves Michigan utility transportation customers andother states. Although data is not available to calculate the how much storage servestransportation end-users in Michigan, it is safe to assume that at least 5 Bcf , or 40%, of storagedeliverability leaves Michigan on a winter design day.25 In addition to gas from Michiganstorage, Michigan imports approximately 2.3 Bcf on a winter design day to meet Michigandemand. Therefore, during brief periods of winter when the weather is coldest, Michigan is a netexporter of about 3 to 5 Bcf of gas per day.
The amount of winter transportation capacity available into Michigan is proportional to how coldit is in the Midwest. When the weather is colder, more gas is withdrawn from Michigan storageand is transported out of Michigan, causing more capacity to be available into Michigan. This isexpected to continue in the future. The amount of capacity available in winter will likelyincrease if Vector26 or TriState27 or some other pipeline from Chicago through Michigan is builtbecause their additional supply will likely be tied to additional Michigan storage.28
In the summer, the major source of capacity into Michigan is during periods between storageinjections. The current and expected storage injection cycle does not require use of pipelinecapacity into Michigan every summer day. As discussed later in this chapter, over 50 Bcf ofsummer capacity is and will be available into Michigan. Additional summer capacity is and willbe available in proportion to how warm the past winter was. After a warm winter, remainingstorage balances are higher, and require less supply imports during the following summer to refillstorage. This occasionally leaves additional pipeline capacity that can be released and used forelectric generation. The analysis in this report, as shown in Figure 11, relies solely on summercapacity that is assured - the minimum capacity expected following a colder-then normal winterwhere storage is completely emptied.

March, 1999 Gas-Fired Generation in Michigan: Page: 17Assessment of Gas Infrastructure and Generation Costs
29 Alliance Pipeline (1.3 Bcf/day), Northern Border (0.5 Bcf/day), and also potential Transcanada/GreatLakes expansion to the Midwest (0.3 Bcf/day). Total new certificated, pending, and anticipated pipeline capacityrepresents a 30% increase in U.S. pipeline capacity. Wright, Jeff. FERC Office of Pipeline Regulation.Presentation to NARUC Annual Regulatory Studies Program. 11 August 1998.
30 A backhaul is transportation in a direction opposite to that of flowing gas in the pipeline. It is actuallyan exchange, but is often referred to as backhaul because it is still considered transportation for a fee by thetransporting pipeline.
Figure 10 - Weighted Current and Future Midwest Gas Flows.
Source: EIA Deliverability on the Interstate Natural GasPipeline System, May, 1998, Figure 12, page 36.
The minimum available, however, will not be enough to meet all of Michigan’s incrementalelectric needs. The remaining needed capacity is expected to be provided by new pipelines thatgo through Michigan.
Future Pipeline and Storage field Infrastructure Improvements
With several new pipeline projects being proposed to bring more gas to Chicago,29 new gas loadin Michigan will likely be served via firm transportation of gas purchased at the Chicago hub. The supplies will likely come from Canada and the Gulf. Figure 10 shows the annual flow of gasto the Midwest. The amount of gas transported is proportional to the width of the lines. Thearrows show the path that expected additional supplies will take to get to Michigan, showingflows from both the west and south to Michigan and eastern states.
To rely on additional gas supplies fromChicago, new pipelines and/or significantpipeline expansion to Chicago will beneeded. Also, the ability to deliver adequategas supplies in Michigan significantlydepends on at least one of the new pipelinesproposed to transport gas from Chicagothrough Michigan, particularly for theeastern half of Michigan. Alternativepipeline proposals that transport gas fromChicago east through states outside ofMichigan will provide significantly lessbenefits to the growth of gas-firedgeneration in Michigan. Scenarios in thisstudy did not consider gas transportedthrough Indiana and Ohio because additionalexpansion to Michigan from Ohio, orbackhauls30 from Ontario, Canada wouldprobably be more costly than pipelinesdirectly through Michigan.
Figure 11 shows that, with either of the proposed Vector or TriState pipelines, there will be

March, 1999 Gas-Fired Generation in Michigan: Page: 18Assessment of Gas Infrastructure and Generation Costs
31 The analysis places the required additional summer peak capacity on ANR due to the random locationschosen for required generation facilities. The required additional capacity could be on any pipeline, includingVector or TriState.
32 The best storage fields are former gas producing Silurian-Niagaran reefs that are located in the northernand southern portions of Michigan’s lower peninsula.
Interstate Pipeline Capacity RequiredChicago to Michigan - MMcf/day
ProposedVector/
ANRPCo TlGCo Tristate Total2005
Average Day 138 47 142 327 Capacity Available 138 47 142 327
Additional Capacity Needed 0 0 0 0
2010 Average Day 280 47 216 544
Capacity Available 233 47 216 496
Additional Capacity Needed Summer 47 0 0 47 Winter 0 0 0 0
Figure 11 - Transportation Capacity required on existing and proposed pipelines
Source: Gas Division, MPSC
sufficient transportation capacityavailable into Michigan for annual andwinter generation needs through 2010. To the extent that gas supplies areavailable for purchase at or nearChicago, there will be adequate capacityfor winter supplies necessary to serveelectric needs without jeopardizingservice to existing gas customers. During the summer, however, there willnot be enough capacity to serve all ofthe electric needs during peak periods. By 2010, constraints during these peakperiods will require expanding pipelinecapacity into Michigan by 47MMcf/day.31
The pipelines listed in Figure 11 arethose most likely to providetransportation to various points inMichigan where they intersect withmajor electric transmission lines. Each of these are discussed later in the chapter.
To most efficiently use all available gas transportation capacity into Michigan to meet additionalelectric generation needs, both of the gas price scenarios assume that:
‚ The FERC will further change the design of pipeline rates to be more milage sensitive orchange the method that capacity is released to further increase competition and efficiency. Currently, pipeline rates include an access charge, a fixed rate component designed tomake it more economical to use one pipeline for long hauls instead of multiple pipelines. To the extent that it becomes easier to chain together transportation paths, transportationwill see efficiency gains, and therefore lower costs.
‚ Adequate storage will be made available to meet the additional demand. There are manygas fields in Michigan that would make good storage fields.32 Existing storage can be

March, 1999 Gas-Fired Generation in Michigan: Page: 19Assessment of Gas Infrastructure and Generation Costs
33 Improvements to wells and field piping can improve deliverability to storage, shortening the injectiontime needed to only 3-4 months of 7-month injection season. While this leaves more flexibility for serving electricgeneration during the summer, it does not create any additional summer pipeline capacity into Michigan.
34 An example of how existing storage can be improved is to drill a well horizontally into the gas bearingzone of the storage field, significantly increasing withdrawal and injection capability. Consumers Energy drilledtwo such wells in its Overisel and Salem gas storage fields this past summer. “Horizontal gas storage wells drilledsuccessfully.” Michigan Oil & Gas News Vol 104, No. 30. 24 July 1998. Page 1. “Consumers Energy plans Salinahorizontal wells in Allegan Co. gas storage fields.” Vol 104, No. 20 15 May 1998. Page 1. Also, new Washington10 Storage Corporation drilling include 14 horizontal drain holes that started in September, 1998. “Washington 10drilling program kicked off.” Michigan Oil & Gas News. Vol 104, No. 38. 18 September 1998. Page 1.
1 4 8 12 15 19 23 27 30 34 38 41 45 49 53
Consumers and Detroit Edison 1995 Actuals
WEEK
5
10
15
Tho
usan
ds
Mw
h
CE/DE maximum
CE/DE minimum
Michigan Electric Load Profilemaximum and minimum during day
Figure 12 - Seasonal load profile for electricity needs based on actual 1995 Consumers Energy and Detroit Edison load profiles.
Source: Statistical Analysis Section, MPSC
expanded with relatively inexpensive improvements.33 Also, there are several places inthe lower half of Michigan’s lower peninsula that salt cavern storage can be built. Whilemore expensive to develop than converting gas producing fields, salt cavern storage canbe cycled as often as the surface facilities will allow, reducing the per unit cost to becompetitive with other storage. Either way, new and existing storage will have to be ableto be cycled more often that is currently the case.34
The chart in Figure 12 shows the seasonality of the electric load that additional gas supply wouldneed to meet. Each dip on the chart is due to reduced electric demand on weekends and holidays. Much of this load will have to be handled by storage that can inject gas on weekends and

March, 1999 Gas-Fired Generation in Michigan: Page: 20Assessment of Gas Infrastructure and Generation Costs
35 In its application, Trunkline says that it operates close to capacity only by discounting, and projects thatit will have excess capacity in the future. “Notice of Application.” FERC. Docket number CP98-645-000. 3 August1998 <http://cips.ferc.fed.us/Q/CIPS/GAS/CP/CP98-645.00A.TXT>.
36 See also Gas Daily table of average weekly index prices for Henry Hub, Chicago City Gates, andSouthern Michigan Consumer Energy, and MichCon.
37 See for example “Antrim Production Set to Decline, Ending Nine Years of Growth.” Inside Ferc GasMarket Report. 27 November 1998. Page 1.
38 The FERC can approve a new pipeline without it being fully contracted by putting the recovery of thepipeline’s cost at risk (see §157, 18 CFR of FERC regulations). FERC’s preliminary approval of Vector Pipeline,for example, used a at risk condition because Vector was only partially contracted.
withdraw it during the week. The average gas load required generally has both a summer andwinter peak. The amount of gas required to serve this load profile in the highest winter month (in2005 and 2010) averages 96% of the high summer month load. Therefore the total monthly gasrequirements are relatively equal throughout the year.
The daily swings in load, however, are greatest in the summer months June though August,where the daily peaks are highest, and the load can change by a factor of 2 by the next day ortwo. In addition, the summer peaks are likely to be met using peakers with higher heat rates(10,000 Btu’s/kwh) than combined cycle (6,500 Btu’s/kwh), which further increases peaking gasrequirements. Thus, the gas required in 2005 and 2010 to serve this load profile on the highestwinter day is only 69-72% of the highest summer day.
Currently, there is pipeline capacity available into Michigan at a discount. Much of the pipelinetransportation to Michigan is discounted below maximum FERC-allowed rates. Trunkline GasCompany, which is currently fully subscribed, says that recent experience reveals that over 90%of its capacity is discounted, two thirds at discounts exceeding 33% of maximum rate.35 Therecently reported basis from Henry Hub to Chicago is only a fraction of maximum rates (seeFigure 18, Chapter 5).36 On a short-term basis, then, it is a buyers market for off-peaktransportation. These market prices do not, however, reflect expected future demand growth. While there will likely continue to be off-peak discounts available for transportation intoMichigan, the scenarios assume that, when averaged on an annual basis, there will be no orinsignificant discounting in 2005 and 2010.
Michigan production is not included as a potential source of additional supply for meetingadditional electric generation needs. This is because current projections for Michigan productionshow that future Michigan production will be “a long steady decline.” 37
Finally, it is important to note here that the FERC no longer relies on proven long term reservesto approve new pipelines. Since interstate pipelines are now transporters instead of sellers,adequate long-term transportation contracts to fill the pipeline are all that is necessary. 38 Thesupply to fill those contracts is assumed to be provided by the market. This highlights one
March, 1999 Gas-Fired Generation in Michigan: Page: 21Assessment of Gas Infrastructure and Generation Costs
39 From 1954 until 1985, the wellhead price of gas was regulated, but the producers never were regulated. Their decision to find and develop gas reserves have always been based on market perception.
40 ANR Pipeline Company reports its unsubscribed transportation capacity on its web site <http://www.anrpl.com/GISB/>
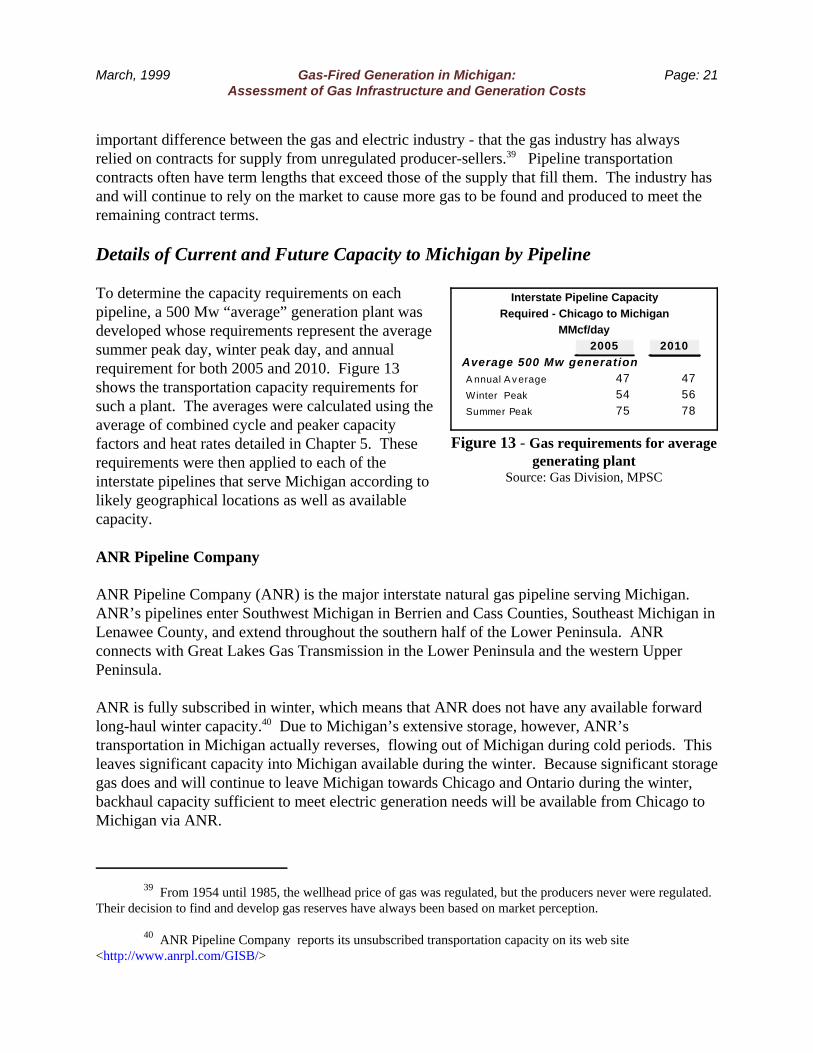
Interstate Pipeline CapacityRequired - Chicago to Michigan
MMcf/day2005 2010
Average 500 Mw generation A nnual A v erage 47 47 Winter Peak 54 56 Summer Peak 75 78
Figure 13 - Gas requirements for averagegenerating plant
Source: Gas Division, MPSC
important difference between the gas and electric industry - that the gas industry has alwaysrelied on contracts for supply from unregulated producer-sellers.39 Pipeline transportationcontracts often have term lengths that exceed those of the supply that fill them. The industry hasand will continue to rely on the market to cause more gas to be found and produced to meet theremaining contract terms.
Details of Current and Future Capacity to Michigan by Pipeline
To determine the capacity requirements on eachpipeline, a 500 Mw “average” generation plant wasdeveloped whose requirements represent the averagesummer peak day, winter peak day, and annualrequirement for both 2005 and 2010. Figure 13shows the transportation capacity requirements forsuch a plant. The averages were calculated using theaverage of combined cycle and peaker capacityfactors and heat rates detailed in Chapter 5. Theserequirements were then applied to each of theinterstate pipelines that serve Michigan according tolikely geographical locations as well as availablecapacity.
ANR Pipeline Company
ANR Pipeline Company (ANR) is the major interstate natural gas pipeline serving Michigan. ANR’s pipelines enter Southwest Michigan in Berrien and Cass Counties, Southeast Michigan inLenawee County, and extend throughout the southern half of the Lower Peninsula. ANRconnects with Great Lakes Gas Transmission in the Lower Peninsula and the western UpperPeninsula.
ANR is fully subscribed in winter, which means that ANR does not have any available forwardlong-haul winter capacity.40 Due to Michigan’s extensive storage, however, ANR’stransportation in Michigan actually reverses, flowing out of Michigan during cold periods. Thisleaves significant capacity into Michigan available during the winter. Because significant storagegas does and will continue to leave Michigan towards Chicago and Ontario during the winter,backhaul capacity sufficient to meet electric generation needs will be available from Chicago toMichigan via ANR.
March, 1999 Gas-Fired Generation in Michigan: Page: 22Assessment of Gas Infrastructure and Generation Costs
41 See Figure 15.
42 ANR has 133 Bcf of underground storage in Michigan. “Michigan Natural Gas Storage FieldSummary” MPSC. 4 March 1999. <http://cis.state.mi.us/mpsc/gas/storage.htm>. ANR reports itsunsubscribed storage capacity on its web site <http://www.anrpl.com/GISB/>
43 The gas industry in Michigan considers summer the 7-month period April through October, or 214 days. Winter is the remaining 5 months. Gas is traditionally injected into Michigan storage during the 7 summer months,and withdrawn during the 5 winter months.
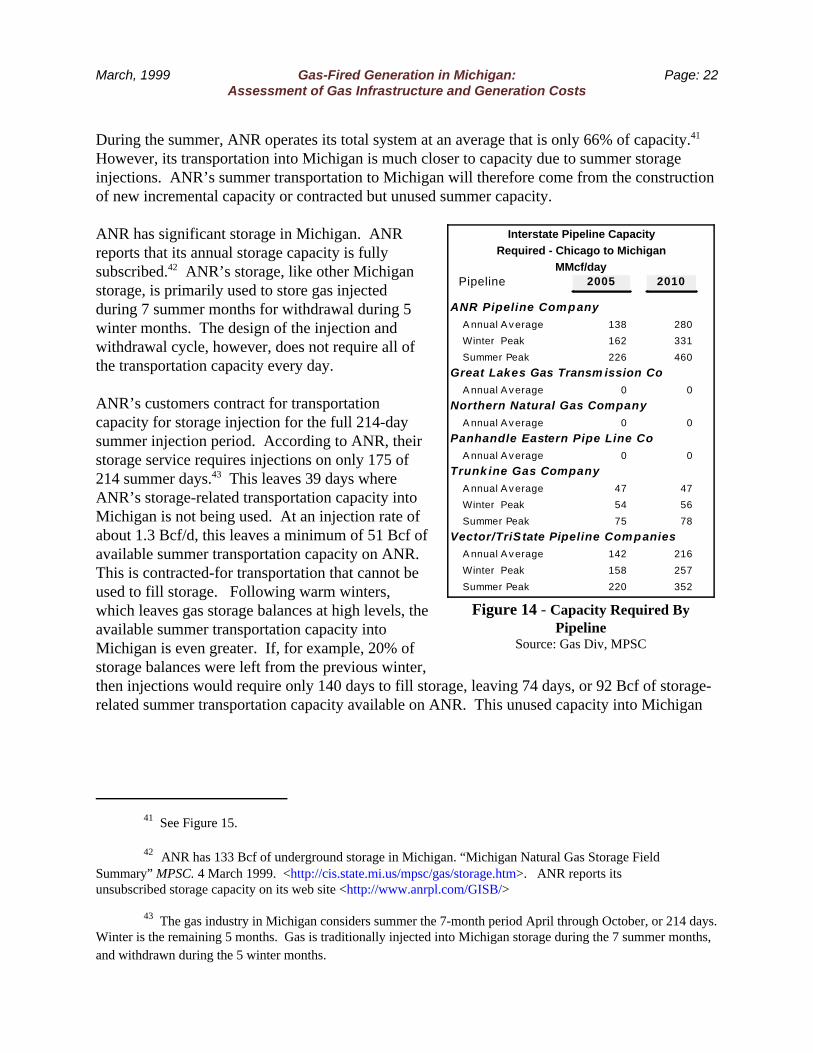
Interstate Pipeline CapacityRequired - Chicago to Michigan
MMcf/day Pipeline 2005 2010
ANR Pipeline Company A nnual Average 138 280
Winter Peak 162 331
Summer Peak 226 460
Great Lakes Gas Transm ission Co A nnual Average 0 0
Northern Natural Gas Company A nnual Average 0 0
Panhandle Eastern Pipe Line Co A nnual Average 0 0
Trunk ine Gas Company A nnual Average 47 47
Winter Peak 54 56
Summer Peak 75 78
Vector/TriS tate Pipeline Companies A nnual Average 142 216
Winter Peak 158 257
Summer Peak 220 352
Figure 14 - Capacity Required ByPipeline
Source: Gas Div, MPSC
During the summer, ANR operates its total system at an average that is only 66% of capacity.41
However, its transportation into Michigan is much closer to capacity due to summer storageinjections. ANR’s summer transportation to Michigan will therefore come from the constructionof new incremental capacity or contracted but unused summer capacity.
ANR has significant storage in Michigan. ANRreports that its annual storage capacity is fullysubscribed.42 ANR’s storage, like other Michiganstorage, is primarily used to store gas injectedduring 7 summer months for withdrawal during 5winter months. The design of the injection andwithdrawal cycle, however, does not require all ofthe transportation capacity every day.
ANR’s customers contract for transportationcapacity for storage injection for the full 214-daysummer injection period. According to ANR, theirstorage service requires injections on only 175 of214 summer days.43 This leaves 39 days whereANR’s storage-related transportation capacity intoMichigan is not being used. At an injection rate ofabout 1.3 Bcf/d, this leaves a minimum of 51 Bcf ofavailable summer transportation capacity on ANR. This is contracted-for transportation that cannot beused to fill storage. Following warm winters,which leaves gas storage balances at high levels, theavailable summer transportation capacity intoMichigan is even greater. If, for example, 20% ofstorage balances were left from the previous winter,then injections would require only 140 days to fill storage, leaving 74 days, or 92 Bcf of storage-related summer transportation capacity available on ANR. This unused capacity into Michigan
March, 1999 Gas-Fired Generation in Michigan: Page: 23Assessment of Gas Infrastructure and Generation Costs
44 See Chapter 5. This load growth will require pipeline capacity additions for winter peak periods, andadditional storage, but will likely also create additional unused capacity in similar proportion during periods in thesummer when storage is not being refilled.
45 Great Lakes projects a rate of about $0.80/Mcf (including scenario projected price of compressor fuelused along the way) from Emerson, Manitoba, its source. Great Lakes’ current maximum rates, including projectedfuel price, would be about $0.55/Mcf by comparison.
will continue to be available, even after other load growth.44 In addition, gas loads are less onsummer weekends. ANR’s customer shippers in the Midwest send more gas into Michigan onweekends for storage injection than they do during the week. This increases the likelihood thatthe unused storage-related transportation capacity into Michigan will be available during theweek, when it would likely be required for electric generation.
The analysis locates three 500 Mw average plants near ANR in 2005, and 3 more by 2010. Therequirements are shown in Figure 14.
Great Lakes Gas Transmission, LP
Great Lakes Gas Transmission, Limited Partnership’s (Great Lakes) pipelines enter intoMichigan in Gogebic County. Great Lakes is essentially the southern arm of TransCanadaPipelines Ltd, bringing Canadian gas into Michigan’s western Upper Peninsula, then back intoCanada north of Detroit near St. Clair, Michigan. According to Great Lakes Gas, it does not haveany available forward haul capacity for any time of the year. This means that additionaltransports will require pipeline additions, and associated compression facilities. According toGreat Lakes, rates for such expansion would be well above current maximum rates.45
As Great Lakes transports gas through Michigan, significant amounts of gas are injected into andwithdrawn from storage fields in northern Lower Michigan. During winter storage withdrawalperiods, Great Lakes’ transportation is at capacity downstream of the storage fields, but there isand will be some winter transportation capacity on Great Lakes in the Upper Peninsula. Thiswould not provide any needed summer transportation into Michigan. Therefore, the analysisassumes that gas for additional electric generation will not be transported into Michigan viaGreat Lakes.
Great Lakes’s facilities in Michigan will be useful, however, for backhaul capacity to variousparts of northern Michigan for gas that is has been transported into southern Michigan via otherpipelines. The analysis concludes that Great Lakes will only be used for backhaul or relativelyshort forward haul of gas that has already been delivered into Michigan from ANR Pipeline andthe proposed Vector or TriState pipelines. Since Great Lakes has connections with ANR atFarwell, Michigan and at the Capac and Muttonville storage fields, capacity on Great Lakes is

March, 1999 Gas-Fired Generation in Michigan: Page: 24Assessment of Gas Infrastructure and Generation Costs
46 Gas can also be transported to Gaylord via exchange, using Michigan production or storage that isdelivered near Gaylord.
47 Panhandle intersects with Trunkline in Tuscola, Illinois, and ANR in Defiance, Ohio.
48 Panhandle reports its unsubscribed capacity on its web site <http://msrpost.messenger.cmsenergy.com/scripts/ndisapi.dll/pe/Home_Frame_PE>
instead assumed to be used to backhaul gas north to Gaylord in northern Michigan.46 Also, GreatLakes has a connection with MichCon at St. Clair, so Great Lakes could be used to backhaul gasback into lower Michigan from either Vector or TriState via MichCon at St. Clair.
Northern Natural Gas Company
Northern Natural Gas Company’s (Northern) pipelines enter into Michigan in Gogebic County,traveling east to Marquette and north to the Keweenaw Peninsula. According to Northern,significant capacity additions would be necessary to deliver additional volumes in Michigan’supper peninsula at a sufficiently high pressure to serve electric generation. Northern projects thatit would have to add approximately $80 million of pipeline and compression facilities fromMinnesota into Michigan to be able to supply a 500 Mw combined cycle plant in Marquette,Michigan. The high cost of expansion would make the delivered gas cost prohibitively expensivewhen compared to other possible ways to get gas to Michigan’s Upper Peninsula. For example,Great Lakes Gas Transmission can backhaul gas to anywhere along its pipeline across thesouthern part of the U.P. for less that what Northern would have to charge with expansion. Therefore, it is not economical to transport gas into Michigan via Northern’s pipeline, fromMinnesota to Marquette, for use in electric generation.
The analysis therefore assumes no gas via Northern.
Panhandle Eastern Pipe Line Company
Panhandle Eastern Pipe Line Company’s (Panhandle) pipelines enter into Michigan in LenaweeCounty, extending to Wayne and Kalamazoo Counties. While Panhandle is a relatively minorsupplier to Michigan, it has connections with several other pipelines in the Midwest.47 AlthoughPanhandle is fully subscribed,48 it occasionally has unused capacity that would be useful fortransporting to other pipelines. Panhandle would also be useful for partial backhauls, such as forgas transported from storage fields in Ontario, Canada to areas south of Detroit, Michigan.Backhauling from Canada during cold periods would make more capacity on other pipelines inMichigan available for electric generation.
The analysis does not assume any gas via Panhandle.

March, 1999 Gas-Fired Generation in Michigan: Page: 25Assessment of Gas Infrastructure and Generation Costs
49 Trunkline reports its unsubscribed capacity on its web site <http://msrpost.messenger.cmsenergy.com/scripts/ndisapi.dll/tg/Home_Frame_TG>
50 As proposed, TriState would transport up to 450 MMcf/d through Consumers, and up to an additional200 MMcf/d to Consumers near its White Pigeon connection with Trunkline. The later could be delivered toConsumers from TriState or Trunkline, but not both at the same time.
51 Trunkline could also be used to transport gas to its Tuscola interconnect with Panhandle Eastern PipeLine Company near Tuscola, Illinois. See Panhandle discussion.
52 “Notice of Application.” FERC Docket no CP98-645-000. 3 August 1998. <http://cips.ferc.fed.us/Q/CIPS/GAS/CP/CP98-645.00A.TXT>. The pipeline is one of Trunkline’s three mainline parallel pipelines, andwill be used to transport hydrocarbon vapors from Chicago to Louisiana, and is related to the Alliance Pipelineproject. “Notice of Availability of Final Environmental Impact Statement.” 24 August 1998. Docket no CP97-168. <http://cips.ferc.fed.us/Q/CIPS/GAS/CP/CP97-168.0AJ.TXT>. Since Alliance is expected to result in excesscapacity into Chicago for the first few years, Trunkline’s excess capacity will get worse before it will get better.
Trunkline Gas Company
Trunkline Gas Company’s (Trunkline) pipelines terminate at the Michigan border, servingfacilities of Consumers Energy Company (Consumers) and Michigan Gas Utilities Company inSt. Joseph County. Trunkline has capacity available both summer and winter. Trunkline’sprimary Michigan customer, Consumers, has released 485 MMcf/d of capacity back to Trunklineover the past decade.
Although Trunkline reports that it is fully subscribed49, the analysis concludes that Trunklinecurrently has up to 350 MMcf/day available from Tuscola, Illinois to Michigan. This pipelinewas originally built to provide 700 MMcf/day to Consumers, but is used today to meetConsumers design day of only 336 MMcf/day.
Capacity will not likely be available on Trunkline, however, if TriState Pipeline is built. Theproposed TriState Pipeline will use all available capacity on Consumers pipeline system from theMichigan border50, so any available long-line Trunkline capacity will be better used to transportgas to Chicago, or to markets served from Chicago.51
In the event that TriState is not built, up to 350 MMcf/d of gas could be transported to Michiganon Trunkline using supply from Chicago or elsewhere delivered to Trunkline from variouspipelines that intersect Trunkline (such as Panhandle, which could deliver gas to Trunkline atTuscola, Illinois).
In addition, Trunkline has filed with the FERC to convert one of its pipelines to transport liquids,removing 250 MMcf/d of long-line capacity from Louisiana.52 While this capacity mayeventually be needed for additional gas load in Michigan, Trunkline’s interest is to find a moreimmediate use of the pipeline.

March, 1999 Gas-Fired Generation in Michigan: Page: 26Assessment of Gas Infrastructure and Generation Costs
53 Available transportation capacity will consist of capacity not already under contract as well as unusedcapacity under contract. Both pipelines have entered into precedent agreements with various customers todemonstrate market need to the FERC. Often, with new pipelines, the entire capacity is not contracted for. Also,gas marketing companies, which are not limited to specific service areas, can and do contract for a large portion ofthe new pipeline's capacity. On TriState, for example, 26% of its 450 MMcf/d long haul (Joliet to Dawn) capacityis not contracted for. Marketers CMS Marketing and Westcoast Energy have contracted for 180 MMcf/d, or 40%of TriState's long haul capacity. Therefore, two thirds of TriState's long-haul capacity is either available, or held bymarketing companies that will use it where their future business is. At least some of this capacity will therefore beavailable to Michigan.
54 As proposed, either have adequate capacity. Vector proposes 1.1 Bcf/d of capacity, and TriStateproposes 0.65 Bcf/d. Vector has been approved by FERC order.
55 “EIA report Deliverability on the Interstate Natural Gas Pipeline System.” EIA. May, 1998. Page 103.
56 EIA report. Figure 32. Page 94.
57 EIA report. Page 60.
The analysis assumes that one 500 Mw average plant will be located near Trunkline in 2005. Therequirements are shown in Figure 14.
Vector/TriState Proposed Pipelines
Assuming that either Vector Pipeline or TriState Pipeline is built from Chicago throughMichigan to Ontario, capacity will be available at market prices for transportation from Chicagoto Michigan. Even if most or all of the initial capacity is contracted for deliveries east ofMichigan, either pipeline can be expanded at nominal costs.53
The analysis assumes that a significant portion of gas, 142 to 352 MMcf/d, will be delivered byone or both of these pipelines from Chicago to Michigan.54 If neither pipeline is built, then otheradditional capacity will be required from Chicago to Michigan. The requirements are shown inFigure 14.
Transportation To Chicago
According to a recent EIA report Deliverability on the Interstate Natural Gas Pipeline System(May 1998)55, there is currently long-line capacity to the Midwest to meet new gas demand, but itis only available off peak.
The timing of the available capacity is important. Although the EIA report shows thatnationwide only 80 Tbtu/d, or 63%, out of 127 Tbtu/d was used on an annual average,56 figuresfor Michigan show less capacity. The summary of the Midwest report section says that, “whendeliveries to other interconnecting interstate pipelines are included, the peak-day total isequivalent to 99 percent of available transportation capacity.”57

March, 1999 Gas-Fired Generation in Michigan: Page: 27Assessment of Gas Infrastructure and Generation Costs
58 EIA report. Page 42.
59 Total capacity into Michigan per Table A2 is 6,476 MMcf/d, and total capacity out is 3,747, for a netcapacity to Michigan of 2,729 MMcf/d. Amounts shown on this table are net amounts to Michigan except forANR. ANR SW capacity is total to Michigan, and is not reduced for up to 1,417 MMcf/d of export capacity, whichvaries depending on how storage services for other states are used.
60 Low usage reflects full capacity being available for transports both into and out of Michigan, as pipelineflow changes direction in winter due to use of storage.
Broken down by supply area, the report details 10 major national supply corridors. Deliveries tothe Midwest are via 3 of the corridors - Southwest, Southeast, and Canada, and also indirectlyfrom Western. These corridors provide the deliveries to Michigan shown in Figure 15. TheSouthwest corridor consists of pipelines from Kansas, Oklahoma, and Texas. The Southeastcorridor consists of pipelines from Louisiana. The Canadian corridor consists of pipelines fromAlberta, Canada. The Western corridor consists of pipelines from Wyoming and Colorado thatconnect to the Southwest corridor. From the Southwest, transportation capacity serving theMidwest off peak is only 50% of utilized, so no additional capacity is needed.58 New supply,however, will require additional capacity from the Southeast and Canada. From Canada majortransportation capacity expansions are projected to the Midwest. As more Canadian gas goes toChicago, expansions will be needed to bring gas to Michigan. The transportation capacityexpansions to bring more Canadian gas into the US are closely tied to proposed pipelines thatwould transport more gas through or near Michigan towards the Northeast.
Existing Interstate Pipeline Capacity To Michigan
Net Capacity59
MMcf/d Ave Usage Ave Use Peak Use Off Peak UseTable A2 Table A2 Figure 15 Figure 15 Figure 15
ANR Pipeline 1,470 SW 42%60 70% 100% 66% 932 SE 48%
Great Lakes 120 91% 94% 132% 59% NNGCo 125 66% 92% 107% 80% PEPLco 760 59% 78% 98% 58% Trunkline 739 78% 74% 90% 66%
Figure 15 Capacity to Michigan from Supply Areas Source: EIA Report on Deliverability On the Interstate Natural Gas System, May, 1998,
Table A2, page 103, and Figure 15, page 61.
The EIA report notes that gas from Western supply uses most of existing transportation capacity,and projects capacity expansions will bring more gas to the Midwest. From the Southeast, newsupply being developed in the Gulf of Mexico will be filling existing capacity from that area, sothe report concludes that new pipelines will not be needed until deep-water development in theGulf increases production over the next decade. New production will then replace the rapiddecline in production brought on by low prices (and low drilling) in the late 1980's.

March, 1999 Gas-Fired Generation in Michigan: Page: 28Assessment of Gas Infrastructure and Generation Costs
61 See footnote 29.
62 Gas Daily reported that Northern Border’s expansion went into service on 12/22/98. “Northern Borderopens expansion for deliveries.” Gas Daily. 22 December 1998. Page 1.
There are several proposed new pipelines that would bring gas to Chicago.61 One of them ,Alliance Pipeline, is a 1.3 Bcf/day pipeline that would bring gas from western Canada to Chicagostarting in the fall of 2000. Alliance Pipeline was approved by the FERC on 9/17/98. See FERCdocket number CP97-168-000. Also, Northern Border Pipeline Company recently put its new0.7 Bcf/day expansion capacity into service.62

March, 1999 Gas-Fired Generation in Michigan: Page: 29Assessment of Gas Infrastructure and Generation Costs
63 In the electric industry, prices and costs are stated either in $/Mwh (dollars per megawatt-hour) or¢/kwh (cents per kilowatt-hour). For comparison, a cost of 34.32 $/kwh is equal to 3.432 ¢/kwh.
64 The Gas industry uses $ per dekatherm ($/Dth or $/MMBTU) for pricing gas to reflect its energy levelin BTU’s (British Thermal Units). Natural gas that is delivered to Michigan has an energy value of 1,016 BTU’sper cubic foot per EIA’s “Natural Gas Annual 1997" EIA. <ftp://ftp.eia.doe.gov/pub/oil_gas/natural_gas/data_publications/natural_gas_annual/current/pdf/nga97.pdf>. All gas units in this report are stated in Mcf using theequation 1 Mcf (thousand cubic feet) = 1.016 Dth.
65 To convert these to nominal dollars, multiply the year 2005 figures by 1.198 and the year 2010 figuresby 1.390. These adjustments are calculated from the GDP all index deflator in EIA’s Annual Energy Outlook1998. This for instance, gives a year 2005 actual price for the combined cycle of $41.12, compared to the real(inflation adjusted) price of $34.32 shown on figure 16.
Bus Bar Cost of Gas-Fired Generation - $/Mwh2005 2010
Cost Item Ref HiGrowth Ref HiGrowth
Combined Cycle Gas transportation 3.04 3.09 3.11 3.24
Gas storage 0.51 0.51 0.64 0.64
Gas w ellhead 14.68 15.71 15.78 18.58
Capital Costs 12.09 12.09 11.17 11.17
O&M 4.00 4.00 4.00 4.00
Tota l (1998$) 34.32 35.39 34.69 37.62 Tota l Nominal 41.12 42.40 48.22 52.30
Peaker Gas transportation 4.68 4.75 4.78 4.98
Gas storage 0.79 0.79 0.98 0.98
Gas w ellhead 22.59 24.16 24.27 28.58
Capital Costs 58.24 58.24 58.24 58.24
O&M 4.00 4.00 4.00 4.00
Tota l (1998$) 90.29 91.94 92.26 96.77 Tota l Nominal 108.18 110.15 128.25 134.52
Figure 16 - Estimated Bus Bar costs for two gas supply scenarios (1998 dollars)
Source: Gas Div, MPSC
Chapter 5. Cost of Gas-Fired Electricity Generation
The busbar cost of electricity from gas-fired generation is driven by two major cost components,capital costs and fuel costs. In the judgement of Commission Staff, capital costs represent muchless uncertainty than fuel costs, and so variations from the results shown on Figure 16 will bedriven primarily by differences in the delivered cost of natural gas.
Gas supply costs are market driven,and therefore uncertain in thefuture. Actions taken by the MPSCwill not have direct effects on theprice of gas supply into Michigan,although approvals for localpipelines and storage facilities mayhave an indirect effect.
Figure 16 summarizes the projectedbusbar costs for both CombinedCycle and Turbine Peaker in $ perMwh.63 Figure 17 shows the samegas supply projected costs in $ perMcf.64 These prices are in 1998dollars, and would need to beadjusted upward if converted tonominal costs.65 For instance, theyear 2005 real dollar price of$34.32 shown on the Figureconverted to nominal dollars is$41.12.

March, 1999 Gas-Fired Generation in Michigan: Page: 30Assessment of Gas Infrastructure and Generation Costs
66 The scenarios assume that 4.3% of gas transported and 1.1% of gas injected and withdrawn fromstorage will be used for fuel to drive compressors that move the gas.
67 No attempt is made to determine the need for an Act 69 (PA 1929) review to determine the need for acertificate of convenience and necessity. To the extent that new gas-fired generation is located in the serviceterritory of a gas utility, such a review may be necessary.
Cost of Gas Supply - $/Mcf2005 2010
Cost Item Ref HiGrowth Ref HiGrowth Gas transportation 0.48 0.48 0.49 0.51
Gas storage 0.08 0.08 0.10 0.10
Gas wellhead 2.29 2.46 2.47 2.90
Total (1998$) 2.85 3.02 3.05 3.51
Figure 17- Estimated Gas Supply costs for supply scenarios in figure above (1998 dollars)
Source: Gas Div, MPSC
Two wellhead gas price scenarios were developed. The first price scenario uses the EIA referencewellhead price projection from its Annual Energy Outlook 1998. The high price scenario usesthe EIA high growth wellhead price projection from the same report. Each scenario uses thesame projected transportation and storage costs, developed by Commission Staff. However, gasis used for transportation and storage costs and so the higher wellhead prices in the high pricescenario also yields higher transportation and storage costs .66
The cost components for gas-firedelectricity generation are presented inthe following sections. Discussionsof the components for gas costs arefirst, and the chapter concludes withthe components affecting the capitalcosts for two representative gas-firedgeneration facilities. Not quantifiedfor this report but discussed briefly isthe impact of the utilization of thegenerating units. The more the plantis used, the more Mwh the capitalcosts are spread, and the lower the final Mwh cost.
Assumed Characteristics of Gas-Fired Generation
Geographic location
The most economical, and therefore logical, locations for new gas-fired generation in Michiganare where existing high-pressure gas transmission pipelines intersect high-voltage electrictransmission lines. A review of possible plant locations shows that a significant number oflocations in Michigan might be available to reduce the capital construction costs of a generatingplant, and the summary capital costs in this report assume optimum plant locations. The cost oflateral pipelines from high-pressure interstate pipelines to the point of use at the generation plantis therefore an insignificant portion of total costs.67
Michigan’s natural gas transmission pipeline maps and Michigan’s electric transmission linemaps were compared to judge likely locations for 500 Mw plants. Major gas transmissionpipelines cross electric transmission lines at these locations:

March, 1999 Gas-Fired Generation in Michigan: Page: 31Assessment of Gas Infrastructure and Generation Costs
68 If the location in Gratiot County is connected to both Michigan Gas Storage and MichCon, about 3miles of pipeline would have to be built to each existing gas transmission line. When averaged in with the otherlocations, the total is still less than one mile.
Gas Pipeline(s) Location Scenario Use Mw ANR Pipeline Sparta Twp, Kent County 2005 500
Jamestown Twp, Ottawa County 2005,2010 1,000Covert Twp, Van Buren County 2010 500York Twp, Washtenaw County 2010 500Baroda Twp, Berrien County -
Consumers Energy Alamo Twp, Kalamazoo County 2005 500Great Lakes Thetford Twp, Genessee County 2005 500
Hayes Twp, Otsego County 2005 500Great Lakes/MichCon China Twp, St. Clair County 2005 500MichCon South Lyon Twp, Oakland County 2005 500
Independence Twp, Oakland County 2010 500Mich Gas Storage/MichCon North Star Twp, Gratiot County/
Newmark Twp, Gratiot County 2010 500
Each of these are logical locations for 500 Mw generation plants, either combined cycle orpeaker. The locations on Consumers Energy and MichCon require that gas supply be transportedto their facilities in Michigan via either an existing interstate pipeline (such as ANR Pipeline orTrunkline) or a new pipeline (such as Vector or TriState). Capacity on an existing pipeline ofConsumers and MichCon may be a limiting factor unless the gas is delivered to a point that isopposite to the seasonal flow through that pipeline in amounts that do not exceed design limits. Deliveries to Consumers near Kalamazoo can be made via ANR Pipeline from the north,Trunkline from the south, or via interconnection with a new pipeline from Chicago.
Deliveries on Great Lakes can be made by backhauls from St Clair, Michigan using supply fromVector or TriState, or from Farwell from ANR Pipeline.
For the purpose of examining the cost of delivered supply, it is assumed that 7 of these locationsare selected to meet projected additional electric requirements for 2005, and another 5 areselected to meet projected additional electric requirements for 2010. Since projected demandwas not divided regionally, no attempt was made to precisely match location with projectedelectric demand for that area. Instead, locations were chosen with priority given to existingpopulation centers and location of existing generation. Berrien County could have just as wellbe used, for example, as Gratiot County or other counties not included in the listing above. Localsiting issues and economics may result in many other possible locations where non-major electricand gas transmission facilities cross.
The availability of these locations for generation suggests that the average length of laterals fromexisting gas transmission pipelines to the plant will be less than 1 mile.68 When averaged withother costs, the cost effect of these required laterals will be insignificant. Due to cost andenvironmental considerations, no electric transmission lines were assumed to be constructed. Instead, the scenarios place new generation near existing electric transmission. To the extentfuture locations require electric transmission lines to be constructed, significant additional costs

March, 1999 Gas-Fired Generation in Michigan: Page: 32Assessment of Gas Infrastructure and Generation Costs
69 Estimated cost for electric transmission line is as much as $1 million per mile, and is very site specific.
70 These capital costs assume larger installations. Smaller sizes may result in higher per unit costs.
71 Appendix C, “Integrated Resource Plan 1994-2008" The Detroit Edison Company, August, 1994
72 For an example of this improvement, an article in Power Generation Technology International states that increases in gas turbine exhaust temperatures over the last decade have significantly improved combinedcycle performance to 59% gross thermal efficiency (5,785 BTU/kwh). "Next Generation In Combined Cycle ForA Deregulated Market.” Power Generation Technology International.
could be added.69
Capital costs
Capital costs are in a range of $450.00 to $600.00 per kw (1997 $s) for combined cycle and$250.00 to $350.00 per kw for gas peakers. These numbers are very sensitive to site costs suchas distance to gas and electric transmission lines. Also there are economies of scale whenadditional capacity is installed at one site. For this study, $500 per kw was used for combinedcycle, and $300 was used for peakers.70 Both are assumed as 1998 dollars.
Heat rates
Heat rates are expected at 6,300 to 6,700 British Thermal units (BTU) per kwh for combined-cycle units and about 10,000 BTUs per kwh for gas turbine peakers. Plant use and dispatch canhave an impact on overall heat rates. For this study, 6,500 BTU was used for combined cycle,and 10,000 BTU was used for peakers. Steam and heat balances have to be optimized to reachthese optimal heat rates.
The starting point for the combined cycle heat rate analysis is the Detroit Edison’s 1994Integrated Resource Plan filed in August 1994.71 The new combined - cycle unit (non - phased)had a heat rate of 6,949 BTU /kwh at 241 Mw maximum. The new combustion turbine had aheat rate of 10,545 BTU /kwh at 159 Mw maximum. This 1994 study is now a bit dated. Indeed, improvements in heat rates could be significant in the 1998-2010 time frame, but for thisanalysis future improvements based on technology not yet operationally proven were notconsidered.72
Capacity factor
The capacity factor for gas combined-cycle units could vary from 40% to 80% or even higher depending on dispatch, contracts, etc. The Mwh availability is assumed to be about 90%. Thisfactor could have the single biggest impact on unit cost. Because the Midwest is predominatelycoal generation and pooling dispatch is based on marginal cost (fuel plus incremental operating

March, 1999 Gas-Fired Generation in Michigan: Page: 33Assessment of Gas Infrastructure and Generation Costs
73 Of course, a generating plant may be built for the purpose of selling to a specific retail open accessmarket, rather than into a wholesale power pool. The future structure of the electric generation market is not clear atthis time.
74 Per a June 4, 1998 analysis by Financial Analysis and Accounting Section, 16.83% is for combinedcycle merchant plant. The cost factor for a utility-owned base load plant is 13.66%.
75 ICF Kaiser Consulting Group studied the effects of proposed new pipelines to the Midwest on gassupply prices in the years 2000-2001. The study projects a $0.20-0.30/Mcf price decrease in Chicago if Alliance
and maintenance cost), any gas plant must overcome the disadvantage of a relatively highvariable cost and hence a lower dispatch priority if it is part of a power pool.73 By contrast, theMCV plant in Midland had a very high utilization rate of 91.3 % in 1997 because of a specificcontract clause which based payments on total delivered electricity, and so the MCV plant wasnot dispatched on an “economic basis.” Thus, actual capacity factors will depend on whether theadditional generation capacity is a dispatched merchant plant or a contracted plant. In 1998, forexample, the MCV plant was dispatched on a more economic basis, and had a utilitzation rate of79.5%. For this study 80% was used for 2005, and 87% was used for 2010 for combined cycle,and 10% was used for both 2005 and 2010 for peakers.
Combined Cycle Plant Annual Fixed Costs
The capital costs calculated in Figure 16 started with a projected cost of $500 /kw, then appliedan annual fixed cost factor for merchant plants of 16.83%74 and the capacity factors stated above. For the purposes of calculating fixed costs, the plants were assumed to be dispatched merchantplants.
Peaking Plant Annual Fixed Costs
The capital costs calculated in Figure 16 started with a projected cost of $300 /kw, then appliedan annual fixed cost factor of 16.83%, and a capacity factor of 10% for both 2005 and 2010.
Natural Gas Fuel Costs
To estimate costs of transporting gas from the wellhead to each generating plant in Michigan, thescenarios use current pipeline rates as a proxy for future costs. This assumes that cost reductionsdue to competition and increases in efficiency are offset by the increased cost of expansions. However, for major pipeline expansions, costs are not likely be rolled directly into (and thereforeincrease) current rates. For major expansions, the incremental expansion transportation cost iscalculated on a stand-alone basis.
The costs assume gas is delivered to the Chicago Hub, and then adds the cost of transporting thatgas to Michigan. Further, the scenarios rely on available supply from Chicago throughout theyear. Because Chicago is expected to be a competitive market75 the total delivered price to

March, 1999 Gas-Fired Generation in Michigan: Page: 34Assessment of Gas Infrastructure and Generation Costs
Pipeline is built. If Vector Pipeline is also built, the price decrease would instead be about $0.15/Mcf. Potentialnew Gulf Coast supply could bump this decrease up to $0.30/Mcf. Under the scenarios in this report, extra supplyand capacity is assumed to be absorbed by market growth by 2005. “Study: New Supply to Deflate Prices inMidwest, Northeast But Not West.” Inside FERC Gas Market Report. 15 May 1998. Page 7.
76 Where the transportation rate cannot be increased due to FERC regulation, the rate for the supply can beincreased to compensate.
77 Under the scenarios in this report, extra supply and capacity is assumed to be absorbed by marketgrowth by 2005. Transportation to Chicago is therefore assumed to be only slightly less in 2005 than 2010.
78 Based on FERC filings of Vector, TriState, and Independence.
79 The Chicago to Detroit basis is the Detroit market price minus the Chicago market price.
Michigan is likely to be less under this approach.
If gas is not purchased at Chicago, but purchased from the various supply basins then transportedto Michigan, the result could be based on all of the same assumptions and costs except fortransportation, which would be slightly higher. Therefore, if Chicago is not used as a marketcenter, the only change to the scenarios would be slightly higher busbar electricity costs. The scenarios do not attempt to predict the extent that prices for existing transportation capacitymay or may not be discounted in the future. Capacity will likely be discounted during periods ofreduced demand, just as it will likely be priced above projected prices during high demand.76 The scenarios assume that, on the average, no discounting will occur for incremental gastransportation capacity into Michigan.
The scenarios assume that, due to competition, the delivered cost of gas to Michigan will becurrent maximum pipeline rates plus fuel at the projected wellhead price. This is not meant to bea precise estimate of transportation costs, but a compromise between the upward pressure onfuture rates that the additional costs of required new pipeline facilities will cause and thedownward pressure on rates caused by competition and efficiency gains in pipeline operations. The downward pressure will tend to be greater in the near term when new pipelines to Chicagoare not yet at full capacity.77 The projected rates also reflect an annual average, and do not reflectlikely day-to-day market fluctuations.
Transportation to Michigan
Based on current plans for new pipelines to transport gas supplies east from Chicago, there willbe plenty of new capacity available from Chicago at market prices.78
Assuming that the Vector Pipeline, TriState Pipeline, or both pipelines are built from Chicagothrough Michigan to Canada (near Port Huron), capacity will be available at a market pricerepresenting the Chicago to Detroit basis.79 According to ANR, incremental transportation from

March, 1999 Gas-Fired Generation in Michigan: Page: 35Assessment of Gas Infrastructure and Generation Costs
80 See Figure 18. Actual Chicago to Michigan basis for 1998 averaged $0.23/Dth based on weekly pricesreported in Gas Daily, with a weekly high of $0.11/Dth, and a weekly low of -0.23/Dth. “Weekly Average Prices.”Gas Daily. Every Monday. Page 3.
81 The prices in Figure 18 are reported in $ per million BTU’s. To convert to $ per Mcf, multiply by0.9843.
01/0
2/98
01/3
0/98
02/2
7/98
03/2
7/98
04/2
4/98
05/2
2/98
06/1
9/98
07/1
7/98
08/1
4/98
09/1
1/98
10/0
9/98
11/0
6/98
12/0
4/98
01/0
1/99
Week Starting
-0.3
-0.2
-0.1
0
0.1
0.2
0.3
Bas
is -
$/D
th
HHub to Mich
Chicago to Mich
Transport Basis to MichWeekly Weighted Average per Gas Daily
Figure 18 - Transportation basis to Michigan from Gas Daily average weekly index prices.
Chicago will cost $0.10-0.15/MMBtu. Vector and TriState estimate $0.18/MMBtu. Recenthistorical Chicago to Detroit basis is not indicative.80
The scenarios assume that a significant portion of gas will be delivered by one of these pipelinesfrom Chicago. If neither pipeline is built, then 142 MMcf/day of additional annual capacity willbe required in 2005, and 216 MMcf/day of annual capacity will be required in 2010 fromChicago to Michigan on other pipelines. Figure 14 in Chapter 4 details these requirements.
Current price differences average far below maximum FERC-approved pipeline rates. As shownin Figure 18, the current Henry Hub (Louisiana) to Midwest averages less than $0.15/MMBtu, while current maximum pipeline rates, including fuel at projected gas costs, average $0.45 to$0.50/MMBtu.81 This suggests that current pipeline transportation maximum rates are too high.
March, 1999 Gas-Fired Generation in Michigan: Page: 36Assessment of Gas Infrastructure and Generation Costs
82 See for example, FERC Notice of Proposed Rulemaking (NOPR) in docket number RM98-10-000which addresses currently price disparity between short and long term transportation markets. The NOPR alsoaddresses peak pricing, which will have an effect on storage prices. “Regulation of Short-Term Natural GasTransportation Services.” FERC. 29 July 1998. <http://cips.ferc.fed.us/Q/CIPS/RULES/RM/RM98-10.000.TXT>.
83 See FERC NOPR in FERC docket number RM98-10-000. In this proposed rule, FERC would removethe maximum rate cap for short term transportation. See also FERC Notice of Inquiry in FERC docket numberRM98-12-000,. In this Inquiry, FERC expects to examine its pricing policies for transportation. Both will likelyaffect the pricing of capacity segments from Chicago to Michigan. “Regulation of Interstate Natural GasTransportation Services.” FERC. 29 July 1998. <http://cips.ferc.fed.us/Q/CIPS/RULES/RM/RM98-12.000.TXT>
84 As proposed in RM98-10-000, FERC would allow a utility to release capacity on a short-term basis atany price. By using more storage during peak periods, the utility can then release unneeded transportation at higherrates than currently allowed. The could cause Michigan utilities to use more gas from their own storage duringlimited times where transportation is worth enough to make it sufficiently economical to risk the need to purchasereplacement gas before the winter is over.
85 Vector Pipeline projected that by 2000, there will be 5.9 Bcf/d more pipeline capacity to Chicago thanthe Midwest needs. “Vector Sees Excess Capacity; Suppliers Step Up Pace.” Natural Gas Intelligence. 27 July1998. Page 8.
This basis, or the difference between the price of gas delivered in Louisiana and that delivered inthe Midwest, is a proxy for current short-term transportation. The transportation needed for gas-fired generation, however, is long-term. The current basis is sufficiently below pipeline rates that major pipeline expansion will be discouraged until this basis converges with pipeline rates.82
The FERC recently proposed new rules that would change the way capacity is released byinterstate pipelines.83 One result may be that storage would compete with pipeline capacity thatis allowed to rise to a market price during high winter demand periods. This may result inincreased demand and higher prices for Michigan storage. While this could result in slightlyhigher storage costs for gas used for electric generation, it could also reduce peak-periodtransportation costs and increase supply reliability by freeing up transportation capacity when itis needed most.84
Transportation to Chicago
Because the delivered cost of gas to Michigan is projected to average slightly less when purchased from Chicago, the projected transportation cost to Chicago is estimated by subtractingprojected transportation cost from Chicago to Michigan from total transportation costs. Theprojected cost to Chicago is $0.20/MMBtu in 2005, and $0.25/MMBtu in 2010, which, whenadded to projected transportation from Chicago to Michigan is delivered to Michigan at a totaldelivered price about $0.05 cheaper than projected transportation direct to Michigan in 2005,and about the same in 2010.85
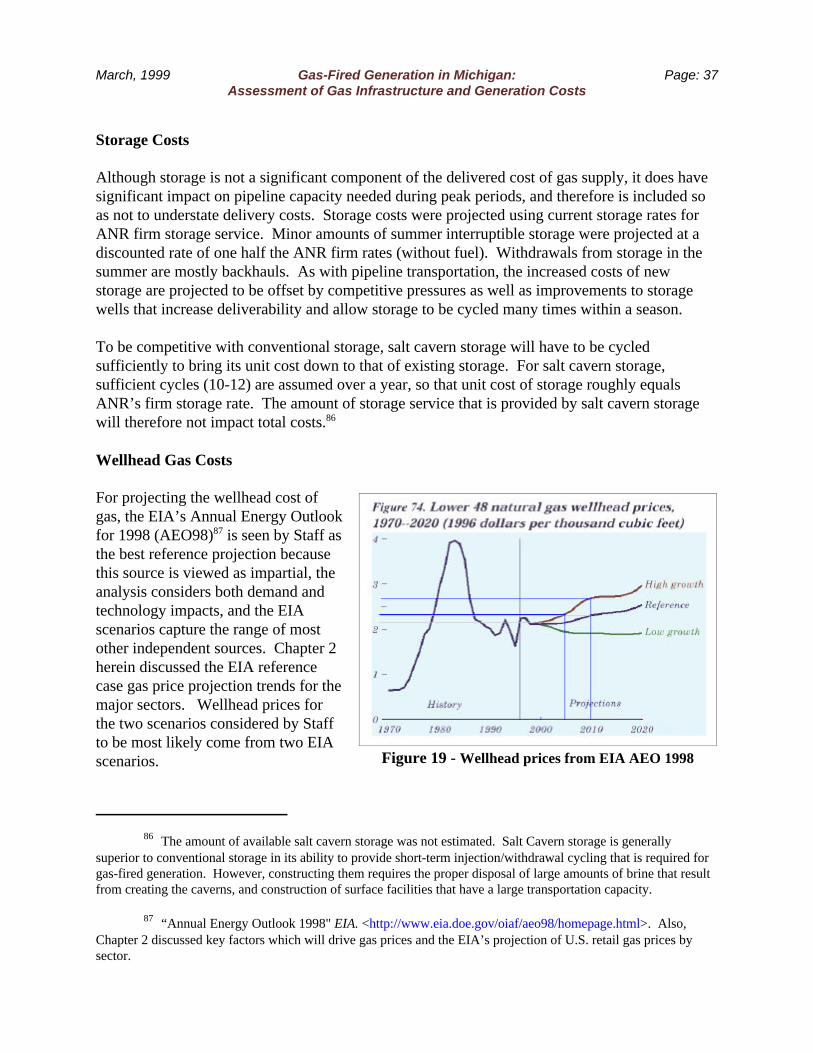
March, 1999 Gas-Fired Generation in Michigan: Page: 37Assessment of Gas Infrastructure and Generation Costs
86 The amount of available salt cavern storage was not estimated. Salt Cavern storage is generallysuperior to conventional storage in its ability to provide short-term injection/withdrawal cycling that is required forgas-fired generation. However, constructing them requires the proper disposal of large amounts of brine that resultfrom creating the caverns, and construction of surface facilities that have a large transportation capacity.
87 “Annual Energy Outlook 1998" EIA. <http://www.eia.doe.gov/oiaf/aeo98/homepage.html>. Also,Chapter 2 discussed key factors which will drive gas prices and the EIA’s projection of U.S. retail gas prices bysector.
Figure 19 - Wellhead prices from EIA AEO 1998
Storage Costs
Although storage is not a significant component of the delivered cost of gas supply, it does havesignificant impact on pipeline capacity needed during peak periods, and therefore is included soas not to understate delivery costs. Storage costs were projected using current storage rates forANR firm storage service. Minor amounts of summer interruptible storage were projected at adiscounted rate of one half the ANR firm rates (without fuel). Withdrawals from storage in thesummer are mostly backhauls. As with pipeline transportation, the increased costs of newstorage are projected to be offset by competitive pressures as well as improvements to storagewells that increase deliverability and allow storage to be cycled many times within a season.
To be competitive with conventional storage, salt cavern storage will have to be cycledsufficiently to bring its unit cost down to that of existing storage. For salt cavern storage,sufficient cycles (10-12) are assumed over a year, so that unit cost of storage roughly equalsANR’s firm storage rate. The amount of storage service that is provided by salt cavern storagewill therefore not impact total costs.86
Wellhead Gas Costs
For projecting the wellhead cost ofgas, the EIA’s Annual Energy Outlookfor 1998 (AEO98)87 is seen by Staff asthe best reference projection becausethis source is viewed as impartial, theanalysis considers both demand andtechnology impacts, and the EIAscenarios capture the range of mostother independent sources. Chapter 2herein discussed the EIA referencecase gas price projection trends for themajor sectors. Wellhead prices forthe two scenarios considered by Staffto be most likely come from two EIAscenarios.

March, 1999 Gas-Fired Generation in Michigan: Page: 38Assessment of Gas Infrastructure and Generation Costs
Figure 20 - Wellhead prices from EIA AEO 1998
Effect of Technology on Gas Supply - $/Mcf2005 2010
S low Fast S low Fast
Cha n g e (1998$) 0.07 -0.06 0.37 -0.26
Figure 21 - Effect of slow, fast technology on gas price projections
Source: Gas Div, MPSC
The first scenario is the EIA’sreference case for wellhead prices in2005 and 2010. Figure 19 showsFigure 74 from EIA’s AEO98 with2005 and 2010 highlighted. Thesecond scenario is the EIA’s highgrowth projection for 2005 and 2010. The prices were converted to 1998dollars. The high growth case makessense if the same assumptions usedfor load growth in the analysis arealso applied to other states. The gasrequired for all incrementalgeneration is therefore closer to thehigh growth projection than thereference case.
The EIA projections for high/low technology were also studied, and did not require separatescenarios because their effect was only significant in 2010. Figure 20 shows the effect usingFigure 85 from EIA’s AEO98 with 2005 and 2010 highlighted. Figure 21 shows the effect ofhigh/low technology on the cost of gas supply. The effect of slow technology increases the totalgas suppy costs in 2010 by $0.37/Mcf.
March, 1999 Gas-Fired Generation in Michigan: Page: 39Assessment of Gas Infrastructure and Generation Costs
Chapter 6. Reliability Issues
In the past year, reliability of service of electricity has moved to the top tier of issues related torestructuring the electricity industry. Insuring adequate generating capacity and efficientmechanisms to allocate generation and transmissions at times of peak electricity demand is beingaddressed by the Federal Energy Regulatory Commission and the National Electric ReliabilityCouncil. States addressing restructuring have these concerns along with maintaining reliabledistribution utilities and reliable service for customers in any deregulated environment.
Greatly expanded use of gas for generating electricity also has reliability risks. These are pricerisk and deliverability risk. Each of these depend greatly on how the market for gas-basedelectricity generation converges with the market for natural gas space heating in Michigan. Asexplained below, the partial non-coincidence of electric load verses gas, along with adequate gasstorage, help to mitigate this risk.
Price Risks
Under a system where gas availability will be determined by market conditions, price risks willbe a major factor of reliable gas supply. Price risks are judged by Commission Staff to notsignificantly affect the economics of gas-fired generation through the 1999-2010 study period.
One price risk is that significant increases in market demand will drive the market price for gashigher, especially during periods of high gas demand. In the past, peak period demand was onlyduring the winter heating season. With the addition of gas-fired generation, peak demand for gaswill also occur during summer electric peaks as well as during peak periods of storage injections,since the need for gas for electric generation concentrates seasonal storage injections into ashorter period in the spring and fall. This will very likely create several additional periods ofhigh demand for gas, which may create brief periods of higher demand-induced prices.
The risk of future technology improvements in gas exploration and production adds to price risk. In this report, this is reflected in the use of EIA’s reference (reference price) and slow technology(high price) scenarios. Staff believes the risk of higher prices than the EIA reference pricescenario is much more likely than the risk of lower prices, leading to the omission of the EIA lowprice scenario for the summary results in this report.
The amount of gas storage and the ability to cycle storage reduces the price risk. Michigan’sabundant gas storage, particularly that which can be cycled several times within a season, allowspurchases to be reduced when prices are high. This should serve to reduce prices for electricgeneration in Michigan by moving the price risk for a portion of the gas supply to other timeperiods.
Gas supply and transportation contacts whose terms and pricing provisions mirror electric salescontracts tend to mitigate price risk. There are also various financial instruments available to

March, 1999 Gas-Fired Generation in Michigan: Page: 40Assessment of Gas Infrastructure and Generation Costs
88 Gas futures contracts at the New York Mercantile Exchange are guaranteed, for example, so if deliveryfails the exchange partners will cover costs.
89 Such synergies will likely require electric and gas utilities to more closely coordinate their emergencyprocedures and service priorities.
hedge prices, allowing prices to be fixed in advance, or indexed to other things such as electricityprices. Relying on financial instruments to reduce price risk generally adds to the cost of gassupply, and introduces the risk of failure of the financial instrument.88
Deliverability Risks
To ensure reliability, new storage services will have to be and are projected to be available thatcan inject and withdraw the same week. This will allow gas to be imported to Michigan onweekends and off peak to meet peak generation demands during 16-hour weekday periods. Thisreport assumes that sufficient storage will be available to facilitate deliveries, at reasonableprices.
Faster cycling of gas storage for electric generation has both costs and benefits. It ties up storagecapacity. This will give gas utilities less ability to purchase additional amounts of gas in thelowest priced months in the summer to inject it into storage. However, increased cycling ofstorage can make the transportation system to Michigan more efficient and therefore lower cost. Depending on the timing and magnitude of gas supply price variations, it is possible thatefficiency induced cost reductions will offset the loss of flexibility.
It is possible that existing gas customers will be better off even with this loss of flexibility fromgas-fired electric generation. The efficiency of additional cycling allows the transportation andstorage systems to be relatively smaller to meet varying gas demand. This combined with thefact that peak use of gas for space heating is in the winter and peak use of gas for electricgeneration will likely be in the summer means the gas system will operate closer to its designlimits during additional peak periods. This benefit of this increased efficiency, which lowersdelivery costs, may also increase the risk that deliveries cannot be made since the system willoperate closer to capacity in more hours in the year.89
There is also the risk of pipeline breaks, which is minimized where interconnections are at multi-pipeline locations, such as where interstate pipelines have multiple lines. Only one of the 11locations used in the scenarios has a single pipeline connection.
Finally, Michigan appears to be well-suited as a location for gas-fired electric generation giventhe assumed additional transportation pipelines. The high gas peaks of the natural gas spaceheating market along with Michigan’s abundant storage give Michigan a location advantage overmany other states. Electricity demand is summer peaking, and so the electric supply industrymay be more tolerant of price and deliverability risk during peak winter demands. To the extent

March, 1999 Gas-Fired Generation in Michigan: Page: 41Assessment of Gas Infrastructure and Generation Costs
that there is coal, nuclear, or other non-gas generation capacity available during periods of peakwinter gas loads, gas-fired generation might find winter interruptions of gas supply acceptableand even desirable given an appropriate price break, thereby increasing the reliability of gasservice to other Michigan customers. During periods of peak summer electric demands, theopposite might occur, with gas utilities occasionally interrupting their injections into storage tomeet gas-fired generation requirements during Michigan’s summer electricity peaks.
March, 1999 Gas-Fired Generation in Michigan: Page: 42Assessment of Gas Infrastructure and Generation Costs
90 This report analyzes only large-scale, central station gas-fired generation. Emerging technologies forsmall-scale gas-fired generators may also make an impact on Michigan gas markets during the time frame of thisanalysis (by 2010) but were not evaluated for this report. Such technologies, including fuel cells and micro-turbines, may come in sizes all the way down to a few kilowatts, suitable for residential use. They may also be usedin the automotive industry. These applications could replace existing gas space and water heating appliances withcogeneration systems that also produce electricity. The resulting synergy may result in less of a required increase innatural gas supply than stand-alone, large, central station units.
Appendix A Scenario for Needs in Michigan Through 2010
Projected Electric Needs in Michigan in 2005, 2010
The scenarios for Michigan’s future natural gas consumption for electric generation use isbased on projected Michigan electric demand and generation. For non-electric generation use ofgas, the Michigan projection is based on projected growth in U.S. natural gas consumption. Tables A-1 through A-5 document this projection. Key assumptions are:
• Non-electric-generation use of gas will grow at the rate projected for the U.S. by theEnergy Information Administration in the “Annual Energy Outlook 1998.”
• All of the increased electrical generation needs in Michigan are met with natural gas-fired generation.90 This assumption, however, does not include any current electricgeneration plants which will be retired, including the Palisades nuclear plant in 2007. To the extent that current Nuclear plants are retired and replaced with gas-firedgeneration, an additional 140 to 160 Bcf per year of gas will be needed.
These scenarios provide the basis for electric generation growth used in the this report. However, the gas use figures on A-4 and A-5 are based on slightly different assumptions thanwere used for the final analysis. On A-5 for instance, the gas use is based on an initialsimplifying assumption of baseload capacity using a heat rate of 7,000 Btu/kwh.

Appendix A page 1 of 5
Table A1
Michigan Annual Electricity SalesComposite Forecast
----------------------- Annual Sales (GWh) -----------------------
Consumers Detroit Balance of Lower Upper State-wide
Year Energy Edison Penninsula Penninsula Total Sales
1990 28,668 39,674 9,145 4,183 81,6701991 29,593 40,135 9,258 4,838 83,8251992 29,428 39,377 9,983 5,052 83,8401993 30,729 41,716 10,263 4,880 87,5891994 31,932 43,211 10,735 5,281 91,1601995 33,266 44,926 11,119 5,390 94,7011996 34,015 45,328 11,383 5,514 96,2401997 34,247 45,582 11,773 5,752 97,354
---------------------- Forecast ----------------------1998 35,453 46,850 12,033 5,874 100,2101999 36,270 47,698 12,285 5,996 102,2492000 37,111 48,491 12,546 6,124 104,2722001 37,983 49,143 12,782 6,239 106,1472002 38,819 49,929 13,020 6,355 108,1232003 39,673 50,728 13,262 6,474 110,1372004 40,545 51,540 13,510 6,594 112,1892005 41,437 52,364 13,761 6,717 114,2802006 42,349 53,202 14,018 6,842 116,4122007 43,281 54,054 14,280 6,970 118,5842008 44,233 54,918 14,546 7,100 120,7982009 45,206 55,797 14,818 7,233 123,0542010 46,201 56,690 15,095 7,368 125,353
Staff 2006 40,727Staff 2007 54,094
Compound Annual Growth Rate:
1991 - 1996 2.8% 2.5% 4.2% 2.6% 2.8%1996 - 2001 2.2% 1.6% 2.3% 2.5% 2.0%1996 - 2010 2.2% 1.6% 2.0% 2.1% 1.9%
Prepared by: Statistical Analysis Section, Executive Secretary Division, Michigan Public Service CommissionSource: 1990-2001 is from "Michigan State-Wide Electric Sales Forecast," Technical Services Division, MPSC, April 20, 1998. 2002-2010 applies 1996-2001 growth rates for Edison and Consumers. For other areas, the year 2001 ratio (area/(CE+DE)) is fixed through the 2002-2010 period. Staff 2006 and Staff 2007 are from unpublished Staff projections for CE (3/97) and DE (12/97).

Appendix A page 2 of 5
Table A2Michigan Annual Electricity Generation and Peak Demands
Composite Forecast
CE DE Balance of LPenn Total Lower Penninsula Upper Penninsula State Total
Year Generation Generation Generation Generation Peak Demand Generation Peak Demand Generation Peak Demand
1990 30,893 42,251 9,940 83,084 15,807 4,547 865 87,630 16,6721991 31,890 42,742 10,063 84,695 16,114 5,259 1,001 89,954 17,1141992 31,711 41,935 10,851 84,497 16,076 5,491 1,045 89,988 17,1211993 33,113 44,426 11,155 88,695 16,875 5,305 1,009 94,000 17,8841994 34,410 46,019 11,669 92,097 17,522 5,740 1,092 97,837 18,6141995 35,847 47,845 12,086 95,778 18,223 5,858 1,115 101,636 19,3371996 36,654 48,272 12,373 97,300 18,512 5,993 1,140 103,293 19,6521997 36,904 48,543 12,797 98,244 18,692 6,252 1,190 104,496 19,881
---------------------- Forecast ----------------------1998 38,204 49,894 13,079 101,177 19,250 6,385 1,215 107,561 20,4641999 39,084 50,797 13,353 103,234 19,641 6,517 1,240 109,751 20,8812000 39,990 51,641 13,637 105,268 20,028 6,657 1,266 111,925 21,2952001 40,930 52,335 13,893 107,159 20,388 6,782 1,290 113,940 21,6782002 41,830 53,173 14,152 109,155 20,768 6,908 1,314 116,063 22,0822003 42,751 54,024 14,416 111,190 21,155 7,036 1,339 118,226 22,4942004 43,691 54,888 14,684 113,263 21,549 7,168 1,364 120,431 22,9132005 44,652 55,766 14,958 115,377 21,951 7,301 1,389 122,678 23,3412006 45,635 56,658 15,237 117,530 22,361 7,437 1,415 124,968 23,7762007 46,639 57,565 15,521 119,725 22,779 7,576 1,441 127,301 24,2202008 47,665 58,486 15,811 121,962 23,204 7,718 1,468 129,679 24,6732009 48,713 59,422 16,106 124,242 23,638 7,862 1,496 132,103 25,1342010 49,785 60,373 16,407 126,565 24,080 8,009 1,524 134,574 25,604
Loss Factor 7.2% 6.1% 8.0% 8.0%Load Factor 60.0 60.0 60.0
Compound Annual Growth Rate:1991 - 1996 2.8% 2.5% 4.2% 2.6% 2.6% 2.6%1996 - 2001 2.2% 1.6% 2.3% 2.5% 2.5% 2.5%1996 - 2010 2.2% 1.6% 2.0% 2.1% 2.1% 1.9%
Prepared by: Statistical Analysis Section, Executive Secretary Division, Michigan Public Service CommissionSource: Generation is derived from Sales on Table A1, using the shown loss factors. Peak demands are derived from sales using the shown annual load factor of 60 percent. Loss factors for CE and DE are fixed at the reported annual losses from the CE and DE 1997 FERC Form 1 Reports. Losses for other areas simply assume 8 percent (higher than CE). The assumed 60 percent annual load factor is based on the average of CE and DE annual load factors.

Appendix A page 3 of 5
Table A3Michigan Annual Electricity Generation
Composite Forecast
--------------------------------------------Total Lower Penninsula----------------------------------- -----------------------------------------Upper Penninsula-------------------------------------
Year Generation Comm. Chg. Peak Demand Comm. Chg. add 15% RM Generation Comm. Chg. Peak Demand Comm. Chg. add 15% RM
1990 83,084 15,807 4,547 8651991 84,695 16,114 5,259 1,0011992 84,497 16,076 5,491 1,0451993 88,695 16,875 5,305 1,0091994 92,097 17,522 5,740 1,0921995 95,778 18,223 5,858 1,1151996 97,300 18,512 5,993 1,1401997 98,244 18,692 6,252 1,190
-------------------------------------------------------------------------- Forecast ------------------------------------------------------------------------1998 101,177 2,933 19,250 558 642 6,385 133 1,215 25 291999 103,234 4,990 19,641 949 1,092 6,517 265 1,240 50 582000 105,268 7,024 20,028 1,336 1,537 6,657 404 1,266 77 882001 107,159 8,915 20,388 1,696 1,951 6,782 529 1,290 101 1162002 109,155 10,911 20,768 2,076 2,387 6,908 656 1,314 125 1432003 111,190 12,946 21,155 2,463 2,833 7,036 784 1,339 149 1722004 113,263 15,020 21,549 2,858 3,286 7,168 915 1,364 174 2002005 115,377 17,133 21,951 3,260 3,749 7,301 1,049 1,389 200 2302006 117,530 19,286 22,361 3,669 4,220 7,437 1,185 1,415 225 2592007 119,725 21,481 22,779 4,087 4,700 7,576 1,324 1,441 252 2902008 121,962 23,718 23,204 4,513 5,189 7,718 1,465 1,468 279 3212009 124,242 25,998 23,638 4,946 5,688 7,862 1,609 1,496 306 3522010 126,565 28,321 24,080 5,388 6,197 8,009 1,756 1,524 334 384
Load Factor 60.0 60.021,942
Compound Annual Growth Rate:1991 - 1996 2.8% 2.8% 2.6% 2.6%1996 - 2001 1.9% 1.9% 2.5% 2.5%1996 - 2010 1.9% 1.9% 2.1% 2.1%
Prepared by: Statistical Analysis Section, Executive Secretary Division, Michigan Public Service Commission
Source: Table A2 provides the Generation and Peak Demand data. Comm. Chg. is cummulative change; add 15% RM simply adds a 15 percent Reserve Margin
to the peak demands.

Appendix A page 4 of 5
Table A4Michigan Natural Gas Use for Electric Generation
Scenario for Potential Use (Bcf)
Michigan Total Annual Cummulative Potential added Current Use Total
Year Generation Change change Natural Gas Use (1997 Year) Use
1990 87,6301991 89,954 2,3231992 89,988 351993 94,000 4,0111994 97,837 3,8381995 101,636 3,7991996 103,293 1,6571997 104,496 1,203 128.0 128.0
---------------------- Forecast ----------------------1998 107,561 3,065 assume 1281999 109,751 2,190 2,190 15.1 128.0 143.12000 111,925 2,174 4,364 30.0 128.0 158.02001 113,940 2,016 6,379 43.9 128.0 171.92002 116,063 2,123 8,502 58.5 128.0 186.52003 118,226 2,163 10,665 73.3 128.0 201.32004 120,431 2,205 12,870 88.5 128.0 216.52005 122,678 2,247 15,116 103.9 128.0 231.92006 124,968 2,290 17,406 119.7 128.0 247.72007 127,301 2,334 19,740 135.7 128.0 263.72008 129,679 2,378 22,118 152.1 128.0 280.12009 132,103 2,424 24,542 168.8 128.0 296.82010 134,574 2,470 27,012 185.7 128.0 313.7
Note: The Midland Cogeneration Ventureconsumed 95 Bcf in 1997, and generated Gwh of electricity.
Compound Annual
Growth Rate:
1997 - 2000 2.3% 7.3%1997 - 2005 2.0% 7.7%1997 - 2010 2.0% 7.1%
Prepared by: Statistical Analysis Section, Executive Secretary Division, Michigan Public Service Commission, July, 1998Source: The assumed conversion rate for natural gas to electricity is 7000 Btu per kilowatt hour. One kilowatthour has 3412 Btu. Therefore, the assumed conversion efficiency is 48.7 percent. The assumed BTu per thousand cubic feet of natural gas is 1.018 million, from State Energy Data Report1995, page 485.
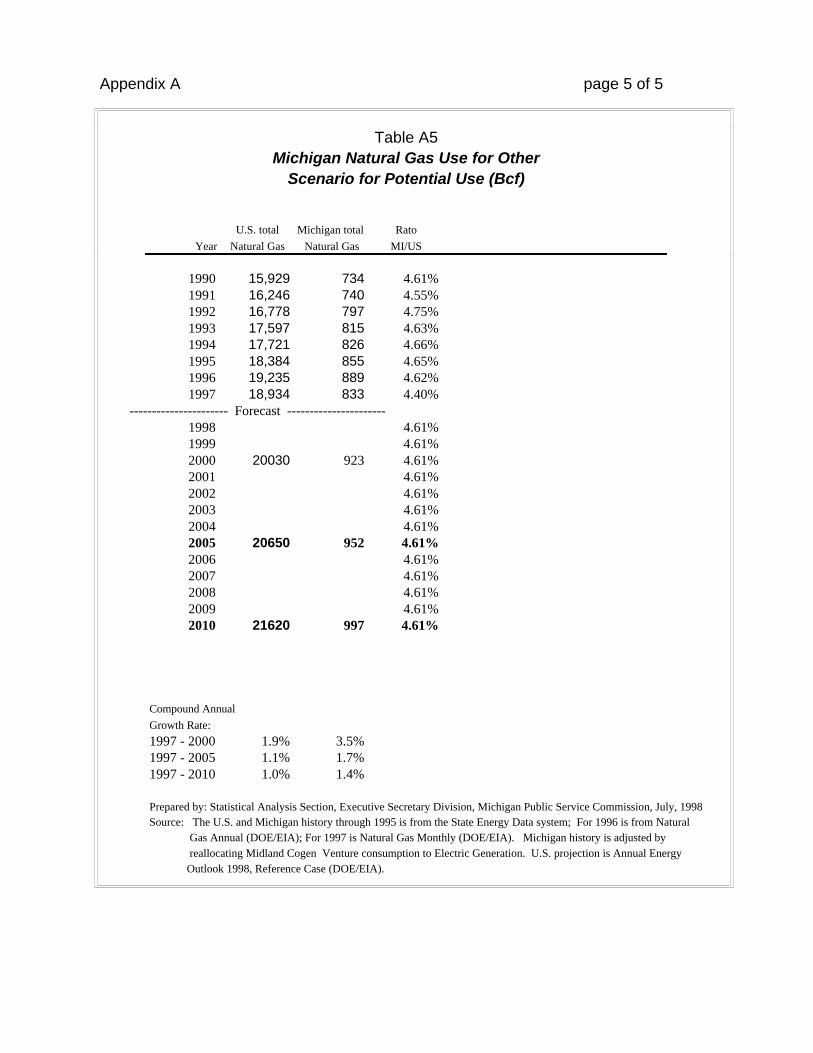
Appendix A page 5 of 5
Table A5Michigan Natural Gas Use for Other
Scenario for Potential Use (Bcf)
U.S. total Michigan total Rato
Year Natural Gas Natural Gas MI/US
1990 15,929 734 4.61%1991 16,246 740 4.55%1992 16,778 797 4.75%1993 17,597 815 4.63%1994 17,721 826 4.66%1995 18,384 855 4.65%1996 19,235 889 4.62%1997 18,934 833 4.40%
---------------------- Forecast ----------------------1998 4.61%1999 4.61%2000 20030 923 4.61%2001 4.61%2002 4.61%2003 4.61%2004 4.61%2005 20650 952 4.61%2006 4.61%2007 4.61%2008 4.61%2009 4.61%2010 21620 997 4.61%
Compound Annual
Growth Rate:
1997 - 2000 1.9% 3.5%1997 - 2005 1.1% 1.7%1997 - 2010 1.0% 1.4%
Prepared by: Statistical Analysis Section, Executive Secretary Division, Michigan Public Service Commission, July, 1998Source: The U.S. and Michigan history through 1995 is from the State Energy Data system; For 1996 is from Natural Gas Annual (DOE/EIA); For 1997 is Natural Gas Monthly (DOE/EIA). Michigan history is adjusted by reallocating Midland Cogen Venture consumption to Electric Generation. U.S. projection is Annual Energy Outlook 1998, Reference Case (DOE/EIA).