garnett picot* and feng hou - iariw the determinants of labour market outcomes among the children of...
TRANSCRIPT

1
The Determinants of Labour Market Outcomes
Among the Children of Immigrants in Canada and the U.S.
Garnett Picot* and Feng Hou
Ottawa, Canada
* 1-613-951-8214
DRAFT
DO NOT QUOTE OR CIRCULATE
August, 2009
2
Table of Contents
1. Introduction
1.1 Objectives
1.2 Contextual Differences between Canada and the US
2. Labour Market Outcomes Among the Children of Immigrants in Canada
2.1 Brief Review of Educational Outcomes
2.2 Employment, Unemployment and Occupational Outcomes
2.3 The Earnings Gap Between the 2nd
and third-and-higher Generations
2.4 The Intergenerational Transmission of Earnings among Immigrants
2.5 Summary
3. Labour Market Outcomes among the Children of Immigrants in the U.S.
3.1 Brief Review of Educational Outcomes
3.2 Participation Rate, Unemployment Rate and Occupational Outcomes
3.3 The Earnings Gap Between the 2nd
and third-and-higher Generations
3.4 The Intergenerational Transmission of Earnings among Immigrants
3.5 Summary
4. Summary of Determinants
5. Conclusion

3
Executive Summary
This paper reviews the recent research on labour market outcomes of the children of immigrants
in Canada and the United States (i.e., the 2nd
generation), and its determinants. The paper focuses
on outcome gaps between the 2nd
and third-and-higher generations, as well as the
intergenerational transmission of earnings between immigrants and their children (the 1st and 2
nd
generations).
Overall, in both Canada and the United States the children of immigrants (as adults) and those
with native born parents have similar labour force participation rates and unemployment rates
(no controls). The children of immigrants tend to have higher earnings. The 2nd
generation is also
more likely to be employed in professional occupations than the 3rd
plus generation, reflecting
their higher average levels of education (particularly in Canada).
However, in Canada in particular the earnings advantage of the 2nd
generation is overstated if the
much higher level of educational attainment is ignored. Conditional on educational attainment
and location of residence, the 2nd
generation has a negative wage gap relative to the third-and-
higher generation. The 2nd
generation racial minorities may have more difficulty converting
education to earnings than the third-and-higher generation Whites.
Ethnic group differences loom large in both countries. In the U.S, the Latino 2nd
generation
(Mexicans, Puerto Ricans, and Central/South Americans) have poorer labour market outcomes
than the third-and-higher generation Whites, in part due to their much lower levels of education,
which are in turn partly driven by the lower levels of educational attainment among their
immigrant parents. And the share of immigrants in this group has been rising. The negative wage
gap between Latino workers and the third-and-higher generation Whites is reduced considerably
from the 1st to 2
nd generations, but persists. In Canada, after adjusting for educational attainment,
urban size, and various job characteristics, the major visible minority groups have negative
earnings gaps with the third-and-higher generation Whites. This is particularly true for Blacks,
who have the largest wage gap.
Educational attainment may account for up to half of the earnings gap between the 2nd
and third-
and-higher generations. Other important determinants of the wage gap include location of
residence and community size, ethnic group/source region background, the “degree of
stickiness” in educational and earnings transmission between the 1st and 2
nd generation, and
“ethnic capital”.
Economic integration may be a multi-generational process. In both countries the wage gap of
racial minorities with the third-and-higher generation Whites falls from the 1st generation
(immigrants), to the 2nd
generation (their children), and even to the third-and-higher generation
in some cases.
The gap in earnings outcomes between the 2nd
and third-and-higher generations may be moving
in different directions in the two countries. In the U.S, the observed decline in this positive gap
may continue, driven largely by the shift in source regions of immigrants (and their educational
attainment). In Canada, educational outcomes of the 2nd
generation, already quite superior, are

4
likely to increase, driven by rapidly rising educational attainment of the immigrant parents since
the 1980s, and shift in source regions towards those demonstrating high educational outcomes
(even after controlling for education of parents). This in turn is likely to increase the (unadjusted)
positive earnings gap between the 2nd
and third-and-higher generations in the future.

5
1. Introduction
It is difficult to overstate the importance of the outcomes for the children of immigrants in major
immigrant receiving countries such as Canada and the United States. The second generation (i.e.
the children of immigrants) is a sizeable component of total population in both countries. The
success (or lack of it) of the second generation in the labour market reflects the long-term
process of immigrant integration.
The size of the second generation population depends, of course, on first generation immigration
levels. In absolute terms, the U.S receives more immigrants than any other nation, and in relative
terms, the annual immigration rate has been higher in Canada than any other country in recent
years.
In Canada, in 2006 one third of the population were immigrants or their children: one in five
people were immigrants, and an additional 15% were second generation Canadians. These
numbers are second only to those in Australia. And since immigration is highly geographically
concentrated, the effect on some cities is considerable. In Toronto, Canada’s largest city, three
quarters of the population are immigrants or their children. Their economic outcomes are
obviously of importance.
In the U.S, the proportions are somewhat lower because of lower immigration rates, but in
absolute terms they are more significant. In 2006 12% of the population were immigrants, a
number smaller only than that of Canada and Australia. An additional 11 % were second
generation Americans; almost one-quarter of the US population were immigrants or their
children.
Economic outcomes among first generation immigrants entering Canada and the US have been
deteriorating over much of the period since the early 1980s (Aydemir and Skuterud 2005; Borjas
2000; Chiswick, Lee, and Miller 2005; Picot and Sweetman 2005). Obviously immigrant
economic outcomes are important, but one could argue that it is the outcomes of their children
that really matters. Improved economic and educational opportunities for their children are often
a primary motive for immigration. And the long-term success or failure of a nation’s
immigration policy hinges to a considerable extent on the outcomes of the children.
1.1 Objectives
This paper reviews the labour market outcomes of the second generation in Canada and the US,
and their determinants. Employment, unemployment and earnings outcomes are included.
However, virtually all of the economic research on the determinants of the outcomes focuses on
earnings, so we turn to this outcome variable to discuss determinants. Since the second
generation’s labour market outcomes depend to a considerable extent on their educational
attainment, a brief review of the determinants of educational outcomes of immigrant’s children is
also included.
Labour market outcomes in Canada and the US are addressed separately, and from two
perspectives. First, how do second generation (the children of immigrants) outcomes compare to

6
those of the third-and-higher generation (i.e. the children of native-born parents), and what are
the determinants of the earnings outcome gap between these two generations. Much of the
available research in economics in particular addresses this question. It focuses on earnings
outcomes at a point in time, asking why some groups are doing better than others. The second
perspective is intergenerational. How are the children of immigrants doing compared to their
parents? This requires a longer perspective, often comparing the outcomes of the children
(typically as young adults) to those of their parents twenty five years earlier.
The paper employs results from both the sociological and economics literature to address these
topics. In the North American economics literature there is little research that addresses the issue
of the determinants of labour market outcomes directly without placing the work within the
context of explaining some outcome gap, usually between the 1st and 2
nd, or 2
nd and 3
rd
generations.
The determinants of the “gaps” in educational and labour market outcomes are, of course, very
important. Societies need to know why immigrant groups, and their children, are performing at
levels above or below that of the domestic-born population, or of their parents. The degree of
“integration” and “assimilation” of immigrant families is typically measured in this way.
1.2 Contextual Differences between Canada and the US
Although both Canada and the U.S are major immigrant receiving countries, in recent decades,
immigration patterns differed in many ways in the two countries, influencing outcomes for the
second generation. Prior to the 1960s, both countries used country of origin as a primary
determinant of immigrant selection, focusing on Western Europe. In the 1960s both countries
altered their immigration policies, leading to what many researchers refer to as the “new”
immigration (Green and Green 2004; Smith and Edmonston 1997). In Canada this meant many
more immigrants from Asia and Africa, while in the U.S it meant a shift more towards Mexico
and Central/South America. The immigration rates from these “new” source countries increased
particularly in the late 1970s and 1980s, and many children of these immigrants are just now
entering the labour market. It is still early days regarding the evaluation of the labour market
outcomes and their determinants for children of this “new” immigration. As a result, there is
more research on the determinants of educational outcomes of these children than of labour
market outcomes (see an accompanying paper by Picot and Hou, 2009, summarizing educational
outcomes).
Smith and Edmonston (1997), Green and Green (2004) provide overviews of immigration
history for the U.S and Canada respectively. The historical differences are discussed in Aydemir
and Sweetman (2008). They point out that there are four areas of difference in the “new”
immigration that are important for second generation outcomes.
First, immigration rates have been higher in Canada than the US since the 1940s (Figure 1), and
hence the 1st and 2
nd generation populations are (relative to population size) more significant in
Canada than the US. Second, the distribution of immigration by source regions evolved very
differently in the two countries. The US has always had a greater share of its immigration from

7
Central and South America, as well as Mexico. As we will see, this is significant, since the 2nd
generation outcomes for these groups are often inferior to those of other groups such as the
Asians, to which Canada turned for much of its “new” immigration”.
Source: Aydemir and Sweetman, 2006
Thirdly, the US has employed family reunification as the main immigration program, whereas
Canada also employs a “skilled immigrant class” which is selected on a points system. About
one-half of all immigrants to Canada now enter under this class. The result has been that in
general, immigrants to Canada are now more highly educated than those entering the US.
Finally, settlement policies may differ between the two countries and this could have a
significant impact on second generation outcomes. Canada adopted a “multiculturalism” policy
in the 1970s, which the U.S has not. This difference may result in a more welcoming
environment in Canada to immigrants (and their children) from diverse cultures, but in reality the
effect of this policy (if any) is difficult to judge. It may serve as a symbol, but its real impacts are
less clear.
There is a significant American sociological literature on 2nd
generation assimilation, focusing
not only on educational outcomes (but less often on labour market outcomes), but on crime,
family formation and other outcomes. Much of this work is driven by the “segmented
assimilation” theory. It states that a variety of factors may lead to successful assimilation, but
that they can also lead to poorer 2nd
generation outcomes and “downward” assimilation.

8
Determinants such as family socio-economic status, the immigrant family type (particularly
single parents), the social context within which immigrants are received, discrimination, and
deviant life-styles (drugs/gangs) can play a major role, particularly in “downward” assimilation.
The theory predicts very different outcomes for different ethnic groups in the US. This theory is
discussed in Portes and Fernandez-Kelly (2008), Zhou (1997), Zhou et al. (2008), among many
others, and is largely applicable to the US. It is rarely invoked to explain 2nd
generation outcomes
in Canada.
The economics literature turns to traditional determinants to explain gaps in labour market
outcomes between the 1st, 2
nd and third-and-higher generations. These include the educational
attainment of the children of immigrants, location of residence (educational and labour market
outcomes are superior in large cities), source region or ethnicity, ethnic capital (the effect of
characteristics of the ethnic group on outcomes beyond that of the family), parents expectations,
and “visible minority” (racial minority) status. Discrimination is rarely addressed directly in this
literature, but is at times invoked as one of the reasons for a negative earnings gap between racial
minorities and Whites.
The terms “visible minority” and “racial minority” are both used in this paper. In Canada, the
term “visible minority” is widely employed in official government documents and in the research
community. It refers to non-White and non-Aboriginal population groups collectively. It is rarely
used in other countries, where the term “racial minority” is more common. When referring to
Canadian research, the term “visible minority” will be used, and elsewhere, racial minority.
2. Labour Market Outcomes among the Children of Immigrants in Canada
2.1 A Brief Review of Educational Outcomes among the Children of Immigrants in Canada
Because educational attainment is such a strong predictor of earnings and other labour market
outcomes, we begin with a brief review of the educational levels achieved by the children of
immigrants in Canada (see Picot and Hou, 2009 for more detail).
Second generation Canadians have a significantly higher level of educational attainment than the
third-and-higher generation. In the 2006 Canadian census data, 36% of the children of
immigrants held degrees, compared to 24% of the third-and-higher generation. And children
with two immigrant parents register a larger positive education gap than those with only one
immigrant parent (Hum and Simpson, 2007; Aydemir and Sweetman, 2008). This higher level of
achievement is most noticeable among the visible minority 2nd
generation (Boyd, 2002; Aydemir
and Sweetman, 2008). There is significant variation among ethnic groups/nationalities, with
Chinese, Indian and African 2nd
generation registering the highest educational attainment
(Abada, Hou and Ram, 2008). However, very few 2nd
generation ethnic groups do not
outperform the third-and-higher generation.
Immigrants to Canada are more highly educated than the population as a whole, and this higher
parental education among the 2nd
generation Canadians (as compared to the third-and-higher
generation) accounts for perhaps one-half of the (positive) educational attainment gap between

9
the 2nd
and third-and-higher generation (Boyd, 2002; Aydemir and Sweetman, 2008). Location
of residence is important, as the 2nd
generation lives disproportionately in large urban areas
where educational attainment is higher. “Ethnic capital” plays a role, accounting for perhaps a
quarter of the gap (Abada et al, 2008). Parent’s expectations also play a role, often an important
one (Finnie and Muelleur, 2009). But much of the gap persists even after adjusting the data for
all of these effects, particularly among the higher achieving ethnic groups such as the 2nd
generation with Chinese and Indian immigrant parents, two of the larger immigrant groups in
Canada in recent decades.
The effect of parent’s education on the educational attainment of the children is weaker among
families with immigrant rather than Canadian born parents (Hum and Simpson, 2007). This fact
appears to be driven primarily by the observation that children from less educated immigrant
families are more likely to achieve a higher level of education than are their Canadian born
counterparts from families with similar levels of education (Bonikowska, 2008). The
intergenerational persistence in years of schooling between the 1st and 2
nd generation is rather
weak between immigrants and their Canadian born children, only about one-third as strong as
among families with Canadian born parents. And immigrant family income has little to do with
this intergenerational educational tie (Aydemir, Chen and Corak, 2008).
2.2 Employment, Unemployment and Occupational Outcomes
The authors found little literature on the employment, unemployment and occupational outcomes
of the children of immigrants1 that focused on determinants. In the absence of such work,
following are data for 25 to 54 year olds (prime age workers) for May, 2006, generated by the
authors from the 2006 Canadian census.
Employment rates are virtually identical among the children of immigrants and those of
Canadian born parents, both for men and for women (Table 1). There is some variation by
educational attainment. University educated 2nd
generation men and women are somewhat less
likely to be employed than their third-and-higher generation counterparts (85% vs. 90%), while
the less educated 2nd
generation are more likely to be employed. This same pattern is observed in
the U.S. Some of this difference could be related to the fact that the 2nd
generation achieve much
higher levels of schooling (particularly in Canada), and hence more 2nd
generation 25 to 30 year
olds may still be in school.
Overall, unemployment rates are, if anything, lower among the children of immigrants than their
counterparts with Canadian born parents (4.4% vs. 4.9%, Table 1). However, this pattern is not
evident for all groups. Again there is variation by educational level. Among the university
educated, unemployment rates are higher for the 2nd
than third-and-higher generation (3.5% vs.
2.8%), and among the less educated the rates are much lower (7.3% vs. 9.0%). And the
unemployment rate “advantage” is observed only among the 2nd
generation Whites. Among
visible minority groups (Blacks, Asians and others), unemployment rates are higher among the
1 The one paper that incorporated employment and unemployment outcomes used 2001 census data, and found
that employment rates in the census reference week were higher among the 2nd
generation than either the 1st or third-
and-higher, and unemployment rates roughly the same for the 2nd
and third-and-higher generations (Aydemir, Chen
and Corak, 2005).

10
2nd
than the third-and-higher generation. Perhaps more importantly, the unemployment rates
among the 2nd
generation Canadians of Asian descent are higher than those of the third-and-
higher generation Whites (5.4% vs. 4.9%), even though Asians have significantly higher
educational attainment. Unemployment rate data suggest visible minority 2nd
generation are not
doing as well as one might expect, given their educational backgrounds.
Second
generation
Third-and-
higher
generation
Second
generation
Third-and-
higher
generation
Second
generation
Third-and-
higher
generation
Employment rates
Total 82.8 82.9 87.0 86.9 78.7 79.0
Less than a high school diploma 69.9 66.9 76.4 74.7 60.3 56.8
High school graduates 81.5 82.4 86.4 87.1 75.6 76.9
Some post secondary education 85.1 87.2 89.4 90.7 81.7 84.6
University degree 85.3 89.9 89.0 92.9 82.1 87.4
Whites 84.1 82.9 88.4 87.0 79.9 79.0
Blacks 75.6 73.7 77.9 78.5 73.3 69.5
Asians 76.1 82.8 79.5 86.0 72.7 79.5
Other visible minorities 72.2 77.1 76.5 79.0 67.8 75.5
Unemployment rates
Total 4.4 4.9 4.2 5.0 4.7 4.8
Less than a high school diploma 7.3 9.0 6.8 8.9 8.2 9.3
High school graduates 4.9 5.3 4.7 5.4 5.2 5.3
Some post secondary education 4.1 3.9 3.7 3.8 4.4 4.0
University degree 3.5 2.8 3.1 2.5 3.9 3.1
Whites 4.1 4.9 3.8 5.0 4.3 4.7
Blacks 9.2 8.6 9.0 8.8 9.3 8.5
Asians 5.4 4.6 5.1 5.0 5.7 4.1
Other visible minorities 8.6 4.5 8.4 4.7 8.8 4.4
Source: Statistics Canada 2006 census
Education attainment
Visible minority status
Education attainment
Visible minority status
Table 1 Employment and umemployment rates of the second and the third-and-higher generation
Canadians aged 25 to 54, May 2006
Total Men Women
The occupations of the children of immigrants reflect their educational attainment. They are
much more likely than the third-and-higher generation to be in professional and related
occupations2, and much less likely to be in “blue collar” occupations such as trades,
transportation, manufacturing and primary industry jobs. This is particularly true for the second
generation of Asian descent, where educational attainment levels are the highest (Table 2).
2 This includes natural and applied sciences and related occupations, health occupations, occupations in social
science, education, government services, and occupations in art, culture, recreation and sport.

11
Total Men Women Total Men Women
Total 100 100 100 100 100 100
Management 12.9 15.5 10.2 10.8 12.8 8.6
Business, finance and administrative occupations 20.9 11.6 31.0 19.1 9.3 29.6
Professional and related occupations 29.7 25.7 34.1 25.4 19.6 31.7
Sales and service occupations 17.5 15.2 20.0 18.6 14.7 22.7
Trades, transport, and blue collar occupations 19.0 32.0 4.8 26.1 43.6 7.4
Whites 100 100 100 100 100 100
Management 13.5 16.2 10.6 10.8 12.8 8.6
Business, finance and administrative occupations 20.6 10.8 31.3 19.1 9.3 29.6
Professional and related occupations 28.8 24.3 33.8 25.4 19.6 31.7
Sales and service occupations 16.9 14.7 19.4 18.5 14.7 22.6
Trades, transport, and blue collar occupations 20.2 34.0 5.0 26.2 43.6 7.4
Blacks 100 100 100 100 100 100
Management 7.1 7.3 6.9 7.6 8.0 7.2
Business, finance and administrative occupations 26.3 19.2 33.5 19.7 10.1 29.4
Professional and related occupations 30.1 26.4 33.9 21.2 16.3 26.1
Sales and service occupations 20.8 20.7 20.9 27.4 24.2 30.5
Trades, transport, and blue collar occupations 15.8 26.5 4.8 24.1 41.4 6.7
Asians 100 100 100 100 100 100
Management 10.4 12.7 8.0 13.8 17.3 9.7
Business, finance and administrative occupations 21.6 16.3 27.3 21.6 13.5 31.0
Professional and related occupations 37.3 37.6 36.9 32.7 29.4 36.4
Sales and service occupations 21.1 17.5 24.9 16.6 14.8 18.7
Trades, transport, and blue collar occupations 9.6 16.0 3.0 15.3 25.0 4.3
Other visible minorities 100 100 100 100 100 100
Management 7.6 7.8 7.4 8.8 10.2 7.6
Business, finance and administrative occupations 21.5 15.1 29.0 19.1 10.8 26.8
Professional and related occupations 30.6 28.0 33.5 23.7 18.1 28.8
Sales and service occupations 20.4 17.5 23.8 24.8 19.0 30.2
Trades, transport, and blue collar occupations 19.9 31.7 6.3 23.6 41.9 6.7
Source: Statistics Canada 2006 census
Table 2 Occupational distribution of the employed second and third-and-higher generation
Canadians aged 25 to 54, May 2006
Second generation
Third-and-higher
generation
Overall, about 30% of the children of immigrants (when they are aged 25 to 54) were in
professional occupations, compared to 26% of the children with Canadian born parents. And this
difference held for each of the four ethnic groups examined in Table 2, including Blacks, where
30% of the 2nd
generation were in professional and related occupations, which is larger than the
share among third-and-higher generation Whites. Fully 37% of 2nd
generation Canadians of
Asian descents were in the professions.

12
Involvement in blue collar occupations was much less, as 19% were in such jobs, compared to
26% among the third-and-higher generation. Interestingly, a larger share of 2nd
generation
Whites held blue collar jobs (20%) than did Blacks or Asians (16% and 10%).
Overall, there is little difference between the 2nd
and third-and-higher generation in employment
and unemployment rates. However, these same data suggest that the university educated 2nd
generation were having marginally greater employment difficulties than their third-and-higher
generation counterparts in 2006 (a year of robust economic growth in Canada). These data also
show greater employment difficulties among the 2nd
generation visible minorities. The
occupational data reflect the 2nd
generation’s educational attainment, as they strive for higher
levels, and among those employed, are more likely to be in professional and less likely to be in
blue collar occupations than the third-and-higher generation.
No research was found that focused on the determinants of these outcomes. However, Hum and
Simpson (2007) do find that after controlling for variables such as age, region, community size,
union status, firm size and industry, annual hours worked are not significantly different between
the 2nd
and third-and-higher generations.3
2.3 The Earnings Gap between the 2nd
and third-and-higher Generations
The remarkable educational outcomes of the 2nd
generation in Canada, particularly among the
visible minority population, should set the groundwork for potentially successful earnings
outcomes. Unfortunately, the available research on the “new” 2nd
generation faces an issue of
timing. Using the adult population of age 25 to 64 (the usual approach) implies that the 2nd
generation observed in the data are the children of immigrants who arrived three to seven
decades prior to the recent census. These offspring reflect a very different country of origin
distribution than that observed since, say, 1980. The “new” visible minority immigration from
largely developing countries started to increase in the 1970s and 1980s, with the very high levels
observed in the 1980s and 1990s, to the present. Most of their children are not old enough to
have significant labour market outcomes. Hence, research cannot focus on the children of the
“new” immigrants of the 1980s and 1990s, those who are largely visible minorities and whose
parents faced the significant downturn in their economic outcomes. Nonetheless, recent papers
are beginning to provide a picture of outcomes. The 2001 Canadian census for the first time after
the 1971 census included a question on the birthplace of parents, allowing the 2nd
generation to
be accurately identified.
Recent research finds that, with no controls (or controlling only for age), the second generation
have earnings above those of the third-and-higher generation. For example, Aydemir and
Sweetman (2008), using 2001 census data for 20 to 64 year olds4, show average annual earnings
3. They find weak evidence that 2nd
generation women work marginally fewer hours than the third-and-higher
generation. They have a pooled sample of 2nd
and third-and-higher plus generation Canadians aged 25 to 70 from the
1999 Survey of Labour and Income Dynamics. This data source provides relatively small samples which precludes
an analysis by ethnic group or source region.
4. Including all persons age 20 to 64 in the labour force whether they have earnings or not. That is, they include the
unemployed with zero earnings by assigning 1 dollar in annual earnings.

13
among male 2nd
generation Canadians5 that are 13% above that of third-and-higher generation
Whites, and 22% higher among women. Aydemir, Chen, and Corak (2005) report similar results
across a wider range of indicators. Including individuals aged 16 to 65 and with positive
earnings, they find the 2nd
generation have mean annual earnings 9% above those of the third-
and-higher generation6 in the 2001 census. Hum and Simpson (2007), using the 1999 Survey of
Labour and Income Dynamics find similar results showing that the 2nd
generation have a 10%
advantage in both hourly wages and annual earnings (unadjusted).
But given the significant educational advantage that most of the 2nd
generation holds over the
third-and-higher generation these results should not be surprising.
Aydemir and Sweetman (2006) find that the annual earnings advantage of the 2nd
generation over
the third-and-higher generation is significantly reduced when years of schooling is controlled for,
and becomes a negative with the introduction of other variables (Table 3). For males whose both
parents were immigrants, their earning advantage falls from 18.9% to 8.7% after controlling for
years of schooling, and when marital status, ethnicity and urban/rural and city location are added,
it becomes negative, -5.5%. This last effect is related largely to the location variable: urban
dwellers have higher earnings, and the 2nd
generation is more likely to live in large cities.
Table 3 Percentage difference in annual earnings between the second and third-and-higher
generation, Canada 2000, population aged 25 to 65
No controls Add years of
schooling
Add marital status ethnicity,
urban/rural location
Males
2nd
generation, Mom immigrant 0.133 0.059 -0.045
2nd
generation, Dad immigrant 0.077 0.009† -0.082
2nd
generation, both immigrants 0.189 0.087 -0.055
Females
2nd
generation, Mom immigrant 0.095 0.021† -0.073
2nd
generation, Dad immigrant 0.110 0.039 -0.055
2nd
generation, both immigrants 0.299 0.186 0.016
† Not significant at p<0.05. Other numbers are significant at p<0.05.
Source: Aydemir and Sweetman (2008). The original data are from Statistics Canada 2001 census.
Note: the table is based on coefficients from ordinary least square regression with log annual earnings as the
dependent variable.
But these results assume that the returns to years of schooling are identical for immigrants, the
2nd
generation and the third-and-higher generation. In another model specification, they relax this
(and other) assumptions. They find lower returns to schooling for the 2nd
and the third-and-
higher generation (9.8% vs. 11.5% return for each additional year of schooling for males, 12.6%
vs 16.7% for females).
5. Where both parents were immigrants.
6. Including both Whites and visible minorities.

14
Hum and Simpson (2007) also conclude that the wage and earnings advantage of the 2nd
generation is overstated if education is ignored. They find that the observed wage advantage (in
relatively few cases) of the 2nd
over the 3rd
plus generation (with controls for a number of
variables such as community size, region, age, experience, industry, union status, firm size, but
not education) tends to disappear when the education variable is introduced.
Research done by this paper’s authors based on the 2006 census suggests a more subtle picture.
The larger sample in the census can support a more detailed analysis. We focus on 2nd
generation
men. Consistent with the above mentioned research, the second generation has weekly earnings
about 6% higher than the third-and-higher generation (controls for age only). But this positive
wage gap is driven entirely by second generation Whites, which has a 9% lead. Among visible
minority males, the gap is -5%, in spite of the fact that they have higher educational attainment
than the 2nd
and third-and-higher generation Whites. And there is huge variation among visible
minority groups, with the largest gap registered by Blacks (-21%), and a small positive gap
among the Chinese (Table 4).
Controlling for education increases the gap between 2nd
generation visible minority groups and
the third-and-higher generation Whites, given the visible minorities’ higher levels of education.
Controlling for location also results in a larger negative gap; second generation visible minorities
are more likely to live in urban centres, where wages are higher. Once working time and other
controls for language and marital status are added, the wage gap decreases to between -5% and -
14% among the visible minority groups, and about zero among second generation Whites.
The story for women is very similar, except that the initial gaps are positive everywhere because
of very high levels of education achieved by second generation females, particularly the visible
minorities. Location is a very important variable, accounting for much of the positive wage gap,
along with education.
This more recent work suggests that the unadjusted (except for age) second generation positive
wage gap is associated primarily with White men, and women. Among the visible minority
populations, it is due largely to their very high levels of education, and their location. After
accounting for these differences, negative wage gaps with the third-and-higher generation Whites
develop. Among male visible minority groups, negative wage gaps are evident even in the
unadjusted data, and the gaps increase after accounting for differences in education and location.

15
(1) (2) (3) (4) (5) (6)
Age, age2 (1) plus
education
(2) plus
location
(3) plus
language
marital status
(4) plus
part/full time
status
(5) plus
occupation,
industry
Men
2nd
generation (all) 0.056 0.006 -0.054 -0.030 -0.016 -0.011
2nd
generation white 0.085 0.043 -0.018 -0.004 0.001 0.005
2nd
generation visible minority -0.049 -0.130 -0.198 -0.122 -0.095 -0.086
Black -0.212 -0.241 -0.297 -0.254 -0.177 -0.135
Chinese 0.041 -0.079 -0.157 -0.095 -0.045 -0.049
South Asians 0.008 -0.092 -0.169 -0.126 -0.067 -0.086
Other V.M. -0.086 -0.142 -0.202 -0.157 -0.107 -0.087
Women
2nd
generation (all) 0.141 0.069 -0.016 -0.005 0.009 0.004
2nd
generation white 0.137 0.077 -0.003 0.007 0.017 0.017
2nd
generation visible minority 0.158 0.044 -0.071 -0.057 -0.027 -0.052
Black 0.061 -0.010 -0.130 -0.126 -0.079 -0.100
Chinese 0.247 0.088 -0.031 -0.007 0.011 -0.023
South Asians 0.190 0.047 -0.069 -0.049 -0.023 -0.057
Other V.M. 0.113 0.038 -0.068 -0.052 -0.024 -0.035
Source: Statistics Canada 2006 Census
Note: coefficients from Ordinary Least Square regression with log weekly wages as the dependent variable.
Table 4 Gap in weekly wages between the second generation and third-and-higher generation
Whites, 2005, Canada
Controlling for:
Coefficient x 100 = percent
We found no other paper that addressed the determinants of the 2nd
generation labour market
outcomes in Canada. However, there is a significant body of research asking if there is a wage
gap between visible minorities and Whites in Canada. Because of the timing of the immigration
of visible minority populations (entering largely since the 1980s), these papers are, in essence
comparing the 2nd
and third-and-higher generations. The visible minority population in Canada is
largely 2nd
generation, the White population largely third-and-higher generation. For a review of
this research, see Hou and Coulombe (2009). Results have been mixed; some papers find a wage
gap between visible minorities and Whites (Baker and Benjamin 1994; Pendakur and Pendakur
1998; Stelcner 2000), while others find no wage gap among men, or one restricted to the Black
population (Hum and Simpson 1999; Pendakur and Woodcock 2008). However, the largest
samples from the census data suggest that there is indeed a negative wage gap between visible
minorities and Whites, even in the raw data. This is consistent with the research reported above
on 2nd
and third-and-higher generation earnings gaps, and the important role played by visible
minority status.
16
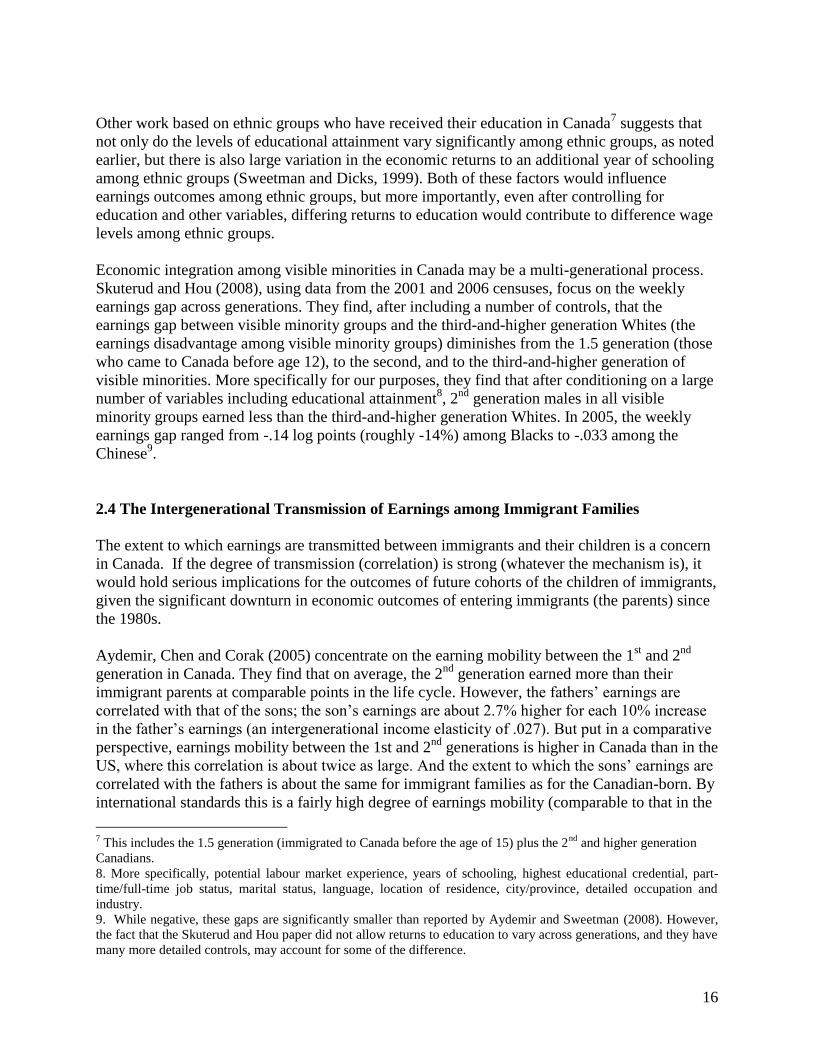
Other work based on ethnic groups who have received their education in Canada7 suggests that
not only do the levels of educational attainment vary significantly among ethnic groups, as noted
earlier, but there is also large variation in the economic returns to an additional year of schooling
among ethnic groups (Sweetman and Dicks, 1999). Both of these factors would influence
earnings outcomes among ethnic groups, but more importantly, even after controlling for
education and other variables, differing returns to education would contribute to difference wage
levels among ethnic groups.
Economic integration among visible minorities in Canada may be a multi-generational process.
Skuterud and Hou (2008), using data from the 2001 and 2006 censuses, focus on the weekly
earnings gap across generations. They find, after including a number of controls, that the
earnings gap between visible minority groups and the third-and-higher generation Whites (the
earnings disadvantage among visible minority groups) diminishes from the 1.5 generation (those
who came to Canada before age 12), to the second, and to the third-and-higher generation of
visible minorities. More specifically for our purposes, they find that after conditioning on a large
number of variables including educational attainment8, 2
nd generation males in all visible
minority groups earned less than the third-and-higher generation Whites. In 2005, the weekly
earnings gap ranged from -.14 log points (roughly -14%) among Blacks to -.033 among the
Chinese9.
2.4 The Intergenerational Transmission of Earnings among Immigrant Families
The extent to which earnings are transmitted between immigrants and their children is a concern
in Canada. If the degree of transmission (correlation) is strong (whatever the mechanism is), it
would hold serious implications for the outcomes of future cohorts of the children of immigrants,
given the significant downturn in economic outcomes of entering immigrants (the parents) since
the 1980s.
Aydemir, Chen and Corak (2005) concentrate on the earning mobility between the 1st and 2
nd
generation in Canada. They find that on average, the 2nd
generation earned more than their
immigrant parents at comparable points in the life cycle. However, the fathers’ earnings are
correlated with that of the sons; the son’s earnings are about 2.7% higher for each 10% increase
in the father’s earnings (an intergenerational income elasticity of .027). But put in a comparative
perspective, earnings mobility between the 1st and 2nd
generations is higher in Canada than in the
US, where this correlation is about twice as large. And the extent to which the sons’ earnings are
correlated with the fathers is about the same for immigrant families as for the Canadian-born. By
international standards this is a fairly high degree of earnings mobility (comparable to that in the
7 This includes the 1.5 generation (immigrated to Canada before the age of 15) plus the 2
nd and higher generation
Canadians.
8. More specifically, potential labour market experience, years of schooling, highest educational credential, part-
time/full-time job status, marital status, language, location of residence, city/province, detailed occupation and
industry.
9. While negative, these gaps are significantly smaller than reported by Aydemir and Sweetman (2008). However,
the fact that the Skuterud and Hou paper did not allow returns to education to vary across generations, and they have
many more detailed controls, may account for some of the difference.

17
Nordic countries, and well above that in the US or UK). The fathers’ earnings are less of a
predictor of the sons in Canada than in most countries, among both immigrant and Canadian
born families.
Educational attainment of the children is the most obvious mechanism for intergenerational
mobility. Aydemir et al. (2005) ask to what extent the higher educational attainment of the 2nd
generation drove the degree of intergenerational earnings mobility observed. They find that
education of the children is not the main pathway driving the intergenerational elasticities. They
find returns to education of the 2nd
generation are low, and the relationship between fathers’
income and sons’ educational attainment is fairly weak. This is consistent with earlier findings
reported above. In particular, the superior educational attainment outcomes of the 2nd
generation
were driven largely by the high educational attainment (relative to the Canadian born) obtained
by children of poorer immigrant families.
Turning to the issue of “ethnic capital” introduced by Borjas (1992), Aydemir et al. (2005) find
that the average level of paternal education in the immigrant community is important. They
hypothesize that more educated communities are able to steer their children through the barriers
they may face in broader society in a way that gives them an advantage.
They find that the intergenerational correlation (i.e. stickiness in wages) that does exist is largely
observed at the top of the earnings distribution; it is the son’s from higher income families who
become the high income earners in adulthood. However, much of this outcome is driven by the
high average parental educational attainment of the (wealthier) community. When this is
controlled for, the outcome is reversed; it is the children of the poorer immigrant families who
become the above average earners. Hence, average educational attainment of the community
(ethnic capital) is an important determinant of the intergenerational transmission of earnings.
2.5 Summary of the Canadian Labour Market Outcomes
One would expect labour market outcomes to reflect the significant educational advantage held
by the 2nd
over the third-and-higher generation in Canada, and to some extent they do. Overall,
unadjusted (raw) employment, unemployment and earnings data suggest that in the aggregate the
children of immigrants are doing as well as or better than the children of Canadian born parents.
Employment rates are similar, unemployment rates lower, and earnings higher among the
children of immigrants than the third-and-higher generation. However, these raw aggregate data
mask important differences between the generations.
Employment and unemployment data suggest that the university educated 2nd
generation were
having marginally greater difficulties than their third-and-higher generation counterparts in 2006
(a year of robust economic growth in Canada). These data also suggest greater employment
difficulties among the 2nd
generation visible minorities. The occupational data reflect the 2nd
generation’s educational attainment, as they strive for higher levels, and among those employed,
are more likely to be in professional and less likely to be in blue collar occupations than the
third-and-higher generation.

18
While among those employed average earnings of 2nd
generation Canadians surpass those of the
children of Canadian born parents (third-and-higher generation), educational attainment accounts
for more than half of the earnings advantage, and when location of residence is added, the
positive gap turns negative. Immigrants and their children tend to live in large urban centres
where wages are higher. The 2nd
generation’s very high level of educational attainment, and the
fact they live in large urban centres, allow them to achieve earnings levels (unadjusted) equal to
or above that of the third-and-higher generation.
However, this story does not apply to 2nd
generation male visible minorities in particular. They
earn less than the third-and-higher generation Whites in spite of the fact that they are more likely
to live in large centres, and have higher levels of educational attainment. After accounting for
these differences (and the fact that they are less likely to work in full-time jobs and controlling
for other demographic and work characteristics), their wage gap is in the -5% to -14% range.
After accounting for education, the visible minority 2nd
generation earns less than the third-and-
higher generation in part because their returns to education are lower. Considerable research on
the wage gap between Canadian born visible minorities (most of whom are second generation)
and Canadian born Whites (most of whom are third-and-higher generation) also suggests a
significant wage gap in spite of higher levels of education.
It may be that economic integration is a multi-generational process. The earnings gap for visible
minorities (relative to third-and-higher generation Whites) is reduced across generations; it is the
greatest among the 1st generation, decreases with the second, and falls even more among the
third. This may be related to a very long term acculturation process.
There is considerable intergenerational earnings mobility between the 1st and 2
nd generations.
Intergenerational earnings mobility is about the same among immigrant families as among
Canadian born families, and greater than among immigrants or the American born in the US.
Ethnic capital is an important determinant of this process in Canada. It not only accounts for part
of the educational outcomes of that generation, but is an important factor in the transmission of
earnings from the 1st to the 2
nd generation (above and beyond its effect on the education of the
2nd
generation).
3 Labour Market Outcomes among the Children of Immigrants in the US
3.1 A Brief Summary of Educational Outcomes
Since educational attainment is such an important variable regarding labour market outcomes,
following is a brief summary of 2nd
generation educational outcomes from a review paper by
Picot and Hou (2009).
American children with immigrant parents have (unadjusted) educational attainment levels
roughly equal to, or marginally higher than, the children of American born parents (Card,
Dinardo and Estes, 2000; Chiswick and Deburman, 2004). The difference may be more

19
significant among the 25 to 54 year olds, with 38% of second generation Americans holding
degrees, compared to 30% of the third-and-higher generation (Mosisa, 2006). It is clear that
after accounting for differences in parents educational attainment, location, family status and
other variables, the 2nd
generation is seen to outperform the third-and-higher generation
educationally (Card et al, 2000; OECD, 2006).
But as in Canada, there are significant ethnic group/nationality differences. In the US, Americans
whose parents were immigrants from Mexico or Central/South America have significantly fewer
years of schooling than the third-and-higher generation Whites, while those from Europe, Asia
and Africa register more. Much of this inter-ethnic group difference is related to differences in
the educational attainment of the parents.
The sociological literature finds that parents’ education and socio-economic status are important,
but even after accounting for these factors differences in educational outcomes among ethnic
groups persist, as they do in Canada (e.g. Rumbaut, 2005). Parental expectations regarding
educational attainment may play a major role, and so does family status: 2nd
generation children
from intact families are seen to have superior outcomes. The incidence of lone parenthood is
greater among some ethnic groups than others.
The degree of “stickiness” between the educational attainment of the immigrant parents, and that
of their children (the intergenerational transmission of education) is greater in the US than in
Canada (Card et al, 2000; Card, 2005). There may be dimensions of the Canadian education
system that result in higher levels of educational mobility between generations. Encouragingly,
as in the Canadian case, some research suggests that the major gains made by the 2nd
generation
are made by children whose parents have very low levels of education. And also as seen in
Canada, it is the fathers’ education, not income that is the primary determinant of educational
outcomes of the children.
Much of the concern regarding educational outcomes in the US focuses on the Mexican and
Hispanic immigrant communities. However, significant gains in relative educational attainment
are made by these groups across generation from the immigrant (1st generation) group, to their
children, and even to the third-and-higher generation (Smith, 2003). Blau and Kahn (2004) found
significant intergenerational gains in educational attainment between the 1st and 2
nd Mexican
generations, but not beyond. Fry and Lowell (2005) also conclude that assimilation progress
among Mexicans appears to stall after the 2nd
generation. Little evidence of “downward
assimilation” is observed in this research, at least regarding educational attainment outcomes
(Smith 2003). Nonetheless, given the low levels of educational attainment among Hispanic and
Mexican immigrants, educational gaps (with the third-and-higher generation Whites) may well
persist among the 2nd
generation in these ethnic groups, in spite of the gains that they are making.
3.2 Participation Rates, Unemployment Rates and Occupational Outcomes
As in Canada, little work was found focusing on the determinants of employment,
unemployment and occupational outcomes among the children of immigrants. However, Mosisa
20
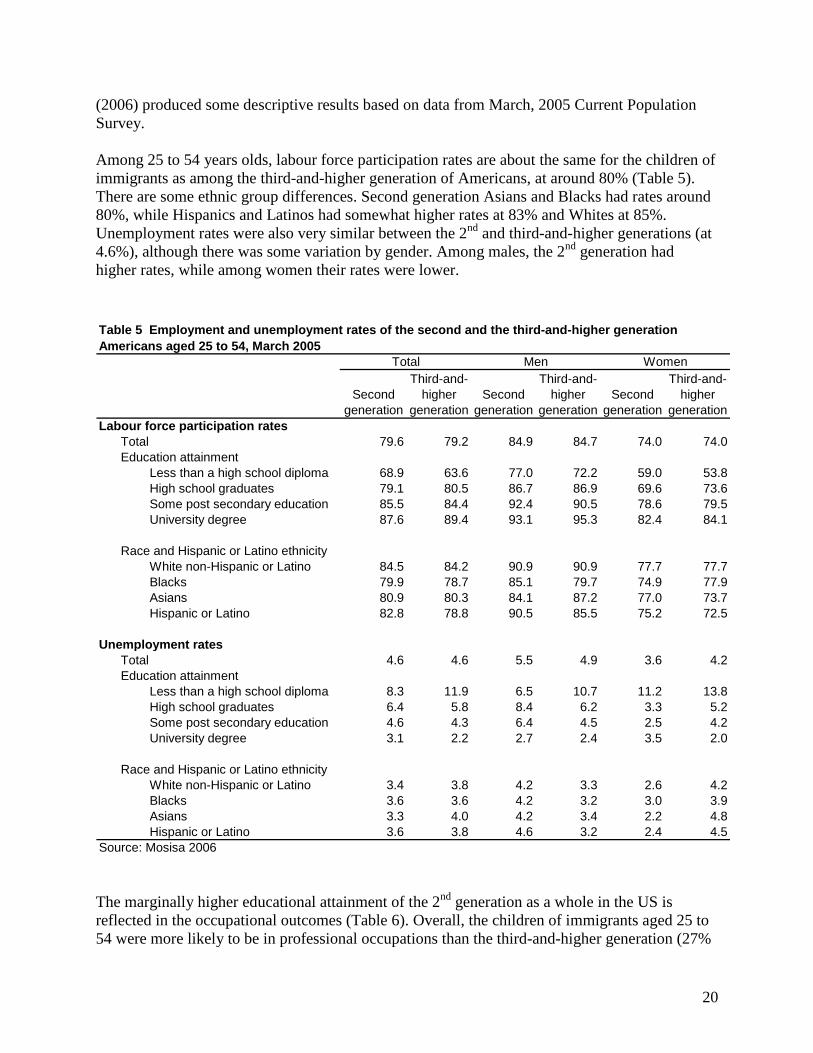
(2006) produced some descriptive results based on data from March, 2005 Current Population
Survey.
Among 25 to 54 years olds, labour force participation rates are about the same for the children of
immigrants as among the third-and-higher generation of Americans, at around 80% (Table 5).
There are some ethnic group differences. Second generation Asians and Blacks had rates around
80%, while Hispanics and Latinos had somewhat higher rates at 83% and Whites at 85%.
Unemployment rates were also very similar between the 2nd
and third-and-higher generations (at
4.6%), although there was some variation by gender. Among males, the 2nd
generation had
higher rates, while among women their rates were lower.
Second
generation
Third-and-
higher
generation
Second
generation
Third-and-
higher
generation
Second
generation
Third-and-
higher
generation
Labour force participation rates
Total 79.6 79.2 84.9 84.7 74.0 74.0
Less than a high school diploma 68.9 63.6 77.0 72.2 59.0 53.8
High school graduates 79.1 80.5 86.7 86.9 69.6 73.6
Some post secondary education 85.5 84.4 92.4 90.5 78.6 79.5
University degree 87.6 89.4 93.1 95.3 82.4 84.1
White non-Hispanic or Latino 84.5 84.2 90.9 90.9 77.7 77.7
Blacks 79.9 78.7 85.1 79.7 74.9 77.9
Asians 80.9 80.3 84.1 87.2 77.0 73.7
Hispanic or Latino 82.8 78.8 90.5 85.5 75.2 72.5
Unemployment rates
Total 4.6 4.6 5.5 4.9 3.6 4.2
Less than a high school diploma 8.3 11.9 6.5 10.7 11.2 13.8
High school graduates 6.4 5.8 8.4 6.2 3.3 5.2
Some post secondary education 4.6 4.3 6.4 4.5 2.5 4.2
University degree 3.1 2.2 2.7 2.4 3.5 2.0
White non-Hispanic or Latino 3.4 3.8 4.2 3.3 2.6 4.2
Blacks 3.6 3.6 4.2 3.2 3.0 3.9
Asians 3.3 4.0 4.2 3.4 2.2 4.8
Hispanic or Latino 3.6 3.8 4.6 3.2 2.4 4.5
Source: Mosisa 2006
Table 5 Employment and unemployment rates of the second and the third-and-higher generation
Americans aged 25 to 54, March 2005
Total Men Women
Education attainment
Race and Hispanic or Latino ethnicity
Education attainment
Race and Hispanic or Latino ethnicity
The marginally higher educational attainment of the 2nd
generation as a whole in the US is
reflected in the occupational outcomes (Table 6). Overall, the children of immigrants aged 25 to
54 were more likely to be in professional occupations than the third-and-higher generation (27%

21
compared to 23%). But there was considerable difference by ethnic group, again reflecting to
some extent educational attainment. Among the children of immigrants, Asians had the highest
proportion in professional occupations, at 36%, followed by Whites and Blacks, around 30%
were in professional occupations in 2005. The children of Black immigrant families were much
more likely to be in the professions than their third-and-higher generation counterparts (at 17%),
likely because their educational attainment was much higher. Thirty-seven percent of second
generation Blacks held degrees, compared to only 18% of third-and-higher generation.
Total Men Women Total Men Women
Total 100 100 100 100 100 100
Management, business, and financial operations 17.6 16.7 18.8 16.3 17.2 15.4
Professional and related occupations 27.1 22.4 32.8 22.8 17.7 28.3
Sales and service occupations 37.0 30.8 44.4 37.8 27.0 49.4
Blue Collar:construction/transport/production,etc. 18.2 30.1 4.0 23.1 38.2 6.9
White non-Hispanic or Latino 100 100 100 100 100 100
Management, business, and financial operations 20.8 21.2 20.2 17.5 18.7 16.2
Professional and related occupations 30.0 23.7 37.7 24.0 18.7 29.9
Sales and service occupations 32.3 26.9 38.8 36.0 25.6 47.8
Blue Collar:construction/transport/production,etc. 16.8 28.2 3.3 22.5 37.0 6.3
Blacks 100 100 100 100 100 100
Management, business, and financial operations 12.1 8.2 15.9 10.6 8.5 12.3
Professional and related occupations 30.3 30.0 30.6 17.4 11.6 22.1
Sales and service occupations 44.8 36.3 53.3 45.9 34.7 54.9
Blue Collar:construction/transport/production,etc. 12.8 25.6 0.3 26.1 45.3 10.7
Asians 100 100 100 100 100 100
Management, business, and financial operations 19.0 14.3 25.3 19.2 19.9 18.4
Professional and related occupations 36.7 37.9 35.1 31.1 26.6 35.8
Sales and service occupations 32.9 30.5 36.2 39.7 38.1 41.4
Blue collar:construction/transport/production,etc. 11.4 17.3 3.4 10.0 15.4 4.3
Hispanic or Latino ethnicity 100 100 100 100 100 100
Management, business, and financial operations 12.3 10.5 14.4 12.7 12.5 12.9
Professional and related occupations 19.2 13.7 25.7 16.5 12.7 20.8
Sales and service occupations 45.2 37.6 54.2 45.6 33.4 59.3
Blue Collar:construction/transport/production,etc. 23.3 38.2 5.7 25.2 41.5 7.0
Source: Mosisa 2006
Table 6 Occupational distribution of the employed second and third-and-higher generation
Americans aged 25 to 54, March 2005
Second generation
Third-and-higher
generation
22
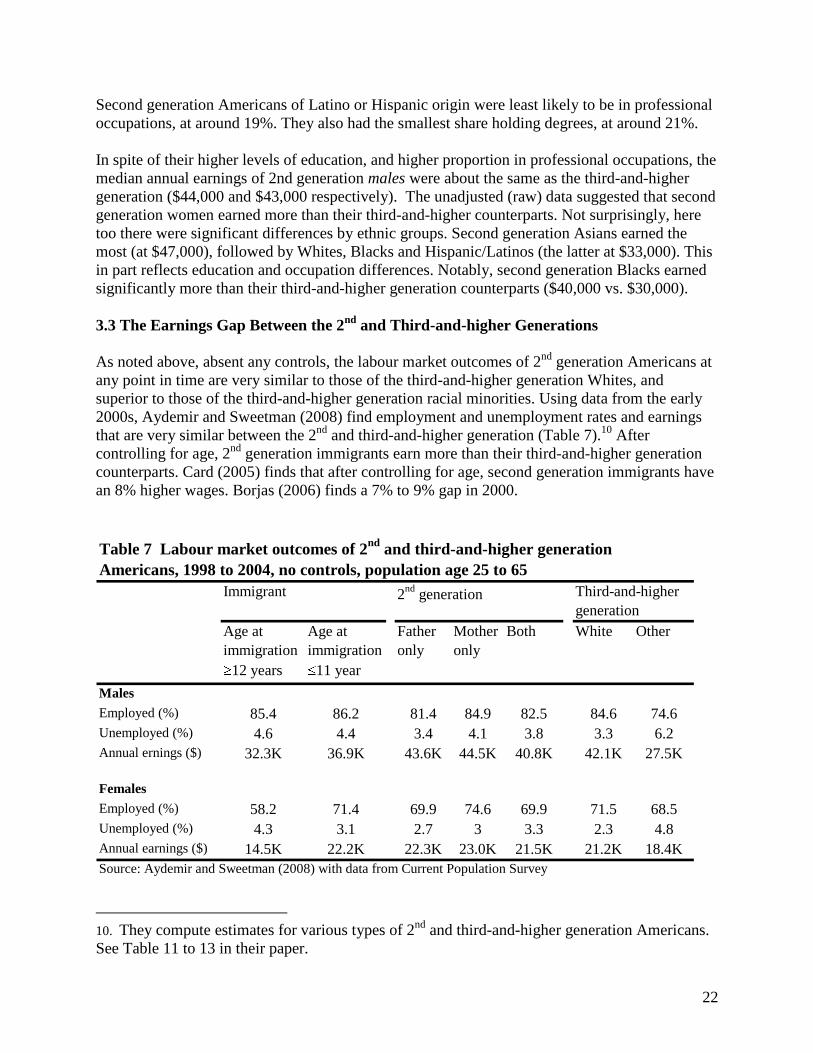
Second generation Americans of Latino or Hispanic origin were least likely to be in professional
occupations, at around 19%. They also had the smallest share holding degrees, at around 21%.
In spite of their higher levels of education, and higher proportion in professional occupations, the
median annual earnings of 2nd generation males were about the same as the third-and-higher
generation ($44,000 and $43,000 respectively). The unadjusted (raw) data suggested that second
generation women earned more than their third-and-higher counterparts. Not surprisingly, here
too there were significant differences by ethnic groups. Second generation Asians earned the
most (at $47,000), followed by Whites, Blacks and Hispanic/Latinos (the latter at $33,000). This
in part reflects education and occupation differences. Notably, second generation Blacks earned
significantly more than their third-and-higher generation counterparts ($40,000 vs. $30,000).
3.3 The Earnings Gap Between the 2nd
and Third-and-higher Generations
As noted above, absent any controls, the labour market outcomes of 2nd
generation Americans at
any point in time are very similar to those of the third-and-higher generation Whites, and
superior to those of the third-and-higher generation racial minorities. Using data from the early
2000s, Aydemir and Sweetman (2008) find employment and unemployment rates and earnings
that are very similar between the 2nd
and third-and-higher generation (Table 7).10
After
controlling for age, 2nd
generation immigrants earn more than their third-and-higher generation
counterparts. Card (2005) finds that after controlling for age, second generation immigrants have
an 8% higher wages. Borjas (2006) finds a 7% to 9% gap in 2000.
Age at
immigration
12 years
Age at
immigration
11 year
Father
only
Mother
only
Both White Other
Males
Employed (%) 85.4 86.2 81.4 84.9 82.5 84.6 74.6
Unemployed (%) 4.6 4.4 3.4 4.1 3.8 3.3 6.2
Annual ernings ($) 32.3K 36.9K 43.6K 44.5K 40.8K 42.1K 27.5K
Females
Employed (%) 58.2 71.4 69.9 74.6 69.9 71.5 68.5
Unemployed (%) 4.3 3.1 2.7 3 3.3 2.3 4.8
Annual earnings ($) 14.5K 22.2K 22.3K 23.0K 21.5K 21.2K 18.4K
Source: Aydemir and Sweetman (2008) with data from Current Population Survey
Table 7 Labour market outcomes of 2nd
and third-and-higher generation
Americans, 1998 to 2004, no controls, population age 25 to 65
Immigrant 2nd
generation Third-and-higher
generation
10. They compute estimates for various types of 2nd
and third-and-higher generation Americans.
See Table 11 to 13 in their paper.

23
But as noted in much of the literature, source region of the parent (immigrant) is an important
determinant of these wage differentials. In 2000, second generation members with parents from
Mexico, Nicaragua, Haiti, El Salvador and the Dominican Republic had wage gaps in the order
of -4% to -19% (age adjusted, compared to third-and-higher generation as a whole), while those
whose parents were from countries like Canada, Germany, Greece, India, Poland, and the UK
had large positive gaps in the range of 17% to 27% (Borjas 2006). This is important because of
the increase in the share of immigrants from Mexico and Central and South America.
The overall relative wage advantage of the 2nd
generation has been declining through time in the
US. Borjas (2006) shows that the wage advantage of 2nd
generation males over their third-and-
higher counterparts (age adjusted only) has declined from 18% in 1940, to 15% in 1970, and just
6% in 2000. Just as relative earnings among immigrants has been declining, certainly since the
late 1970s, so too have relative wages among the children of immigrants. Changing source
regions (and factors correlated with it, such as educational attainment, language, education
quality, discrimination, etc.) is a large part of the explanation for the decline in immigrant
earnings in both Canada and the US, and that may be the case among the 2nd
generation as well.
Borjas (2006) finds that controlling for both education and age reduces the gap to 3% from 6%.
Card (2005) controls for region of residence (the 2nd
generation are more likely to live in large
urban area, where wages are higher) reduces the gap to around 3% (Table 8). Adding controls for
education reduces it yet again, to around 1.5 %. Hence, most of the wage gap between 2nd
and
third-and-higher generations at a point in time can be accounted for by where they live and their
higher educational attainment. These two variables significantly influenced the wage gap in
Canada as well. Location of residence seems to be particularly important. However, these
specifications assume identical returns to education for 2nd
and third-and-higher generations, and
some Canadian research (and U.S research shown below) suggests lower returns for 2nd
generation visible minorities in particular.
Table 8 Hourly wage gap between second and third-and-higher generation Americans
1995 to 2002, population aged 21 to 64
Coefficients X 100 = (roughly % differences)
Controls for:
(1)
age
(2)
(1) plus
region/urban
(3)
(2) plus
education
(4)
(3) plus
race/ethnicity
Men 8.0 3.6 1.5 2.3
Women 8.3 3.0 1.2 1.9
Source: Card (2005). Original data are from Current Population Survey.
Note: Virtually all coefficients are statistically significant
The research of Aydemir and Sweetman (2008) (and others) suggest that educational attainment
reduces the gap (Table 9). However, as with the Canadian case, they find some evidence that the
returns to education are lower among 2nd
generation Americans than the third-and-higher
generation. Returns to years of schooling are seen to be 14.0% for each additional year among
third-and-higher generation, and 12.6% among 2nd
generation males. Similar differences are
observed for females, although the rates of return are higher than for males. While the

24
differences in the rates of return are not statistically significant, they are of the same order of
magnitude as in the Canadian case, where they are statistically significant due to the larger
sample.
Table 9 Percentage differences in annual earnings between 2nd
and third-and-higher
generation, the United States, 1998 to 2004, population aged 25 to 64
(1)
No controls
(2)
(1) plus years
of schooling
(3)
(2) plus add marital status
ethnicity, urban/geographic
location
Males
2nd
generation, Mom immigrant 0.014 -0.015 0.004
2nd
generation, Dad immigrant -0.026 -0.068 -0.068
2nd
generation, both immigrants 0.021 -0.009 0.001
Females
2nd
generation, Mom immigrant 0.077 0.055 0.006
2nd
generation, Dad immigrant 0.023 -0.019 -0.072
2nd
generation, both immigrants 0.088* 0.077 -0.026
* Statistically significant
Source: Aydemir and Sweetman (2006). Original data are from Current Population Survey.
Note: the table is based on coefficients from ordinary least square regression with log annual earnings as the
dependent variable.
3.4 The Intergenerational Transmission of Wages among Immigrant Families
As in Canada, there is concern in the US about the intergenerational transmission of earnings,
given that earnings have declined among entering immigrants since the 1980s. Borjas (2006)
focuses on the intergenerational transmission of earnings, and factors affecting it. Wages of the
2nd
generation are seen to be 5 to 10 percent higher than that of the first generation parents.
Rising intergenerational educational attainment levels appear to be responsible for much of the
intergenerational wage gain, since the intergenerational wage gain largely disappears once the
data are adjusted for differences in educational attainment between generations. He estimates an
intergenerational wage correlation (controlling for age) of around .56 for men over the 1970 to
2000 period, and .28 for women. That is, in the case of men, about half of the wage advantage
(or disadvantage) of the parent is passed on to the offspring. These correlations are higher than in
Canada, suggesting intergenerational wage mobility among immigrant families is greater in
Canada than in the US.
Once again, education appears to account for much of this “stickiness” in wages between
generations in the US. After controlling for both age and education, these intergenerational
correlations decline by about half, to .25 for men, for example. Much of the intergenerational
transmission of wages reflects intergenerational transmission of education. The estimate of the
(age adjusted) intergenerational wage correlation .56 for men, for example, is higher than that
typically observed among the U.S population as a whole (between .2 and .4). Thus, wage
“stickiness” between immigrants and their children is relatively high.

25
Borjas (2006) argues that this greater degree of intergenerational stickiness is associated with
“ethnic capital”. That is, children’s outcomes depend not only on their parents’ socio-economic
status and activities, but also on the ethnic environment in which the child is raised. An
advantaged environment, where most parents have a university education, for example, provides
the children with valuable characteristics that improve their outcomes later in life, independent of
family effects. Environment where most members are high school drop-outs may have the
opposite effect. Borjas points to a number of studies that suggest “ethnic capital” can have such
an effect (Borjas 1995; Cutler et al. 2005). Canadian research also suggests that “ethnic capital”
is an important component of the intergenerational transmission of wages (Aydemir, Chen and
Corak, 2005).
The concern regarding wage stickiness seems related largely to the low wages (and educational
levels) among immigrants with Hispanic and Mexican backgrounds. Will these lower levels be
passed on to their children? Smith (2003) addresses the issue of intergenerational educational
attainment and wage transmission for Hispanics and Mexican father-son pairs. He finds rapid
decreases in the wage gap with the third-and-higher generation from the 1st to 2
nd generations.
For example, Mexican immigrants born between 1940 and 1944 had a wage gap (deficit) of 35%
with the third-and-higher generation Whites (age adjusted). Among their sons, the gap was
reduced to 18%.
Much of this wage gap is due to the fact that the educational attainment among Mexicans, no
matter which generation, is less than among the third-and-higher generation Whites. Hence, one
would expect them to earn less. Focusing on the gap between the 3rd
generation Mexicans and
third-and-higher generation Whites, Smith (2003) concludes that these differences in educational
attainment account for a little less than half of the gap. It falls from 17% to 10% when adjusted
for educational attainment. Hence, while educational attainment counts for some of the wage
gap, much remains after adjusting for that factor.
Fry and Lowell (2005) come to a similar conclusion when focusing on the wage gap between 2nd
generation Latino (Mexican, Puerto Ricans and Central/South Americans) workers and third-
and-higher generation Whites. They find that more than half of the negative wage gap is
accounted for by the lower educational attainment and potential experience of the 2nd
generation
Latino Americans.
Smith (2003) finds intergenerational transmission elasticity of .46 between the 1st and 2
nd
generation Mexicans, somewhat on the high side compared to estimates for non-immigrant
populations in the US, which tend to be in the .2 to .4 range. There is a considerable degree of
“stickiness” in the intergenerational transmission of wages among Mexicans. This stickiness was
noted by Borjas (2006), who argues that “ethnic capital” may be responsible. Hence, although
there are intergenerational gains made by the Mexican population, the regression to the mean
wage is slower among this group than the non-immigrant populations. The disadvantages
apparent among the immigrant parents are passed on to a greater extent than for non-immigrant
families. The elasticity is lower between the 2nd
and 3rd
generations, so that over time generations
increasingly converge to the mean.

26
3.5 Summary of Labour Market Outcomes in the US
Participation rates and unemployment rates among the children of immigrants and those of
American born parents are roughly the same. Reflecting their somewhat higher level of
education, a larger share of 2nd
generation Americans are in the professions than is the case for
the third-and-higher generation. Particularly high levels of concentration in professional
occupations are evident among the children of immigrants of Asian background. Second
generation Blacks also have a relatively high share in the professions, equal to 2nd
generation
Whites, and much above third-and-higher generation Blacks.
Second generation Americans earn, on average, about the same or somewhat more than their
third-and-higher generation counterparts (age adjusted). But this positive wage gap has been
declined significantly over the past few decades, just as the negative wage gap between
immigrants and the third-and-higher generation has increased. Both trends are driven to some
extent by the change in composition of immigrants by source region.
There is significant variation in the 2nd
/3rd
generation gap by ethnic group/nationality. Children
of immigrants parents from Mexico and Central/South American earn significantly less than the
third-and-higher generation (as a whole), while those with parents from Canada and Western and
Northern Europe earn more. And the share of immigrants (and hence 2nd
generation) from the
former countries has been rising over time.
Much of the economics research in the US focuses on the intergenerational transmission of
wages between immigrants and their children. The children do experience higher average wages
than their immigrant parents, largely because of higher educational attainment. But the
intergenerational transmission of wages is stickier among immigrant families than the US
population as a whole.
Immigrant ethnic groups with a wage advantage pass this on to their children more than is the
case for American families as a whole, and those with a wage disadvantage also pass this on to a
considerable extent (and more than among Canadians, immigrants or not). Intergenerational
transmission of educational attainment is also relatively “sticky” among immigrant families in
the US, and some of the stickiness in wages reflects this stickiness in educational attainment.
Much of it also likely reflects the effect of “ethnic capital”, part of which is the educational
attainment of the community as a whole.
This intergenerational transmission process could be detrimental for Hispanics and Mexicans, as
noted in the “segmented assimilation” literature. Lower parental educational attainment, a greater
share of single parent families, discrimination and deviant lifestyles (drugs, gangs) are seen to
result in poorer assimilation outcomes for these ethnic groups, among others.
However, the economics literature suggests that there is positive assimilation (along the wage
dimension) among Hispanics and Mexicans in the US. Wages are higher among 2nd
generation
children than among their immigrant parents. Perhaps more importantly, the negative wage gap
with the third-and-higher generation Whites is large among immigrants in these ethnic groups,
but narrows considerably among the 2nd
generation (their children), and is even smaller among

27
the third generation. This progression is partly related to higher levels of education among
successive generations.
Assimilation is seen to be a multi-generational process in the US as in Canada. Nonetheless,
even though there are on average intergenerational gains in relative wages, even among
Hispanics and Mexicans, the low levels of educational attainment and wages among the
immigrant parents, and relatively sticky intergenerational processes, does mean lower wages
among the 2nd
plus generation , even with positive assimilation. And the share of immigrants and
2nd
generation American in these groups has risen over the past 30 years.
4. A Summary of the Determinants
The research reviewed above suggests that the determinants of earnings outcomes (notably
earnings gaps) for the 2nd
generation include:
Years of Schooling
An important determinant of wages in any wage model, this variable may account for one
half to two thirds of the positive wage gap between the 2nd
and third-and-higher generation in
Canada, and perhaps all of the gain in wages between the 1st and 2
nd generation in the US.
But some research suggests that the 2nd
generation visible minority population have lower
returns to education than the third-and-higher generation, reducing the effect of this variable
on the earnings of the 2nd
generation. Second generation racial minority groups may have
more difficulty converting higher levels of education in particular to earnings, just as many
1st generation immigrants do (but to a greater extent). In spite of their higher levels of
education, racial minority group males in Canada have lower earnings than third-and-higher
generation Whites.
Location
This is an important determinant of the wage gaps. Wages tend to be higher in large urban
areas than elsewhere, and it is here that immigrants and their children (as adults) tend to
cluster. This variable accounts for almost as much of the difference in the 2nd
and third-and-
higher generation wage gap as does years of schooling, although as strictly a determinant of
wages it is likely much less important.
Ethnic group/Source Region
Even after controlling for variables such as those mentioned above, ethnic group differences
in earnings among the 2nd
generation persist. In Canada, Blacks tend to earn less, the Chinese
more than other visible minority groups. And there are significant differences in the
economic returns to education across ethnic groups educated in Canada which will influence
earnings outcomes.
The “stickiness” of wages between the 1st and 2
nd plus generation
Since first generation immigrants in many ethnic groups find themselves with very low
wages (relative to the third-and-higher generation), wage mobility between these immigrants
and their children (as adults) is important. Generally speaking, wage mobility is greater
28
among immigrant families in Canada than in the US, just as it is among the population as a
whole. Much of the higher level of “stickiness” is a reflection of the higher intergenerational
stickiness of educational outcomes also observed in the US. In the US, intergenerational
wage transmission is particularly sticky among Mexicans, although the Mexican 2nd
generation does, on average, outperform their immigrant parents.
Ethnic Capital
This variable is seen to play a major role in the intergenerational transmission of wages (from
the 1st to the 2
nd generations). In Canada, the average level of educational attainment of the
ethnic community is an important determinant of the wages of the 2nd
plus generation, which
generally plays a very positive role given the generally high level of educational attainment
among immigrants. In the US, the lower intergenerational wage mobility is seen to be in part
due to a lack of “ethnic capital” among some groups.
5. Conclusion
Overall, the children of immigrants in both Canada and the United States, along with Australia,
register very positive educational and labour market outcomes. In the aggregate, employment
and unemployment rates are equal to or better than those of the 3rd
plus generation, and among
those employed, earnings are superior. And reflecting their high levels of education, the 2nd
generation are more likely to be in professional occupations than their 3rd
plus generation
counterparts. The economic integration of the children of immigrants appears to be very
successful. Generally speaking, such evidence does not suggest a need for a significant active
policy response.
There are a couple of caveats regarding this overall positive picture which may hold implications
for future research or suggested policy responses. We will focus on Canada first.
The results reported are derived primarily from the children of immigrants who came to Canada
before the 1980s. The economic conditions of entering immigrants started to deteriorate in the
1980s and continued almost unabated into the early 2000s. Highly educated entering immigrants
in particular were affected by this deterioration. It is too early to tell if poorer economic
integration among the immigrant parents will influence the educational and labour market
outcomes of their children in the years to come.
In Canada there are a couple of reasons why the effect may be limited. First, because of changes
in the selection process for skilled economic immigrants, the educational attainment of entering
immigrants rose dramatically. Various authors11
have commented on the positive effect on the
second generation educational outcomes in particular of selecting highly educated immigrants in
the first generation. This positive effect will probably increase in the future. In 1981, one-quarter
of recently entering male immigrants12
had a university degree; by 2006 it was almost 60%. The
trend is similar among women, but the proportions somewhat lower. The educational attainment
of the parents is an important determinant of educational, and hence labour market, outcomes of
11
e.g. Boyd, 2002; Aydemir and Sweetman; 2008 Hum and Simpson, 2007 12
Aged 25 to 54 and entered during the previous five years

29
the children. Hence, rising educational attainment of immigrants should have a strong positive
effect on the outcomes (particularly the educational attainment outcomes) of the children of
immigrants in the future.
Second, Canada displays considerable mobility in the intergenerational transmission of education
and labour market outcomes among immigrants. Coming from a poor immigrant family (or a less
educated one) does not dictate that the children will have poor educational or labour market
outcomes. The “stickiness” in the intergenerational transmission of education is much lower
among immigrant than Canadian born families. A child from a less educated immigrant family is
more likely to achieve a higher level of education than that from a similarly educated family with
Canadian born parents. And research suggests that the “stickiness” in the intergenerational
transmission of earnings is about the same among immigrant and Canadian-born families, which
is quite low by international standards. Finally, declining incomes among the more highly
educated families may have little effect, since educational outcomes of the children are driven
more by the educational attainment of the parents than their incomes. For these reasons, the
deteriorating economic outcomes of the immigrant parents may not have a significant effect on
the outcomes of the children.
This brings us to a second caveat regarding the generally positive findings: the differences
among ethnic/source region groups. Basically, second generation Canadians whose parents
originate from developing nations such as China, India and Africa have superior educational
outcomes, and those with backgrounds from developed nations such as Europe, the U.S and
Australia have superior economic and labour market outcomes. Evidence is emerging to suggest
that although the 2nd
generation visible minorities do very well economically, as well as or better
than the 3rd
plus generation, they may have more difficulty converting education to earnings than
other 2nd
generation groups, or the third-and-higher generation. Evidence on this point remains
very preliminary and weak, so at the very least more research is required. The lack of
understanding of this point makes it difficult to discuss whether a policy response if call for, and
if so, what type. The focus of this issue is really on the Black population, where wage gaps with
the third-and-higher generation Whites are the largest (around 10% to 15% after controlling for
socio-economic differences). The Black population is a relatively small population in Canada-
only 6.7% of immigrants, 3.2% of the second generation, and 1.1% if the third-and-higher
generation were Black in 2006.
Of course, discrimination, either statistical13
or individual14
, cannot be ruled out as contributing
to this issue. But neither can it be assumed that it is a major part of the explanation. At this point
the economics literature, at least, has relatively little to say on the issue. In a randomized
experiment, Oreopolis (2009) did find that job applicants with English sounding names and
Canadian experience were much more likely to be called for an interview (all other job and
personal characteristics identical) than those with Asian sounding names, and foreign experience.
But whether this points to discrimination or employers’ concerns regarding language (among
immigrants) and other traits is not known.
13
Where either real or perceived characteristics such as language or work-ethic of the group to which the individual
belongs, rather those of the individual, are used to make a decision regarding hiring, for example. 14
Where the desire to exclude persons of a particular race, for example,
30
In the United States the effect of the deterioration of immigrant earnings since the 1980s on the
outcomes of their children is less clear. On the positive side, the economic downturn among
entering immigrants appears to be less severe in the U.S than in Canada, during the 1990s in any
case. Hence, the effect on the children may be less. However, the educational attainment of
entering immigrants did not improve in the US as it did in Canada. The lack of a points system
for selecting skilled economic immigrants, and the fact that most immigrants to the US enter
through “family reunification”, makes it more difficult in that country to alter characteristics
such as educational attainment. Increased use of the HB-1 visa, designed for immigrants who
have lined up a job with an employer, in the U.S since the 1990s may have resulted in better
economic outcomes in the US than in Canada, and has the potential to affect outcome of
immigrants, and hence potentially of their children.
The shift in immigrant source regions toward Mexico, South and Central America in recent
decades could significantly affect aggregate outcomes of the 2nd
generation in the U.S. These are
populations among whom educational and labour market outcomes are less positive, primarily
because of the low levels of educational attainment of the immigrant parents15
. Furthermore, the
intergenerational “stickiness” regarding educational and earnings outcomes is greater among
immigrant families in the U.S than those in Canada. Thus, lower educational and labour market
outcomes are more likely to be passed on intergenerationally to the children in the U.S. than in
Canada. The reason for this is not clear. However, this result reflects the differences between the
two countries in general (i.e., for the entire population, not just immigrants), and hence may be
rooted in differences in the educational system, and in particular the greater access to post-
secondary education among less educated families in Canada than in the U.S.
Concerns in the U.S. sociological literature regarding “downward assimilation” focus on the
outcomes of the children of Mexican and South American immigrants, which constituted almost
half of all recently entered immigrants in the early 2000s, up from one-quarter in the late 1970s.
This “segmented assimilation” literature suggests that deviant lifestyles, low-educational
attainment among the parents, and larger number of single parent families combine to produce
poor outcomes for the 2nd
generation. The economics literature, however, suggests that, on
average at least, there are significant improvements intergenerationally among Mexican and
Hispanic immigrant families. The children from Mexican immigrant families, for example,
outperform their parents in terms of education and earnings outcomes, and perhaps more
importantly, outperform the 3rd
plus generation with similar family characteristics. A research
focus on populations among which 2nd
generation labour market outcomes are less positive
would seem a reasonable response - notably the Black population in Canada and Mexicans and
Hispanics in the US. In Canada, at least, there is simply insufficient evidence regarding their
labour market outcomes to provide any underpinning for useful policy responses.
However, one can gaze into the future to assess broad trends in the outcomes of the children of
immigrants entering during the 1980s and 1990s. Shifting source regions, along with changing
educational attainment of immigrants, holds significant implications for the future outcomes.
During the 1970s and 1980s in particular, there was a major shift in immigrant source regions. In
15
When education, location and other family characteristics are controlled for, children of these immigrant families
are seen to do as well or better than their 3rd
plus generation counterparts.

31
Canada, this meant an increased share of immigrants from Asian and Africa (notably China,
India and African nations), and in the US, increasing shares of Mexicans and Hispanics in
particular (Appendix table 1). Latinos (Mexican, Puerto Ricans and Central/South Americans)
are projected to be the fastest growing segment of the labour force in the U.S over the coming
years.
At the same time, Canada moved to a “points” system for skilled economic migrants, which
emphasizes educational attainment. This resulted in immigrants who were more highly educated
than the domestic population. In the US, most immigration is for family reunification purposes,
where education is not accentuated. Hence, educational levels are lower, and have not increased.
These differences hold important implications for 2nd
generation outcomes, given the
determinants outlined above.
Basically, educational attainment of the children of immigrants, already very high, is likely to
rise in Canada, driven by increasing educational attainment of the immigrant parents and
increased immigrant concentration among populations (source regions/ethnic groups) that
achieve very high levels of educational attainment (beyond that dictated by educational
attainment of the parents alone). These advantages are not observed in the U.S. During the past
20 years, US immigration moved increasingly towards Central and South Americans and
Mexicans. Among new male adult immigrants who entered the US in the late 1970s, about one
quarter of the immigrants were from South and Central America; among the early 2000s entering
cohort this had risen to one half. And the share with a university degree among entering
immigrants changed little from 33% to 35% over the same period. Hence, educational gains
among the 2nd
generation are likely to be less evident.
Assessing future labour market outcomes may be a little more complex. Improving educational
attainment in Canada among the children of immigrants is likely to have a positive effect on
labour market outcomes. Thus, in the aggregate the 2nd
generational is likely to continue to
outperform the 3rd
plus generation in the labour market, perhaps increasingly so. In the U.S. the
positive wage gap between the 2nd
and 3rd
plus generations has been decreasing historically, and
this is likely to continue. This trend is driven to a great extent by a shift in the source region of
immigration.
However, in both Canada and the U.S preliminary evidence suggests some issues among
particular populations. In spite of the overall positive outcome among visible minorities in
Canada, conditional on education and location, their labour market outcomes are inferior to
those of the third-and-higher generation Whites. This is particularly true for the Black
population. But whether this outcome will hold (or be accentuated) as the children of the “new”
(post 1970) immigrants enter the prime age working years is hard to say. It is too early for
definitive evidence. And in the U.S., focus will continue to be on negative wage gap evident
among children from Latino backgrounds. There is substantial wage stickiness between the 1st
and 2nd
generations in the US in particular. However, the estimated relative returns to an
additional year of schooling for 2nd
generation Mexican, Puerto Rican and Central/South
American workers are similar to those for third-and-higher generation Whites. Hence, a focus on

32
improvements in educational attainment is likely to pay off in terms of improved earnings
outcomes16
.
16
The same is not necessarily true for the Black population in the U.S., for example, and hence the benefits of
improved educational attainment, in terms of earnings outcomes, is not clear for Blacks. Note that these results and
arguments are based on “relative” returns to education…returns relative to someone with fewer years of education.
This does not imply that a 2nd
generation Latino worker with, say, 16 years of education would necessarily earn the
same as a 3rd
plus generation White workers with the same education. It means that one additional years of
schooling will increase their earnings (relative to someone with, say 15 years of schooling) by the same amount.
Hence, the incentive to acquire further years of education, and the gains from that additional education is the same
between the two populations. However, it does not mean that the people in the two populations will have the same
earnings level if they have the same level of education (and all other relevant characteristics such as experience, etc.)

33
1980 1990 2000 2005 1980 1990 2000 2005
USA
Source region
North America 2.6 2.0 2.6 1.8 2.8 2.1 2.8 2.1
Carribbean 7.0 7.2 6.9 5.1 7.6 7.7 7.8 6.2
South & Central America 25.1 32.2 40.6 49.3 24.8 30.9 36.6 40.9
Northern Europe 4.4 3.9 3.3 2.6 4.4 3.5 2.7 2.1
Western Europe 2.7 2.5 3.0 2.2 3.4 2.9 2.9 2.0
Southern Europe 4.5 1.9 1.7 1.3 3.8 1.5 1.6 1.2
Eastern Europe 6.0 6.2 7.7 5.5 6.0 5.8 8.7 7.0
Africa 3.9 3.9 5.8 5.9 2.1 2.3 5.0 5.5
South Asia 5.4 5.6 8.7 8.5 4.1 4.1 7.1 7.2
Southeast Asia 13.4 9.3 5.6 5.2 16.2 13.7 8.4 9.4
East Asia 12.8 15.6 10.4 9.1 14.4 17.2 12.9 12.7
West Asia 6.4 4.4 2.9 2.5 4.8 3.7 2.6 2.6
Oceania & other 5.8 5.2 0.9 1.0 5.6 4.6 1.0 1.1
With a university degree 33.0 33.9 36.3 35.0 19.7 26.0 32.3 36.0
Canada
Source region
North America 6.9 2.4 1.6 1.9 7.9 3.5 2.1 2.4
Carribbean 6.8 4.5 3.0 2.9 7.2 6.0 3.6 3.2
South & Central America 6.4 8.8 4.4 7.2 6.6 9.2 5.2 7.7
Northern Europe 17.3 4.7 2.6 3.0 15.0 4.9 2.0 2.1
Western Europe 5.7 2.5 3.6 3.4 5.6 2.7 3.2 2.7
Southern Europe 7.9 5.3 5.3 2.4 7.2 4.3 4.8 2.1
Eastern Europe 5.7 12.9 10.3 9.9 5.5 11.3 11.0 10.8
Africa 6.5 8.6 9.6 12.7 5.4 5.8 7.4 9.7
South Asia 6.2 9.8 18.7 20.3 6.9 7.3 15.1 17.8
Southeast Asia 14.9 11.2 6.5 7.2 15.6 15.7 9.9 10.5
East Asia 10.0 19.2 25.1 20.4 11.9 21.4 27.9 23.1
West Asia 4.4 9.3 8.6 8.0 3.6 7.1 7.3 7.2
Oceania & other 1.5 0.7 0.6 0.8 1.5 0.7 0.5 0.6
With a university degree 26.2 28.2 52.9 59.7 16.4 21.1 41.7 51.1
Note: New immigrants include those who immigrated to Canada within the previous 5 years.
Source: Bonikowska, Hou, and Picot (2009).
Appendix 1 Source regions composition and educational attainment of new immigrants in
the US and Canada, age 25 to 54
Men Women
Percent

34
References:
Abada, Teresa, Feng Hou, and Bali Ram. 2008. "Group differences in educational attainment
among the children of immigrants." Statistics Canada, Ottawa.
Alba, Richard and Victor Nee. 2003. Remaking the American Mainstream. Cambridge, MA:
Harvard University Press.
Aydemir, Abdurrahman, Wen-Hao Chen, and Miles Corak. 2005. "Intergenerational earnings
mobility among the children of Canadian immigrants." Statistics Canada Analytical
Studies Branch Research Paper Catalogue no. 11F0019MIE- No. 267, Ottawa.
—. 2008. "Intergenerational education mobility among the children of Canadian immigrants."
Statistics Canada Analytical Studies Branch Research Paper 315, Ottawa.
Aydemir, Abdurrahman and Mikal Skuterud. 2005. "Explaining the deteriorating entry earnings
of Canada's immigrant cohorts: 1966-2000." Canadian Journal of Economics 38:37.
Aydemir, Abdurrahman and Arthur Sweetman. 2008. "First- and second- generation immigrant
educational attainment and labor market outcomes: A comparison of the United States
and Canada." Research in Labor Economics 27:215-270.
Baker, Michael and Dwayne Benjamin. 1994. "The Performance of Immigrants in the Canadian
Labour Market." Journal of Labor Economics 12:369-405.
Bean, Frank and Gillian Stevens. 2003. America's Newcomers and the Dynamics of Diversity.
New York: Russell Sage Foundation.
Blau, Francine and Lawrence Kahn. 2004. “Gender and Assimilation Among Mexican
Americans”, Cornell University, presented at the NBER Mexican Immigration
Conference.
Bonikowska, Aneta. 2008. "Explaining the education gap between children of immigrants and
the native born: allocation of human capital investments in immigrant families."
Department of Economics, University of British Columbia, Vancouver.
Bonikowska, Aneta and Feng Hou. 2009. "Reversal of Fortunes or continued success? Cohort
differences in education and earnings among children of immigrants." Statistics Canada,
Analysis Branch, Ottawa.
Bonikowska, Aneta, Feng Hou and Garnett Picot. 2009. "A Canada-US comparison of labour
market outcomes among highly educated immigrants." Statistics Canada, Analysis
Branch, Ottawa.
Borjas, George. 1992. "Ethnic capital and intergenerational mobility." Quarterly Journal of
Economics 107:123-150.
Borjas, George. 1995. "Ethnicity, neighbourhoods, and human capital externalities." American
Economic Review 85(3):365-390.
Borjas, George. 2000. Issues in the economics of immigration. Chicago and London: University
of Chicago Press.
Borjas, George. 2006. "Making it in American: Social mobility in the immigrant population."
The Future of Children 16:55-71.
Boyd, Monica. 2002. "Educational Attainments of Immigrant Offspring: Success or Segmented
Assimilation?" International Migration Review 36:1037-1060.
Card, David. 2005. "Is the new immigration really so bad?" The Economic Journal 115:300-323.
Card, David, John DiNardo, and Eugena Estes. 2000. "The more things change immigrants and
the children of immigrants in the 1940, the 1970s and the 1990s." Pp. 227-269 in Issues

35
in the Economics of Immigration, edited by G. Borjas. Chicago: The University of
Chicago Press.
Chiswick, Barry and Noyna DebBurman. 2004. "Educational attainment: analysis by immigrant
generation." Economics of Education Review 23:361-379.
Chiswick, Barry, Yew Liang Lee, and Paul W. Miller. 2005. "Immigrant earnings: a longitudinal
analysis." Review of Income and Wealth 51:485-503.
Cutler, David, Edward Glaeser, and Jacob Vigdor. 2005. “Ghettos and the transmission of ethnic
capital.” In Ethnicity, Social Mobility and Public Policy: Comparing the US and UK.
Edited by Glenn Loury, Tarig Modood, and Steven Teles. Cambridge: Cambridge
University Press, 204-221.
Feliciano, Cynthia. 2005. "Does selective migration matter? Explaining ethnic disparities in
educational attainment among immigrants' children." International Migration Review
39:841-871.
Finnie, Ross., C. Laporte and E. Lascelles. 2004. “Family background and access to post-
secondary education: What happened over the 1990s?” Statistics Canada, Analytical
Studies Research Paper Series, no. 226. Ottawa.
Finnie, Ross and Richard Mueller. 2009. "Access to post-secondary education in Canada among
first and second generation Canadian immigrants." University of Ottawa, Graduate
School of Public and International Affairs, Ottawa.
Frenette, Marc. 2005. “Is post-secondary access more equitable in Canada or the United States?
Statistics Canada, Analytical Studies Research Paper Series, no. 244. Ottawa.
Fry, Richard and B.Linsay Lowell. 2005. “The Wage Structure of Latino Origin Groups Across
Generations”, Institute for the Study of International Migration and Pew Hispanic Centre,
Washington, D.C.
Green, David and Alan Green. 2004. "The Goal’s of Canada’s Immigration Policy: A Historical
Perspective." Canadian Journal of Urban Research 13:102-139.
Hou, Feng and Simon Coulombe. 2009. "The Earnings gaps for Canadian-born visible minorities
in the public and private sectors." Statistics Canada Analysis Branch, Ottawa.
Hum, Derek and Wayne Simpson. 2007. “The legacy of immigration: labour market
performance and education in the second generation”. Applied Economics 39: 1985-2007
Hum, Derek and Wayne Simpson. 1999. "Wage opportunities for visible minorities in Canada."
Canadian Public Policy 25:379-394.
OECD. 2006. "Where Immigrant Students Succeed - A Comparative Review of Performance and
Engagement in PISA 2003." Organisation for Economic Co-operation and Development,
Paris, France.
Ogbu, John. 1991. "Immigrant and involuntary minorities in comparative perspective." Pp. 3-33
in Minority Status and Schooling: A Comparative Study of Immigrant and Involuntary
Minorities, edited by M. A. Gibson and J. U. Ogbu. New York: Garland.
Pendakur, Krishna and Ravi Pendakur. 1998. "The colour of money: earnings differentials
among ethnic groups in Canada." Canadian Journal of Economics 31:518-548.
Pendakur, Krishna and Simon Woodcock. 2008. "Glass ceilings or glass doors? Wage disparity
within and between firms." Department of Economics, Simon Fraser University,
Vancouver.
Perlmann, Joel and Roger Waldinger. 1997. "Second generation decline? Children of
immigrants, past and present-a reconsideration." International Migration Review 31:893-
922.

36
Picot, Garnett. 2008. "Immigrant Economic and Social Outcomes in Canada: Research and Data
Development at Statistics Canada." Statistics Canada, Ottawa.
Picot, Garnett and Arthur Sweetman. 2005. "The deteriorating economic welfare of immigrants
and possible causes: Update 2005." Statistics Canada: Analytical Studies Branch
Research Paper Series No. 262, Ottawa.
Picot, Garnett and Feng Hou. 2009. “The Educational Outcomes of the Children of Immigrants
in Canada and the U.S.”, Statistics Canada, forthcoming
Portes, Alejandro. 1995. "Children of Immigrants: Segmented Assimilation and its
Determinants." Pp. 248-279 in The Economic Sociology of Immigration: Essays on
Networks, Ethnicity, and Entrepreneurship, edited by A. Portes. New York: Russell Sage.
Portes, Alejandro and Patricia Fernandez-Kelly. 2008. "No margin for error: Educational
achievement among disadvantaged children of immigrants." Annals of the American
Academy of Political and Social Science 620:12-36.
Portes, Alejandro and Dag MacLeod. 1999. "Educating the Second Generation: Determinants of
Academic Achievement among Children of Immigrants in the United States." Journal of
Ethnic and Migration Studies 25:373-396.
Rambaut, R. G. 1996. "Ties that bind: Immigration and immigrant families in the United States."
in Immigration and the Family: Research and Policy on U.S. Immigrants, edited by A.
Booth, A. C. Crouter, and N. Landale. New Jersey: Lawrance Erlbaum Associates,
Publishers.
Reitz, Jeffery. 2007. "Immigrant Employment Success in Canada, Part II: Understanding the
Decline." Journal of International Migration and Integration 8:37-62.
Rumbaut, Ruben G. 1994. "The Crucible within: Ethnic Identity, Self-Esteem, and Segmented
Assimilation among Children of Immigrants." International Migration Review 28:748-
794.
—. 2005. "Turning points in the transition to adulthood: determinants of educational attainment,
incarceration, and early childbearing among children of immigrants." Ethnic and Racial
Studies 28:1041-1086.
Skuterud, Mikal and Feng Hou. 2008. "The visible minority earnings gap across generations of
Canadian." Department of Economics, University of Waterloo, Waterloo.
Smith, James. 2003. "Assimilation across the Latino generations." AEA Papers and Proceedings
93:315-319.
Smith, James and Barry Edmonston. 1997. The New Americans: Economic, Demographic and
Fiscal Effects of Immigration. Washington, DC: National Academy Press.
Steinberg, L. 1996. Beyond Classroom. New York: Simon & Schuster.
Stelcner, Morton. 2000. "Earnings differentials among ethnic groups in Canada: A review of the
research." Review of Social Economy 58:295-317.
Sweetman, Arthur and Gordon Dicks. 1999. “Education and Ethnicity in Canada: an
Intergenerational Perspective” The Journal of Human Resources. 34, No 4 668-696
Zhou, Min. 1997. "Segmented assimilation: issues, controversies, and recent research on the new
second generation." International Migration Review 31:975-1008.
Zhou, Min and Susan Kim. 2006. "Community forces, social capital, and educational
achievement: the case of supplementary education in the Chinese and Korean immigrant
communities." Harvard Educational Review 76:1-29.
Zhou, Min, Jennifer Lee, Jody Agius Vallejo, Rosaura Tafoya-Estrada, and Yangsao Xiong.
2008. "Success attained, deterred, and denied: Divergent pathways to social mobility in

37
Los Angeles's new second generation." Annals of the American Academy of Political and
Social Science 620: 37-61.