garden city aquatic facility
TRANSCRIPT
Garden City Aquatic FacilityCity Meeting – October 1, 2019
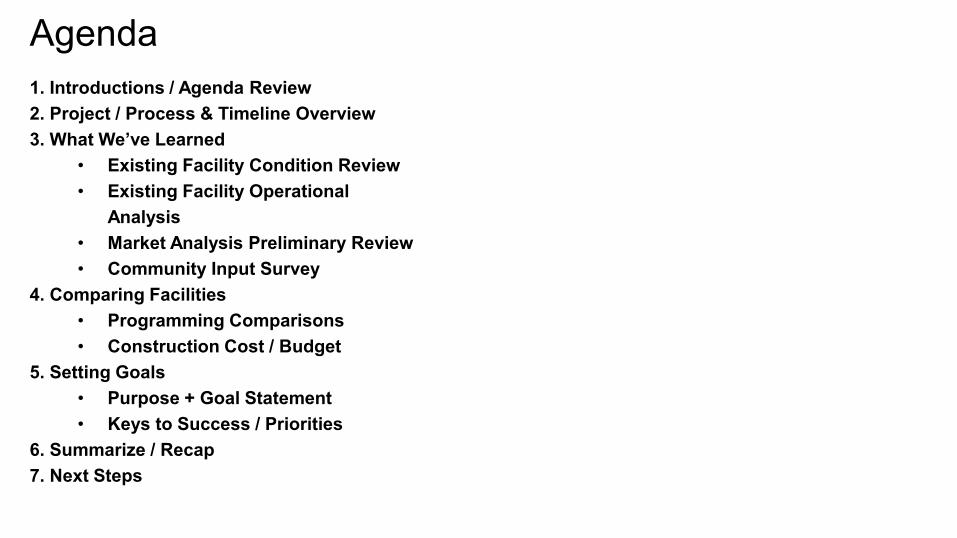
1. Introductions / Agenda Review2. Project / Process & Timeline Overview3. What We’ve Learned
• Existing Facility Condition Review• Existing Facility Operational
Analysis• Market Analysis Preliminary Review• Community Input Survey
4. Comparing Facilities• Programming Comparisons• Construction Cost / Budget
5. Setting Goals• Purpose + Goal Statement• Keys to Success / Priorities
6. Summarize / Recap7. Next Steps
Agenda
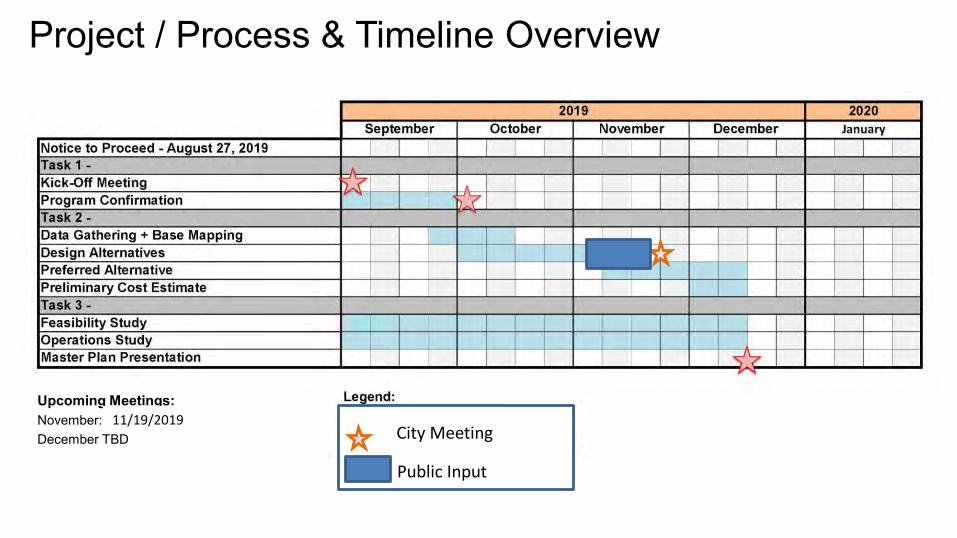
Project / Process & Timeline Overview
Upcoming Meetings: November: 11/05/2019December TBD City Meeting
Public Input
11/19/2019
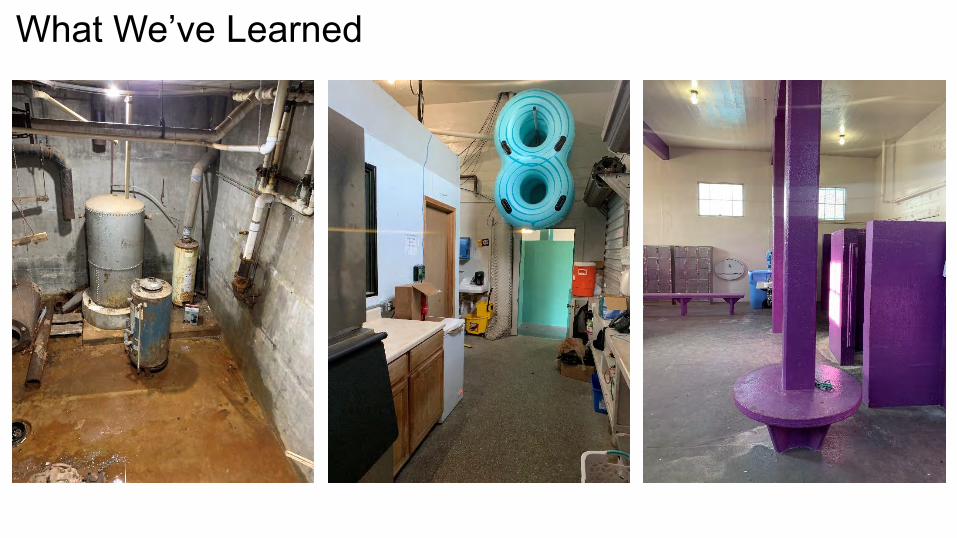
What We’ve Learned

Timeline• Mayor Trinkle- 1921• Open- July 18, 1922• Bath House Constructed-• Filtration System Updated-• Third Renovation Opens- 2006
• 5 New Slides• Bulkhead Added
• Splash Pad & Zero Depth Added• Bath House gets a new skin
The Big Pool a Rich History
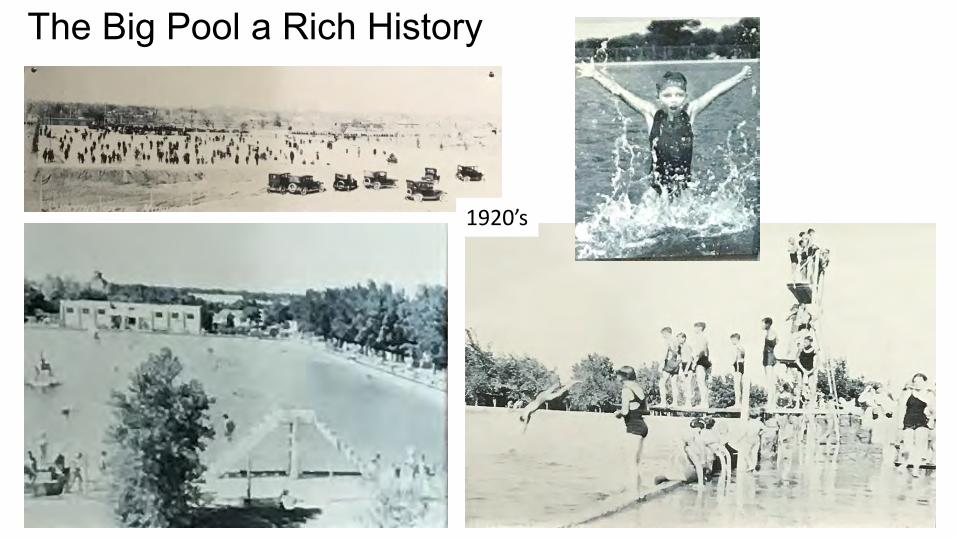
The Big Pool a Rich History
1920’s

The Big Pool a Rich History
1962- Water Skiing
1990’s Moki & Chana
1982 Windsurfing
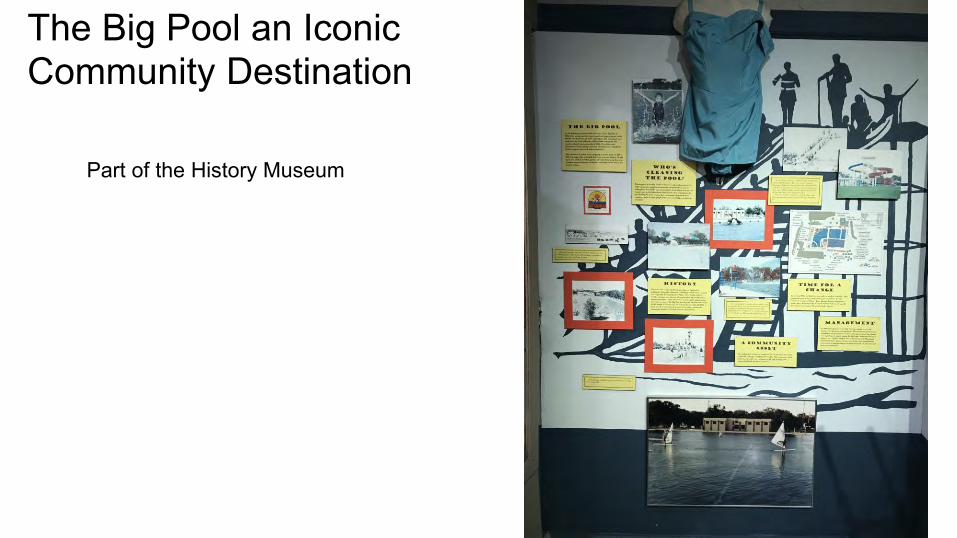
Part of the History Museum
The Big Pool an Iconic Community Destination
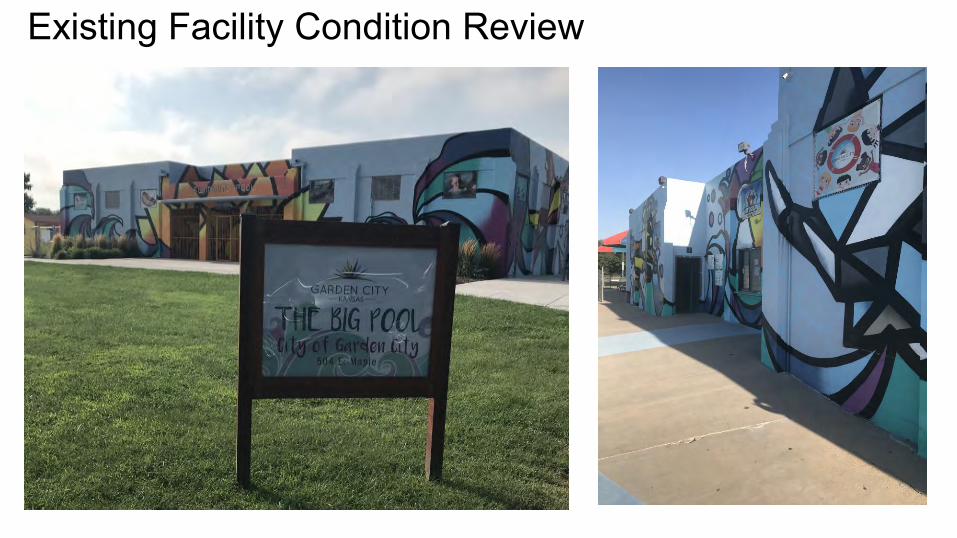
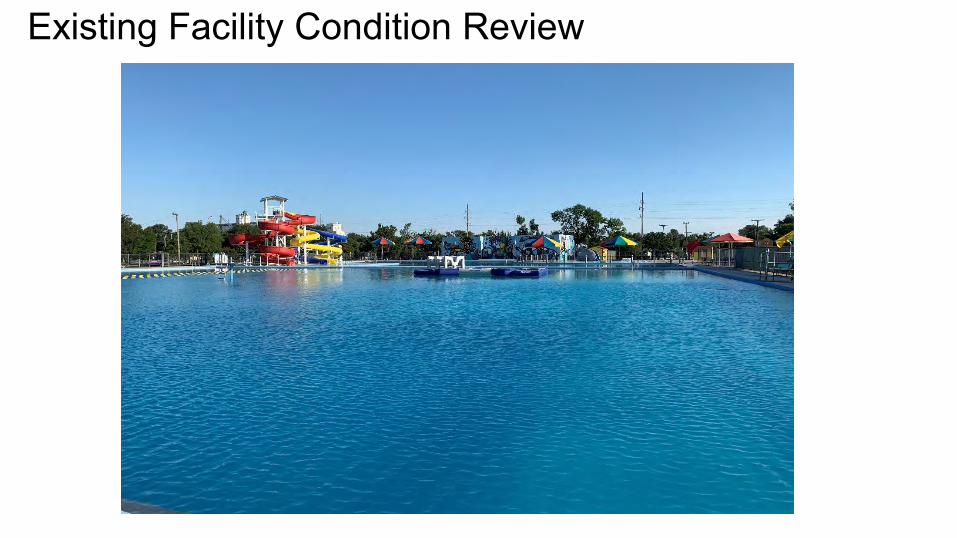
Existing Facility Condition Review
Existing Facility Condition Review
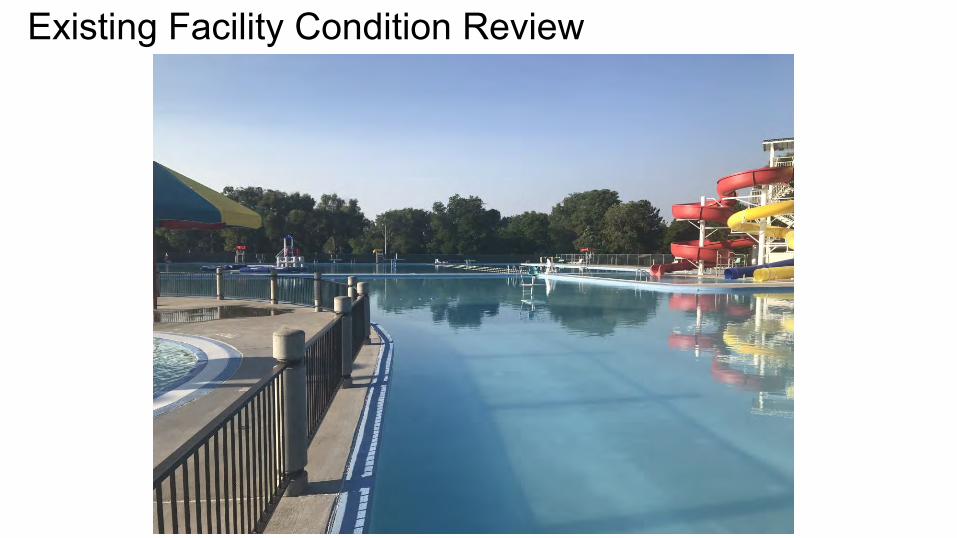
Existing Facility Condition Review

Existing Facility Condition Review
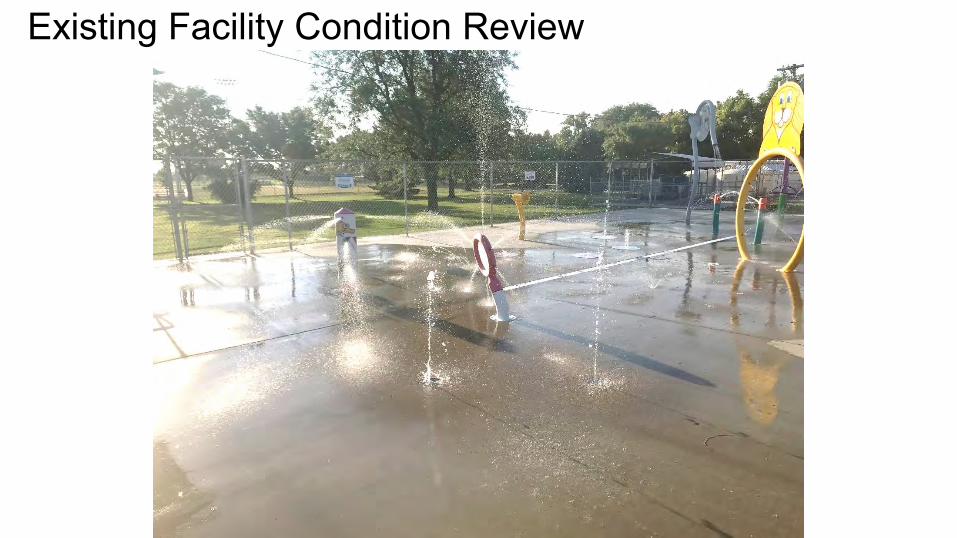
Existing Facility Condition Review
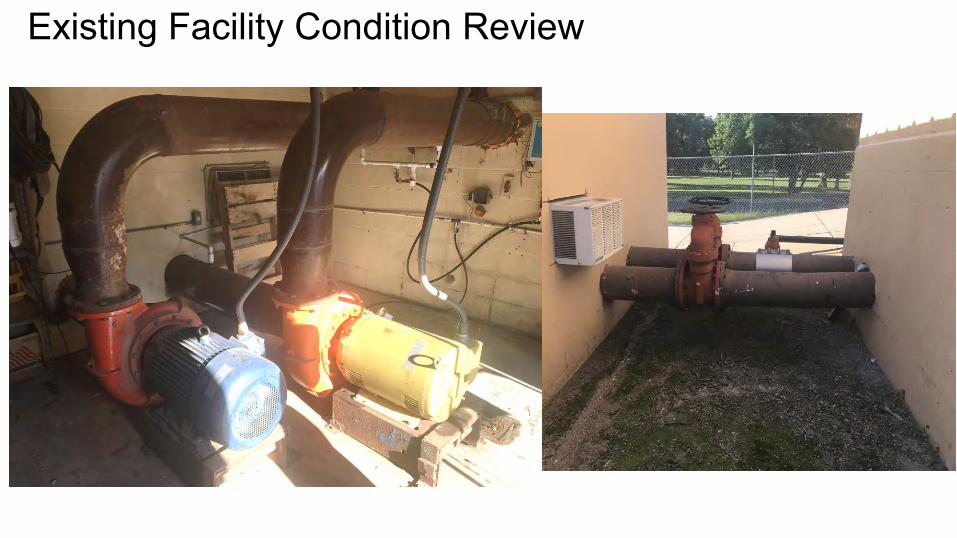
Existing Facility Condition Review
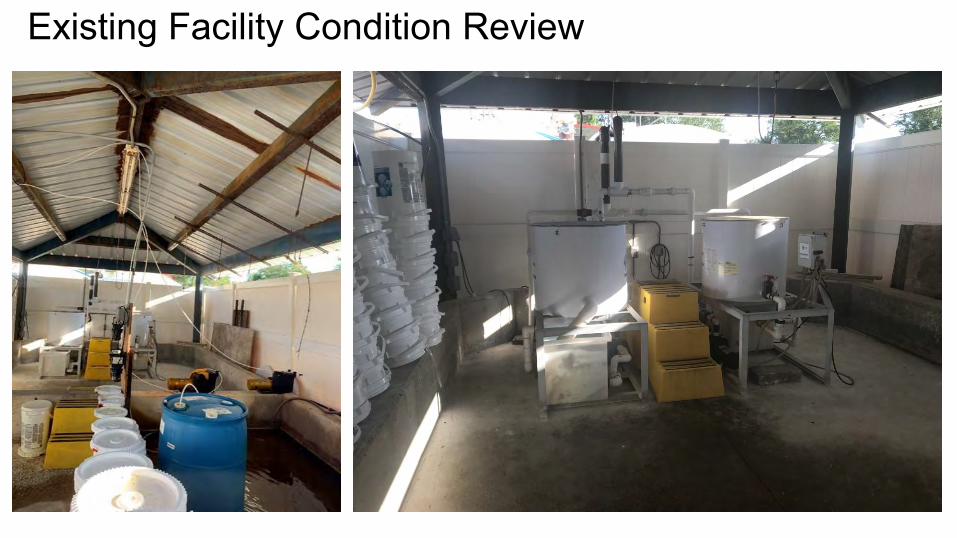
Existing Facility Condition Review
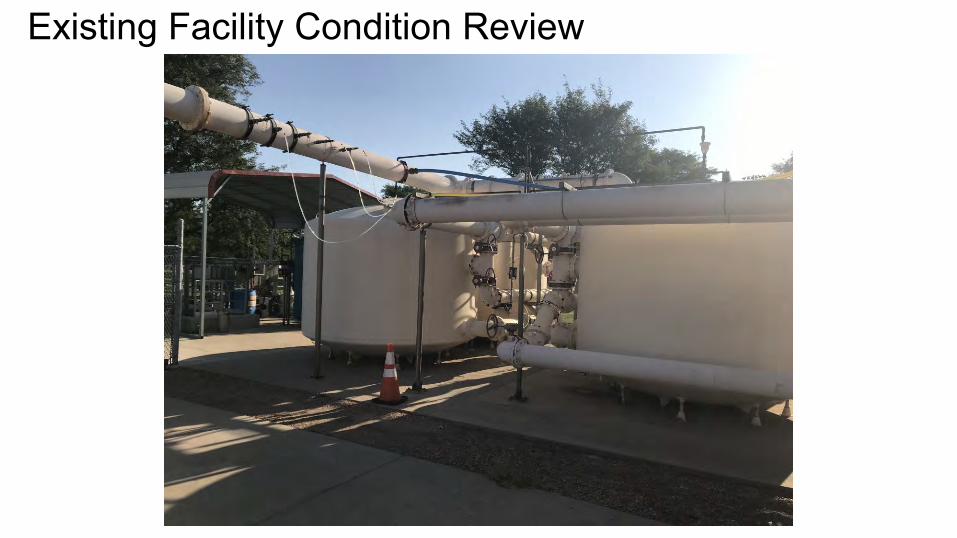
Existing Facility Condition Review
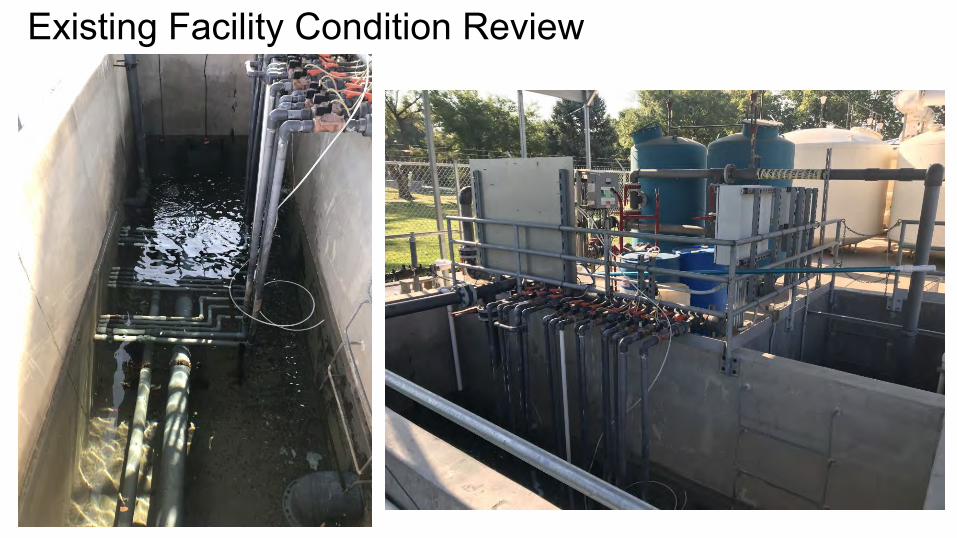
Existing Facility Condition Review
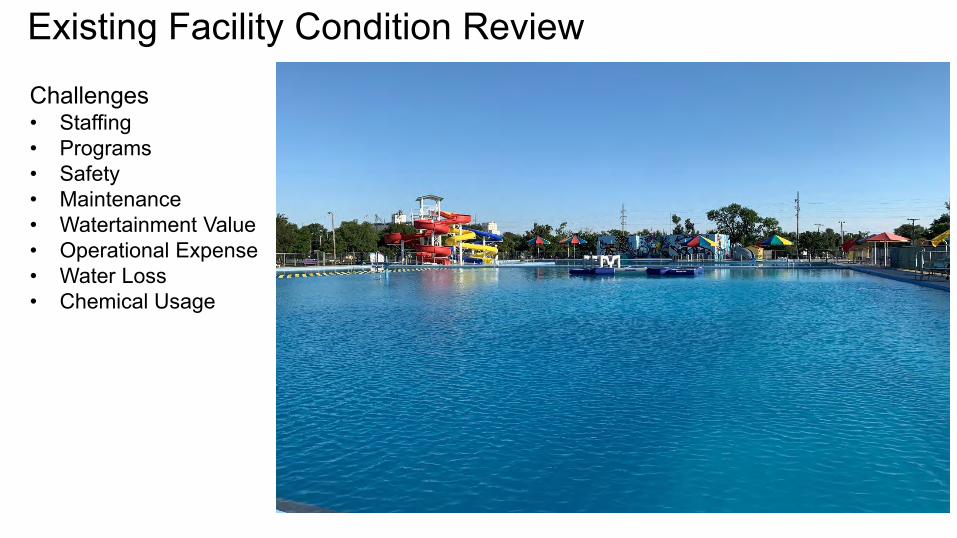
Challenges• Staffing• Programs• Safety• Maintenance• Watertainment Value• Operational Expense• Water Loss• Chemical Usage
Existing Facility Condition Review
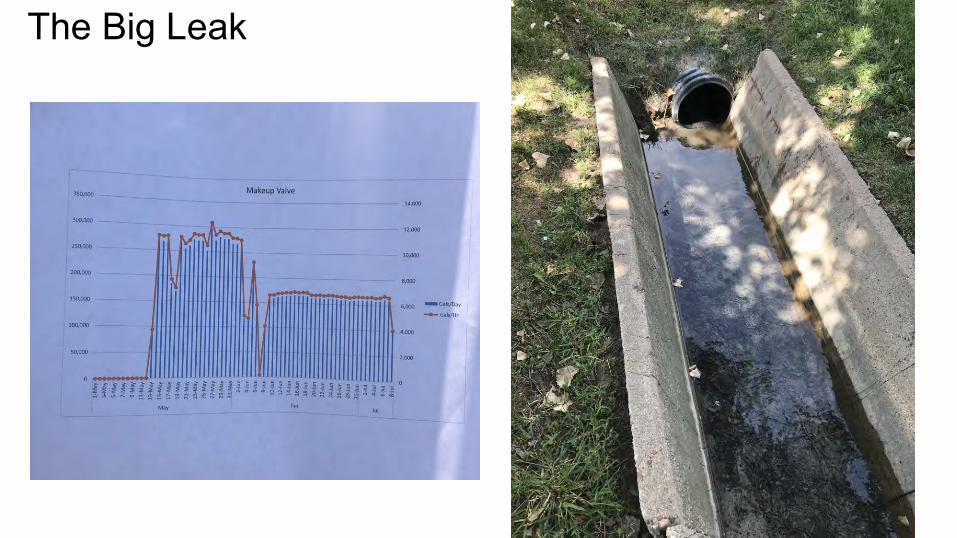
The Big Leak
The Big Leak
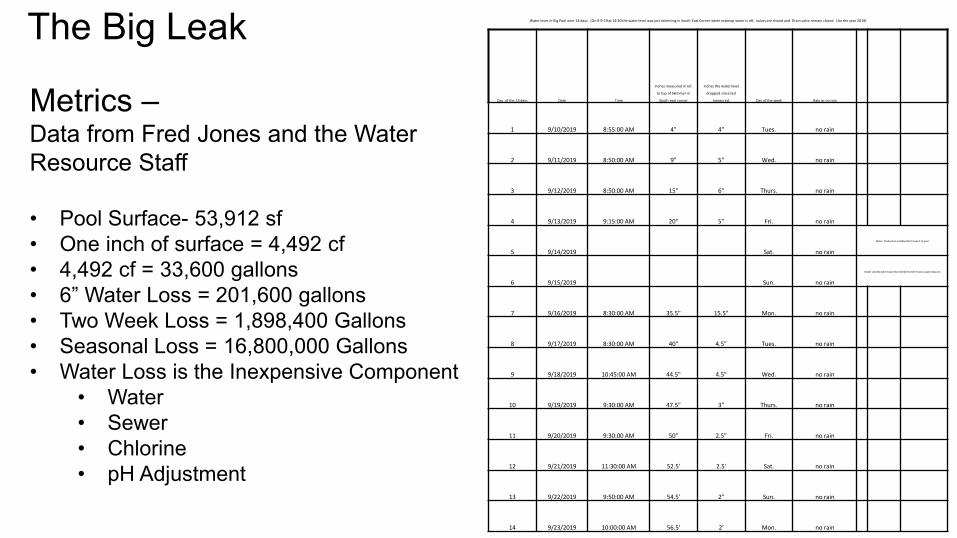
Metrics –Data from Fred Jones and the Water Resource Staff
• Pool Surface- 53,912 sf• One inch of surface = 4,492 cf• 4,492 cf = 33,600 gallons• 6” Water Loss = 201,600 gallons• Two Week Loss = 1,898,400 Gallons• Seasonal Loss = 16,800,000 Gallons• Water Loss is the Inexpensive Component
• Water• Sewer• Chlorine• pH Adjustment
Water lever in Big Pool over 14 days. (On 9-9-19 at 14:30 the water level was just skimming in South East Corner when makeup water is off, valves are closed and Drain valve remain closed. (for the year 2019)
Day of the 14 days Date Time
Inches measured in ref.
to top of Skimmer in
South east corner
Inches the water level
dropped since last
measured. Day of the week Rain or no rain
1 9/10/2019 8:55:00 AM 4" 4" Tues. no rain
2 9/11/2019 8:50:00 AM 9" 5" Wed. no rain
3 9/12/2019 8:50:00 AM 15" 6" Thurs. no rain
4 9/13/2019 9:15:00 AM 20" 5" Fri. no rain
5 9/14/2019 Sat. no rain
Water Production standby didn't make it to pool.
6 9/15/2019 Sun. no rain
Water standby went to pool but relized he didn't have a tape measure.
7 9/16/2019 8:30:00 AM 35.5" 15.5" Mon. no rain
8 9/17/2019 8:30:00 AM 40" 4.5" Tues. no rain
9 9/18/2019 10:45:00 AM 44.5" 4.5" Wed. no rain
10 9/19/2019 9:30:00 AM 47.5" 3" Thurs. no rain
11 9/20/2019 9:30:00 AM 50" 2.5" Fri. no rain
12 9/21/2019 11:30:00 AM 52.5' 2.5' Sat. no rain
13 9/22/2019 9:50:00 AM 54.5' 2" Sun. no rain
14 9/23/2019 10:00:00 AM 56.5' 2' Mon. no rain
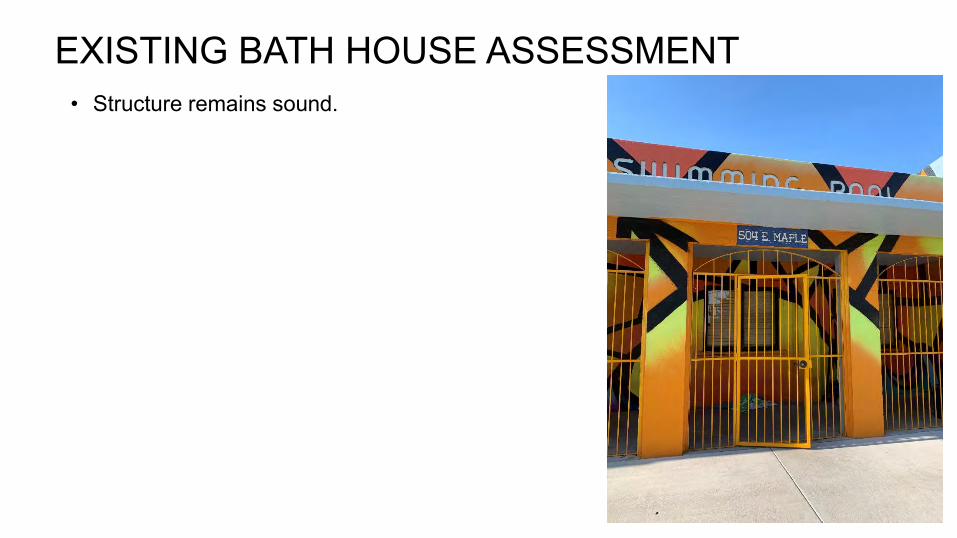
EXISTING BATH HOUSE ASSESSMENT• Structure remains sound.

EXISTING BATH HOUSE ASSESSMENT• Structure remains sound.• Changing facilities are
antiquated.

EXISTING BATH HOUSE ASSESSMENT• Structure remains sound.• Changing facilities are
antiquated.• Plumbing fixtures are
inadequate to meet todays code requirements.
• Current water and sewer service is inadequate for the bather load.
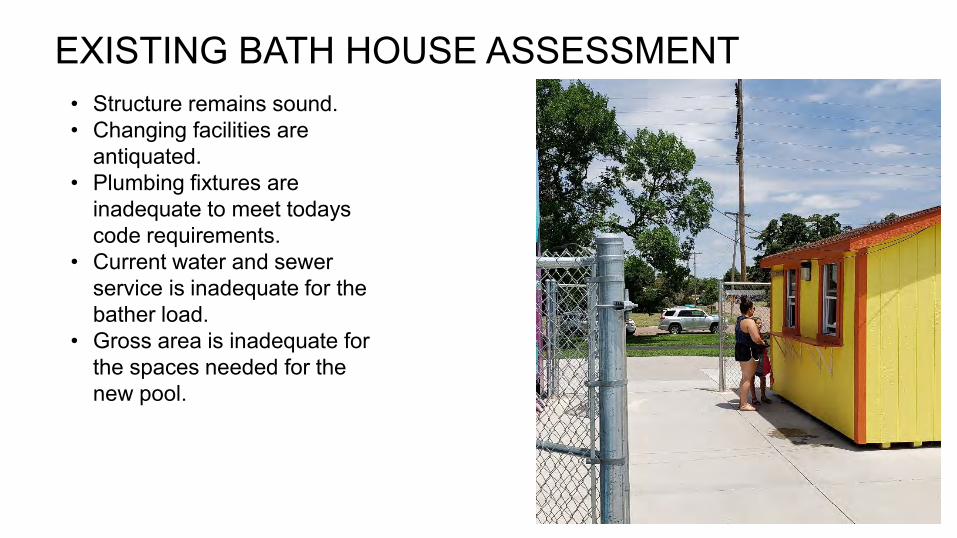
EXISTING BATH HOUSE ASSESSMENT• Structure remains sound.• Changing facilities are
antiquated.• Plumbing fixtures are
inadequate to meet todays code requirements.
• Current water and sewer service is inadequate for the bather load.
• Gross area is inadequate for the spaces needed for the new pool.

EXISTING BATH HOUSE ASSESSMENT
• Structure remains sound.• Changing facilities are
antiquated.• Plumbing fixtures are
inadequate to meet todays code requirements.
• Current water and sewer service is inadequate for the bather load.
• Gross area is inadequate for the spaces needed for the new pool.
• Existing building might be suitable for a multipurpose meeting space with certain changes.
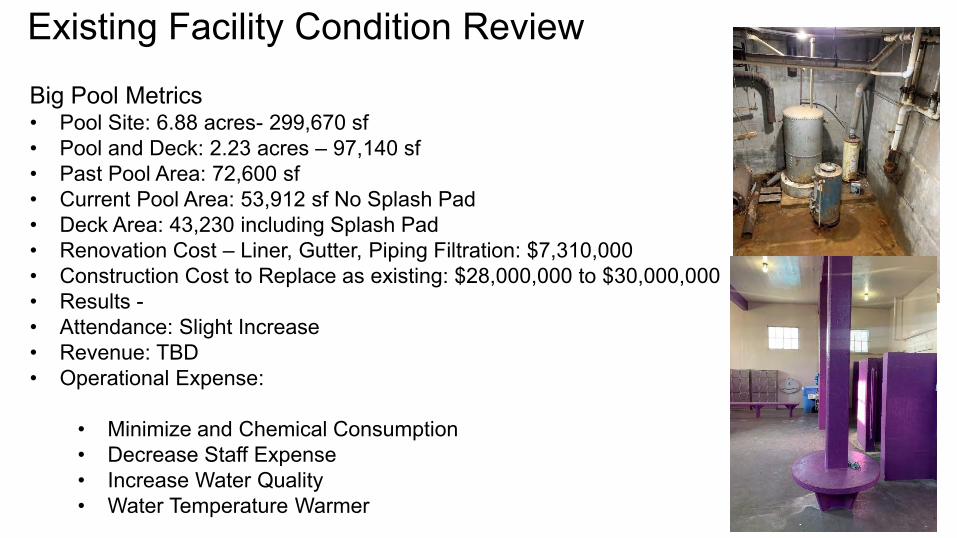
Big Pool Metrics• Pool Site: 6.88 acres- 299,670 sf• Pool and Deck: 2.23 acres – 97,140 sf• Past Pool Area: 72,600 sf• Current Pool Area: 53,912 sf No Splash Pad• Deck Area: 43,230 including Splash Pad• Renovation Cost – Liner, Gutter, Piping Filtration: $7,310,000• Construction Cost to Replace as existing: $28,000,000 to $30,000,000• Results -• Attendance: Slight Increase• Revenue: TBD• Operational Expense:
• Minimize and Chemical Consumption• Decrease Staff Expense• Increase Water Quality• Water Temperature Warmer
Existing Facility Condition Review

• What we know:– Staff Cost increased 77% between 2017
and 2019– Operation supplies increased 274%
between 2017 and 2019– Building Repairs are over $120,000
annually.– Chemical costs are $187,000 annually– Reduced Water/Sewer/Utility – Potential savings of $200,000-$300,000
Preliminary Existing Facility Operational Analysis
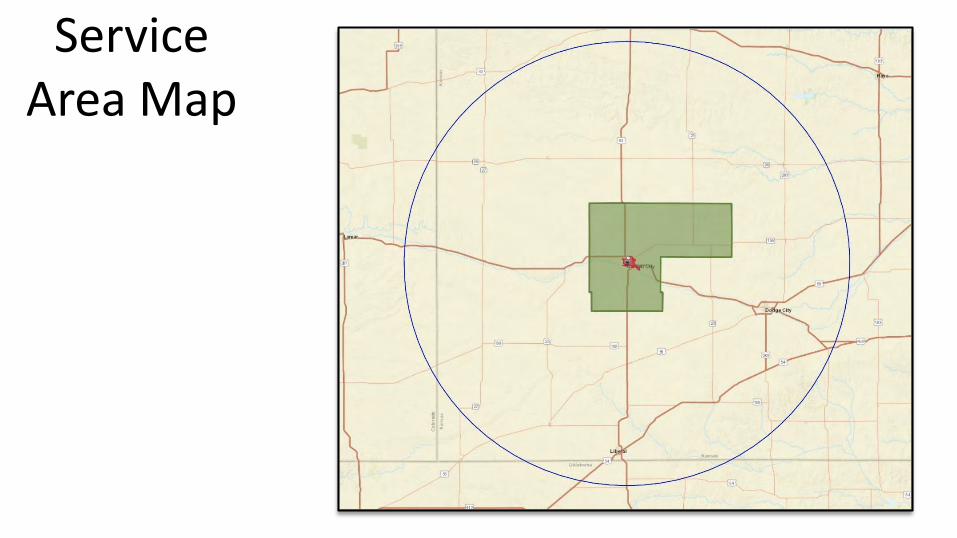
Service Area Map
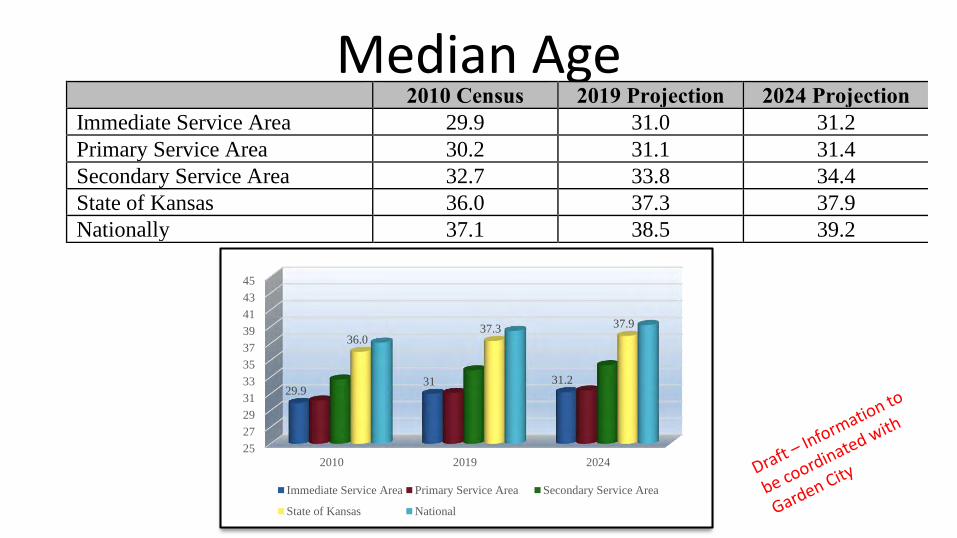
Median Age 2010 Census 2019 Projection 2024 Projection Immediate Service Area 29.9 31.0 31.2
Primary Service Area 30.2 31.1 31.4
Secondary Service Area 32.7 33.8 34.4
State of Kansas 36.0 37.3 37.9
Nationally 37.1 38.5 39.2
25
27
29
31
33
35
37
39
41
43
45
2010 2019 2024
29.931 31.2
36.037.3 37.9
Immediate Service Area Primary Service Area Secondary Service Area
State of Kansas National
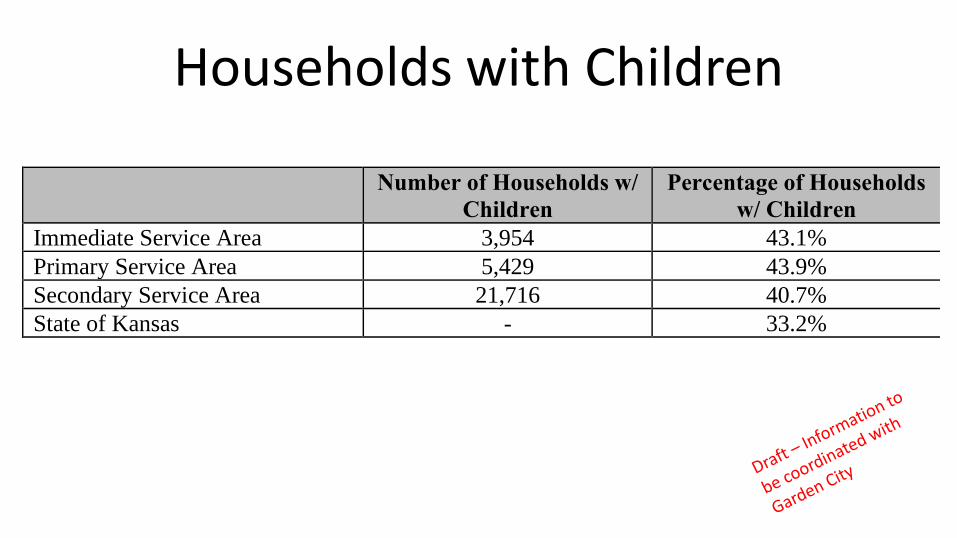
Households with Children
Number of Households w/ Children
Percentage of Households w/ Children
Immediate Service Area 3,954 43.1%
Primary Service Area 5,429 43.9%
Secondary Service Area 21,716 40.7%
State of Kansas - 33.2%
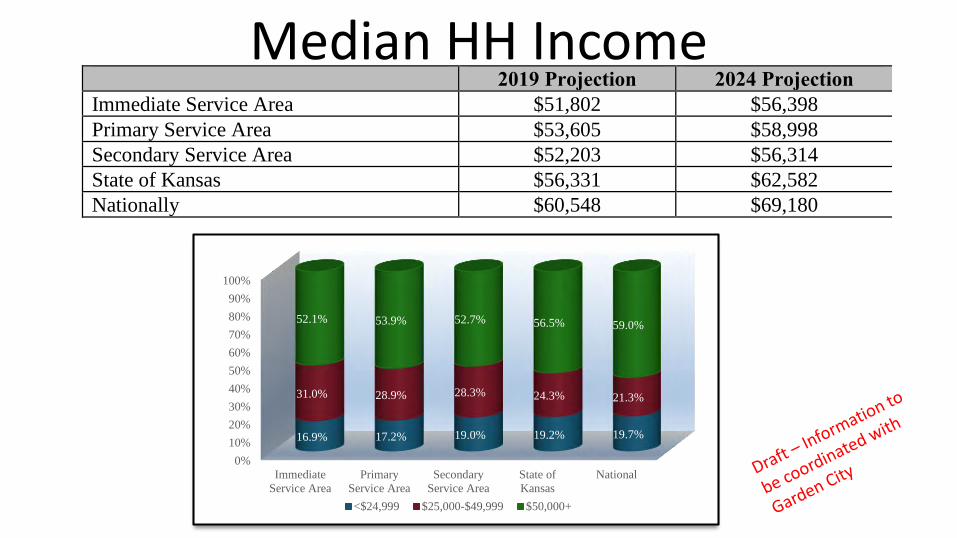
Median HH Income 2019 Projection 2024 Projection Immediate Service Area $51,802 $56,398
Primary Service Area $53,605 $58,998
Secondary Service Area $52,203 $56,314
State of Kansas $56,331 $62,582
Nationally $60,548 $69,180
0%
10%
20%
30%
40%
50%
60%
70%
80%
90%
100%
Immediate
Service Area
Primary
Service Area
Secondary
Service Area
State of
Kansas
National
16.9% 17.2% 19.0% 19.2% 19.7%
31.0% 28.9% 28.3% 24.3% 21.3%
52.1% 53.9% 52.7% 56.5% 59.0%
<$24,999 $25,000-$49,999 $50,000+
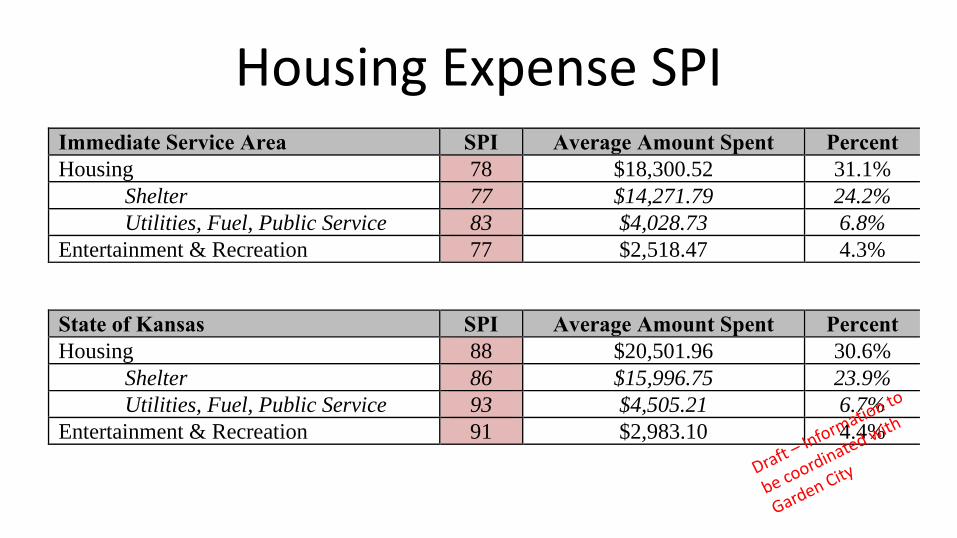
Housing Expense SPIImmediate Service Area SPI Average Amount Spent Percent Housing 78 $18,300.52 31.1%
Shelter 77 $14,271.79 24.2%
Utilities, Fuel, Public Service 83 $4,028.73 6.8%
Entertainment & Recreation 77 $2,518.47 4.3%
State of Kansas SPI Average Amount Spent Percent Housing 88 $20,501.96 30.6%
Shelter 86 $15,996.75 23.9%
Utilities, Fuel, Public Service 93 $4,505.21 6.7%
Entertainment & Recreation 91 $2,983.10 4.4%
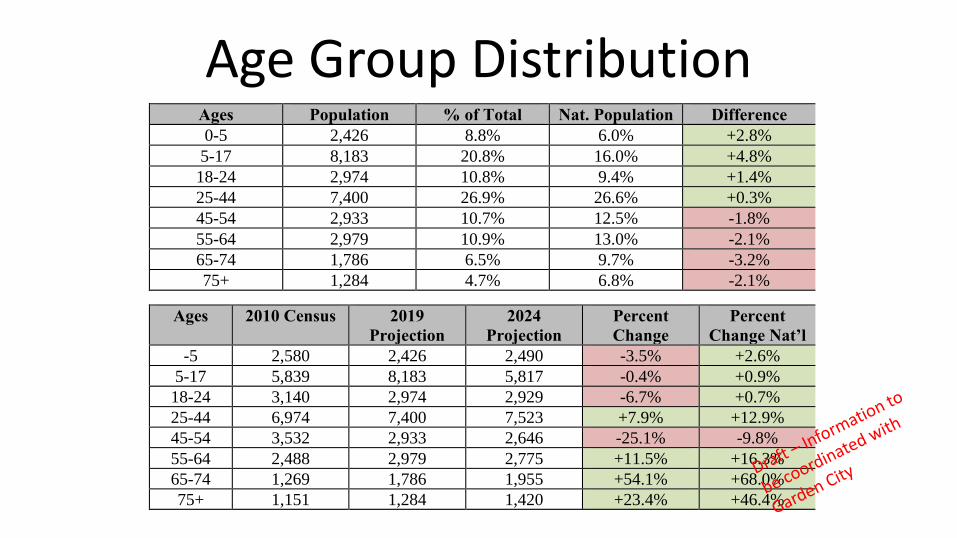
Age Group DistributionAges Population % of Total Nat. Population Difference
0-5 2,426 8.8% 6.0% +2.8%
5-17 8,183 20.8% 16.0% +4.8%
18-24 2,974 10.8% 9.4% +1.4%
25-44 7,400 26.9% 26.6% +0.3%
45-54 2,933 10.7% 12.5% -1.8%
55-64 2,979 10.9% 13.0% -2.1%
65-74 1,786 6.5% 9.7% -3.2%
75+ 1,284 4.7% 6.8% -2.1%
Ages 2010 Census 2019
Projection 2024
Projection Percent Change
Percent Change Nat’l
-5 2,580 2,426 2,490 -3.5% +2.6%
5-17 5,839 8,183 5,817 -0.4% +0.9%
18-24 3,140 2,974 2,929 -6.7% +0.7%
25-44 6,974 7,400 7,523 +7.9% +12.9%
45-54 3,532 2,933 2,646 -25.1% -9.8%
55-64 2,488 2,979 2,775 +11.5% +16.3%
65-74 1,269 1,786 1,955 +54.1% +68.0%
75+ 1,151 1,284 1,420 +23.4% +46.4%
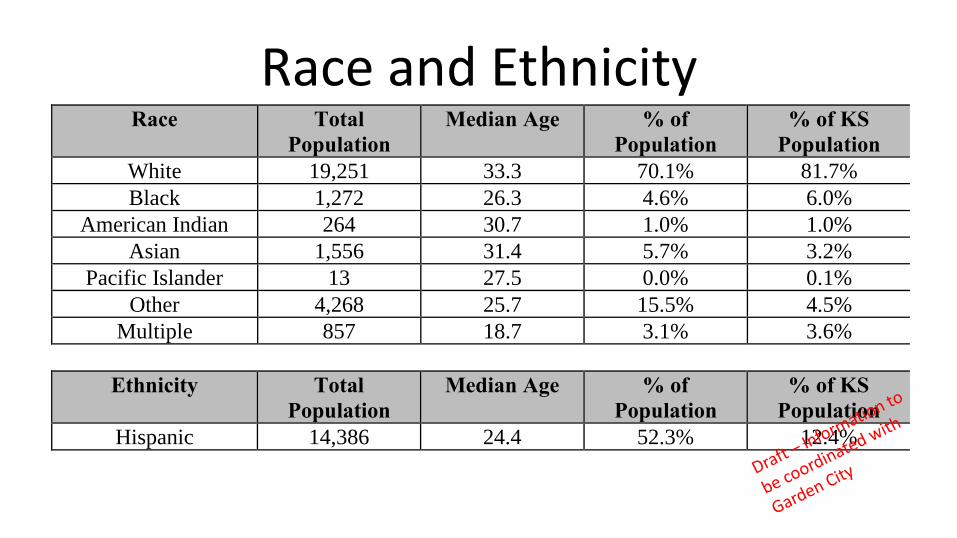
Race and EthnicityRace Total
Population Median Age % of
Population
% of KS Population
White 19,251 33.3 70.1% 81.7%
Black 1,272 26.3 4.6% 6.0%
American Indian 264 30.7 1.0% 1.0%
Asian 1,556 31.4 5.7% 3.2%
Pacific Islander 13 27.5 0.0% 0.1%
Other 4,268 25.7 15.5% 4.5%
Multiple 857 18.7 3.1% 3.6%
Ethnicity Total Population
Median Age % of Population
% of KS Population
Hispanic 14,386 24.4 52.3% 12.4%

Participation Estimate Average 2010
Population 2019
Population 2024
Population Basketball 9.0% 2,106 2,386 2,164
Bicycle Riding 13.9% 3,273 3,709 3,364
Exercise Walking 36.3% 8,526 9,659 8,761
Pickleball 2.2% 528 598 542
Pilates 1.9% 438 496 450
Running/Jogging 15.5% 3,647 4,132 3,748
Swimming 16.2% 3,808 4,314 3,913
Volleyball 3.9% 914 1,035 939
Yoga 10.1% 2,359 2,672 2,424
Did Not Participate 22.6% 5,308 6,014 5,455
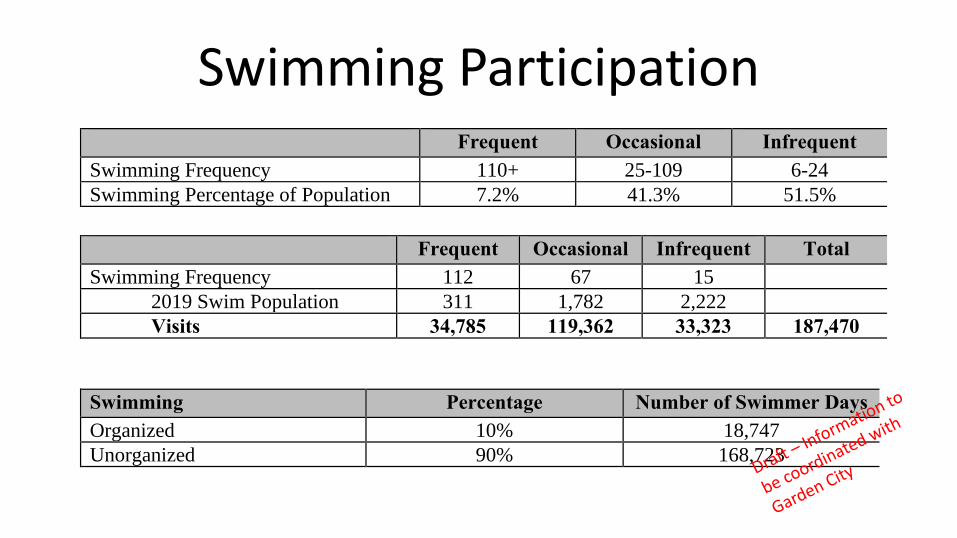
Swimming Participation Frequent Occasional Infrequent
Swimming Frequency 110+ 25-109 6-24
Swimming Percentage of Population 7.2% 41.3% 51.5%
Frequent Occasional Infrequent Total Swimming Frequency 112 67 15
2019 Swim Population 311 1,782 2,222
Visits 34,785 119,362 33,323 187,470
Swimming Percentage Number of Swimmer Days Organized 10% 18,747
Unorganized 90% 168,723
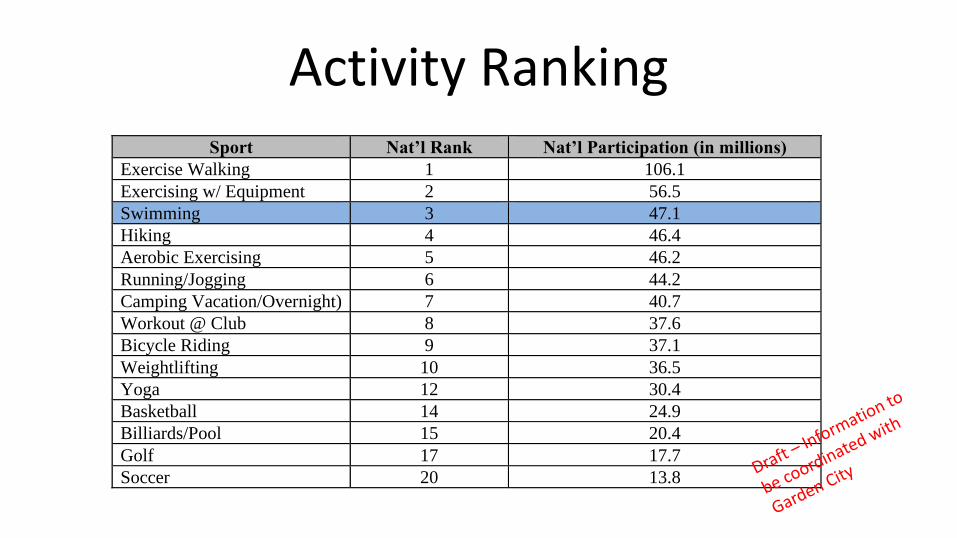
Activity RankingSport Nat’l Rank Nat’l Participation (in millions)
Exercise Walking 1 106.1
Exercising w/ Equipment 2 56.5
Swimming 3 47.1
Hiking 4 46.4
Aerobic Exercising 5 46.2
Running/Jogging 6 44.2
Camping Vacation/Overnight) 7 40.7
Workout @ Club 8 37.6
Bicycle Riding 9 37.1
Weightlifting 10 36.5
Yoga 12 30.4
Basketball 14 24.9
Billiards/Pool 15 20.4
Golf 17 17.7
Soccer 20 13.8
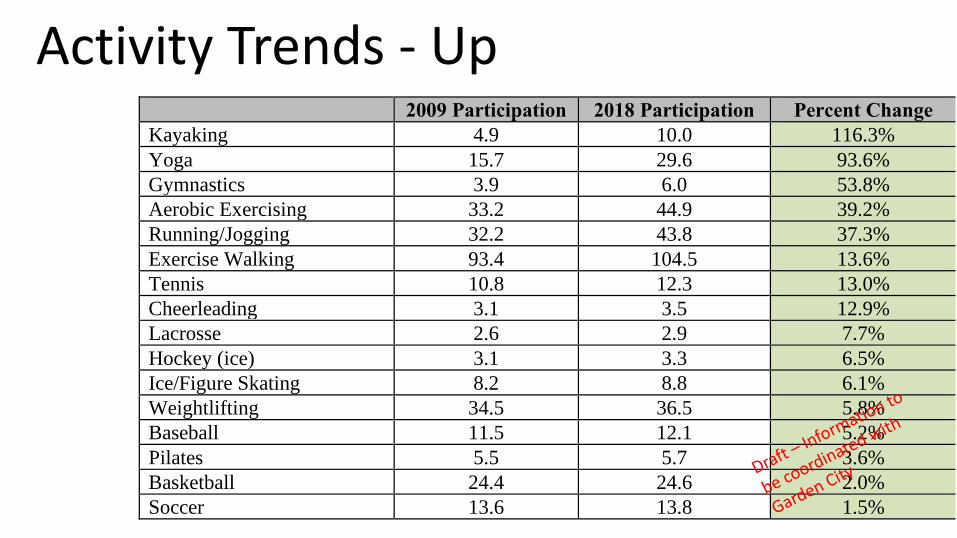
Activity Trends - Up 2009 Participation 2018 Participation Percent Change
Kayaking 4.9 10.0 116.3%
Yoga 15.7 29.6 93.6%
Gymnastics 3.9 6.0 53.8%
Aerobic Exercising 33.2 44.9 39.2%
Running/Jogging 32.2 43.8 37.3%
Exercise Walking 93.4 104.5 13.6%
Tennis 10.8 12.3 13.0%
Cheerleading 3.1 3.5 12.9%
Lacrosse 2.6 2.9 7.7%
Hockey (ice) 3.1 3.3 6.5%
Ice/Figure Skating 8.2 8.8 6.1%
Weightlifting 34.5 36.5 5.8%
Baseball 11.5 12.1 5.2%
Pilates 5.5 5.7 3.6%
Basketball 24.4 24.6 2.0%
Soccer 13.6 13.8 1.5%
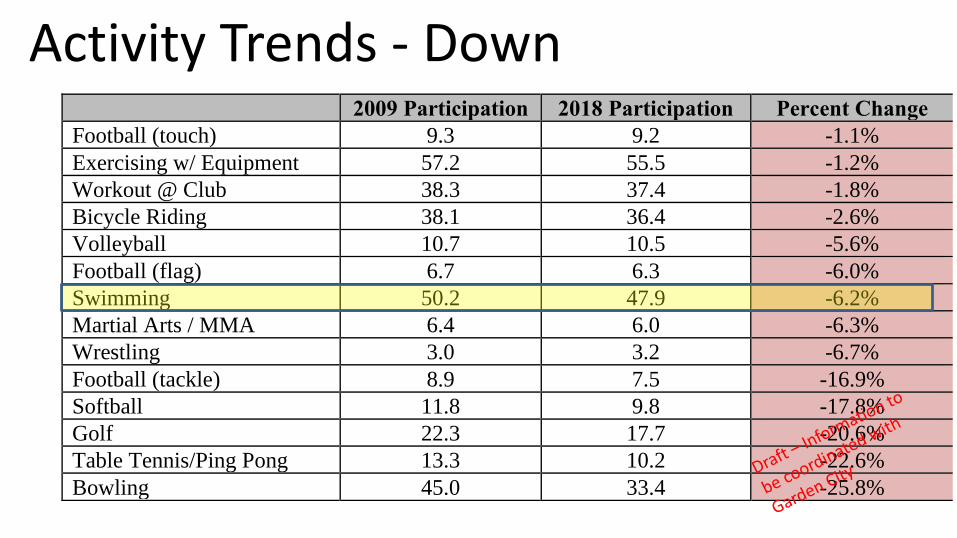
Activity Trends - Down 2009 Participation 2018 Participation Percent Change
Football (touch) 9.3 9.2 -1.1%
Exercising w/ Equipment 57.2 55.5 -1.2%
Workout @ Club 38.3 37.4 -1.8%
Bicycle Riding 38.1 36.4 -2.6%
Volleyball 10.7 10.5 -5.6%
Football (flag) 6.7 6.3 -6.0%
Swimming 50.2 47.9 -6.2%
Martial Arts / MMA 6.4 6.0 -6.3%
Wrestling 3.0 3.2 -6.7%
Football (tackle) 8.9 7.5 -16.9%
Softball 11.8 9.8 -17.8%
Golf 22.3 17.7 -20.6%
Table Tennis/Ping Pong 13.3 10.2 -22.6%
Bowling 45.0 33.4 -25.8%
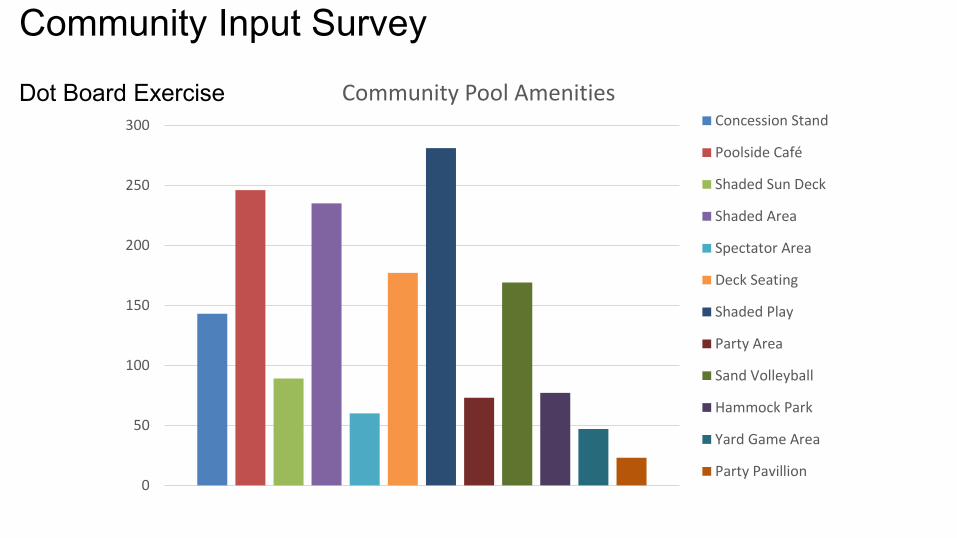
Community Input Survey
Dot Board Exercise
0
50
100
150
200
250
300
Community Pool AmenitiesConcession Stand
Poolside Café
Shaded Sun Deck
Shaded Area
Spectator Area
Deck Seating
Shaded Play
Party Area
Sand Volleyball
Hammock Park
Yard Game Area
Party Pavillion
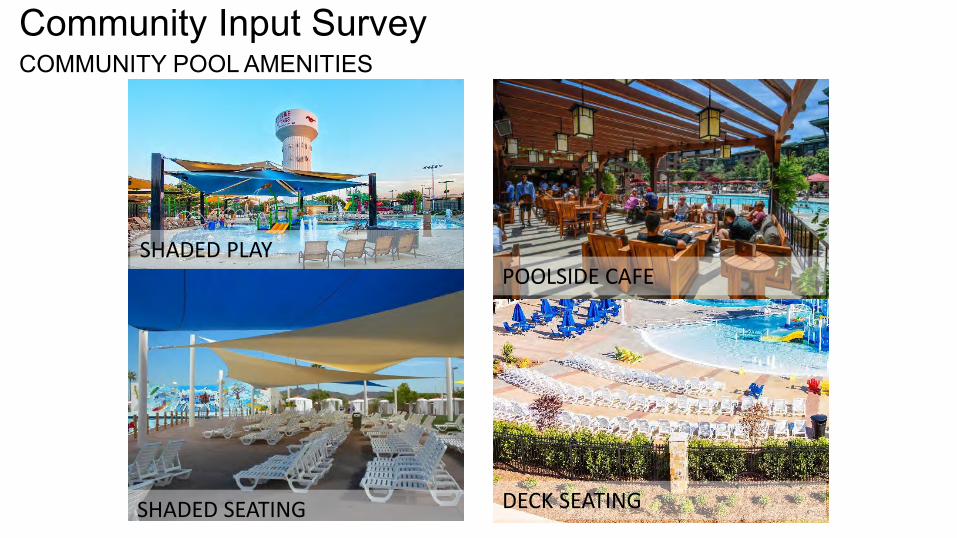
Community Input SurveyCOMMUNITY POOL AMENITIES
SHADED PLAYPOOLSIDE CAFE
DECK SEATINGSHADED SEATING
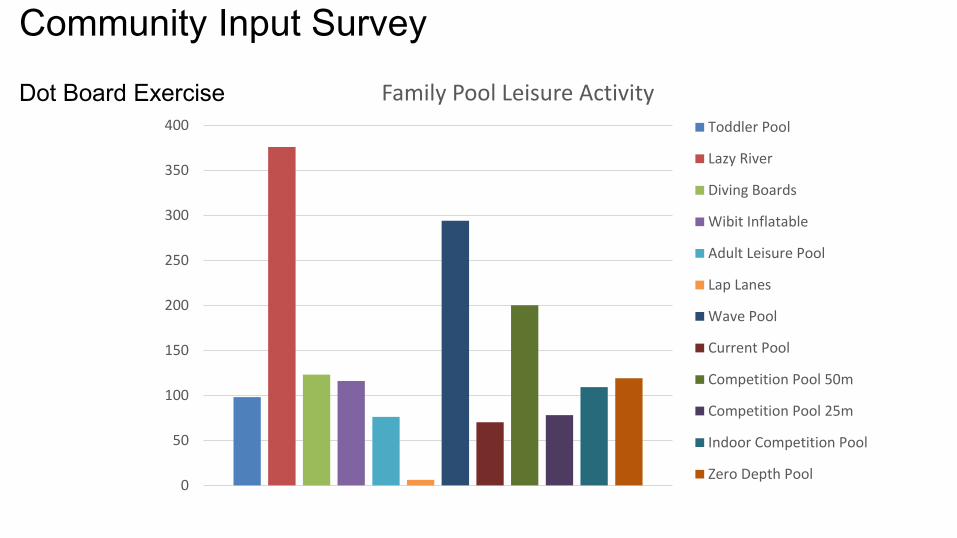
Community Input Survey
Dot Board Exercise
0
50
100
150
200
250
300
350
400
Family Pool Leisure Activity
Toddler Pool
Lazy River
Diving Boards
Wibit Inflatable
Adult Leisure Pool
Lap Lanes
Wave Pool
Current Pool
Competition Pool 50m
Competition Pool 25m
Indoor Competition Pool
Zero Depth Pool
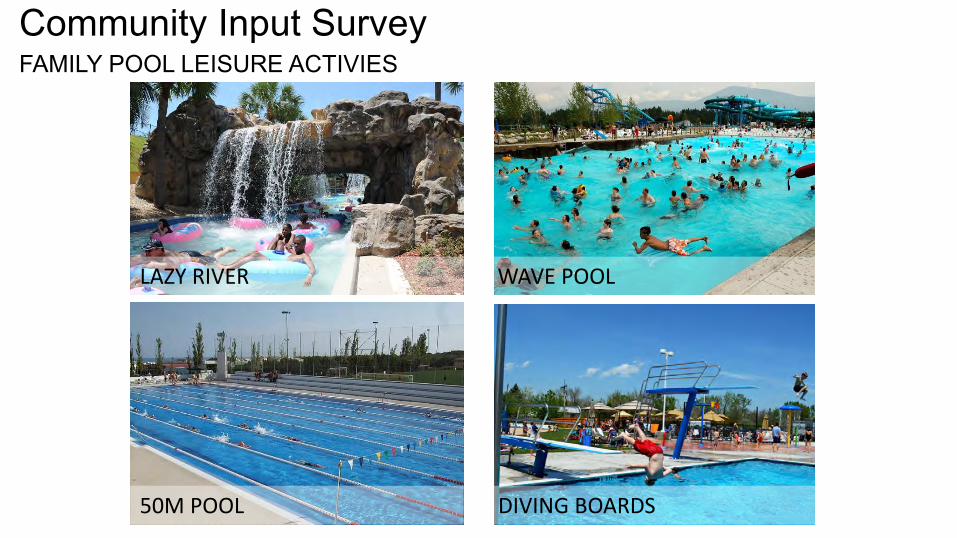
Community Input SurveyFAMILY POOL LEISURE ACTIVIES
LAZY RIVER WAVE POOL
50M POOL DIVING BOARDS
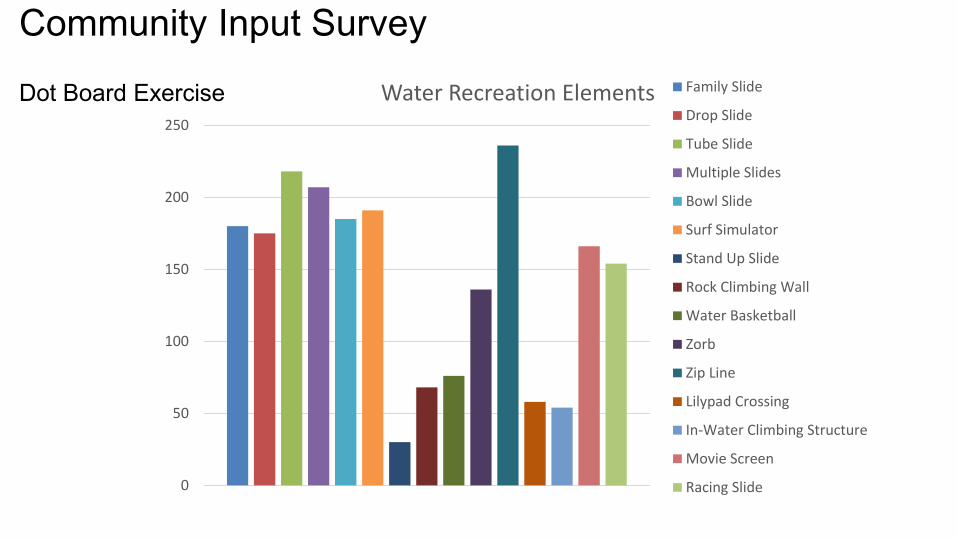
Community Input Survey
Dot Board Exercise
0
50
100
150
200
250
Water Recreation Elements Family Slide
Drop Slide
Tube Slide
Multiple Slides
Bowl Slide
Surf Simulator
Stand Up Slide
Rock Climbing Wall
Water Basketball
Zorb
Zip Line
Lilypad Crossing
In-Water Climbing Structure
Movie Screen
Racing Slide
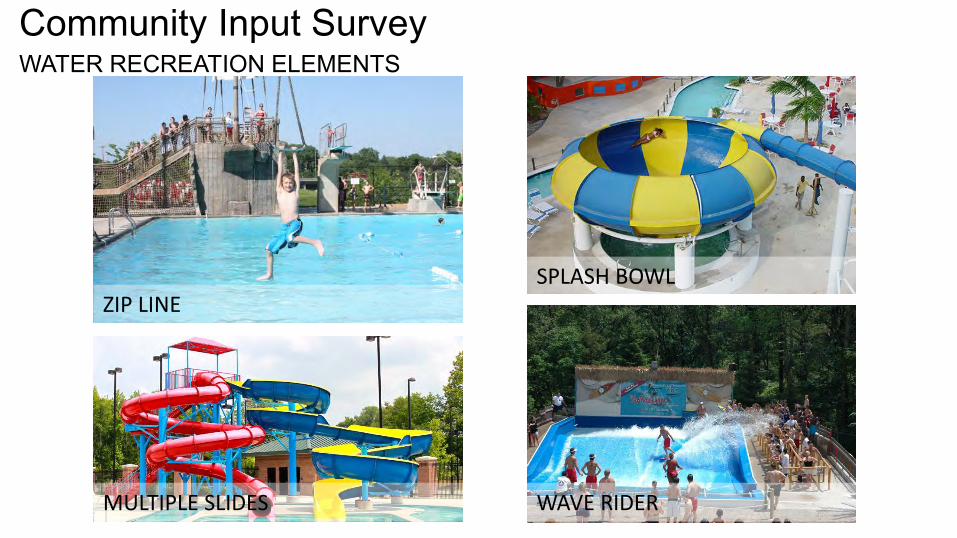
Community Input SurveyWATER RECREATION ELEMENTS
ZIP LINE
MULTIPLE SLIDES WAVE RIDER
SPLASH BOWL

Community Input Survey
Dot Board Exercise
0
50
100
150
200
250
300
350
Splash Elements
Themed Area
Splash Pad
Splash Pad Playground
Splash Pad Pool
Dump Bucket

Community Input SurveySPLASH ELEMENTS
THEMED AREA
DUMP BUCKET
SPLASH PAD POOL
SPLASH PAD PLAYGROUND
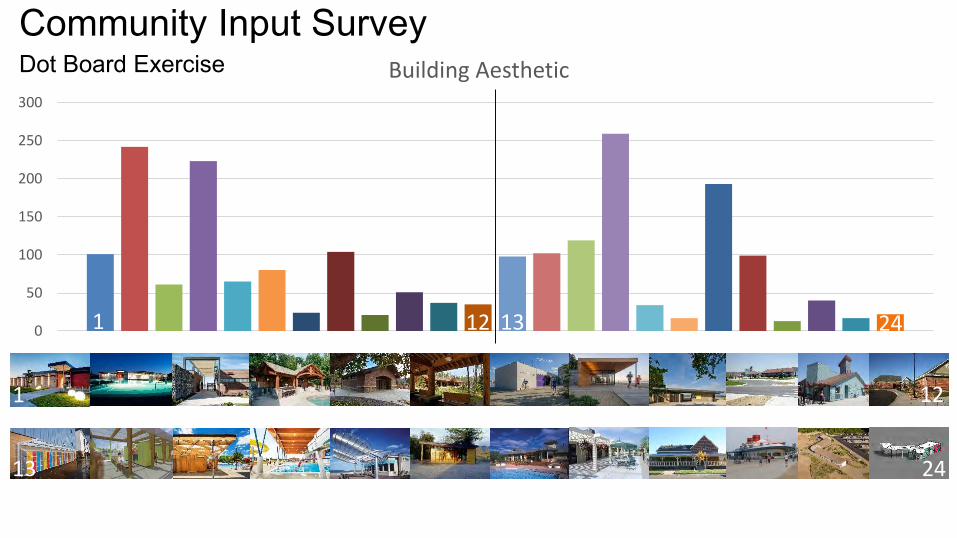
Community Input SurveyDot Board Exercise
0
50
100
150
200
250
300
Building Aesthetic
1
24
12
1 12
13
2413
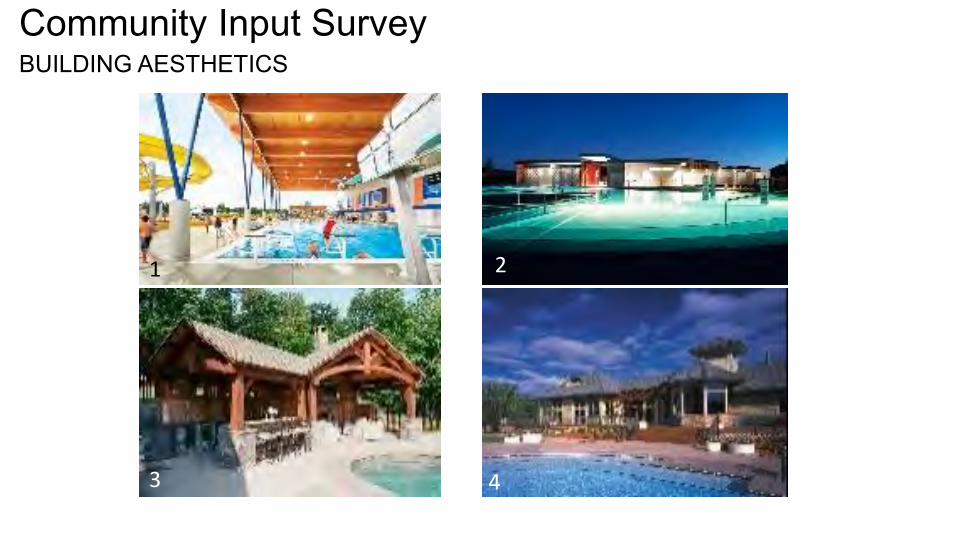
Community Input SurveyBUILDING AESTHETICS
1 2
3 4
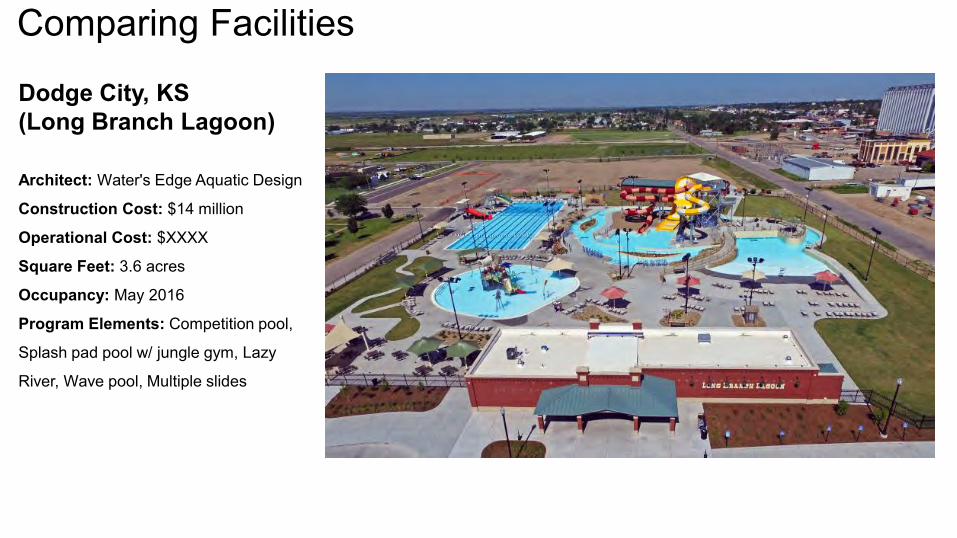
Comparing Facilities
Dodge City, KS (Long Branch Lagoon)
Architect: Water's Edge Aquatic Design
Construction Cost: $14 million
Operational Cost: $XXXX
Square Feet: 3.6 acres
Occupancy: May 2016
Program Elements: Competition pool,
Splash pad pool w/ jungle gym, Lazy
River, Wave pool, Multiple slides
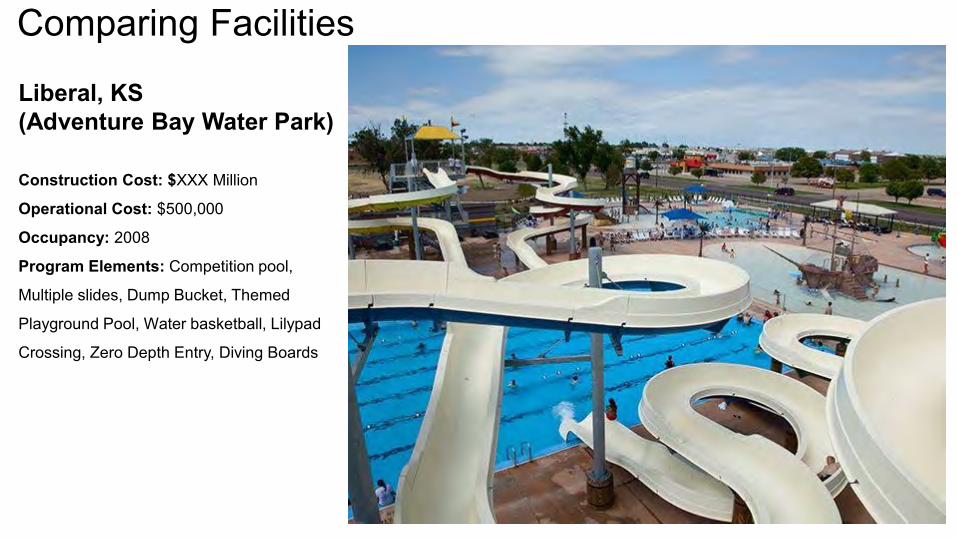
Comparing Facilities
Liberal, KS (Adventure Bay Water Park)
Construction Cost: $XXX Million
Operational Cost: $500,000
Occupancy: 2008
Program Elements: Competition pool,
Multiple slides, Dump Bucket, Themed
Playground Pool, Water basketball, Lilypad
Crossing, Zero Depth Entry, Diving Boards
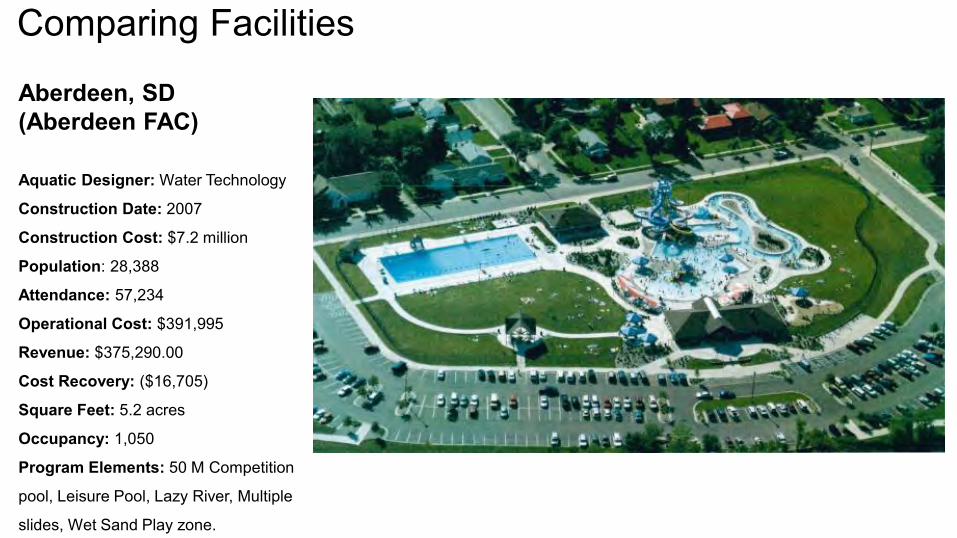
Comparing Facilities
Aberdeen, SD (Aberdeen FAC)
Aquatic Designer: Water Technology
Construction Date: 2007
Construction Cost: $7.2 million
Population: 28,388
Attendance: 57,234
Operational Cost: $391,995
Revenue: $375,290.00
Cost Recovery: ($16,705)
Square Feet: 5.2 acres
Occupancy: 1,050
Program Elements: 50 M Competition
pool, Leisure Pool, Lazy River, Multiple
slides, Wet Sand Play zone.
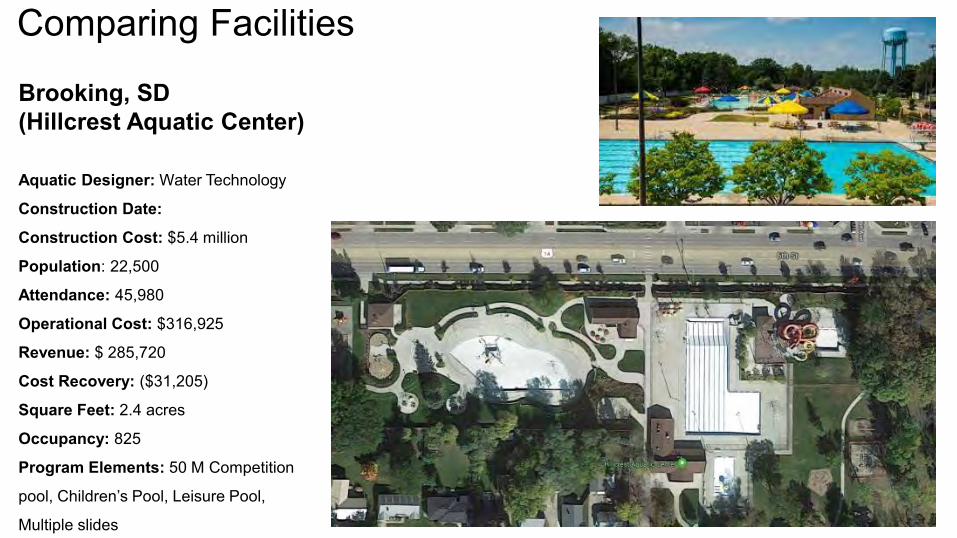
Comparing Facilities
Brooking, SD (Hillcrest Aquatic Center)
Aquatic Designer: Water Technology
Construction Date:
Construction Cost: $5.4 million
Population: 22,500
Attendance: 45,980
Operational Cost: $316,925
Revenue: $ 285,720
Cost Recovery: ($31,205)
Square Feet: 2.4 acres
Occupancy: 825
Program Elements: 50 M Competition
pool, Children’s Pool, Leisure Pool,
Multiple slides
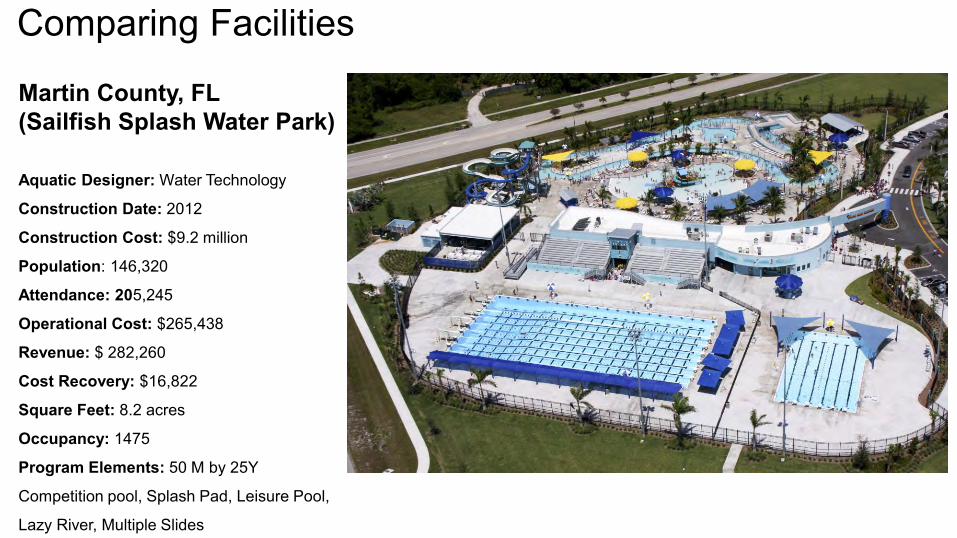
Comparing Facilities
Martin County, FL(Sailfish Splash Water Park)
Aquatic Designer: Water Technology
Construction Date: 2012
Construction Cost: $9.2 million
Population: 146,320
Attendance: 205,245
Operational Cost: $265,438
Revenue: $ 282,260
Cost Recovery: $16,822
Square Feet: 8.2 acres
Occupancy: 1475
Program Elements: 50 M by 25Y
Competition pool, Splash Pad, Leisure Pool,
Lazy River, Multiple Slides
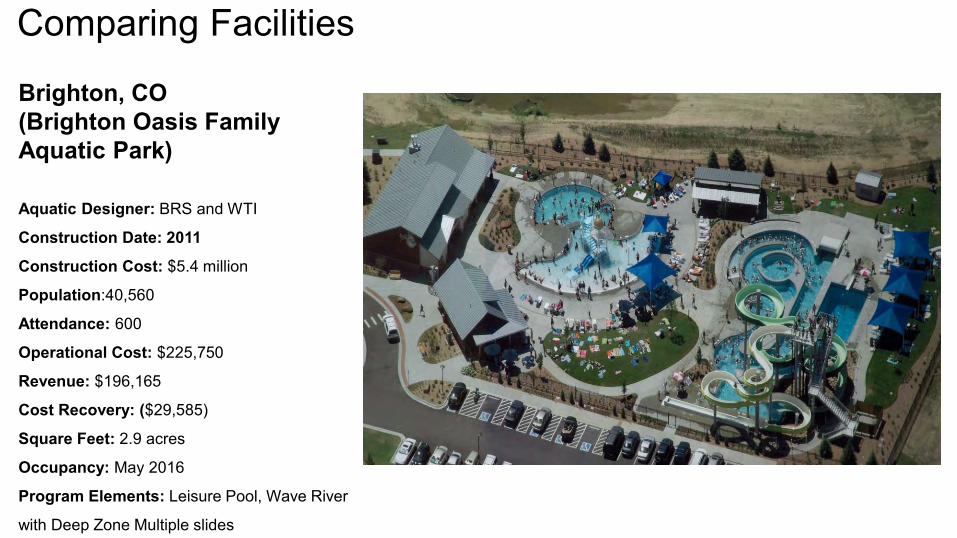
Comparing Facilities
Brighton, CO(Brighton Oasis Family Aquatic Park)
Aquatic Designer: BRS and WTI
Construction Date: 2011
Construction Cost: $5.4 million
Population:40,560
Attendance: 600
Operational Cost: $225,750
Revenue: $196,165
Cost Recovery: ($29,585)
Square Feet: 2.9 acres
Occupancy: May 2016
Program Elements: Leisure Pool, Wave River
with Deep Zone Multiple slides
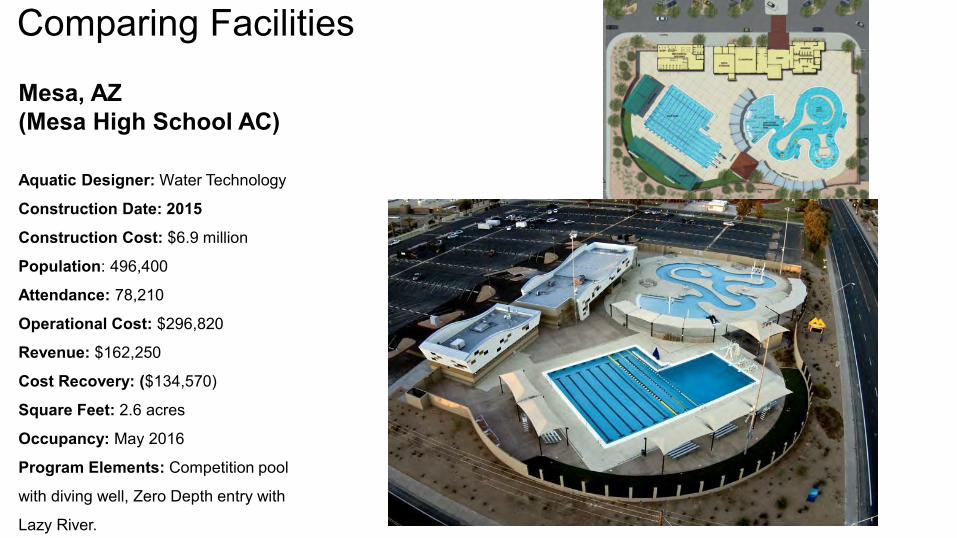
Comparing Facilities
Mesa, AZ(Mesa High School AC)
Aquatic Designer: Water Technology
Construction Date: 2015
Construction Cost: $6.9 million
Population: 496,400
Attendance: 78,210
Operational Cost: $296,820
Revenue: $162,250
Cost Recovery: ($134,570)
Square Feet: 2.6 acres
Occupancy: May 2016
Program Elements: Competition pool
with diving well, Zero Depth entry with
Lazy River.

VISION + KEYS TO SUCCESS

The goal of this activity is to get to the BIG PICTURE, bringing the future to present to define a path forward.
THE VISION FOR THE FUTURE OF GARDEN CITY AQUATICS
Activity #1: “What do I really want?”
Describe what you see as the ideal in your mind’s eye, using a
statement that begins with “I see…”
When the roadblocks appear in the future, they are more easily recognized and effectively addressed.
REMOVING ROADBLOCKS
Activity #2: “Roadblocks + Countermeasures”
1. List all the potential roadblocks to success (individual).
When the roadblocks appear in the future, they are more easily recognized and effectively addressed.
REMOVING ROADBLOCKS
Activity #2: “Roadblocks + Countermeasures”
1. List all the potential roadblocks to success (individual).
2. List the countermeasure to each roadblock (group).

Next Meeting: November 19th