gao-16-494, it dashboard: agencies need to fully consider ... · highlights of gao-16-494, a report...
TRANSCRIPT

IT DASHBOARD
Agencies Need to Fully Consider Risks When Rating Their Major Investments
Report to Congressional Requesters
June 2016
GAO-16-494
United States Government Accountability Office

United States Government Accountability Office
Highlights of GAO-16-494, a report to congressional requesters
June 2016
IT DASHBOARD Agencies Need to Fully Consider Risks When Rating Their Major Investments
Why GAO Did This Study Although the government spends more than $80 billion in information technology (IT) annually, many of the investments have failed or have been troubled. In December 2014, provisions commonly referred to as the Federal Information Technology Acquisition Reform Act (FITARA) were enacted. Among other things, FITARA states that OMB shall make available to the public a list of each major IT investment including data on cost, schedule, and performance. OMB does so via the Federal IT Dashboard—its public website that reports on major IT investments, including ratings from CIOs which should reflect the level of risk facing an investment.
GAO’s objectives were to (1) describe agencies’ processes for determining CIO risk ratings for major federal IT investments primarily in development and (2) assess the risk of federal IT investments and analyze any differences with the investments’ CIO risk ratings. To do so, GAO selected major IT investments with at least 80 percent of their fiscal year 2015 budget allocated to development (resulting in 95 investments across 15 agencies) and compared CIO rating processes to OMB guidance. GAO also analyzed data on those investments to create its own risk assessments.
What GAO Recommends GAO is making 25 recommendations to 15 agencies to improve the quality and frequency of CIO ratings. Twelve agencies generally agreed with or did not comment on the recommendations and three agencies disagreed, stating their CIO ratings were adequate. GAO continues to believe these recommendations are valid.
What GAO Found Agencies determined investments’ Chief Information Officer (CIO) ratings using a variety of processes, which included the Office of Management and Budget’s (OMB) six suggested factors (including risk management, requirements management, and historical performance). Specifically, all 17 selected agencies incorporated at least two of OMB’s factors into their risk rating processes and 9 used all of the factors. However, agencies’ interpretations of these factors varied. For example, most agencies considered active risks, such as funding cuts or staffing changes, when rating investments, but others only evaluated compliance with the agency’s risk management processes. Further, 13 agencies required monthly updates to CIO ratings as does OMB (as of June 2015), 1 agency scheduled its reviews based on risk, and 3 agencies required updates less often than on a monthly basis.
GAO’s assessments generally showed more risk than the associated CIO ratings. In particular, of the 95 investments assessed, GAO’s assessments matched the CIO ratings 22 times, showed more risk 60 times, and showed less risk 13 times (see graphic).
Comparison of Selected Investments’ Chief Information Officer Ratings to GAO Assessments
Aside from the inherent judgmental nature of risk ratings, three issues contributed to these differences:
• Forty of the 95 CIO ratings were not updated during the month GAO reviewed, which led to more differences between GAO’s assessments and the CIOs’ ratings. This underscores the importance of frequent rating updates, which help to ensure that the information on the Dashboard is timely and accurately reflects recent changes to investment status.
• Three agencies’ rating processes span longer than 1 month. Longer processes mean that CIO ratings are based upon older data and may not reflect the current level of investment risk.
• Seven agencies’ rating processes did not focus on active risks. According to OMB’s guidance, CIO ratings should reflect the CIO’s assessment of the risk and the investment’s ability to accomplish its goals. CIO ratings that do not incorporate active risks increase the chance that ratings overstate the likelihood of investment success.
View GAO-16-494. For more information, contact David A. Powner at (202) 512-9286 or [email protected].

Page i GAO-16-494 IT Dashboard
Letter 1
Background 3 Agencies Use a Variety of Processes to Determine Investments’
CIO Ratings 8 Our Assessments Reflected More Risk than Most Selected
Investments’ CIO Ratings 13 Conclusions 26 Recommendations for Executive Action 27 Agency Comments and Our Evaluation 28
Appendix I Objectives, Scope, and Methodology 34
Appendix II Selected Agencies’ CIO Rating Processes 39
Appendix III Agencies and Investments Selected for Review 46
Appendix IV Comments from the Department of Commerce 50
Appendix V Comments from the Department of Defense 52
Appendix VI Comments from the Department of Education 54
Appendix VII Comments from the Department of Energy 56
Appendix VIII Comments from the Department of Health and Human Services 58
Contents

Page ii GAO-16-494 IT Dashboard
Appendix IX Comments from the Department of Homeland Security 60
Appendix X Comments from the Department of the Interior 62
Appendix XI Comments from the Department of State 63
Appendix XII Comments from the Department of Veterans Affairs 65
Appendix XIII Comments from the Environmental Protection Agency 67
Appendix XIV Comments from the Office of Personnel Management 69
Appendix XV Comments from the Social Security Administration 70
Appendix XVI GAO Contact and Staff Acknowledgments 73
Tables
Table 1: Investment Evaluation Factors Identified by the Office of Management and Budget for Assigning Chief Information Officer Ratings 5
Table 2: Use of the Office of Management and Budget’s Suggested Factors by Selected Agencies’ Chief Information Officer Rating Processes 9
Table 3: Frequency of Dashboard Updates, as Called For by Selected Agencies’ Processes, as of January 2016 12
Table 4: Comparison of GAO’s Assessments to April 2015 Chief Information Officer Ratings for the Selected Investments 15

Page iii GAO-16-494 IT Dashboard
Table 5: Selected Investments for Which GAO’s Assessment Reflected Less Risk than the April 2015 Chief Information Officer (CIO) Ratings 16
Table 6: Selected Investments for Which GAO’s Assessment Reflected the Same Risk as the April 2015 Chief Information Officer (CIO) Ratings 18
Table 7: Selected Investments for Which GAO’s Assessment Reflected More Risk than the April 2015 Chief Information Officer (CIO) Ratings 19
Table 8: Causes of Differences between the Selected Investments’ Chief Information Officer (CIO) Rating and Our Assessment 23
Table 9: Number of Investments That Did Not Update Chief Information Officer (CIO) Ratings in April 2015 24
Table 10: Example of Risk Exposure Scores Resulting from Agency-Assigned Probability and Impact Values 36
Table 11: Risk Exposures and Associated Weights 36 Table 12: Range of Weighted Averages and Corresponding Color 36 Table 13: Example of Probability, Impact, Exposures, and
Grading, based on the Evaluation of Risks for a Generic Investment 37
Table 14: Details of the Chief Information Officer (CIO) Rating Process Reported by Selected Agencies 39
Table 15: Agencies and Investments Selected for Review, Associated Chief Information Officer (CIO) Ratings, and Our Assessments 46
Figure
Figure 1: Comparison of Selected Investments’ April 2015 Chief Information Officer Rating to GAO’s Assessments 14

Page iv GAO-16-494 IT Dashboard
Abbreviations Agriculture Department of Agriculture CIO Chief Information Officer Commerce Department of Commerce Defense Department of Defense DHS Department of Homeland Security Education Department of Education Energy Department of Energy EPA Environmental Protection Agency GSA General Services Administration HHS Department of Health and Human Services Interior Department of the Interior IT information technology Labor Department of Labor OMB Office of Management and Budget OPM Office of Personnel Management SSA Social Security Administration State Department of State Transportation Department of Transportation Treasury Department of the Treasury VA Department of Veterans Affairs
This is a work of the U.S. government and is not subject to copyright protection in the United States. The published product may be reproduced and distributed in its entirety without further permission from GAO. However, because this work may contain copyrighted images or other material, permission from the copyright holder may be necessary if you wish to reproduce this material separately.

Page 1 GAO-16-494 IT Dashboard
441 G St. N.W. Washington, DC 20548
June 2, 2016
The Honorable Ron Johnson Chairman Committee on Homeland Security and Governmental Affairs United States Senate
The Honorable Jason Chaffetz Chairman Committee on Oversight and Government Reform House of Representatives
Although there have been numerous initiatives undertaken to better manage the more than $80 billion that is annually invested in information technology (IT), federal IT investments have too frequently failed or incurred cost overruns and schedule slippages while contributing little to mission-related outcomes. As such, we have recently placed improving the management of IT acquisitions and operations on our high risk list.1 This high-risk area highlights several critical IT initiatives in need of additional progress, including the IT Dashboard, and also identified actions needed to make progress.
Recognizing the severity of issues related to government-wide management of IT, in December 2014, the Carl Levin and Howard P. “Buck” McKeon National Defense Authorization Act for Fiscal Year 2015 enacted provisions commonly referred to as the Federal Information Technology Acquisition Reform Act (FITARA).2 Among other things, FITARA states that the Office of Management and Budget (OMB) shall make available to the public a list of each major IT investment including data on cost, schedule, and performance.3 Accordingly, it is vital that OMB provide timely and accurate data on the Federal IT Dashboard—its
1GAO, High Risk Series: An Update, GAO-15-290 (Washington, D.C.: Feb. 11, 2015). 2Carl Levin and Howard P. “Buck” McKeon National Defense Authorization Act for Fiscal Year 2015, Pub. L. No. 113-291, division A, title VIII, subtitle D, 128 Stat. 3292, 3438-3450 (Dec. 19, 2014). 340 U.S.C. § 11302(c)(3)(A).
Letter

Page 2 GAO-16-494 IT Dashboard
public website that reports performance and supporting data for major IT investments.4
Launched in June 2009, the Dashboard is intended to provide transparency for these investments in order to facilitate public monitoring of government operations and accountability for investment performance by the federal Chief Information Officers (CIO) who oversee them. Among other things, agencies are to submit ratings from their CIOs, which, according to OMB’s instructions, should reflect the level of risk facing an investment relative to that investment’s ability to accomplish its goals. In December 2014, FITARA codified the requirement for CIOs to categorize their major IT investment risks in accordance with OMB guidance.5
This report responds to your request to review the CIO ratings on the Dashboard. Specifically, our objectives were to (1) describe agencies’ processes for determining the CIO risk ratings for major IT investments and (2) assess the risk of federal IT investments and analyze any differences with the investments’ CIO risk ratings.
To select the agencies and investments, we reviewed data reported to OMB as part of the federal budget process to identify major investments which planned to spend at least 80 percent of their fiscal year 2015 funding on development, modernization, and enhancement activities. This produced a list of 17 agencies and 107 selected investments.6
To address our first objective, we met with the selected agencies to discuss their CIO rating processes. We collected process documentation, which we used to compare agencies’ processes to OMB’s guidance and determine how the specifics of agencies’ processes varied.
4Major IT investment means a system or an acquisition requiring special management attention because it has significant importance to the mission or function of the government; significant program or policy implications; high executive visibility; high development, operating, or maintenance costs; an unusual funding mechanism; or is defined as major by the agency’s capital planning and investment control process. 540 U.S.C. § 11302(c)(3)(C). 6The selected agencies were: the Departments of Agriculture, Commerce, Defense, Homeland Security, Education, Energy, Health and Human Services, the Interior, Labor, State, Transportation, the Treasury, and Veterans Affairs, as well as the Environmental Protection Agency, the General Services Administration, the Social Security Administration, and the Office of Personnel Management.

Page 3 GAO-16-494 IT Dashboard
To address our second objective, we reviewed the 107 investments, but excluded 12 that were inactive, not in development, lacked a key risk document, or were managed as part of a larger development program. This resulted in 95 investments at 15 agencies.7 We made the decision to review the ratings from April 2015, the month that our audit work began, in order to minimize any influence that our ongoing work could have on the agencies’ processes and resulting ratings. We then interviewed appropriate agency officials and collected March 2015 risk documentation (the data we would expect to be reflected in the April ratings), as well as associated performance data, review board briefings, and relevant reports (e.g., GAO and Inspector General reports). In cases where agencies were unable to provide March documentation, we used documents from the closest available date. We did not consider risks that were introduced after March in these documents. We combined and scored this information based upon industry and government best practices to create our assessments of investments’ risk. We then compared these assessments to agencies’ April 2015 CIO risk ratings. Details of our objectives, scope, and methodology are contained in appendix I.
We conducted this performance audit from April 2015 through June 2016 in accordance with generally accepted government auditing standards. Those standards require that we plan and perform the audit to obtain sufficient, appropriate evidence to provide a reasonable basis for our findings and conclusions based on our audit objectives. We believe that the evidence obtained provides a reasonable basis for our findings and conclusions based on our audit objectives.
OMB plays a key role in overseeing how federal agencies manage their IT investments by working with them to better plan, justify, and determine how to manage them. To provide visibility into the performance of such investments, OMB deployed the IT Dashboard in 2009, which displays federal agencies’ cost, schedule, and performance data for over 770 major federal IT investments at 26 federal agencies, accounting for $42 billion of those agencies’ planned $82 billion in IT spending for fiscal year
7Two agencies, the Department of Labor and the Office of Personnel Management, were removed from our list as all of their investments were deselected.
Background
Page 4 GAO-16-494 IT Dashboard
2017.8 According to OMB, these data are intended to provide a near-real-time perspective on the performance of these investments, as well as a historical perspective. The Dashboard’s data span the period from its June 2009 inception to the present, and are based, in part, on agency assessments of individual investment performance and each agency’s budget request to OMB.9 Further, the public display of these data is intended to allow OMB; other oversight bodies, including Congress; and the general public to hold government agencies accountable for progress and results.
The Dashboard visually presents performance ratings for agencies and for individual investments using metrics that OMB has defined—cost, schedule, and CIO evaluation.
• Cost and schedule ratings. The Dashboard calculates these ratings by determining cost and schedule variances based on agency-submitted data, such as planned versus actual costs or planned versus actual completion dates. The Dashboard then assigns rating colors (red, yellow, green) based on the magnitude of the variances. Specifically, a variance greater than 30 percent is red, a variance between 10 percent and 30 percent is yellow, and a variance less than 10 percent is green.
• CIO ratings. Unlike the cost and schedule ratings, the Dashboard’s “Investment Evaluation by Agency CIO” (also called the CIO rating) is determined by the agency CIO. According to OMB’s instructions, each agency CIO is to assess his or her IT investments against a set of pre-established evaluation factors and then assign a rating of 1 (high
8The 26 federal agencies are the Departments of Agriculture, Commerce, Defense, Education, Energy, Health and Human Services, Homeland Security, Housing and Urban Development, Justice, the Interior, Labor, State, Transportation, the Treasury, Veterans Affairs; the Environmental Protection Agency; the General Services Administration; the National Aeronautics and Space Administration; National Archives and Records Administration; National Science Foundation; Nuclear Regulatory Commission; Office of Personnel Management; Small Business Administration; Social Security Administration; U.S. Agency for International Development; and the U.S. Army Corps of Engineers. 9Each agency’s budget request includes an IT Portfolio report and business cases for each major IT investment. The IT portfolio report lists all of an agency’s IT projects and associated costs. Business cases are prepared for every major IT investment, are used to justify resource requests, and are intended to enable an agency to demonstrate to its own management, as well as to OMB, that a major project is well-planned.
OMB’s Dashboard Is Intended to Provide Visibility into the Performance of Federal IT Investments

Page 5 GAO-16-494 IT Dashboard
risk) to 5 (low risk) based on the CIO’s best judgment of the level of risk facing the investment. OMB suggests six evaluation factors, as shown in table 1.
Table 1: Investment Evaluation Factors Identified by the Office of Management and Budget for Assigning Chief Information Officer Ratings
Evaluation factor Supporting examples Risk management Risk management strategy exists
Risks are well understood by senior leadership Risk log is current and complete Risks are clearly prioritized Mitigation plans are in place to address risks
Requirements management Investment objectives are clear and scope is controlled Requirements are complete, clear, and validated Appropriate stakeholders are involved in requirements definition
Contractor oversight Acquisition strategy is defined and managed via an Integrated Program Team Agency receives key reports, such as earned value reports, current status, and risk logs Agency is providing appropriate management of contractors such that the government is monitoring, controlling, and mitigating the impact of any adverse contract performance
Historical performance No significant deviations from planned cost and schedule Lessons learned and best practices are incorporated and adopted
Human capital Qualified management and execution team for the IT investment and/or contracts supporting the investment Low turnover rate
Other Other factors that the Chief Information Officer deems important to forecasting future success
Source: OMB’s IT Dashboard. | GAO-16-494
OMB recommends that CIOs consult with appropriate stakeholders in making their evaluations, including Chief Acquisition Officers, program managers, and other interested parties. According to an OMB staff member, agency CIOs are responsible for determining appropriate thresholds for the risk levels and for applying them to investments when assigning CIO ratings. OMB requires agencies to update these ratings as soon as new information becomes available which will affect an investment’s assessment and, since June 2015, has required that this be at least once each calendar month. After agencies assign a level of risk to each investment, the Dashboard assigns colors to CIO ratings according to a five-point scale: high risk and moderately high risk are red, medium risk is yellow, and moderately low risk and low risk are green.

Page 6 GAO-16-494 IT Dashboard
Recognizing the importance of government-wide management of IT, in December 2014, Congress enacted IT acquisition reform legislation, FITARA. The law was designed to improve agencies’ acquisition of IT and enable Congress to monitor agencies’ progress and hold them accountable for reducing duplication and achieving cost savings. FITARA contains specific requirements related to seven areas, including one titled “Enhanced Transparency and Improved Risk Management in Information Technology Investments.” Among other things, that area requires OMB and agencies to make publicly available detailed information on federal IT investments, and agency CIOs to categorize their IT investments by risk. This requirement is addressed by OMB’s IT Dashboard.
Over the past 5 years, we have issued a series of reports about the IT Dashboard that noted both significant steps OMB has taken to enhance the oversight, transparency, and accountability of federal IT investments by creating its IT Dashboard, as well as issues with the accuracy and reliability of data.10 Further, we have reported on the Dashboard’s CIO ratings:
• In October 2012, we reported that CIOs at six agencies rated a majority of investments listed on the IT Dashboard as low or moderately low risk from June 2009—when the Dashboard was implemented—through March 2012 and two agencies, the Department of Defense (Defense) and the National Science Foundation, rated no investments as high or moderately high risk during this time period (categorized as “red” by the Dashboard).11 Additionally, agencies generally followed OMB’s instructions for assigning CIO ratings, although Defense’s ratings were unique in
10GAO, Information Technology: OMB’s Dashboard Has Increased Transparency and Oversight, but Improvements Needed, GAO-10-701 (Washington, D.C.: July 16, 2010); Information Technology: OMB Has Made Improvements to Its Dashboard, but Further Work Is Needed by Agencies and OMB to Ensure Data Accuracy, GAO-11-262 (Washington, D.C.: Mar. 15, 2011); IT Dashboard: Accuracy Has Improved, and Additional Efforts Are Under Way to Better Inform Decision Making, GAO-12-210 (Washington, D.C.: Nov. 7, 2011); Information Technology Dashboard: Opportunities Exist to Improve Transparency and Oversight of Investment Risk at Select Agencies, GAO-13-98 (Washington, D.C.: Oct. 16, 2012); and IT Dashboard: Agencies Are Managing Investment Risk, but Related Ratings Need to Be More Accurate and Available, GAO-14-64 (Washington, D.C.: Dec. 12, 2013). 11GAO-13-98.
Recent Legislation Reinforced the Importance of the Dashboard
GAO Has Previously Reported on the Dashboard

Page 7 GAO-16-494 IT Dashboard
reflecting additional considerations, such as the likelihood of OMB review. Most of the selected agencies reported various benefits associated with producing and reporting CIO ratings, such as increased quality of their performance data and greater transparency and visibility of investments. We recommended that OMB analyze and report on agencies’ CIO ratings over time, and that Defense ensure that its CIO ratings reflect available investment performance assessments and its risk management guidance. Both agencies concurred with our recommendations. Subsequently, OMB reported on CIO rating trends. Further, Defense now identifies red investments on the Dashboard.
• More recently in December 2013, we reported that, as of August 2013, the CIOs at eight selected agencies had rated 198 of their 244 major IT investments listed on the Dashboard as low risk or moderately low risk, 41 as medium risk, and 5 as high risk or moderately high risk.12 However, the total number of investments reported by these agencies had varied over time, which impacted the number of investments receiving CIO ratings. For example, the Department of Energy (Energy) reclassified several of its supercomputer investments from IT to facilities, and the Department of Commerce (Commerce) decided to reclassify its satellite ground system investments. Both decisions resulted in the removal of the investments from the Dashboard, even though the investments were clearly IT. We recommended that these agencies appropriately categorize all investments, but they disagreed with our recommendation.
In that same report, we reviewed 80 investments and found that 53 of the CIO ratings were consistent with the investment risk, 20 were partially consistent, and 7 were inconsistent. While two agencies’ CIO ratings were entirely consistent, other agencies’ ratings were inconsistent for a variety of reasons, including delays in updating the Dashboard and how investment performance was tracked. For example, the Social Security Administration (SSA) resets investment cost and schedule performance baselines annually, an approach that increases the risk of undetected cost or schedule variances that will impact investment success. As such, we recommended that SSA
12GAO-14-64.

Page 8 GAO-16-494 IT Dashboard
revise its investment management approach. The agency agreed with our recommendation and discussed planned actions to address it.
Additionally, we reported that OMB does not update the public version of the Dashboard as the President’s annual budget request is being created. Consequently, the public version of the Dashboard was not updated for 15 of the past 24 months. We recommended that OMB make Dashboard information available independent of the budget process. OMB recently updated the Dashboard with a number of changes, and intends for the Dashboard to be able to show updates throughout the year.
Agencies determine investments’ CIO ratings using a variety of processes, which include OMB’s suggested factors. However, their interpretation of these factors varies significantly. In addition, the majority of agencies base their ratings on qualitative assessments, but several base theirs on formulas. Further, 13 agencies’ process guidance calls for at least monthly updates to CIO ratings, 1 agency (the Department of Homeland Security (DHS)) schedules its reviews based on risk, and 3 agencies require less frequent updates.
As described earlier, OMB requires that each agency CIO rate the risk of his or her IT investments. OMB gives the CIOs the flexibility to use their judgment and suggests six evaluation factors.
As noted above, we reviewed data reported to OMB as part of the federal budget process to identify major investments which planned to spend at least 80 percent of their fiscal year 2015 funding on development, modernization, and enhancement activities. This selection produced a list of 17 agencies and 107 investments. Each of the 17 agencies has incorporated at least 2 of OMB’s suggested factors into their CIO’s risk rating processes and 9 use all of the factors. OMB requires that agencies provide CIO evaluations for all major IT investments which reflect the CIO’s best judgment of the current level of risk for the investment in terms of its ability to accomplish its goals. According to OMB’s guidance, the evaluation can be informed by the following factors, including, but not limited to: risk management, requirements management, contractor
Agencies Use a Variety of Processes to Determine Investments’ CIO Ratings
Agencies Use Many of OMB’s Suggested Factors to Determine CIO Ratings

Page 9 GAO-16-494 IT Dashboard
oversight, historical performance, human capital, and other factors that the CIO deems important to forecasting future success.13
Table 2 summarizes the extent to which the 17 selected agencies incorporate OMB’s suggested evaluation factors into their CIO’s risk rating processes. Appendix II provides more information on the selected agencies’ CIO rating processes.
Table 2: Use of the Office of Management and Budget’s Suggested Factors by Selected Agencies’ Chief Information Officer Rating Processes
Agency Risk Requirements Contractor oversight
Historical performance
Human capital Other
Department of Agriculture X X X X Department of Commerce X X X Department of Defense X X X X X X Department of Education X X X X X X Department of Energy X X X X X X Department of Health and Human Services X X Department of Homeland Security X X X X X X Department of the Interior X X X X X X Department of Labor X X X X X Department of State X X X X X Department of Transportationa X X X X X Department of the Treasury X X X Department of Veterans Affairs X X X X X X Environmental Protection Agency X X X X X X General Services Administration X X X X Office of Personnel Management X X X X X X Social Security Administration X X X X X X
Source: GAO analysis of agencies’ process documentation and interviews with relevant officials. | GAO-16-494 aThe Department of Transportation’s process includes a monthly update where OMB’s CIO rating criteria is leveraged, in addition to the factors noted above.
While the factors suggested by OMB were considered in the agencies’ CIO rating processes, their interpretation of these factors varied. In
13OMB, Fiscal Year 2017 IT Budget - Capital Planning Guidance (Washington, D.C.: Revised June 22, 2015).

Page 10 GAO-16-494 IT Dashboard
particular, most agencies considered active risks when rating investments, but others only evaluated compliance with risk processes. For example:
• Defense, the Department of the Treasury (Treasury), and the General Services Administration (GSA) consider individual active risks, rather than investments’ compliance with risk guidance. For example, Defense considered the risk caused by budget cuts and their potential impact through the following fiscal year when rating its Base Information Transport Infrastructure Wired investment. In addition, GSA, when rating its Integrated Award Environment investment, considered the risk involved with transitioning from an existing contract to one that could provide better expertise and greater oversight.
• The Departments of Agriculture (Agriculture), Education (Education), Energy, the Interior (Interior), State (State), and Veterans Affairs (VA), and the Office of Personnel Management (OPM) review compliance with risk management practices, but do not assess active risks. For example, compliance may include whether mitigation plans exist, risk logs are current, and risks are clearly prioritized.
The rest of the agencies that include the risk factor—Commerce, DHS, the Department of Labor (Labor), the Department of Transportation (Transportation), as well as the Environmental Protection Agency (EPA) and SSA—considered both process compliance and reviews of active risks. For example, Commerce reviews at least the top three active risks for investments, verifies that these risks are specific to the investment, appropriately managed and mitigated, and that the risk register is updated regularly. DHS also considers active investment risks, ensures that they are current, and that risk mitigation plans are in place.
Furthermore, the selected agencies considered different types of historical data when rating their IT investments. While all of the agencies considered performance measures and cost and schedule variances, five considered changes to the investment’s baseline; eight considered the accomplishment of milestones; and three considered relevant news, GAO, or Inspector General reports. While the details of these approaches vary, they align with OMB’s suggested factors.

Page 11 GAO-16-494 IT Dashboard
Of the 17 selected agencies, 6 used formulas to create CIO ratings. Specifically, Agriculture, the Department of Health and Human Services (HHS), DHS, Education, Treasury, and VA determined their ratings by quantifying and combining inputs such as cost and schedule variances, risk exposure values, and compliance with agency processes. Metrics for compliance with agency processes included those related to program and project management, project execution, the quality of investment documentation, and whether the investment is regularly updating risk management plans and logs.
The remaining 11 agencies based their CIO ratings on qualitative assessments of performance metrics, risks, investment documentation, and informal investment knowledge. In particular, they assign ratings based on metrics such as investment performance, discussions with management staff, and the quality of investment documentation.
Thirteen agencies’ process guidance calls for at least monthly updates to CIO ratings, one agency (DHS) schedules its reviews based on risk, and three agencies require less frequent updates. Although a monthly review and update process was not previously required by OMB, the fiscal year 2017 Capital Planning Guidance issued in June 2015 requires agencies to update their CIO ratings at least once per month. Table 3 summarizes the frequency of CIO rating updates called for by the selected agencies’ processes.
Most Agencies Used Qualitative Rather than Quantitative Methodologies
Most Selected Agencies Require Monthly CIO Rating Updates

Page 12 GAO-16-494 IT Dashboard
Table 3: Frequency of Dashboard Updates, as Called For by Selected Agencies’ Processes, as of January 2016
Agency Monthly Bi-monthly Quarterly Semi-annually Department of Agriculture X Department of Commerce X Department of Defense X Department of Education X Department of Energy X Department of Health and Human Services X Department of Homeland Securitya X X X Department of the Interior X Department of Labor X Department of State X Department of Transportation X Department of the Treasury X Department of Veterans Affairs X Environmental Protection Agency X General Services Administration X Office of Personnel Management X Social Security Administration X
Source: GAO analysis of agencies’ process documentation and interviews with relevant officials. | GAO-16-494 aThe Department of Homeland Security staggers its updates based on the risk of its investments.
The three selected agencies that do not comply with OMB’s current requirement for monthly rating updates are Defense, Education, and SSA. In particular:
• Defense updates CIO ratings semi-annually.
• Education updates CIO ratings based on bi-monthly reviews of investments.
• SSA conducts monthly investment reviews, but updates CIO ratings on a quarterly basis.
Additionally, DHS staggers its updates based on investment risk, with high risk (red) investments reviewed monthly, moderate (yellow) investments reviewed quarterly, and low (green) investments reviewed semi-annually. These four agencies’ practices are inconsistent with OMB’s guidance and can limit the transparency and oversight of the government’s IT investments.

Page 13 GAO-16-494 IT Dashboard
However, staff from OMB told us that the Capital Planning Guidance for fiscal year 2018 would not contain the monthly reporting requirement and would instead encourage agencies to keep their CIO ratings accurate and current, rather than mandate reporting frequency. Moving forward, it will be important for any such revised guidance to encourage the frequent and appropriate updating of agencies’ CIO ratings while also remaining compliant with relevant provisions of FITARA. These provisions require that agencies report at least semi-annually to OMB on each major IT investment and include data on cost, schedule, and performance. These provisions also require joint OMB and agency reviews of any investment that has been evaluated as high risk for four consecutive quarters.
As discussed earlier, to assess the risk of individual assessments, we reviewed the 107 investments that we originally selected, but excluded 12 that were inactive, not in development, lacked a key risk document, or were managed as part of a larger development program. This resulted in 95 investments at 15 agencies.14 Our assessments of these investments generally showed more risk than the associated CIO ratings. In particular, of the 95 investments we reviewed, our assessments matched the CIO ratings 22 times, showed more risk 60 times, and showed less risk 13 times. We identified three factors which contributed to these differences: (1) 40 of the 95 CIO ratings were not updated in April 2015, (2) three agencies’ rating processes span longer than 1 month, and (3) seven agencies’ rating processes did not focus on active risks (as previously discussed).
According to OMB’s guidance, CIO ratings “should reflect the CIO’s assessment of the risk and the investment’s ability to accomplish its goals.”15 Such assessments of risk inherently involve a great deal of human judgment. Consequently, risk assessments should be expected to vary both across and within organizations. For example, Defense’s CIO ratings process documentation states that, since its major investments are “inherently high risk,” its ratings are “assessments of relative risk implemented within this risk baseline.” That is, when measuring risk,
14Excluding these 12 investments removed two agencies, Labor and OPM, from the list of selected agencies. 15IT Dashboard Frequently Asked Questions (https://itdashboard.gov/drupal/content/frequently-asked-questions).
Our Assessments Reflected More Risk than Most Selected Investments’ CIO Ratings

Page 14 GAO-16-494 IT Dashboard
Defense is more tolerant and uses a different scale than other agencies. Similarly, risk assessments can vary within agencies. For example, officials at several agencies expressed concerns that the assignment of risk scores (probability and impact) were not consistent across investments. Officials at DHS also noted that program managers may score risks higher to flag an issue for management attention. Further, in many cases, agency CIOs could have more information than we examined in our assessments.
We attempted to minimize the subjectivity in our risk assessments by using the agencies’ own lists of risks, known as risk registers, as the basis of our assessments (see appendix I for additional details on our methodology). We also augmented our ratings with agencies’ cost and schedule data, briefings to review boards, and relevant reports. Our calculations are only intended to provide a standardized view of risk across all the departments and investments we reviewed and this methodology is not intended to serve as a prescriptive approach to the agencies’ evaluation of investment risk.
While the variety of methodologies and inputs meant that some differences were inevitable, almost two thirds of our assessments showed more risk than the associated CIO ratings for our 95 selected investments. Figure 1 summarizes how our assessments compared to the select investments’ CIO ratings.
Figure 1: Comparison of Selected Investments’ April 2015 Chief Information Officer Ratings to GAO Assessments
Our Assessments Showed More Risk than Almost Two Thirds of Selected Investments’ CIO Ratings

Page 15 GAO-16-494 IT Dashboard
Of the 95 investments we reviewed, our assessments showed less risk 13 times, matched the CIO ratings 22 times, and showed more risk 60 times. Additionally, our assessments showed more risk for at least 1 investment at 13 of the 15 agencies we assessed.16 Table 4 summarizes these comparisons by agency, and appendix III lists the April 2015 CIO ratings and our assessments for each of the selected investments.
Table 4: Comparison of GAO’s Assessments to April 2015 Chief Information Officer Ratings for the Selected Investments
Agency Selected
investments GAO’s assessment
reflected less risk GAO’s assessment
matched GAO’s assessment reflected more risk
Department of Agriculture 1 0 0 1 Department of Commerce 9 1 3 5 Department of Defense 25 2 4 19 Department of Education 5 2 0 3 Department of Energy 2 1 0 1 Department of Health and Human Services 9 3 1 5 Department of Homeland Security 7 2 2 3 Department of the Interior 1 0 1 0 Department of State 4 0 1 3 Department of Transportation 15 0 4 11 Department of the Treasury 3 0 0 3 Department of Veterans Affairs 1 0 0 1 Environmental Protection Agency 1 0 0 1 General Services Administration 3 1 2 0 Social Security Administration 9 1 4 4 Total 95 13 22 60
Source: GAO’s assessment of IT Dashboard and agencies’ data. | GAO-16-494
Overall, our assessments reflected more risk than 63 percent of the associated CIO ratings, and 13 of the 15 agencies reported less risk for at least 1 investment. Of the 13, 11 reported less risk for at least half of the selected investments and the remaining 2 reported less risk for just under half of those agencies’ selected investments. For example, we identified more risk at 3 of DHS’s 7 investments and 4 of SSA’s 9 investments.
16While Labor and OPM were selected for review, we did not assess any of their investments. See appendix I for additional details on our selection methodology.

Page 16 GAO-16-494 IT Dashboard
Our assessments showed less risk than the CIO ratings for 13 of the 95 selected investments (14 percent). Specifically, we assessed 5 green that the agencies rated yellow and 8 yellow that the agencies rated red; there were no instances where we assessed an investment green that the agencies rated red. These investments belonged to 8 of the 15 selected agencies: HHS (3 investments), Defense (2 investments), DHS (2 investments), Education (2 investments), Commerce (1 investment), Energy (1 investment), GSA (1 investment), and SSA (1 investment). Table 5 lists those investments, the April 2015 CIO rating, and our associated assessment.
Table 5: Selected Investments for Which GAO’s Assessment Reflected Less Risk than the April 2015 Chief Information Officer (CIO) Ratings
Agency Investment title April 2015 CIO rating
GAO assessment
Department of Commerce Integrated Dissemination Program Yellow Green Department of Defense Airborne and Maritime / Fixed Station Joint Tactical Radio System Red Yellow
Warfighter Information Network-Tactical Increment 3 Red Yellow Department of Education Data Challenges and Appeals Solution Red Yellow
Institute of Education Sciences Knowledge Utilization Yellow Green Department of Energy Identity, Credential, and Access Management Yellow Green Department of Health and Human Services
International Classification of Diseases, 10th Revision Initiative Red Yellow Medicaid and Children’s Health Insurance Program Business Information and Solutions
Red Yellow
Medicare-Medicaid Financial Alignment Red Yellow Department of Homeland Security
Continuous Diagnostics and Mitigation Yellow Green TECS Modernization Red Yellow
General Services Administration
Integrated Award Environment Yellow Green
Social Security Administration Disability Case Processing System Red Yellow
Source: GAO analysis of IT Dashboard and agencies’ data. | GAO-16-494
The reasons why our assessments showed less risk varied among these investments. For instance:
• Commerce rated its Integrated Dissemination Program as yellow, but we assessed it as green. A department official explained that the rating was because (1) the investment had not been transparent in its activities making it difficult to determine whether a milestone was achieved or services were provided and (2) the investment had only identified generic, non-specific risks. Further, the official noted that the
Our Assessments Reflected Less Risk than the Agencies’ CIO Ratings for 13 Investments

Page 17 GAO-16-494 IT Dashboard
department had even debated rating this investment red. We assessed this investment as green because of the low overall level of risk and low cost and schedule variances.
• DHS rated its Continuous Diagnostics and Mitigation investment as yellow, but we assessed it as green. DHS officials stated that the investment was rated yellow because (1) it was considered complex and higher risk due to the involvement of several civilian government agencies, (2) cost and schedule variances exceeded OMB’s thresholds, and (3) concerns about the schedule and availability of resources. In contrast, we assessed it as green because it did not have any risks with both high impact and high probability scores and more than half of the risks scored low in overall risk exposure.
• HHS rated its Medicaid and Children’s Health Insurance Program Business Information and Solutions investment as red, but we assessed it as yellow. HHS officials rated this investment red because the investment team did not submit required data and a rebaseline caused a large cost variance. Even though the investment’s overall risk score was low, we assessed the investment as yellow based upon documented cost and schedule variances and program issues identified in review board briefings.
• GSA rated its Integrated Award Environment as yellow, but we assessed it as green. GSA officials stated that the investment was rated yellow as a precaution: the investment was undergoing a contract transition and the CIO knew that problems could develop. GSA officials stated that another contributing factor was the investment’s late contract award, which had residual impact on investment performance. We assessed this investment green because of its overall low risk score.
As noted earlier, CIO ratings are intended to reflect the CIO’s assessment of the risk and may be based on additional programmatic information not included in our assessment methodology, which focused primarily on investments’ risk registers. As such, the inherently judgmental nature of the CIOs’ assessments may reflect broader considerations that, in their organization’s view, better represent the overall risk of an investment.
For 22 of the 95 selected investments (23 percent), our assessments matched the CIO rating. Specifically, we matched 10 green ratings, 8 yellow ratings, and 4 red ratings. Table 6 lists those investments, the April 2015 CIO rating, and our associated assessment.
Our Assessments Matched the Agencies’ CIO Ratings for 22 Investments

Page 18 GAO-16-494 IT Dashboard
Table 6: Selected Investments for Which GAO’s Assessment Reflected the Same Risk as the April 2015 Chief Information Officer (CIO) Ratings
Agency Investment title April 2015 CIO rating
GAO assessment
Department of Commerce Patent End-to-End 2 Yellow Yellow Patents End-to-End: Software Engineering Yellow Yellow 2020 Decennial Census Research and Testing, Operational Development, and Systems Testing, Fiscal Year 2015 – Fiscal Year 2018
Yellow Yellow
Department of Defense Joint Tactical Radio System Handheld, Manpack, and Small Form Fit Radios
Red Red
Next Generation Operational Control System Red Red Tactical Airspace Integration System Green Green Warfighter Information Network-Tactical Increment 2 Red Red
Department of Health and Human Services
Accountable Care Organizations Yellow Yellow
Department of Homeland Security
Command, Control, Communications, Computers, Intelligence, Surveillance, and Reconnaissance
Green Green
National Flood Insurance Program IT Phoenix Red Red Department of the Interior Integrated Reporting of Wildland-Fire Information Yellow Yellow Department of State Global e-Travel Program Green Green Department of Transportation
Aeronautical Information Management Program Segment 2 Green Green Common Support Services Weather Green Green Runway Status Lights Green Green System Approach for Safety Oversight Green Green
General Services Administration
Office of Enterprise Infrastructure Green Green Order Management Service Yellow Yellow
Social Security Administration
Customer Engagement Tools Yellow Yellow Earnings Redesign Green Green Infrastructure - Modernization Yellow Yellow National Support Center Green Green
Source: GAO analysis of IT Dashboard and agencies’ data. | GAO-16-494
In particular, there were 4 investments at Defense, 4 at SSA, 4 at Transportation, 3 at Commerce, 2 at GSA, 2 at DHS, 1 at HHS, 1 at Interior, and 1 at State that had CIO ratings that matched our assessments. These investments were a mix of red, yellow, and green ratings. However, the reasoning behind the CIO ratings and our individual assessments differed. For example, Interior rated its Integrated Reporting of Wildland-Fire Information investment as yellow because the investment’s required documentation did not meet agency standards.
Page 19 GAO-16-494 IT Dashboard
Specifically, the investment’s most recent artifact review before the April 2015 CIO rating period showed that the investment lacked required documentation, including a risk management plan. However, we assessed the investment as yellow because the IT Dashboard showed significant cost and schedule variances at the time of our review.
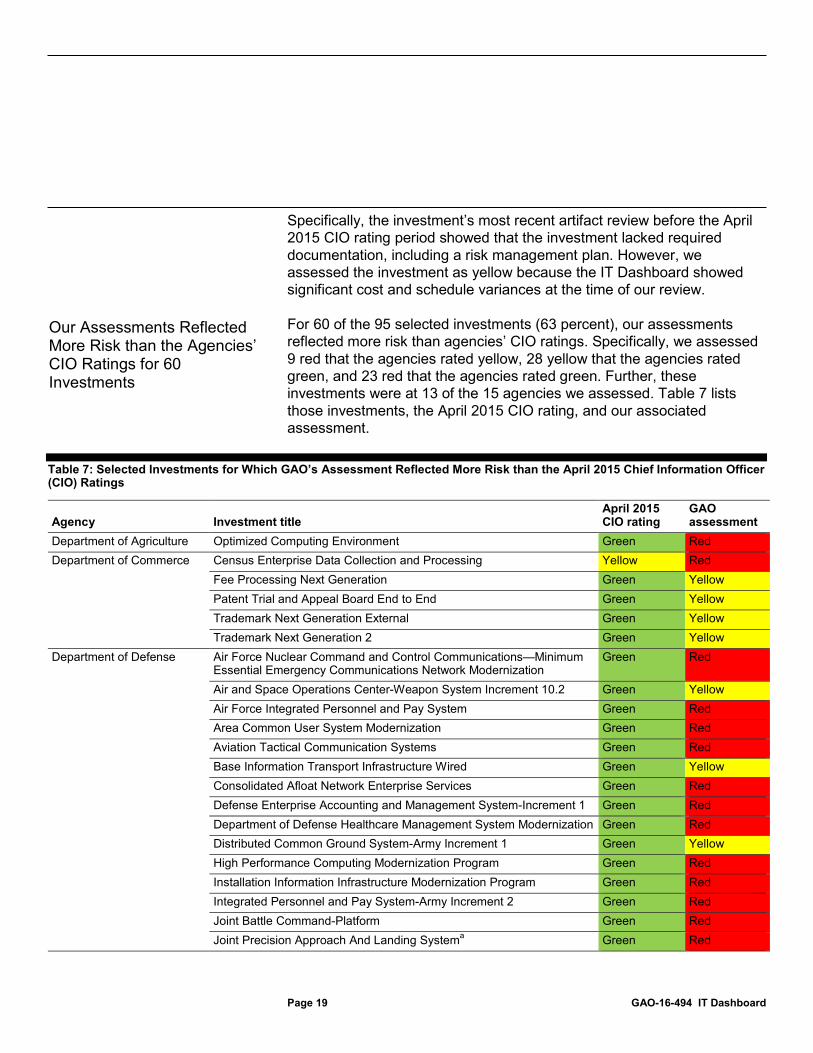
For 60 of the 95 selected investments (63 percent), our assessments reflected more risk than agencies’ CIO ratings. Specifically, we assessed 9 red that the agencies rated yellow, 28 yellow that the agencies rated green, and 23 red that the agencies rated green. Further, these investments were at 13 of the 15 agencies we assessed. Table 7 lists those investments, the April 2015 CIO rating, and our associated assessment.
Table 7: Selected Investments for Which GAO’s Assessment Reflected More Risk than the April 2015 Chief Information Officer (CIO) Ratings
Agency Investment title April 2015 CIO rating
GAO assessment
Department of Agriculture Optimized Computing Environment Green Red Department of Commerce Census Enterprise Data Collection and Processing Yellow Red
Fee Processing Next Generation Green Yellow Patent Trial and Appeal Board End to End Green Yellow Trademark Next Generation External Green Yellow Trademark Next Generation 2 Green Yellow
Department of Defense
Air Force Nuclear Command and Control Communications—Minimum Essential Emergency Communications Network Modernization
Green Red
Air and Space Operations Center-Weapon System Increment 10.2 Green Yellow Air Force Integrated Personnel and Pay System Green Red Area Common User System Modernization Green Red Aviation Tactical Communication Systems Green Red Base Information Transport Infrastructure Wired Green Yellow Consolidated Afloat Network Enterprise Services Green Red Defense Enterprise Accounting and Management System-Increment 1 Green Red Department of Defense Healthcare Management System Modernization Green Red Distributed Common Ground System-Army Increment 1 Green Yellow High Performance Computing Modernization Program Green Red Installation Information Infrastructure Modernization Program Green Red Integrated Personnel and Pay System-Army Increment 2 Green Red Joint Battle Command-Platform Green Red Joint Precision Approach And Landing Systema Green Red
Our Assessments Reflected More Risk than the Agencies’ CIO Ratings for 60 Investments

Page 20 GAO-16-494 IT Dashboard
Agency Investment title April 2015 CIO rating
GAO assessment
Joint Space Operations Center Mission System Increment 2 Green Red Mid-tier Networking Vehicular Radio Green Yellow Signal Modernization Program Green Red Tactical Mission Command Yellow Red
Department of Education Contracts and Purchasing Support System Green Yellow Educational Assessment Green Yellow Enterprise Trusted Internet Connection Green Yellow
Department of Energy Office of Energy Efficiency and Renewable Energy Revised Enterprise Integration
Green Yellow
Department of Health and Human Services
Federally Facilitated Marketplace Green Yellow Master Data Management Yellow Red Physician Feedback Program Green Yellow Federal Health Architecture Green Yellow Office of Medicare Hearings and Appeals Electronic Case Adjudication Processing Environment
Yellow Red
Department of Homeland Security
Next Generation Networks Priority Services Green Red Remote Video Surveillance Systems Yellow Red United States Citizenship and Immigration Services – Transformation Yellow Red
Department of State Architecture Services Green Yellow Budget System Modernization Green Yellow Electronic Medical Record Yellow Red
Department of Transportation
Automatic Dependent Surveillance-Broadcast Green Red Data Communications NextGen Support (DataComm) Green Yellow En Route Automation Modernization System Enhancements and Tech Refresh
Green Yellow
NextGen Research and Development Portfolio Green Yellow NextGen National Airspace System Voice System Green Red NextGen Weather Processor Green Yellow System Wide Information Management Green Yellow Terminal Flight Data Manager Green Yellow Unified Registration System Yellow Red Wide Area Augmentation System Green Yellow Next Generation Air/Ground Communications (NEXCOM) Segment 2 Green Yellow
Department of the Treasury Customer Account Data Engine 2 Green Yellow Foreign Account Tax Compliance Act Green Yellow Post Payment System Green Red
Department of Veterans Affairs
Interagency 21st Century One Vet Green Red

Page 21 GAO-16-494 IT Dashboard
Agency Investment title April 2015 CIO rating
GAO assessment
Environmental Protection Agency
eManifest Yellow Red
Social Security Administration
Electronic Services Green Red Intelligent Disability Green Yellow SMART Claim Green Red Supplemental Security Income Modernization Green Red
Source: GAO analysis of IT Dashboard and agencies’ data. | GAO-16-494 aAccording to Department of Defense officials, the Joint Precision Approach And Landing System is no longer a major IT investment.
The agencies’ explanations as to why our assessments showed more risk varied in these 60 cases. For example,
• Agriculture rated its Optimized Computing Environment investment as green, but we assessed it as red. While Agriculture officials noted that this investment’s funding from partner agencies was uncertain, the investment received a green CIO rating because the funding uncertainties were a recurring concern that had been previously managed without issue. Conversely, we assessed the investment as red because 21 of the 44 risks in the investment’s risk register had high overall risk scores.
• DHS rated its Next Generation Networks Priority Services investment as green, but we assessed it as red. DHS officials stated that they rated this investment green because the investment was progressing well and because it had successfully mitigated its high impact/high probability risks. However, our assessment was partly based on two risks with both high probability and high impact scores that the investment team categorized as potentially causing investment failure. These risk scores and descriptions indicated that the program believed that it was likely that these risks would be realized and cause critical, perhaps investment-threatening problems. DHS officials questioned the probability and impact scores and explained that investment teams may inflate such scores to flag potential issues for management.
• SSA rated its Supplemental Security Income Modernization investment as green, but we assessed it as red. SSA officials stated that their review did not see significant reason to lower the rating, even though part of the investment was working through significant technical challenges. We assessed the investment red because half

Page 22 GAO-16-494 IT Dashboard
of its risks had high risk scores. Included in the most critical risks were those pertaining to requirements changes, system complexity, and staffing losses. When asked about these risks, SSA officials explained that, generally, they were common risks faced by every investment. Consequently, they expressed doubt that these risks necessitated such high risk scores.
• Treasury rated its Post Payment System investment as green, but we assessed it as red. Treasury officials stated that this investment was rated green because it was well-run and had previously kept its risks from becoming realized issues. Conversely, we rated this investment as red because 20 out of its 26 risks had high overall risk scores, including 2 that indicated a high probability of schedule delays. Treasury officials stated that they were monitoring the risks that we identified.
As noted earlier, the judgmental nature of a CIO’s assessment may reflect a broader organizational view of investment risk beyond the contents of the investment’s risk register. However, unlike the CIO ratings that reflected more risk than our assessments, many of these CIO ratings minimized the potential severity and impact of high risk scores. Our past work has shown that such an approach to risk management can often lead to cost and schedule overruns or failed projects.17
In addition to the previously discussed issue of rating subjectivity, we identified three factors which contributed to differences between our assessments and CIO ratings at 10 of the 15 selected agencies. In particular,
• ratings were not updated in April 2015, • rating processes spanned longer than 1 month, and • rating processes did not focus on active risks.
Rather than pertaining to the CIOs’ personal evaluations of risk, these additional issues relate to the 10 agencies’ update practices or rating processes. Because these issues are with underlying practices and processes, they have the potential to impact all investment ratings—
17GAO, GAO Cost Estimating and Assessment Guide: Best Practices for Developing and Managing Capital Program Costs, GAO-09-3SP (Washington, D.C.: Mar. 2, 2009).
Three Issues Contributed to Discrepancies between Agencies’ CIO Ratings and Our Assessments

Page 23 GAO-16-494 IT Dashboard
whether or not we reviewed them as part of our assessment. Specifically, we found that 40 of the 95 CIO ratings were not updated in April 2015, 3 agencies’ rating processes span longer than 1 month, and 7 agencies’ rating processes did not focus on active risks (see table 8). Following the table is a further description of these issues.
Table 8: Causes of Differences between the Selected Investments’ Chief Information Officer (CIO) Rating and Our Assessment
Agency CIO ratings not
updated in April 2015 Rating process spans longer than 1 month
Risk process did not focus on active risks
Department of Agriculture X X Department of Commerce X Department of Defense X Department of Education X X X Department of Energy X Department of Health and Human Services X X Department of Homeland Security X Department of the Interior X Department of State X X Department of the Treasury X Department of Veterans Affairs X Environmental Protection Agency X
Source: GAO analysis of IT Dashboard data, agency documentation, and interviews with agency officials. | GAO-16-494
Of the 95 investments we selected, we found that agencies had not updated CIO ratings for 40 in April 2015 (see table 9).
Agencies Did Not Update CIO Ratings for 40 Investments in April 2015

Page 24 GAO-16-494 IT Dashboard
Table 9: Number of Investments That Did Not Update Chief Information Officer (CIO) Ratings in April 2015
Agency Selected
investments CIO ratings not
updated in April 2015 Department of Agriculture 1 1 Department of Commerce 9 1 Department of Defense 25 25 Department of Education 5 4 Department of Health and Human Services 9 2 Department of Homeland Security 7 6 Environmental Protection Agency 1 1
Source: GAO analysis of IT Dashboard data. | GAO-16-494
Further, we found that our assessments were more likely to match those investments updated in April because these recently updated ratings reflected the then-current investment information that we also used in our assessments. In particular, 17 of the 22 investments where our assessment matched the CIOs’ ratings were updated in April 2015, whereas we matched only 5 of the 40 without April 2015 updates. Of the 40 ratings that were not updated, 15 were at 6 agencies, which provided the following explanations for the lack of April updates:
• Agriculture officials stated that they were in the midst of switching systems used to update ratings to the Dashboard, so they were unable to update ratings that month.
• Commerce officials stated that they did not receive quality data from the investment until the following month and thus did not have a valid basis for changing the rating or CIO comments.
• DHS officials stated that they did not update 2 of the selected investments’ ratings because they were undergoing TechStat reviews.18 Additionally, 2 investments’ CIO ratings were not updated in April even though they initially received April reviews. According to officials, 1 investment’s review occurred too late in the month and the other investment’s update was delayed. They also stated that they were revising their process so that rating updates would occur during
18TechStat reviews are face-to-face meetings to terminate, halt, or turnaround IT investments that are failing or are not producing results.

Page 25 GAO-16-494 IT Dashboard
such reviews. Additionally, DHS’s risk-based review cycle meant that two investments were not due to be rated in April. In particular, those investments were rated yellow less than 3 months prior and DHS reviews yellow-rated investments on a quarterly basis.19
• An Education official explained that the agency only updates its ratings if an investment’s status has changed enough to warrant an update.
• EPA officials told us that its selected investment was not updated in April 2015 because the investment was in a state of flux during that time and a review would not have been useful.
• HHS officials stated that a combination of system and human errors kept 2 investment updates from posting.
The remaining 25 investments which did not have an April 2015 update were at Defense, which updates its ratings on a semi-annual basis (see earlier discussion of CIO rating update frequency). If we had used Defense’s subsequent update from June 2015, the number of instances in which the CIO ratings matched our assessments would have increased from 4 to 10.
The preceding examples underscore the importance of OMB’s June 2015 policy change, requiring that agencies provide monthly rating updates. Such updates will help to ensure that the information on the Dashboard is timely and accurately reflects recent changes. Without such updates, the CIO ratings on the Dashboard may not reflect the current level of investment risk.
The duration of agencies’ CIO rating processes also impacted the comparison between the CIO ratings and our assessment. Since we used March 2015 risk registers as the basis for our assessment, process times longer than a month mean that the data we used for our assessment would not have been included in agencies’ April 2015 CIO ratings. Fourteen of the 17 selected agencies indicated that it takes 1 month or less to process investment data and update the IT Dashboard. However,
19As discussed earlier, DHS staggers its updates based on investment risk, with high risk (red) investments reviewed monthly, moderate (yellow) investments reviewed quarterly, and low (green) investments reviewed semi-annually.
Three Selected Agencies’ Rating Processes Took Longer than 1 Month

Page 26 GAO-16-494 IT Dashboard
processes at 3 agencies—Education, State, and Treasury—can be longer than 1 month. For example, Treasury officials stated that late invoices from contractors can delay their processes past the 1 month time frame. State officials explained that their conversion of certain cost and schedule data into the format required by the Dashboard can take between 1 and 2 months to complete. Longer processes mean that CIO ratings are based upon older data and may not reflect the current level of investment risk. Further, these longer processes may prevent the agencies from meeting OMB’s requirement to update ratings monthly.
When developing CIO ratings, seven agencies did not consider active risks, as discussed earlier. Six of those agencies (Agriculture, Education, Energy, Interior, State, and VA) instead chose to focus on investments’ risk management processes, such as whether a process was in place or whether a risk log was current. Such approaches did not consider individual risks, such as funding cuts or staffing changes, which detail the probability and impact of pending threats to success. Instead, VA’s CIO rating process considers several specific risk management criteria: whether an investment (1) has a risk management strategy, (2) keeps the risk register current and complete, (3) clearly prioritizes risks, and (4) puts mitigation plans in place to address risks.
Considering process compliance, rather than active risks, contributed to our assessments only matching 2 of the CIO ratings for the 14 selected investments at these six agencies. The remaining agency, HHS, did not factor risk into its CIO ratings (as discussed earlier). This contributed to our assessments matching only 1 of the 9 selected HHS investments.20 In all cases, CIO ratings that do not incorporate active risks increase the chance that ratings do not reflect the true likelihood of investment success.
Since its inception in 2009, the IT Dashboard has increased the transparency of the government’s multi-billion dollar spending on major IT investments. The Dashboard’s CIO ratings, in particular, have improved visibility into the risks facing these critically important efforts. To that end, agency CIOs have developed a variety of processes to assess and report
20In technical comments on a draft of this report, HHS informed us that it initiated a new CIO rating methodology in January 2016 that factors risk into its assessments.
Seven Selected Agencies Did Not Factor Active Risks into Ratings
Conclusions

Page 27 GAO-16-494 IT Dashboard
the risk of their investments. Although the effectiveness of the Dashboard depends on the quality of the CIOs’ ratings, selected agencies’ rating methods do not provide an accurate assessment of investment risk and thus reduce the value of this important tool for transparency and oversight. Further, multiple agencies’ infrequent submissions raise concerns that those updates are not reflecting timely and accurate risk information, contrary to OMB’s current policy requiring monthly updates. Such practices limit the transparency and oversight of the government’s billions of dollars in IT investments.
Beyond the transparency they provide, CIO ratings present an opportunity to improve CIOs’ understanding of their IT portfolio and identify those investments in need of additional oversight. While these ratings are by definition inherently judgmental, our assessments of the selected investments generally showed more risk than almost 65 percent of the associated CIO ratings. Consequently, the associated risk rating processes used by the agencies generally are understating the level of risk, raising the likelihood that critical federal investments in IT are not receiving the appropriate levels of oversight. Finally, agencies that do not factor active risks into their CIO ratings trigger additional questions about the degree to which information reported on the Dashboard provides full and accurate information about an investment’s risk. While agencies’ consideration of active risk is not explicitly called for by OMB’s guidance, this represents a gap in the agencies’ processes that is understating the amount of risk reflected in the Dashboard’s CIO ratings.
To better ensure that the Dashboard ratings more accurately reflect risk, we recommend that:
• the Secretaries of the Departments of Agriculture, Education, Energy, Health and Human Services, the Interior, State, and Veterans Affairs; and the Director of the Office of Personnel Management direct their CIOs to factor active risks into their IT Dashboard CIO ratings;
• the Secretaries of the Departments of Defense, Education, and Homeland Security; and the Commissioner of the Social Security Administration direct their CIOs to update their CIO ratings at least as frequently as required in OMB’s guidance; and
• the Secretaries of the Departments of Agriculture, Commerce, Defense, Education, Energy, Health and Human Services, Homeland Security, State, Transportation, the Treasury, Veterans Affairs; the Administrator of the Environmental Protection Agency; and the Commissioner of the Social Security Administration direct their CIOs
Recommendations for Executive Action

Page 28 GAO-16-494 IT Dashboard
to ensure that their CIO ratings reflect the level of risk facing an investment relative to that investment’s ability to accomplish its goals.
We received comments on a draft of this report from OMB, the 15 agencies to which we made recommendations, and the remaining 2 to which we did not make recommendations. Specifically, 9 agencies agreed with our recommendations, 2 (Education and SSA) agreed with one or more while partially agreeing with another, 1 (DHS) agreed with one and disagreed with another, 1 (Defense) partially agreed with one and disagreed with another, 1 (EPA) disagreed, 1 (OMB) did not agree or disagree, and 1 (Treasury) did not comment on our recommendation. The 2 agencies without recommendations (Labor and GSA) stated that they had no comments. Multiple agencies also provided technical comments, which we have incorporated as appropriate. The following is a detailed discussion of each agency’s comments.
• In comments provided via e-mail on April 25, 2016, an OMB official from the Office of General Counsel did not agree or disagree with our recommendations. OMB also provided technical comments, which we have incorporated as appropriate.
Our draft report to OMB for comment included a recommendation that Defense, Education, DHS, and SSA update their agencies’ CIO ratings on a monthly basis, as required by OMB’s fiscal year 2017 IT Budget Capital Planning Guidance. Subsequently, OMB informed us that the fiscal year 2018 Capital Planning Guidance will be revised to only require that agencies update the Dashboard as soon as new information becomes available or when CIO reviews are performed. Taking into account OMB’s planned course of action, we have modified our recommendation to those four agencies to reflect that they should, at a minimum, comply with OMB’s required reporting frequency.
• In comments provided via e-mail on May 16, 2016, a Senior Advisor for Oversight and Compliance from Agriculture’s Office of the CIO stated that the department concurred with our recommendation. Agriculture also provided technical comments, which we incorporated as appropriate.
• In written comments, Commerce concurred with our recommendation and committed to ensuring that the department’s CIO ratings will reflect the level of risk facing an investment relative to that investment’s ability to accomplish its goals. Commerce’s written comments are provided in appendix IV.
Agency Comments and Our Evaluation

Page 29 GAO-16-494 IT Dashboard
• In written comments, Defense partially concurred with our recommendation to reflect the level of risk facing an investment relative to that investment’s ability to accomplish its goals. While Defense agreed with the need of CIO ratings to reflect risk, the department stated that its current CIO rating process already incorporates this factor. While we also agree that risk plays a role in Defense’s documented CIO ratings process, our findings indicate that the CIO ratings for the selected investments may have underreported investment risk. Specifically, our assessments for 19 of the selected 25 Defense investments (or 76 percent) show more risk than the CIO ratings on the Dashboard in April 2015. We therefore believe that our recommendation is appropriate.
In addition, the department did not concur with our recommendation to update its CIO ratings on a monthly basis. Specifically, the department states that its semi-annual reporting is consistent with FITARA requirements and is documented in the department’s OMB-approved FITARA implementation plan. As noted earlier, we recognize OMB’s plans to remove the monthly reporting requirement for CIO ratings and have modified this recommendation to reflect that planned change. We acknowledge that when this new policy is finalized, Defense’s semi-annual reporting may be in compliance with the new requirement. Until such time, agencies are still required by existing policy to report monthly and consequently, we believe that our recommendation is appropriate. Defense’s written comments are provided in appendix V.
• In written comments, Education concurred with our recommendations to factor active risks into its CIO ratings and to have CIO ratings reflect the level of risk facing an investment relative to that investments’ ability to accomplish its goals, and described plans to implement those recommendations. Specifically, the department will include consideration of active risks when formulating its CIO ratings and its investment review board chair will provide specific guidance that the CIO should ensure the ratings reflect the level of risk facing an investment.
The department partially concurred with our recommendation to update CIO ratings monthly, stating that OMB’s fiscal year 2017 IT budget guidance addresses the required frequency of updates in several places, and the section specific to CIO evaluations only requires agencies to update their ratings as soon as new information becomes available. While we agree that OMB’s fiscal year 2017 guidance does address Dashboard reporting frequency in several

Page 30 GAO-16-494 IT Dashboard
places, the requirement for monthly updates is nonetheless explicitly stated and was confirmed by OMB staff. However, as noted earlier, we recognize OMB’s plans to remove the monthly reporting requirement for CIO ratings and have modified this recommendation to reflect that planned change. We acknowledge that when this new policy is finalized, Education’s reporting may be in compliance with the new requirement. Until such time, agencies are still required by existing policy to report monthly and consequently, we believe that our recommendation is appropriate. Education’s written comments are provided in appendix VI.
• In written comments, Energy concurred with our recommendations and noted that the Office of the CIO would work collaboratively with IT executives to address the recommendations. Energy also provided technical comments, which we have incorporated as appropriate. Energy’s written comments are provided in appendix VII.
• In written comments, HHS concurred with our recommendations, but noted that the recommendations were based on a now-outdated department methodology and that a new methodology, which went into effect in January 2016, addresses our recommendations. HHS also provided technical comments, which we have incorporated as appropriate. HHS’s written comments are provided in appendix VIII.
• In written comments, DHS concurred with our recommendation to reflect the level of risk facing an investment relative to that investment’s ability to accomplish its goals.
The department did not concur with our recommendation to update its CIO ratings on a monthly basis, specifically noting that its risk-based process complies with OMB’s Fiscal Year 2017 Capital Planning Guidance with regards to the frequency of its updates to the IT Dashboard, and that investments receive health assessments on a risk-based basis, either monthly, quarterly, or semi-annually. However, we disagree with the assertion that this update frequency aligns with current OMB guidance, which explicitly requires that the Dashboard be updated at least monthly. However, as noted earlier, we recognize OMB’s plans to remove the monthly reporting requirement for CIO ratings and have modified this recommendation to reflect that planned change. We acknowledge that when this new policy is finalized, DHS’s reporting may be in compliance with the new requirement. Until such time, agencies are still required by existing policy to report monthly and consequently, we believe that our recommendation is appropriate. DHS also provided technical
Page 31 GAO-16-494 IT Dashboard
comments, which we have incorporated as appropriate. DHS’s written comments are provided in appendix IX.
• In written comments, Interior concurred with our recommendation and noted it is currently enhancing the department’s CIO ratings process to maximize standardization across investment CIO ratings and to strengthen the assessment of active risks. Interior’s written comments are provided in appendix X.
• In written comments, State agreed with our recommendations, noting that the department currently analyzes active risks and reviews those risks on a monthly basis. However, our review found that while State’s CIO ratings process included compliance with risk management issues (e.g., ensuring that the risk register is being updated and that mitigation strategies are properly planned), the department did not review active risks by evaluating the probability and impact of individual investment risks and applying that knowledge to the CIO ratings. By considering active risks, State can increase the chance that the ratings will better reflect the true likelihood of investment success. State’s written comments are presented in appendix XI.
• In comments provided via e-mail on April 27, 2016, Transportation’s Director of Audit Relations and Program Improvement in the Office of the Secretary stated that the department concurred with our recommendation.
• In comments provided via e-mail on May 10, 2016, a GAO liaison from Treasury’s Office of the CIO did not comment on our recommendation. Treasury also provided technical comments, which we have incorporated as appropriate.
• In written comments, VA concurred with our recommendations and described actions the department is taking to address both of them. For our recommendation to factor active risks into its IT Dashboard CIO ratings, VA indicated that it would amend its current monthly process to include a requirement for investment managers to review at least the top three active operational risks. Additionally, for our recommendation to ensure that CIO ratings reflect the level of risk facing an investment relative to that investment’s ability to accomplish its goals, VA plans, among other things, to amend its current monthly process to include a requirement for investment managers to assess operational risks that detail the probability and impact of pending threats to success. VA’s written comments are presented in appendix XII.
Page 32 GAO-16-494 IT Dashboard
• In written comments, EPA did not agree with our recommendation. While agreeing that CIO ratings should reflect the level of risk facing an investment relative to that investment’s ability to accomplish its goals, the agency asserted that its current process already allows for this through the criteria used to determine an investment’s CIO rating. EPA specifically cited an EPA investment that was rated yellow, but we assessed as red. Further, EPA indicated that this disagreement does not mean that EPA’s process does not consider risks. We agree that the difference between EPA’s CIO rating and our assessment does not necessarily mean that EPA does not factor risk or the investment’s ability to accomplish its goals. However, it does indicate that the level of risk may be underreported. Consequently, we believe that our recommendation is appropriate. EPA also provided technical comments, which we have incorporated as appropriate. EPA’s written comments are provided in appendix XIII.
• In written comments, OPM concurred with our recommendation and stated the agency will begin factoring active risks into CIO ratings. OPM’s written comments are provided in appendix XIV.
• In written comments, SSA agreed with our recommendation to update its CIO ratings on a monthly basis. However, as noted earlier, we recognize OMB’s plans to remove the monthly reporting requirement for CIO ratings and have modified this recommendation to reflect that planned change.
SSA partially agreed with our recommendation to reflect the level of risk facing an investment relative to that investment’s ability to accomplish its goals. Noting that the agency head and the CIO should work together to appropriately consider investment risk, the agency disagreed with the implication that these individuals were not doing so. Additionally, SSA stated that it was too early in the implementation of FITARA to conclude that following OMB’s related guidance would result in agencies misestimating risk and that our report should not imply that SSA’s risk assessments do not fulfill the legislative intent of FITARA. While we recognize the collaborative efforts of SSA’s executives, our assessments nevertheless showed more risk for four out of nine selected SSA investments. Further, three of the four were rated green by SSA but assessed as red by us, indicating the possibility that these CIO ratings did not fully reflect the risk being faced by these investments. Additionally, our report does not conclude that OMB’s guidance leads to agencies misestimating risk, but rather that agencies’ processes are understating risk. As such, we believe

Page 33 GAO-16-494 IT Dashboard
that our recommendation is warranted. SSA’s written comments are provided in appendix XV.
Comments from the agencies to which we did not make recommendations are discussed in more detail here.
• In comments provided via e-mail on April 18, 2016, a representative from Labor’s Office of the Assistant Secretary for Administration and Management stated that the department had no comments on the report.
• In comments provided via e-mail on April 15, 2016, a representative from GSA’s GAO/IG Audit Response Division stated that the agency had no comments on the report.
We are sending copies of this report to interested congressional committees; the Secretaries of Agriculture, Commerce, Defense, Homeland Security, Education, Energy, Health and Human Services, the Interior, Labor, State, Transportation, the Treasury, and Veterans Affairs; the Administrator of the Environmental Protection Agency; the Administrator of the General Services Administration; the Director of the Office of Personnel Management; the Commissioner of the Social Security Administration; the Director of the Office of Management and Budget; and other interested parties. This report will also be available at no charge on our website at http://www.gao.gov.
If you or your staff have any questions on matters discussed in this report, please contact me at (202) 512-9286 or [email protected]. Contact points for our Offices of Congressional Relations and Public Affairs may be found on the last page of this report. GAO staff who made major contributions to this report are listed in appendix XVI.
David A. Powner Director, Information Technology Management Issues

Appendix I: Objectives, Scope, and Methodology
Page 34 GAO-16-494 IT Dashboard
Our objectives were to (1) describe agencies’ processes for determining the Chief Information Officer (CIO) risk ratings for major information technology (IT) investments and (2) assess the risk of federal IT investments and analyze any differences with the investments’ CIO risk ratings.
To select the agencies and investments, we reviewed data reported to OMB as part of the federal budget process to identify major investments that planned to spend at least 80 percent of their fiscal year 2015 funding on development, modernization, and enhancement activities.1 This produced a list 17 agencies and 107 selected investments. These agencies were: the Departments of Agriculture (Agriculture), Commerce (Commerce), Defense (Defense), Homeland Security (DHS), Education (Education), Energy (Energy), Health and Human Services (HHS), the Interior (Interior), Labor (Labor), State (State), Transportation (Transportation), the Treasury (Treasury), and Veterans Affairs (VA), as well as the Environmental Protection Agency (EPA), the General Services Administration (GSA), the Social Security Administration (SSA), and the Office of Personnel Management (OPM). Appendix III contains a complete listing of the selected agencies and investments.
To address our first objective, we met with the 17 selected agencies to discuss their CIO rating processes and collected relevant documentation, such as capital planning and investment control guides, program health assessment guidance, and rating processes. We then compared the agencies’ processes to the Office of Management and Budget’s (OMB) suggested evaluation factors for creating CIO ratings.2 These evaluation factors are: (1) risk management, (2) requirements management, (3) contractor oversight, (4) historical performance, (5) human capital, and (6) other (i.e., the other factors that the CIO deems important to forecasting
1These data are comprised of submissions from the following 26 federal agencies: the Departments of Agriculture, Commerce, Defense, Education, Energy, Health and Human Services, Homeland Security, Housing and Urban Development, Justice, the Interior, Labor, State, Transportation, the Treasury, and Veterans Affairs; the Environmental Protection Agency; the General Services Administration; the National Aeronautics and Space Administration; National Archives and Records Administration; National Science Foundation; Nuclear Regulatory Commission; Office of Personnel Management; Small Business Administration; Social Security Administration; U.S. Agency for International Development; and the U.S. Army Corps of Engineers. 2OMB, Fiscal Year 2017 IT Budget - Capital Planning Guidance (Washington, D.C.: Revised June 22, 2015).
Appendix I: Objectives, Scope, and Methodology

Appendix I: Objectives, Scope, and Methodology
Page 35 GAO-16-494 IT Dashboard
future success). We also analyzed the agencies’ documents and interviewed officials to determine how the agencies’ use of OMB’s factors varied.
To address our second objective, we reviewed the 107 investments, but excluded 12 after agencies told us that: 2 were inactive in our period of review, 5 were not primarily in development, 4 were too new to have a risk register (a key document for our assessments), and 1 was managed as part of a larger development program and did not have its own risk register. These exclusions eliminated the 2 selected investments from Labor and the 1 from OPM. This resulted in 95 investments at 15 agencies.
We made the decision to review the ratings from April 2015, the month that our audit work began, in order to minimize any influence that our ongoing work could have on the agencies’ processes and resulting ratings. We first downloaded the April ratings, interviewed appropriate officials at the 15 selected agencies, and collected March 2015 risk documentation (the data we would expect to be reflected in the April ratings), performance data, review board briefings, and relevant reports (e.g., GAO and Inspector General reports). In cases where agencies were unable to provide March documentation, we used documents from the closest available date. We did not consider risks that were introduced after March in these documents. We used this information to assess each selected investment’s overall investment risk and compared the result to the April 2015 CIO ratings.
According to OMB’s guidance, CIO ratings “should reflect the CIO’s assessment of the risk and the investment’s ability to accomplish its goals.”3 To create our assessments of risk, we combined each investment’s detailed risk lists, known as risk registers, with several additional metrics. Specifically, we combined the probability and impact of every active risk in the risk registers of each of the selected investments to determine what is known as the exposure of each risk.4 These
3IT Dashboard Frequently Asked Questions (https://itdashboard.gov/drupal/content/frequently-asked-questions). 4According to the Software Engineering Institute, risk can be calculated as a combination of probability (or likelihood) and impact (or consequences). The institute gives credit for the formula to Barry W. Boehm. We used that formula to calculate risk exposure scores: risk exposure = likelihood of occurrence (probability) * loss due to undesirable outcome (impact).

Appendix I: Objectives, Scope, and Methodology
Page 36 GAO-16-494 IT Dashboard
exposure scores ranged from “very low” to “very high” and were based upon industry and government best practices. Table 10 shows how probability and impact values derived from these sources were combined to determine risk exposure.
Table 10: Example of Risk Exposure Scores Resulting from Agency-Assigned Probability and Impact Values
Impact Very low Low Moderate High Very high Probability Very low Very low Very low Low Moderate Moderate
Low Very low Low Low Moderate Moderate Moderate Low Low Moderate High High High Moderate Moderate High High Very high Very high Moderate Moderate High Very high Very high
Source: GAO analysis of industry and government best practices. | GAO-16-494
We then weighted each risk exposure, placing significantly increased emphasis on higher risks so that they were not canceled out by lower risks. Table 11 lists the weights we assigned to the exposures.
Table 11: Risk Exposures and Associated Weights
Risk exposure level Weight Very low 4 Low 1 Moderate 3 High 9 Very high 27
Source: GAO. | GAO-16-494
We then averaged these weights and translated the result into green, yellow, and red grades according to the following scale.
Table 12: Range of Weighted Averages and Corresponding Color
Weighted average range Color Less than 3 Green Greater than or equal to 3 and less than 9 Yellow Greater than or equal to 9 Red
Source: GAO. | GAO-16-494

Appendix I: Objectives, Scope, and Methodology
Page 37 GAO-16-494 IT Dashboard
For example, we would assess the following risk register as yellow.
Table 13: Example of Probability, Impact, Exposures, and Grading, based on the Evaluation of Risks for a Generic Investment
Individual risk Probability Impact Risk exposure Weight Risk A Low Low Very low 0 Risk B Low Low Very low 0 Risk C Low Low Very low 0 Risk D Low Low Very low 0 Risk E Low Low Very low 0 Risk F Low Moderate Low 1 Risk G Low High Moderate 3 Risk H Moderate Moderate Moderate 3 Risk I Moderate High High 9 Risk J Very high High Very high 27 Average 4.3
Source: GAO. | GAO-16-494
We then lowered the assessments based on consideration of the following elements: (1) cost and schedule data from the IT Dashboard, (2) relevant review board briefings, and (3) relevant reports (e.g., GAO and Inspector General reports). Specifically, we first reviewed each investment’s project-level cost and schedule data from the Dashboard as of April 2015 and if more than half of its projects’ variances were colored red by the Dashboard,5 we lowered our assessment one level (i.e., from green to yellow or from yellow to red). As a result of this review, we identified a total of 19 investments; however, 11 of those could not be lowered further as we had already assessed them as red. The grades for the remaining 8 investments were lowered one level. In particular, 6 grades were lowered from yellow to red and 2 were lowered from green to yellow.
Then, we examined review board briefings covering March 2015, as well as relevant GAO and Inspector General reports, and lowered our assessment if we deemed the identified issues represented serious risks
5The Dashboard colors represent the following variances: greater than or equal to 30 percent is “red,” between 10 and 30 percent is “yellow,” and less than 10 percent is “green.”
Appendix I: Objectives, Scope, and Methodology
Page 38 GAO-16-494 IT Dashboard
to the investment and remained relevant in April 2015. Using this approach, we considered lowering 12 of our assessments due to such information; however, 11 of the 12 assessments were already either red or were already lowered due to cost and schedule issues. Consequently, the only investment for which we lowered our assessment was Defense’s Warfighter Information Network-Tactical Increment 2, which was reduced from yellow to red. A briefing for that investment showed that the program’s cost variance triggered what is known as a Nunn-McCurdy breach,6 that the program was being restructured, that its scope was being reduced, and we had recently reported that the program struggled to demonstrate required performance and reliability during operational testing.7
We then compared our assessment to the CIO ratings on the Dashboard, discussed our findings with agency officials, and corroborated the Dashboard’s data with agency officials. Our calculations are only intended to provide a standardized view of risk across all the departments and investments we reviewed, and this methodology is not intended to serve as a prescriptive approach to the agencies’ evaluation of investment risk.
We conducted this performance audit from April 2015 to June 2016 in accordance with generally accepted government auditing standards. Those standards require that we plan and perform the audit to obtain sufficient, appropriate evidence to provide a reasonable basis for our findings and conclusions based on our audit objectives. We believe that the evidence obtained provides a reasonable basis for our findings and conclusions based on our audit objectives.
6Among other things, 10 U.S.C. § 2433, the so-called Nunn-McCurdy Act, requires Defense to report to Congress on, and possibly terminate, major defense programs with cost variances that exceed current or original baseline estimates by certain percentages. 7GAO, Defense Acquisitions: Assessments of Selected Weapon Programs, GAO-15-342SP (Washington, D.C.: Mar. 12, 2015).

Appendix II: Selected Agencies’ CIO Rating Processes
Page 39 GAO-16-494 IT Dashboard
Table 14 describes the processes that the selected agencies reported as using to create the Chief Information Officer (CIO) ratings for their investments.
Table 14: Details of the Chief Information Officer (CIO) Rating Processes Reported by Selected Agencies
Agency
Responsibility for drafting the CIO rating Factors used to create the CIO rating
How factors are used to determine the CIO rating
Department of Agriculture (Agriculture)
Capital Planning and Investment Control team, Office of the CIO, Associate CIO
According to Agriculture’s Major and Non‐Major IT Investment Scoring Criteria document, the following factors are used to create the CIO rating for each investment on a monthly basis: • investment overview, which evaluates the completeness of the
business case and supporting documentation; • contract or acquisition strategy, such as, contracts are
awarded competitively, contracts are predominantly performance-based, and contracts that require earned value management have the appropriate clause;
• performance metrics are within pre-defined thresholds; • risk management attributes, such as, the risk management
plan is updated in the last year; the risk register identifies all risks identified elsewhere in the investment’s business case submission and is updated in the last month, risk mitigation strategies are in place and adequate, risk assessments are performed and documented at least quarterly;
• program and project management, and project execution (skills or certifications of program or project management) in contract and acquisition strategy, performance, and risk management; and
• all required documents have been updated, and approved with version control, at the appropriate intervals.
Each weighted factor is assigned a score from 1 to 5. The scores are then averaged to determine an overall score.
Department of Commerce (Commerce)
Capital Planning and Investment Control team, Office of the CIO
Commerce officials stated that the following factors are used to create the CIO rating for each investment: • transparency of the investment’s management; • monthly cost and schedule variances including earned value
data, when available; • risk data is updated each month and risk registers are
requested periodically; • performance data; • reports that identify expected and actual monthly
accomplishments, significant issues, and top risks; • re-baseline requests, which must also include a master
integrated schedule; and • security.
A qualitative review of the factors and the quality of the information provided.
Appendix II: Selected Agencies’ CIO Rating Processes

Appendix II: Selected Agencies’ CIO Rating Processes
Page 40 GAO-16-494 IT Dashboard
Agency
Responsibility for drafting the CIO rating Factors used to create the CIO rating
How factors are used to determine the CIO rating
Department of Defense (Defense)
Office of the CIO According to Defense’s CIO Ratings Process for the Federal IT Dashboard, on a semi-annual basis, each investment’s CIO rating is based upon recommended ratings from component CIOs as well as the following factors: • risk; • cost, schedule, and performance; and • maturity. Defense also considers external assessments and reports published by GAO and the Inspector General, as well as program assessments, and draft audit reports. Early achievement of milestones will prompt an out-of-cycle update to the Dashboard.
A qualitative assessment of the factors.
Department of Education (Education)
Office of IT Program Services
Education officials described the following bi-monthly review and factors used to create the CIO rating for each investment: • number of active projects; • project and operational risks; • life cycle and performance metrics on a monthly, quarterly,
semi-annual, and annual basis; • cost and schedule variances and actuals; • number of awarded contracts; • achievement of milestones; and • risk mitigation plans are in place.
Each factor is scored from 1 to 5, weighted, and then averaged.
Department of Energy (Energy)
Office of the CIO Staff According to Energy’s OMB IT Dashboard Standard Operating Procedure, the following factors are used to create the CIO rating for each investment on a monthly basis: • cost and schedule variances; • control review (a quarterly assessment of project management
qualifications, cost and schedule variances, performance goal variances, and earned value management);
• risk management (an assessment of the current process for identifying, prioritizing, and managing risk on a regular and on-going basis);
• requirements management (an assessment of the current process for developing and involving stakeholders in the requirements management process);
• contractor oversight (an assessment of government oversight of contractor performance through regular status reports); and
• baseline change (an assessment of the current re-baseline impact on projects and project activities).
A qualitative assessment of the factors.

Appendix II: Selected Agencies’ CIO Rating Processes
Page 41 GAO-16-494 IT Dashboard
Agency
Responsibility for drafting the CIO rating Factors used to create the CIO rating
How factors are used to determine the CIO rating
Department of Health and Human Services (HHS)
Office of the CIO According to HHS’s Portfolio Management Tool User’s Guide, dated January 2016, the following factors, as well as project managers’ suggestions, are used to create the CIO rating for each investment on a monthly basis: • environmental and compliance risk, including visibility, budget
variance, dependency, operational performance, policy and governance compliance, and reporting requirements; and
• health risk, including risk management, life cycle requirements management, contract management, cost and schedule performance, and human capital.
Prior to the release of the 2016 guide, HHS officials stated that the following factors were used to create the CIO rating for each investment: • earned value management, • implementation of enterprise performance life cycle, • preparation of operational analysis, and • operational performance metrics.
Each of the factors is scored and the results are averaged.
Department of Homeland Security (DHS)
Program Compliance Division
According to DHS’s Program Health Assessment Scoring Guideline, CIO investment ratings are based upon program health assessments which gauge how well a program is performing. Investment reviews are staggered based on risk, with high risk (red) investments reviewed monthly, moderate (yellow) investments reviewed quarterly, and low (green) investments reviewed semi-annually. Combined with qualitative investment knowledge, the assessment factors are scored and weighted as follows: • risk management (17 percent - reviews of risk and mitigation
plans and execution); • human capital resources (22 percent - an assessment of the
adequacy of staffing resources including credentials, key staff positions, staffing levels, and oversight);
• cost and schedule performance against targets (22 percent); • contract oversight (9 percent - consistency with department
practices, including an approved acquisition plan, performance-based contracts, use of schedule and cost metrics, where applicable, and consistent oversight); and
• requirements management (30 percent - consistency of requirements planning, development, and management with applicable directives).
The factors are scored, weighted, and summed.

Appendix II: Selected Agencies’ CIO Rating Processes
Page 42 GAO-16-494 IT Dashboard
Agency
Responsibility for drafting the CIO rating Factors used to create the CIO rating
How factors are used to determine the CIO rating
Department of the Interior (Interior)
Strategy, Portfolio Planning and Integration
According to Interior’s investment management guidance, the following factors are used to create the CIO rating for each investment on a monthly basis: • cost and schedule performance against targets (including
earned value data, when available); • operational performance metrics; and • a validation of investment data to ensure documentation is
current. Interior officials stated that the CIO also considers the following factors: • Federal Acquisition Certification for Program and Project
Managers certification of major investment managers; • risk management; • investment artifact compliance; • requirements management (the status of required artifacts); • contractor oversight (the status of the acquisition plan); • informal conversations; • TechStat reviews; and • performance baseline change requests.
A qualitative assessment of the factors.
Department of Labor (Labor)
IT Governance Team within the Office of the CIO
Labor’s IT CPIC Guide: Managing IT Investments states that the CIO’s assessment reflects the overall performance of an investment and may be used to highlight an investment’s risk, schedule delays, budget cuts, or changes in management teams. According to Labor officials on the IT governance team, the following factors are used to create the CIO rating for each investment on a monthly basis: • cost and schedule data, including earned value; • metrics for performance goals, contracts status, risks, and
periodic updates to budget authority dollar amounts; • managers’ certifications and training; • achievement of project milestones; and • individual investment risks.
A qualitative assessment of the factors.
Department of State (State)
e-Government Portfolio Management Office within the CIO organization
According to officials from State’s Office of the CIO, the following factors are used to create the CIO rating for each investment on a monthly basis: • investment reviews that assess risk; • program and project performance, such as cost, schedule,
scope, risks, and performance metrics; • reviews of investment artifacts, such as the project charter,
acquisition plan, alternative analysis, user requirements documentation, system requirements documentation, and project management plan; and
• risk management, such as corrective action plans.
A qualitative assessment of the factors.
Appendix II: Selected Agencies’ CIO Rating Processes
Page 43 GAO-16-494 IT Dashboard
Agency
Responsibility for drafting the CIO rating Factors used to create the CIO rating
How factors are used to determine the CIO rating
Department of Transportation (Transportation)
Office of IT Policy and Oversight
According to Transportation’s Interim Investment Management Process Guidance, CIO ratings are based on proposed ratings from components, which are reviewed and revised as necessary by the Office of the CIO. The department’s Dashboard standard operating procedure states that the office’s review generally focuses on rebaseline events, significant variance indicators, and how well prior concerns have been addressed. Officials also consider the following factors used to create the CIO rating for each investment on a monthly basis: • cost, schedule, and risk management are reviewed by analysts
against cost, schedule, and risk management baselines and re-plans; and
• risk management is reviewed in terms of the quality and completeness of the risk management plan, risk register, program management plan, work breakdown structure, schedule, and budget.
A qualitative assessment of the factors.
Department of the Treasury (Treasury)
Bureau CIOs, Office of the CIO
According to Treasury’s CIO rating scoring factors, there are four equally weighted factors which are used to create the CIO rating for each investment on a monthly basis: • cost and schedule baseline management (whether variances
are within established thresholds); • project risk management (an assessment of the probability and
impact of the investment risk); • maturity (performance measures such as reporting accuracy
and the inclusion of quantifiable baselines, targets, and actual results); and
• discretion of the CIO. In addition to the factors above, Treasury’s Capital Planning and Investment Control guide describes a process whereby components can provide draft CIO comments. CIO officials also stated that they consider the maturity of the organization and its ability to perform based on the quality, accuracy, and consistency of their reporting.
The factors are scored, weighted, and summed.

Appendix II: Selected Agencies’ CIO Rating Processes
Page 44 GAO-16-494 IT Dashboard
Agency
Responsibility for drafting the CIO rating Factors used to create the CIO rating
How factors are used to determine the CIO rating
Department of Veterans Affairs (VA)
Program Planning and Oversight Management Representatives within the Office of the CIO
According to VA officials, the following factors are used to create the CIO rating for each investment on a monthly basis: • risk management (a strategy exists, the risks are clearly
prioritized, the log is current and complete, and mitigation plans are in place to address the risks);
• requirements management (the investment objectives are clear and the scope is controlled, requirements are clear and validated, appropriate stakeholders are involved in the requirements definition, and the investment charter is in place, current, and signed);
• contractor oversight (the agency is providing appropriate management of contractors such that the government is monitoring, controlling, and mitigating the impact of any adverse contract performance);
• historical performance (cost and schedule metrics are within established thresholds); and
• human capital (qualified management team is within the vacancy rate thresholds).
The factors are scored, averaged, and combined with a qualitative assessment of the investment.
Environmental Protection Agency (EPA)
Senior Information Officers and Information Management Officers within the Office of the CIO
According to EPA officials, the following factors are used to create the CIO rating for each investment on a monthly basis: • risk management (completeness and timeliness of plan of
action and milestones, risk management plan, authorization to operate);
• requirements management; • contractor oversight; • historical performance (cost and schedule variances); • human capital; and • other factors that are important to forecasting future success.
The factors are scored, which guides a qualitative assessment.
General Services Administration (GSA)
IT Portfolio Management Team within the Office of the CIO
According to GSA’s IT Guide to Capital Planning and Investment Control, the following factors are used to create the CIO rating for each investment on a monthly basis: • earned value management, • performance measures, • contractor oversight / vendor management, and • risks. Officials added that project managers are required to submit monthly investment reports which include the above data, as well as risk management plans, operational analyses, alternative analyses, a project charter, and the number of baseline change requests. According to officials, the agency plans to move to a process that includes a quantitative assessment of investment risk.
A qualitative assessment of the factors.

Appendix II: Selected Agencies’ CIO Rating Processes
Page 45 GAO-16-494 IT Dashboard
Agency
Responsibility for drafting the CIO rating Factors used to create the CIO rating
How factors are used to determine the CIO rating
Office of Personnel Management (OPM)
CIO According to OPM’s rating process documentation, CIO ratings are based upon OMB’s factors as well as the following factors that are used to create the CIO rating for each investment on a monthly basis: • performance measurement, • security and privacy (e.g., whether the information system
security plan is current and the Privacy Impact Assessment screening is approved by the CIO),
• project management (e.g., management certifications and the use of earned value tools),
• technology management (such as compliance with all enterprise architecture and technology standards and the lack of dated or aging technology), and
• investment outlook (factors that would impact delivery of the investment within planned cost and schedule milestones).
A qualitative assessment of the factors and lessons learned.
Social Security Administration (SSA)
Deputy Commissioner for Systems and CIO, Program Managers, and IT Finance Management and Support
According to officials from SSA, the CIO rating for each investment is a quarterly assessment based on OMB’s factors as well as their knowledge of the health or risk of each investment, evolving or emerging contextual issues, cost and schedule performance (based on earned value), and operational performance metrics.
A qualitative assessment of the factors.
Source: GAO analysis of agencies’ process documentation and interviews with relevant officials. | GAO-16-494

Appendix III: Agencies and InvestmentsSelected for Review
Page 46 GAO-16-494 IT Dashboard
Table 15 lists the selected agencies and investments, including those which we exempted (as discussed in appendix I and shaded in gray), as well as the associated Chief Information Officer (CIO) ratings and our assessments.
Table 15: Agencies and Investments Selected for Review, Associated Chief Information Officer (CIO) Ratings, and Our Assessments
Agency Investment title April 2015 CIO rating
GAO assessment
Department of Agriculture
Optimized Computing Environment Green Red
Department of Commerce
Commerce Business Application Solutions Yellow Census Enterprise Data Collection and Processing Yellow Red Fee Processing Next Generation Green Yellow National Weather Service Integrated Dissemination Program Yellow Green Radio Spectrum Management - Federal Spectrum Management System Red Patent End-to-End 2 Yellow Yellow Patent Trial and Appeal Board End to End Green Yellow Trademark Next Generation External Green Yellow 2020 Decennial Census Research and Testing, Operational Development, and Systems Testing, Fiscal Year 2015 – Fiscal Year 2018
Yellow Yellow
Patents End-to-End: Software Engineering Yellow Yellow Trademark Next Generation 2 Green Yellow
Department of Defense Air Force Nuclear Command and Control Communications—Minimum Essential Emergency Communications Network Modernization
Green Red
Air and Space Operations Center-Weapon System Increment 10.2 Green Yellow Air Force Integrated Personnel and Pay System Green Red Airborne and Maritime/Fixed Station Joint Tactical Radio System Red Yellow Area Common User System Modernization Green Red Aviation Tactical Communication Systems Green Red Base Information Transport Infrastructure Wired Green Yellow Consolidated Afloat Network Enterprise Services Green Red Defense Enterprise Accounting and Management System-Increment 1 Green Red Department of Defense Healthcare Management System Modernization Green Red Distributed Common Ground System-Army Increment 1 Green Yellow High Performance Computing Modernization Program Green Red Installation Information Infrastructure Modernization Program Green Red integrated Electronic Health Record Increment 1 Yellow Integrated Personnel and Pay System-Army Increment 2 Green Red
Appendix III: Agencies and Investments Selected for Review

Appendix III: Agencies and Investments Selected for Review
Page 47 GAO-16-494 IT Dashboard
Agency Investment title April 2015 CIO rating
GAO assessment
Joint Battle Command-Platform Green Red Joint Interoperability Test Command Green Joint Precision Approach And Landing Systema Green Red Joint Space Operations Center Mission System Increment 1 Green Joint Space Operations Center Mission System Increment 2 Green Red Joint Tactical Radio System Handheld, Manpack, and Small Form Fit Radios Red Red Military Health System Information Technology Research Projects Green Mid-tier Networking Vehicular Radio Green Yellow Mission Planning Systems - Hardware Technical Refresh Green Next Generation Operational Control System Red Red Signal Modernization Program Green Red Tactical Airspace Integration System Green Green Tactical Mission Command Yellow Red Warfighter Information Network-Tactical Increment 2 Red Red Warfighter Information Network-Tactical Increment 3 Red Yellow
Department of Education
Contracts and Purchasing Support System Green Yellow Data Challenges and Appeals Solution Red Yellow Educational Assessment Green Yellow Enterprise Trusted Internet Connection Green Yellow Institute of Education Sciences Knowledge Utilization Yellow Green
Department of Energy Office of Energy Efficiency and Renewable Energy Revised Enterprise Integration
Green Yellow
Identity, Credential, and Access Management Yellow Green Department of Health and Human Services
Accountable Care Organizations Yellow Yellow Federally Facilitated Marketplace Green Yellow International Classification of Diseases, 10th Revision Initiative Red Yellow Medicaid and Children’s Health Insurance Program Business Information and Solutions
Red Yellow
Master Data Management Yellow Red Medicare-Medicaid Financial Alignment Red Yellow Physician Feedback Program Green Yellow Federal Health Architecture Green Yellow Office of Medicare Hearings and Appeals Electronic Case Adjudication Processing Environment
Yellow Red
Department of Homeland Security
Command, Control, Communications, Computers, Intelligence, Surveillance, and Reconnaissance
Green Green
Continuous Diagnostics and Mitigation Yellow Green Next Generation Networks Priority Services Green Red

Appendix III: Agencies and Investments Selected for Review
Page 48 GAO-16-494 IT Dashboard
Agency Investment title April 2015 CIO rating
GAO assessment
National Flood Insurance Program IT Phoenix Red Red Remote Video Surveillance Systems Yellow Red TECS Modernization Red Yellow United States Citizenship and Immigration Services – Transformation Yellow Red
Department of the Interior
Integrated Reporting of Wildland-Fire Information Yellow Yellow
Department of Labor Digital Government Integrated Platform Green Strategic Enforcement Achieves Compliance System and Prevailing Wage System
Yellow
Department of State Architecture Services Green Yellow Budget System Modernization Green Yellow Electronic Medical Record Yellow Red Global e-Travel Program Green Green
Department of Transportation
Automatic Dependent Surveillance-Broadcast Green Red Aeronautical Information Management Program Segment 2 Green Green Common Support Services Weather Green Green Data Communications NextGen Support (DataComm) Green Yellow En Route Automation Modernization System Enhancements and Tech Refresh
Green Yellow
NextGen Research and Development Portfolio Green Yellow NextGen National Airspace System Voice System Green Red NextGen Weather Processor Green Yellow Runway Status Lights Green Green System Approach for Safety Oversight Green Green System Wide Information Management Green Yellow Terminal Flight Data Manager Green Yellow Unified Registration System Yellow Red Wide Area Augmentation System Green Yellow Next Generation Air/Ground Communications (NEXCOM) Segment 2 Green Yellow
Department of the Treasury
Customer Account Data Engine 2 Green Yellow Foreign Account Tax Compliance Act Green Yellow Post Payment System Green Red Enterprise Case Management Green Web Applications Green
Department of Veterans Affairs
Interagency 21st Century One Vet Green Red
Environmental Protection Agency
eManifest Yellow Red

Appendix III: Agencies and Investments Selected for Review
Page 49 GAO-16-494 IT Dashboard
Agency Investment title April 2015 CIO rating
GAO assessment
General Services Administration
Integrated Award Environment Yellow Green Office of Enterprise Infrastructure Green Green Order Management Service Yellow Yellow
Office of Personnel Management
Human Resources Line of Business Green
Social Security Administration
Customer Engagement Tools Yellow Yellow Disability Case Processing System Red Yellow Earnings Redesign Green Green Electronic Services Green Red Infrastructure – Modernization Yellow Yellow Intelligent Disability Green Yellow National Support Center Green Green SMART Claim Green Red Supplemental Security Income Modernization Green Red
Source: GAO analysis of IT Dashboard and agencies’ data. | GAO-16-494 aAccording to Department of Defense officials, as of June 2015 the Joint Precision Approach And Landing System is no longer a major IT investment.

Appendix IV: Comments from the Department of Commerce
Page 50 GAO-16-494 IT Dashboard
Appendix IV: Comments from the Department of Commerce

Appendix IV: Comments from the Department of Commerce
Page 51 GAO-16-494 IT Dashboard

Appendix V: Comments from the Department of Defense
Page 52 GAO-16-494 IT Dashboard
Appendix V: Comments from the Department of Defense

Appendix V: Comments from the Department of Defense
Page 53 GAO-16-494 IT Dashboard

Appendix VI: Comments from the Department of Education
Page 54 GAO-16-494 IT Dashboard
Appendix VI: Comments from the Department of Education

Appendix VI: Comments from the Department of Education
Page 55 GAO-16-494 IT Dashboard

Appendix VII: Comments from the Department of Energy
Page 56 GAO-16-494 IT Dashboard
Appendix VII: Comments from the Department of Energy
Appendix VII: Comments from the Department of Energy
Page 57 GAO-16-494 IT Dashboard

Appendix VIII: Comments from the Department of Health and Human Services
Page 58 GAO-16-494 IT Dashboard
Appendix VIII: Comments from the Department of Health and Human Services

Appendix VIII: Comments from the Department of Health and Human Services
Page 59 GAO-16-494 IT Dashboard

Appendix IX: Comments from the Department of Homeland Security
Page 60 GAO-16-494 IT Dashboard
Appendix IX: Comments from the Department of Homeland Security

Appendix IX: Comments from the Department of Homeland Security
Page 61 GAO-16-494 IT Dashboard

Appendix X: Comments from the Department of the Interior
Page 62 GAO-16-494 IT Dashboard
Appendix X: Comments from the Department of the Interior

Appendix XI: Comments from the Department of State
Page 63 GAO-16-494 IT Dashboard
Appendix XI: Comments from the Department of State

Appendix XI: Comments from the Department of State
Page 64 GAO-16-494 IT Dashboard

Appendix XII: Comments from the Department of Veterans Affairs
Page 65 GAO-16-494 IT Dashboard
Appendix XII: Comments from the Department of Veterans Affairs

Appendix XII: Comments from the Department of Veterans Affairs
Page 66 GAO-16-494 IT Dashboard

Appendix XIII: Comments from the Environmental Protection Agency
Page 67 GAO-16-494 IT Dashboard
Appendix XIII: Comments from the Environmental Protection Agency

Appendix XIII: Comments from the Environmental Protection Agency
Page 68 GAO-16-494 IT Dashboard

Appendix XIV: Comments from the Office of Personnel Management
Page 69 GAO-16-494 IT Dashboard
Appendix XIV: Comments from the Office of Personnel Management

Appendix XV: Comments from the Social Security Administration
Page 70 GAO-16-494 IT Dashboard
Appendix XV: Comments from the Social Security Administration

Appendix XV: Comments from the Social Security Administration
Page 71 GAO-16-494 IT Dashboard

Appendix XV: Comments from the Social Security Administration
Page 72 GAO-16-494 IT Dashboard

Appendix XVI: GAO Contact and Staff Acknowledgments
Page 73 GAO-16-494 IT Dashboard
David A. Powner, (202) 512-9286 or [email protected]
In addition to the contact named above, individuals making contributions to this report included Dave Hinchman (Assistant Director), Karl Seifert (Assistant Director), Kevin Walsh (Assistant Director), Andrew Banister, Rebecca Eyler, Sandra Kerr, and Meredith Raymond.
Appendix XVI: GAO Contact and Staff Acknowledgments
GAO Contact
Staff Acknowledgments
(100086)

The Government Accountability Office, the audit, evaluation, and investigative arm of Congress, exists to support Congress in meeting its constitutional responsibilities and to help improve the performance and accountability of the federal government for the American people. GAO examines the use of public funds; evaluates federal programs and policies; and provides analyses, recommendations, and other assistance to help Congress make informed oversight, policy, and funding decisions. GAO’s commitment to good government is reflected in its core values of accountability, integrity, and reliability.
The fastest and easiest way to obtain copies of GAO documents at no cost is through GAO’s website (http://www.gao.gov). Each weekday afternoon, GAO posts on its website newly released reports, testimony, and correspondence. To have GAO e-mail you a list of newly posted products, go to http://www.gao.gov and select “E-mail Updates.”
The price of each GAO publication reflects GAO’s actual cost of production and distribution and depends on the number of pages in the publication and whether the publication is printed in color or black and white. Pricing and ordering information is posted on GAO’s website, http://www.gao.gov/ordering.htm.
Place orders by calling (202) 512-6000, toll free (866) 801-7077, or TDD (202) 512-2537.
Orders may be paid for using American Express, Discover Card, MasterCard, Visa, check, or money order. Call for additional information.
Connect with GAO on Facebook, Flickr, Twitter, and YouTube. Subscribe to our RSS Feeds or E-mail Updates. Listen to our Podcasts and read The Watchblog. Visit GAO on the web at www.gao.gov.
Contact:
Website: http://www.gao.gov/fraudnet/fraudnet.htm E-mail: [email protected] Automated answering system: (800) 424-5454 or (202) 512-7470
Katherine Siggerud, Managing Director, [email protected], (202) 512-4400, U.S. Government Accountability Office, 441 G Street NW, Room 7125, Washington, DC 20548
Chuck Young, Managing Director, [email protected], (202) 512-4800 U.S. Government Accountability Office, 441 G Street NW, Room 7149 Washington, DC 20548
GAO’s Mission
Obtaining Copies of GAO Reports and Testimony
Order by Phone
Connect with GAO
To Report Fraud, Waste, and Abuse in Federal Programs
Congressional Relations
Public Affairs
Please Print on Recycled Paper.