games workshop group plc€¦ · games workshop group plc 0115 900 4003 kevin rountree, ceo rachel...
TRANSCRIPT

PRESS ANNOUNCEMENT
GAMES WORKSHOP GROUP PLC
8 January 2016
HALF-YEARLY REPORT AND TRADING UPDATE Games Workshop Group PLC (“Games Workshop” or the “Group”) announces its half-yearly results for the six months to 29 November 2015.
Highlights:
Six months to
Six months to
29 November 30 November
2015 2014
Revenue £55.3m £56.5m
Revenue at constant currency* £56.9m £56.5m
Operating profit pre-royalties receivable £4.7m £5.5m
Royalties receivable £1.5m £0.7m
Operating profit £6.2m £6.2m
Pre-tax profit £6.3m £6.3m
Cash generated from operations £8.6m £7.8m
Basic earnings per share 14.9p 14.5p
Dividend per share declared in the period 20p 36p
Kevin Rountree, CEO of Games Workshop, said: “We have made some good progress on our strategic initiatives all focused on delivering long term growth. Whilst we are disappointed with the decline in return on capital reported in the period, we are all confident that we are focused on delivering the necessary changes to address this decline. In the period we launched some great new products and our new visitor centre has performed well. December sales were below expectations across the Group. At this stage in the Company’s financial year, the Company’s internal projections indicate that pre-tax profit for the year to 29 May 2016 is unlikely to exceed £16 million. A further update will be made when appropriate. “
…Ends…
For further information, please contact: Games Workshop Group PLC 0115 900 4003 Kevin Rountree, CEO Rachel Tongue, Group finance director Investor relations website investor.games-workshop.com General website www.games-workshop.com
*Constant currency revenue is calculated by comparing results in the underlying currencies for 2014 and 2015, both converted at the average exchange rates for the six months ended 30 November 2014.

FIRST HALF HIGHLIGHTS
Six months to
Six months to 29 November 30 November 2015 2014
Revenue £55.3m £56.5m
Revenue at constant currency* £56.9m £56.5m
Operating profit pre-royalties receivable £4.7m £5.5m
Royalties receivable £1.5m £0.7m
Operating profit £6.2m £6.2m
Pre-tax profit £6.3m £6.3m
Cash generated from operations £8.6m £7.8m
Basic earnings per share 14.9p 14.5p
Dividends per share declared in the period 20p 36p
Revenue by segment
Six months to
Six months to
Six months to
Six months to 29 November 30 November 29 November 30 November 2015 2014 2015 2014 Constant
currency Constant currency
Actual rates
Actual rates
Trade £22.3m £22.0m £22.4m £22.0m Retail £23.0m £23.4m £21.5m £23.4m Mail Order £11.6m £11.1m £11.4m £11.1m
INTERIM MANAGEMENT REPORT We have made some good progress on our strategic initiatives all focused on delivering long term growth. Whilst we are disappointed with the decline in return on capital reported in the period, we are all confident that we are focused on delivering the necessary changes to address this decline. In the period we launched some great new products and our new visitor centre has performed well. We are focused on delivering value. Our key measure of our performance is return on capital. During the period our return on capital fell from 38% at November 2014 to 36%. This was driven by both an increase in average capital employed** and a decline in operating profit before royalties receivable. Trading update December sales were below expectations across the Group. At this stage in the Company’s financial year, the Company’s internal projections indicate that pre-tax profit for the year to 29 May 2016 is unlikely to exceed £16 million. A further update will be made when appropriate. Sales Reported sales fell by 2.2% to £55.3 million for the period. On a constant currency basis, sales were up by 0.7% from £56.5 million to £56.9 million; split by channel this comprised: retail £23.0 million (2014: £23.4 million), trade £22.3 million (2014: £22.0 million) and mail order £11.6 million (2014: £11.1 million). Retail This channel showed growth in non-core retail but was offset by declines in our core retail business. However on a constant currency basis sales were broadly in line with last year. We opened, including relocations, 22 one man store format stores and three multi man format stores in the period. We also started our trial of four multi man format stores in high footfall locations; Sydney, Munich, Paris and Copenhagen. After closing 13 stores, our net total number of stores at the end of the period is 430. The key priority is store manager recruitment. On 9 November 2015, I appointed an expert in recruitment to my management team. This person will ensure we have a constant supply of retail store managers and trade recruiters and account developers. She will also work with me to review our global people strategy. Trade All key territories were broadly in line with last year. In the period, our net number of trade outlets increased by 61 accounts.

To broaden our core trade product reach, in the period, we have designed a small new product range and are at present actively signing up distribution agents to sell this product into North America. We continue to work on other product formats to optimise other opportunities. Mail order Sales in our online shops were up 5.3%. Non-core This includes licensing, digital, export, the visitor centre, non-strategic trade accounts, book trade, magazine and mass-market opportunities. Non-core sales were down by 2.5% from £7.8 million to £7.6 million due to declines in sales in digital, export and the book trade offset by growth in visitor centre and non-strategic trade sales. In the period, royalties receivable from licensing increased from £0.7 million to £1.5 million. Operating profit Core business operating profit (operating profit before royalty income) fell by £0.8 million to £4.7 million (2014: £5.5 million). On a constant currency basis, core business operating profit increased by £0.1 million to £5.6 million. The net impact in the six months to 29 November 2015 of exchange rate fluctuations was a loss of £0.9 million. It is not the Group’s policy to hedge against foreign exchange exposure. Operating expenses increased by £0.3 million due to an investment in sales facing activities relating to new retail store costs. Costs remain a key area of focus. Capital employed Average capital employed** increased by £3.3 million to £40.8 million. The book value of tangible and intangible assets increased by £2.6 million, mainly due to the refurbishment of the visitor centre whilst trade and other receivables increased by £1.0 million, inventory increased by £0.6 million, provisions fell by £0.6 million and current liabilities increased by £1.5 million. Cash generation During the period, the Group’s core operating activities generated £6.6 million of cash after tax payments (2014: £5.5 million). The Group also received cash of £1.1 million in respect of royalties in the year (2014: £1.0 million). After purchases of tangible and intangible assets and product development costs of £6.3 million (2014: £5.1 million) and dividends of £6.4 million (2014: £11.5 million) there were net funds at the end of the period £7.8 million (2014: £8.4 million). Projects We have three major projects being implemented currently: European ERP system replacement (enterprise resource planning) - on track. Forge World mail order store - this store was launched in August 2015 on time and within cash limits. Mail order warehouse system replacement - complicated project currently postponed until after the busy December trading period. Risks and uncertainties The board has overall responsibility for ensuring risk is appropriately managed across the Group. As discussed in the 2015 annual report, the top five risks to the Group are reviewed at each board meeting. The risks are rated as to their business impact and their likelihood of occurring. In addition, the Group has a disaster recovery plan to ensure ongoing operations are maintained in all circumstances. The principal risks for the balance of the year are the same as those identified in the 2015 annual report and are discussed below: ERP change. This is a complicated project with the risk of widespread business disruption if it is not implemented well. Store manager recruitment. This comprises both recruitment of managers for new stores as well as replacing poor performing managers. Retail is our primary method of recruiting new customers and so we need great managers in all our stores. Supply chain. We are changing our mail order warehouse system. This is part of an ongoing programme of continuous improvement for these warehouse systems. As with any system change there are risks associated with the transition. Range management. We constantly review our range to ensure that we are exploring all opportunities. Distractions. Anything else that gets in the way of us delivering our goals.
The greatest risk is the same one that we repeat each year, namely, management. So long as we have great people we will be fine. Problems will arise if the board allows egos and private agendas to rule. I will do my utmost to ensure that this does not happen. Going concern After making appropriate enquiries, the directors have a reasonable expectation that the Group has adequate resources to continue in operational existence for the foreseeable future. For this reason they have adopted the going concern basis in preparing this condensed consolidated interim financial information. Statement of directors’ responsibilities The directors confirm that this condensed consolidated interim financial information has been prepared in accordance with IAS 34, ‘Interim Financial Reporting’, as adopted by the European Union, and that the interim management report herein includes a fair review of the information required by DTR 4.2.7 and DTR 4.2.8, namely: an indication of important events that have occurred during the first six months and their impact on the condensed set of financial statements, and a description of (i) the principal risks and uncertainties for the remaining six months of the financial year; (ii) material related-party transactions in the first six months and (iii) any material changes in the related-party transactions described in the last annual report. There have been no other changes to the board since the annual report for the year to 31 May 2015. A list of all current directors is maintained on the investor relations website at investor.games-workshop.com. By order of the board K D Rountree CEO R F Tongue Group finance director 8 January 2016 *Constant currency revenue is calculated by comparing results in the underlying currencies for 2014 and 2015, both converted at the average exchange rates for the six months ended 30 November 2014.
**We use average capital employed to take account of the significant fluctuation in working capital which occurs as the business builds both inventories and trade receivables in the pre-Christmas trading period. Return is defined as pre-exceptional operating profit before royalty income, and the average capital employed is adjusted by deducting assets and adding back liabilities in respect of cash, borrowings, exceptional provisions, taxation and dividends.
CONSOLIDATED INCOME STATEMENT
Six months to
Six months to
Year to* 29 November 30 November 31 May 2015 2014 2015 Notes £000 £000 £000 Revenue 2 55,259 56,503 119,132 Cost of sales (16,802) (17,526) (36,988) ---------- ---------- ---------- Gross profit 38,457 38,977 82,144 Operating expenses (33,753) (33,451) (67,165) Other operating income – royalties receivable 1,536 711 1,498 ---------- ---------- ---------- Operating profit 2 6,240 6,237 16,477 Finance income 47 48 109 Finance costs - - (1) ---------- ---------- ---------- Profit before taxation 4 6,287 6,285 16,585 Income tax expense 5 (1,506) (1,643) (4,328) ---------- ---------- ---------- Profit attributable to owners of the parent 4,781 4,642 12,257 ====== ====== ====== Basic earnings per ordinary share 6 14.9p 14.5p 38.3p Diluted earnings per ordinary share 6 14.9p 14.5p 38.3p Basic earnings per ordinary share – pre-exceptional items 6 14.9p 14.5p 38.2p Diluted earnings per ordinary share – pre-exceptional items 6 14.9p 14.5p 38.1p
CONSOLIDATED STATEMENT OF COMPREHENSIVE INCOME AND EXPENSE
Six months to
Six months to
Year to 29 November 30 November 31 May 2015 2014 2015 £000 £000 £000 Profit attributable to owners of the parent 4,781 4,642 12,257 Other comprehensive (expense)/income Items that may be reclassified to profit or loss Exchange differences on translation of foreign operations (140) 409 (473) ---------- ---------- ---------- Other comprehensive (expense)/ income for the period (140) 409 (473) ---------- ---------- ---------- Total comprehensive income attributable to owners of the parent 4,641 5,051 11,784 ====== ====== ======
The following notes form an integral part of this condensed consolidated interim financial information. *Results for the year to 31 May 2015 include an exceptional credit of £42,000 being the release of amounts previously provided for the continental european reorganisation. These are included within operating expenses within the product and supply segment.

CONSOLIDATED BALANCE SHEET
As at
As at
As at 29 November 30 November 31 May 2015 2014 2015 Notes £000 £000 £000 Non-current assets Goodwill 1,433 1,433 1,433 Other intangible assets 8 9,409 8,030 8,262 Property, plant and equipment 9 22,588 21,370 22,719 Trade and other receivables 1,220 1,263 1,195 Deferred tax assets 3,289 4,455 3,621 ---------- ---------- ---------- 37,939 36,551 37,230 ---------- ---------- ---------- Current assets Inventories 9,404 8,794 7,625 Trade and other receivables 10,195 9,211 9,425 Current tax assets 833 885 600 Cash and cash equivalents 7,781 8,410 12,561 ---------- ---------- ---------- 28,213 27,300 30,211 ---------- ---------- ---------- Total assets 66,152 63,851 67,441 ---------- ---------- ---------- Current liabilities Trade and other payables (12,555) (11,066) (13,131) Current tax liabilities (1,950) (840) (1,434) Provisions 10 (674) (1,279) (529) ---------- ---------- ---------- (15,179) (13,185) (15,094) ---------- ---------- ---------- Net current assets 13,034 14,115 15,117 ---------- ---------- ---------- Non-current liabilities Other non-current liabilities (308) (332) (364) Provisions 10 (577) (569) (458) ---------- ---------- ---------- (885) (901) (822) ---------- ---------- ---------- Net assets 50,088 49,765 51,525 ====== ====== ====== Capital and reserves Called up share capital 1,605 1,603 1,603 Share premium account 10,435 10,177 10,218 Other reserves 1,042 2,064 1,182 Retained earnings 37,006 35,921 38,522 ---------- ---------- ---------- Total equity 50,088 49,765 51,525 ====== ====== ====== The following notes form an integral part of this condensed consolidated interim financial information.

CONSOLIDATED STATEMENT OF CHANGES IN TOTAL EQUITY
Called up Share share premium Other Retained Total capital account reserves earnings equity £000 £000 £000 £000 £000 At 31 May 2015 1,603 10,218 1,182 38,522 51,525 Profit for the six months to 29 November 2015 - - - 4,781 4,781 Exchange differences on translation of foreign operations - - (140) - (140) ---------- ---------- ---------- ---------- ---------- Total comprehensive (expense)/income for the period - - (140) 4,781 4,641 Transactions with owners: Share-based payments - - - 77 77 Shares issued under employee sharesave scheme 2 217 - - 219 Deferred tax credit relating to share options - - - 30 30 Current tax credit relating to exercised share options - - - 9 9 Dividends paid to Company shareholders - - - (6,413) (6,413) ---------- ---------- ---------- ---------- ----------
Total transactions with owners 2 217 - (6,297) (6,078) ---------- ---------- ---------- ---------- ---------- At 29 November 2015 1,605 10,435 1,042 37,006 50,088 ====== ====== ====== ====== ======
Called up Share share premium Other Retained Total capital account reserves earnings equity £000 £000 £000 £000 £000 At 1 June 2014 1,593 9,490 1,655 42,656 55,394 Profit for the six months to 30 November 2014 - - - 4,642 4,642 Exchange differences on translation of foreign operations - - 409 - 409 ---------- ---------- ---------- ---------- ---------- Total comprehensive income for the period - - 409 4,642 5,051 Transactions with owners: Share-based payments - - - 94 94 Shares issued under employee sharesave scheme 10 687 - - 697 Deferred tax credit relating to share options - - - 30 30 Current tax charge relating to exercised share options - - - (30) (30) Dividends paid to Company shareholders - - - (11,471) (11,471) ---------- ---------- ---------- ---------- ----------
Total transactions with owners 10 687 - (11,377) (10,680) ---------- ---------- ---------- ---------- ---------- At 30 November 2014 1,603 10,177 2,064 35,921 49,765 ====== ====== ====== ====== ======
Called up Share share premium Other Retained Total capital account reserves earnings equity £000 £000 £000 £000 £000 At 1 June 2014 1,593 9,490 1,655 42,656 55,394 Profit for the year to 31 May 2015 - - - 12,257 12,257 Exchange differences on translation of foreign operations - - (473) - (473) ---------- ---------- ---------- ---------- ---------- Total comprehensive (expense)/income for the period - - (473) 12,257 11,784 Transactions with owners: Share-based payments - - - 232 232 Shares issued under employee sharesave scheme 10 728 - - 738 Deferred tax charge relating to share options - - - (71) (71) Current tax credit relating to exercised share options - - - 49 49 Dividends paid to Company shareholders - - - (16,601) (16,601) ---------- ---------- ---------- ---------- ---------- Total transactions with owners 10 728 - (16,391) (15,653) ---------- ---------- ---------- ---------- ---------- At 31 May 2015 1,603 10,218 1,182 38,522 51,525 ====== ====== ====== ====== ======
The following notes form an integral part of this condensed consolidated interim financial information.
CONSOLIDATED CASH FLOW STATEMENT
Six months to
Six months to
Year to 29 November 30 November 31 May 2015 2014 2015 Notes £000 £000 £000 Cash flows from operating activities Cash generated from operations 7 8,569 7,791 25,579 UK corporation tax paid (747) (1,169) (1,912) Overseas tax paid (121) (113) (393) ---------- ---------- ---------- Net cash from operating activities 7,701 6,509 23,274 ---------- ---------- ---------- Cash flows from investing activities Purchases of property, plant and equipment (2,641) (2,739) (6,783) Proceeds on disposal of property, plant and equipment - 10 26 Purchases of other intangible assets (1,485) (90) (1,012) Expenditure on product development (2,185) (2,284) (4,579) Interest received 47 45 115 ---------- ---------- ---------- Net cash from investing activities (6,264) (5,058) (12,233) ---------- ---------- ---------- Cash flows from financing activities Proceeds from issue of ordinary share capital 219 697 738 Interest paid - - (1) Dividends paid to company shareholders (6,413) (11,471) (16,601) ---------- ---------- ---------- Net cash from financing activities (6,194) (10,774) (15,864) ---------- ---------- ---------- Net decrease in cash and cash equivalents (4,757) (9,323) (4,823)
Opening cash and cash equivalents 12,561 17,550 17,550 Effects of foreign exchange rates on cash and cash equivalents
(23)
183
(166)
---------- ---------- ---------- Closing cash and cash equivalents 7,781 8,410 12,561
====== ====== ====== The following notes form an integral part of this condensed consolidated interim financial information.

NOTES TO THE FINANCIAL INFORMATION 1. Basis of preparation The Company is a limited liability company, incorporated and domiciled in the United Kingdom. The address of its registered office is Willow Road, Lenton, Nottingham, NG7 2WS. The Company has its listing on the London Stock Exchange. This condensed consolidated interim financial information does not comprise statutory accounts within the meaning of section 434 of the Companies Act 2006. Statutory accounts for the year ended 31 May 2015 were approved by the board of directors on 27 July 2015 and have been delivered to the Registrar of Companies. The report of the auditors on those accounts was unqualified, did not contain an emphasis of matter paragraph and did not contain any statement under either section 498 (2) or section 498 (3) of the Companies Act 2006. This condensed consolidated interim financial information has not been audited or reviewed pursuant to the Auditing Practices Board guidance on ‘Review of Interim Financial Information’ and does not include all of the information required for full annual financial statements. This condensed consolidated interim financial information for the six months ended 29 November 2015 has been prepared in accordance with the Disclosure and Transparency Rules of the Financial Conduct Authority and with IAS 34, ‘Interim Financial Reporting’ as adopted by the European Union. The condensed consolidated interim financial information should be read in conjunction with the annual financial statements for the year ended 31 May 2015 which have been prepared in accordance with IFRSs as adopted by the European Union. After making appropriate enquiries, the directors have a reasonable expectation that the Group has adequate resources to continue in operational existence for the foreseeable future. For this reason they have adopted the going concern basis in preparing this condensed consolidated interim financial information. This condensed consolidated interim financial information was approved for issue on 8 January 2016. This condensed consolidated interim financial information is available to shareholders and members of the public on the Company’s website at investor.games-workshop.com. The preparation of interim financial information requires management to make judgements, estimates and assumptions that affect the application of accounting policies and the reported amounts of assets and liabilities, income and expense. Actual results may differ from these estimates. In preparing this condensed consolidated interim financial information, the significant judgements made by management in applying the Group’s accounting policies and the key sources of estimation uncertainty were the same as those that applied to the consolidated financial statements for the year ended 31 May 2015. The accounting policies applied are consistent with those of the annual financial statements for the year ended 31 May 2015, as described in those financial statements. Taxes on income in the interim periods are accrued using the tax rate that would be applicable to expected total annual earnings. There are no new standards, amendments to standards or interpretations which have had, or are expected to have a significant impact on the Group. 2. Segment information Segment information reported for the six months to 30 November 2014 has been restated since the last half-yearly report to better reflect the move to a channel based structure. The chief operating decision-maker has been identified as the executive directors. They review the Group’s internal reporting in order to assess performance and allocate resources. Management has determined the segments based on these reports. As Games Workshop is a vertically integrated business, management assesses the performance of sales channels and manufacturing and distribution channels separately. At 29 November 2015, the Group is organised as follows:
- Sales channels. These channels sell product to external customers, through the Group’s network of retail stores, independent retailers and directly via the global web store. The sales channels have been aggregated into segments where they sell products of a similar nature, have similar production processes, similar customers, similar distribution methods, and if they are affected by similar economic factors. The segments are as follows:
- Trade. This sales channel sells globally to independent retailers and also includes the Group’s magazine newsstand business and the distributor sales from the Group’s publishing business (Black Library).
- Retail. This includes sales through the Group’s retail stores, the Group’s visitor centre in Nottingham and global exhibitions.
- Mail order. This includes sales through the Group’s global web stores and digital sales through external affiliates.
- Product and supply. This includes the design and manufacture of the products and incorporates the production facility in the UK and the Group logistics and stock management costs.
- Central costs. These include the Company overheads, head office site costs, and the costs of running the Games Workshop Academy. This also includes adjustments for the profit in stock arising from inter-segment sales.
- Service centre costs. Provides support services (IT, accounting, payroll, personnel, procurement, legal and customer services) to activities across the Group and undertakes strategic projects.
- Royalties. This is royalty income earned from third party licensees after deducting associated licensing costs.

The chief operating decision-maker assesses the performance of each business based on operating profit, excluding share option charges recognised under IFRS 2, ‘Share-based payment’ and charges in respect of the Group’s profit share scheme. This has been reconciled to the Group’s total profit before taxation below. The segment information reported to the executive directors for the periods included in this financial information is as follows:
Six months to Restated
Six months to
Year to 29 November 30 November 31 May 2015 2014 2015 £000 £000 £000 External revenue Trade 22,418 21,967 43,940 Retail 21,457 23,406 49,597 Mail order 11,384 11,130 25,595 ------------- ------------- ------------- Total external revenue 55,259 56,503 119,132 ======== ======== ======== For information, we analyse external revenue further below:
Six months to Restated
Six months to
Year to 29 November 30 November 31 May 2015 2014 2015 £000 £000 £000 Trade UK and Continental Europe 8,424 7,965 15,420 North America 8,716 8,248 17,740 Australia and New Zealand 871 1,058 2,000 Asia 323 268 584 Non-core trade 4,084 4,428 8,196 ------------- ------------- ------------- Total Trade 22,418 21,967 43,940 ------------- ------------- ------------- Retail UK 7,776 8,023 17,496 Continental Europe 5,116 6,844 13,879 North America 4,438 4,486 9,806 Australia and New Zealand 2,350 2,714 5,619 Asia 165 166 317 Non-core retail 1,612 1,173 2,480 ------------- ------------- ------------- Total Retail 21,457 23,406 49,597 ------------- ------------- ------------- Mail order Citadel and Forge World 9,508 8,961 21,120 Non-core mail order 1,876 2,169 4,475 ------------- ------------- ------------- Total Mail order 11,384 11,130 25,595 ------------- ------------- ------------- Total external revenue 55,259 56,503 119,132 ======== ======== ======== Operating expenses by segment are regularly reviewed by the executive directors and are provided below:
Six months to Restated
Six months to
Year to 29 November 30 November 31 May 2015 2014 2015 £000 £000 £000 Trade (4,086) (3,806) (7,945) Retail (17,055) (17,056) (33,934) Mail order (2,207) (2,404) (4,135) Product and supply (1,583) (1,501) (3,069) Central costs (2,697) (3,043) (6,206) Service centre costs (5,822) (5,328) (11,215) Royalties (226) (219) (429) ------------- ------------- ------------- Total segment operating expenses (33,676) (33,357) (66,933) Share-based payment charge (77) (94) (232) ------------- ------------- ------------- Total group operating expenses (33,753) (33,451) (67,165) ======== ======== ========
Total segment operating profit is as follows and is reconciled to profit before taxation below:
Six months to Restated
Six months to
Year to 29 November 30 November 31 May 2015 2014 2015 £000 £000 £000 Operating profit Trade 5,789 5,977 10,971 Retail (2,535) (1,093) (1,010) Mail order 6,231 5,934 14,432 Product and supply 4,129 3,528 8,643 Central costs (2,697) (3,044) (6,179) Service centre costs (5,822) (5,329) (11,217) Royalties 1,222 358 1,069 ------------- ------------- ------------- Total segment operating profit 6,317 6,331 16,709 Share-based payment charge (77) (94) (232) Finance income 47 48 109 Finance costs - - (1) ------------- ------------- ------------- Profit before taxation 6,287 6,285 16,585 ======== ======== ======== The results to 31 May 2015 include an exceptional credit of £42,000 being the release of amounts previously provided for the continental european reorganisation. These are included within operating expenses within the product and supply segment.
3. Dividends A dividend of £6,413,000 (20 pence per share) was declared and paid in the six months to 29 November 2015. A dividend of £6,372,000 (20 pence per share) and a dividend of £5,099,000 (16 pence per share) were declared and paid in the six months to 30 November 2014. Dividends of £16,601,000 were declared and paid during the year ended 31 May 2015. 4. Profit before taxation The following costs have been incurred in the reported periods in respect of ongoing redundancies, inventory provisions, impairments and loss-making retail stores:
Six months to
Six months to
Year to 29 November 30 November 31 May
2015 2014 2015 £000 £000 £000 Redundancy costs and compensation for loss of office 275 620 1,569 Impairment of property, plant and equipment 46 37 9 Net charge to property provisions including closed or loss-making retail stores
377
56
236
Net inventory provision creation 286 163 1,247 5. Tax The taxation charge for the six months to 29 November 2015 is based on an estimate of the full year effective rate of 24.0% reflecting overseas tax rates which are higher than the UK rate of 20% (2014: 26.1%, reflecting higher overseas tax rates offset by the UK tax rate reducing from 21% to 20% from 1 April 2015).

6. Earnings per share Basic earnings per share Basic earnings per share is calculated by dividing the profit attributable to owners of the parent by the weighted average number of ordinary shares in issue throughout the relevant period.
Six months to
Six months to
Year to 29 November 30 November 31 May 2015 2014 2015 Profit attributable to owners of the parent (£000) 4,781 4,642 12,257 ------------- ------------- ------------- Weighted average number of ordinary shares in issue (thousands) 32,070 31,971 31,975 ------------- ------------- ------------- Basic earnings per share (pence per share) 14.9 14.5 38.3 ======== ======== ======== Basic earnings per share – pre-exceptional items Basic earnings per share – pre-exceptional items is calculated by dividing the profit attributable to owners of the parent, before exceptional items, by the weighted average number of ordinary shares in issue throughout the relevant period.
Six months to
Six months to
Year to 29 November 30 November 31 May 2015 2014 2015 Pre-exceptional profit attributable to owners of the parent (£000) 4,781 4,642 12,215 ------------- ------------- ------------- Weighted average number of ordinary shares in issue (thousands)
32,070
31,971
31,975
------------- ------------- ------------- Basic earnings per share – pre-exceptional items (pence per share)
14.9
14.5
38.2
======== ======== ======== Diluted earnings per share The calculation of diluted earnings per share has been based on profit attributable to owners of the parent and the weighted average number of shares in issue throughout the relevant period, adjusted for the dilution effect of share options outstanding at the period end.
Six months to
Six months to
Year to 29 November 30 November 31 May 2015 2014 2015 Profit attributable to owners of the parent (£000) 4,781 4,642 12,257 ------------- ------------- ------------- Weighted average number of ordinary shares in issue (thousands) 32,070 31,971 31,975 Adjustment for share options (thousands) 74 81 50 ------------- ------------- ------------- Weighted average number of ordinary shares for diluted earnings per share (thousands)
32,144
32,052
32,025
------------- ------------- ------------- Diluted earnings per share (pence per share) 14.9 14.5 38.3 ======== ======== ======== Diluted earnings per share – pre-exceptional items The calculation of diluted earnings per share has been based on profit attributable to owners of the parent, before exceptional items, and the weighted average number of shares in issue throughout the relevant period, adjusted for the dilution effect of share options outstanding at the period end.
Six months to
Six months to
Year to 29 November 30 November 31 May 2015 2014 2015 Profit attributable to owners of the parent (£000) 4,781 4,642 12,215 ------------- ------------- ------------- Weighted average number of ordinary shares in issue (thousands) 32,070 31,971 31,975
Adjustment for share options (thousands) 74 81 50 ------------- ------------- ------------- Weighted average number of ordinary shares for diluted earnings per share (thousands)
32,144
32,052
32,025
------------- ------------- ------------- Diluted earnings per share – pre-exceptional items (pence per share)
14.9
14.5
38.1
======== ======== ========
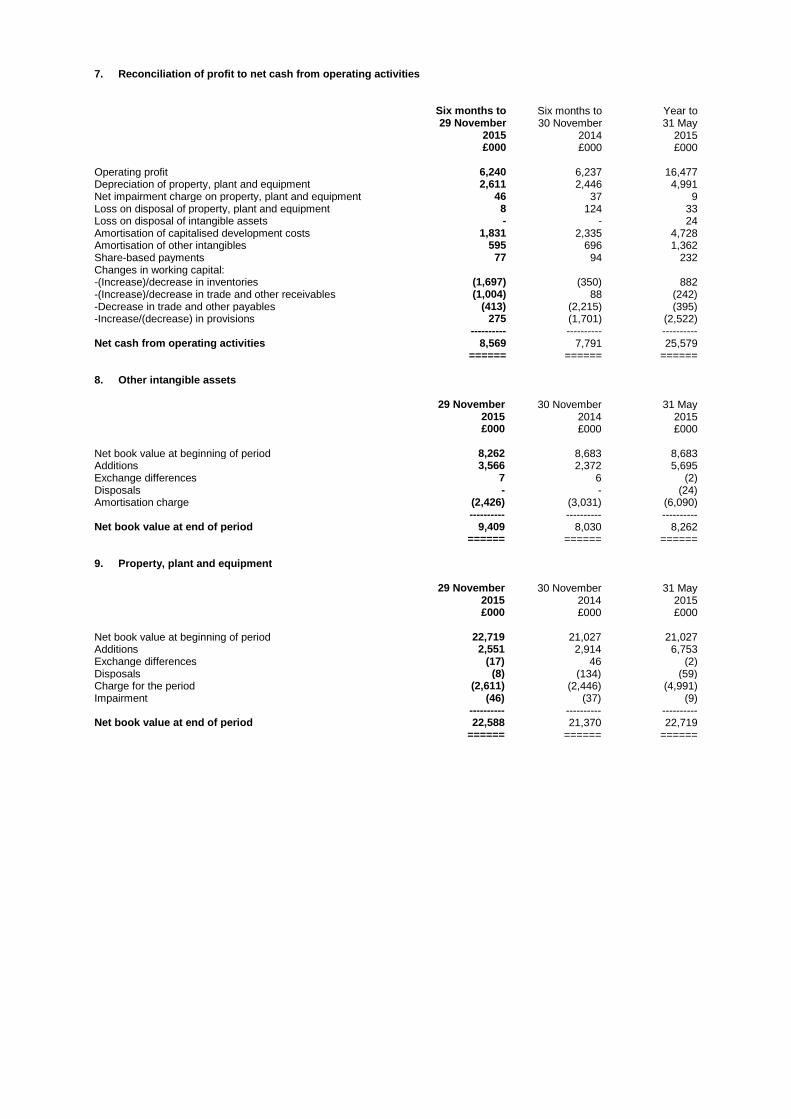
7. Reconciliation of profit to net cash from operating activities
Six months to
Six months to
Year to 29 November 30 November 31 May 2015 2014 2015 £000 £000 £000 Operating profit 6,240 6,237 16,477 Depreciation of property, plant and equipment 2,611 2,446 4,991 Net impairment charge on property, plant and equipment 46 37 9 Loss on disposal of property, plant and equipment 8 124 33 Loss on disposal of intangible assets - - 24 Amortisation of capitalised development costs 1,831 2,335 4,728 Amortisation of other intangibles 595 696 1,362 Share-based payments 77 94 232 Changes in working capital: -(Increase)/decrease in inventories (1,697) (350) 882 -(Increase)/decrease in trade and other receivables (1,004) 88 (242) -Decrease in trade and other payables (413) (2,215) (395) -Increase/(decrease) in provisions 275 (1,701) (2,522) ---------- ---------- ---------- Net cash from operating activities 8,569 7,791 25,579 ====== ====== ====== 8. Other intangible assets 29 November 30 November 31 May 2015 2014 2015 £000 £000 £000 Net book value at beginning of period 8,262 8,683 8,683 Additions 3,566 2,372 5,695 Exchange differences 7 6 (2) Disposals - - (24) Amortisation charge (2,426) (3,031) (6,090) ---------- ---------- ---------- Net book value at end of period 9,409 8,030 8,262 ====== ====== ====== 9. Property, plant and equipment 29 November 30 November 31 May 2015 2014 2015 £000 £000 £000 Net book value at beginning of period 22,719 21,027 21,027 Additions 2,551 2,914 6,753 Exchange differences (17) 46 (2) Disposals (8) (134) (59) Charge for the period (2,611) (2,446) (4,991) Impairment (46) (37) (9) ---------- ---------- ---------- Net book value at end of period 22,588 21,370 22,719 ====== ====== ======
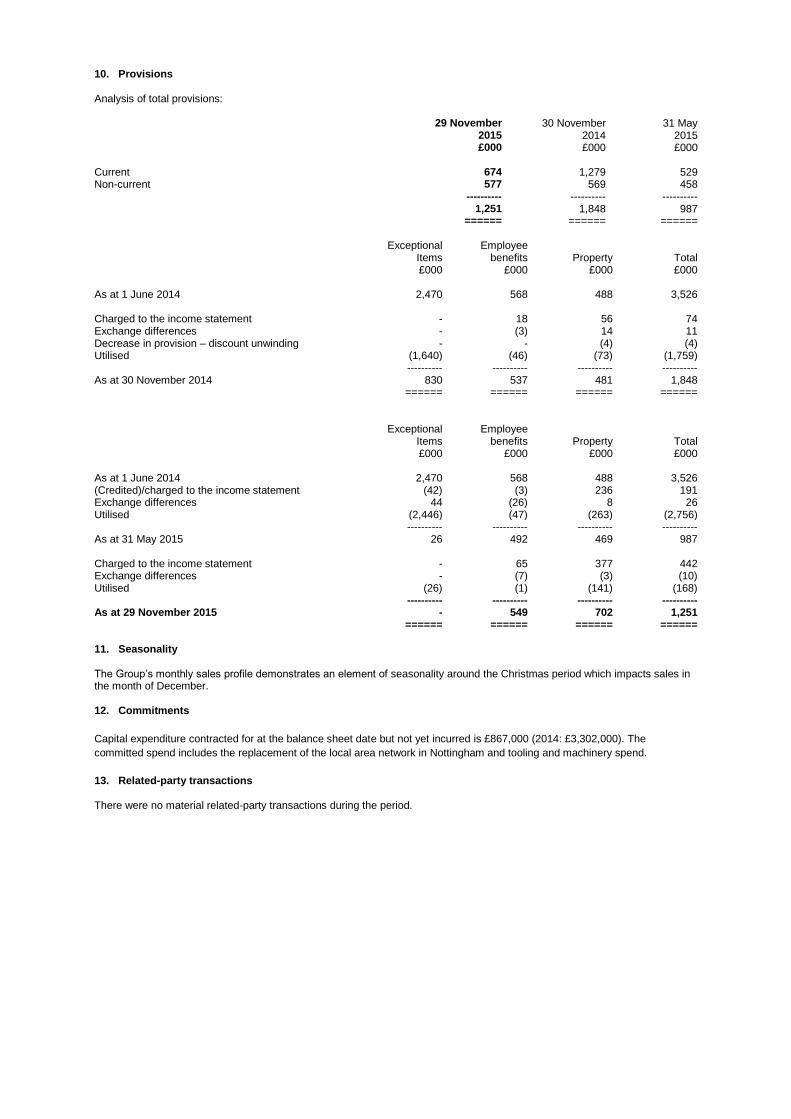
10. Provisions Analysis of total provisions: 29 November 30 November 31 May 2015 2014 2015 £000 £000 £000 Current 674 1,279 529 Non-current 577 569 458 ---------- ---------- ---------- 1,251 1,848 987 ====== ====== ====== Exceptional Employee Items benefits Property Total £000 £000 £000 £000 As at 1 June 2014 2,470 568 488 3,526 Charged to the income statement - 18 56 74 Exchange differences - (3) 14 11 Decrease in provision – discount unwinding - - (4) (4) Utilised (1,640) (46) (73) (1,759) ---------- ---------- ---------- ---------- As at 30 November 2014 830 537 481 1,848 ====== ====== ====== ======
Exceptional Employee Items benefits Property Total £000 £000 £000 £000 As at 1 June 2014 2,470 568 488 3,526 (Credited)/charged to the income statement (42) (3) 236 191 Exchange differences 44 (26) 8 26 Utilised (2,446) (47) (263) (2,756) ---------- ---------- ---------- ---------- As at 31 May 2015 26 492 469 987 Charged to the income statement - 65 377 442 Exchange differences - (7) (3) (10) Utilised (26) (1) (141) (168) ---------- ---------- ---------- ---------- As at 29 November 2015 - 549 702 1,251 ====== ====== ====== ====== 11. Seasonality The Group’s monthly sales profile demonstrates an element of seasonality around the Christmas period which impacts sales in the month of December. 12. Commitments
Capital expenditure contracted for at the balance sheet date but not yet incurred is £867,000 (2014: £3,302,000). The
committed spend includes the replacement of the local area network in Nottingham and tooling and machinery spend.
13. Related-party transactions There were no material related-party transactions during the period.