galaxies at high redshifts - spbu.ru · galaxies at high redshifts why search for high- z galaxies?...
TRANSCRIPT

Galaxies at high redshifts
Why search for high-z galaxies?
• Studying distant galaxies can provide important constraints
on galaxy formation theory.
• One can obtain important insight into physical processes at
early epoch (e.g. star formation).
• Cosmological tests.
Expected properties of high-z galaxies
To find a distant galaxy, one must have some idea of what one
is searching for.
• Surface density
∼ 105−6 galaxies/�o or 1 galaxy per (5′′ − 10′′)2 (assuming
constant space density – no mergers).
Primeval galaxies should be very numerous.
• Redshift of galaxy formation
Two simple arguments:
– Overlap argument
The present-day ratio distance between galaxiesdiameter of a galaxy ∼ 101 − 102.
Expected properties of high-z galaxies
Distance between galaxies in expanding Universe changes as
∝ 1
1+z .
Hence at z ≈ 10− 100 galaxies must overlap
(assuming constant physical diameters of galaxies).
– Density argument
According to spherical collapse model (e.g. Gunn & Gott 1972),
self-gravitating, virialized dark halos form when their mean
density exceeds ≈200 times the background at formation:
〈ρ〉 > 200 ρcr = 200 ρ0cr (1 + z)3.
MW: r = 8 kpc, V = 200 km/s → 〈ρ〉 = 10−23 g/cm3.
Therefore, z(MW ) ∼ 15
z ∼ 10− 20 – epoch of galaxies formation (∼ 200− 500 mln.
years)
Expected properties of high-z galaxies
• Angular sizes
If the observable protogalaxy phase were the end product of
the monolitic collapse of a massive cloud of gas, then the bulk
of its star formation might occur in a small region kiloparsecs in
size (1 kpc ≈ 0.′′15 at z = 5).
On the other hand, some models of galaxy formation predict
that young galaxies will be lumpy in structure and extended in
size, primarily due to the fact that in these models galaxy
formation is a hierachical process. Such an object would have a
size of perhaps ∼ 5′′ − 20′′ (∼ 10− 100 kpc).
One can resolve galaxy-size
object at ANY redshift
(10 kpc vs. z)
Expected properties of high-z galaxies
• Luminosities
Partridge & Peebles (1967):
“galaxies should go through a phase of high luminosity in early
stages of their evolution. The estimated luminosity for a galaxy
resembling our own is ∼ 3× 1046 ergs/sec, roughly 700 times
higher than the present luminosity.”
(MB ∼ −27m and M ∼ 24m − 25m)
• SpectrumPartridge & Peebles (1967):
up to ∼ (5 − 10)% of the bolo-
metric luminosity may be emit-
ted in Lyα (W(Lyα)∼ 10−100A),
rendering the line potentially de-
tectable out to the highest red-
shifts.
Expected properties of high-z galaxies
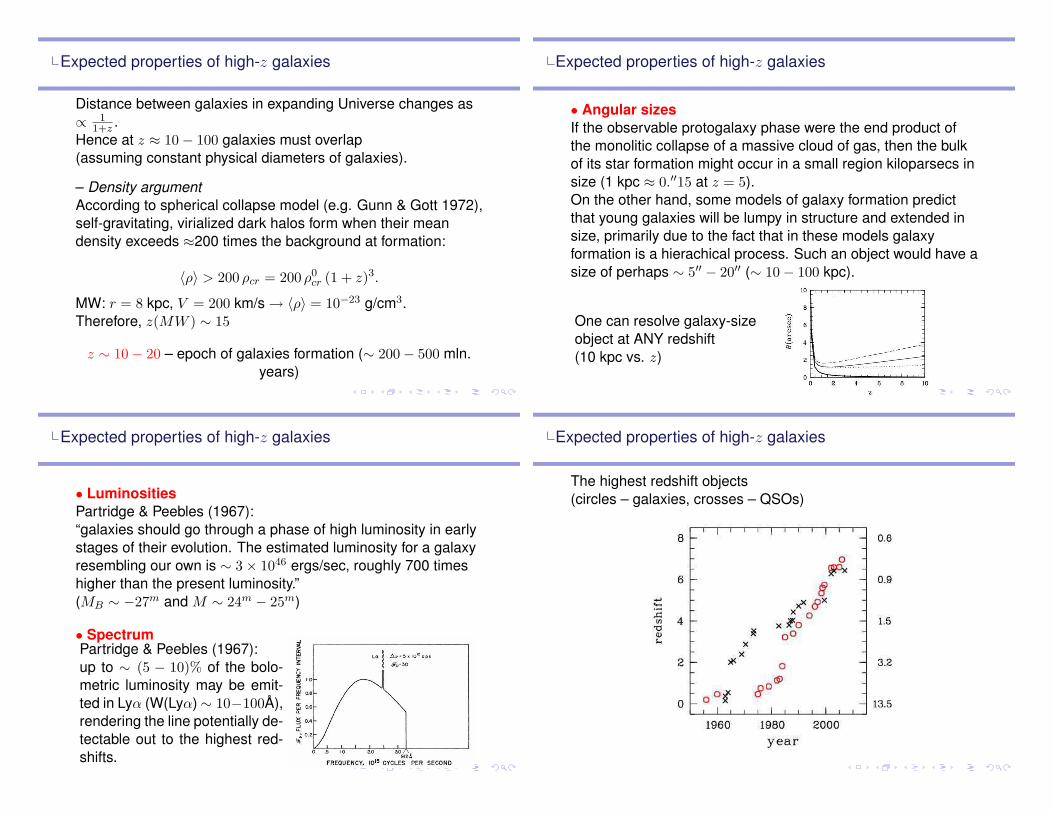
The highest redshift objects
(circles – galaxies, crosses – QSOs)

Why is it so difficult to find high-z galaxies?
• Cosmological dimming (Tolmen effect)
How does surface brightness depend on distance in a
Euclidean static universe?..
In the expanding Universe
Iobs =Itrue
(1 + z)4.
z = 1 ∆µ ≈ 3.m0,
z = 5 ∆µ ≈ 8.m0.
Why is it so difficult to find high-z galaxies?
• K-correction
The expansion of the Universe provides astronomers with the
benefit that recession velocities can be translated into radial
distances. It also presents the challenge that sources observed
at different redshifts are sampled, by any particular instrument,
at different rest-frame frequencies.
The transformations between observed and rest-frame
broad-band photometric measurements involve terms known
as “K-corrections”.
K(z) = −2.5 lg [L(ν1)
L(ν0)(1 + z)],
L(ν1) – intrinsic luminosity of the source, L(ν0) – observed
luminosity (monochromatic correction in mag.).
Why is it so difficult to find high-z galaxies?
To determine the appropriate K-corrections, the spectral
energy distribution of the galaxy has to be convolved with the
transmission function of the filter in the reast-frame and at
redshift of the galaxy. This is a simple calculation once the
spectrum of the object is known.
Why is it so difficult to find high-z galaxies?
Morphological K-correction:

Identification of very distant galaxiesSpectral features of high-z objects
• Strong Lyα emission
Population synthesis models predict that a young, dust free,
star-forming galaxy should show strong Lyα emission with
intrinsic W(Lyα)≈ 100 A.
The flux in the Lyα line is expected to be disrectly proportional
to the SFR and 3-6% of the bolometric luminosity are emitted in
Lyα.
• An intrinsically flat spectrum for λ > 912 A
Population synthesis models prediction: flat spectral energy
distribution between the Lyman-limit and the Balmer-limit
(3646A). This is due to UV-radiation from hot, short-lived (< 108
yr) massive stars.
Identification of very distant galaxiesSpectral features of high-z objects
• A pronounced drop of the SED at the Lyman limit, e.g. a completeabsence of flux at wavelength below the Lyman limit (λ < 912 A)– The feature forms in the stellar atmosphere of massive stars as aresult of the hydrogen ionization edge and is quite pronounced, with adiscontinuity of an order of magnitude.– The break in the stellar continuum is made more pronounced by thephotoelectric absorption of the interstellar HI gas, which is abunduntin young galaxies, and also by intervening HI gas.– The UV spectrum of sources at high z is also subject to additionalopacity owing to line blanketing by the intervening Lyα forest thatdims the continuum between 912 A and 1216 A by an amount thatdepends on z.
Identification of very distant galaxiesSearch techniques
• Search for objects with prominent emission lines with
narrow-band filters.
This requires the detection of emission line objects at a
wavelength at which the redshifted lines (Lyα, Hα etc.) are
expected. One uses narrow band imaging with a spectral
resolution of a few handred to several thousand km/s.
Subsequent spectroscopic observations are necessary to
establish weather the detected emission line is in fact the high
redshift line one was searching for.
Ly emitters (LAEs)
Identification of very distant galaxiesSearch techniques
• Search for objects with unusual broad-band colors.
Lyman-break galaxies (LBGs)

Identification of very distant galaxiesSearch techniques
Where to look for distant galaxies?
– Fields in which high-z objects are already detected (clustering
of galaxies)
– Search in the surrounding of galaxy clusters (gravitational
lensing)
Identification of very distant galaxiesSearch techniques
– Extremely deep fields: HDF-N, HDF-S, HUDF, SDF etc.
– Serendipitous discoveries
Identification of very distant galaxiesSearch techniques
All the methods does work!
Current status:
>50 LAEs at z > 5 (z = 6.96 – most distant)
∼5000 LBGs at z ∼ 4∼1500 LBGs at z ∼ 5>500 LBGs at z ∼ 6>100 LBGs at z > 5 with spectroscopically-confirmed redshifts
Identification of very distant galaxiesSearch techniques
Examples of spectra

Identification of very distant galaxiesSearch techniques
Vanzella et al. (2007): composite spectra of B, V , and i drop
galaxies (the success rate of the redshift identifications to be
≈70%).
LBGs
First modern searches for galaxies at high redshift using the
Lyman-break technique – Guhathakurta et al. (1990), Steidel &
Hamilton (1992, 1993), etc.
Verma et al. (2007) presented the properties of 21 LBGs at
z ∼ 5 (spectra + 10-band photometry in the range 0.45-8 µm).
Main results: typical SFR ∼ 40 M⊙/yr, stellar mass ∼ 2 · 109 M⊙,
age < 100 Myr, size r1/2 ∼ 1 kpc.
On average, LBGs at z ∼ 5 are ∼10 times less massive and are
significantly younger than LBGs at z ∼ 3.
Progenitors of early-type galaxies or bulges?
LBGs
Luminosity function of LBGs
Bouwens et al. (2007): 4671, 1416, and 627 B, V , and idropouts (z ∼ 4, z ∼ 5, and z ∼ 6) in several deep fields of the
HST.
The LF parameters for the rest-frame LFs at different z.
LBGs
Spatial distribution
Ouchi et al. (2004): 2600 LBGs with z=3.5-5.2 in the SDF.

LBGs LBGs
Surface brightness profiles
Hathi et al. (2008) used the stacked HUDF images to analyze
the average surface brightness profiles of z ≈ 4− 6 galaxies
(30 objects at z ≈ 4, 30 at z ≈ 5, and 30 at z ≈ 6).
0.2cm
From these stacked images, they are able to study averaged
radial structure at much higher signal-to-noise ratio than
possible for an individual faint object.
Composite images for z ≈ 4, 5, and 6 (from left to right) objects. Each
stamp is 1.′′53 on a side.
LBGs LBGs
Main conclusions:
– The shape of the average surface brightness profiles shows
that even the faintest z ≈ 4− 6 objects are resolved.
– The average surface brightness profiles display breaks at a
radius that progresses towards lower redshift from r = 0.′′27(1.6 kpc) at z ≈ 6 to r = 0.′′35 (2.5 kpc) at z ≈ 4.
The radius where surface brightness profiles start do deviate
significantly from an r1/n profile might serve as a “virial clock”
that traces the time since the onset of the last major merger,
accretion event or global starburst in these objects.
The limits to dynamical age estimates for the galaxies from
their profile shapes (∼ 100 Myr) are comparable with the SED
ages obtained from the broadband colors.

LAEs
The systematic search for Lyα-emitting high-z galaxies for a
long time been a business without the success expected from
early predictions (e.g. Partridge & Peebles 1967). First results –
end of 90th (e.g. Hu et al. 1998 with the 10-m Keck telescope).
Kodaira et al. (2003):
(a) z = 6.541, FWHM=4.4 kpc, SFR> 9 M⊙/yr
(b) z = 6.578, FWHM<4.4 kpc, SFR> 5 M⊙/yr
LAEs
Typical characteristics of LAEs
– Compact (∼ 1 kpc)
– SFR∼2–50 M⊙/yr
– Masses ∼ 109 − 1010 M⊙
– Luminosity function
Ouchi et al. (2008) presented LFs of Lyα emitters at z ≈ 3, 4,
and 6 in a 1 deg2 sky of the Subaru/XMM–Newton Deep
Survey Field (858 photometrically-selected candidates + 84
confirmed LAEs). They derived the LFs of Lyα and
UV-continuum (≈ 1500 A).
LAEs
– The apparent Lyα LF shows no significant evolution beween z = 3and 6.– The UV LF of LAEs increases from z = 3 to 6, indicating thatgalaxies with Lyα emission are more common at earlier epochs.– The ratio in number density of LAEs to LBGs increases from z = 3to 6: galaxies with Lyα emission are more common at high z.
LAEs
Spatial distributionShimasaku et al. (2003):
43 LAEs at z = 4.86 in
the SDF
Shimasaku et al. (2006):
89 LAEs at z = 5.7 in the
SDF

LAEs
LAEs at z ∼ 9?
Stark et al. (2007) presented new observational constraints on theabundance of faint high-z LAEs secured from a deep Keck near-infrared spectroscopic survey which utilizes the strong magnificationprovided by lensing galaxy clusters at intermediate redshift(z = 0.2− 0.5) (9 clusters).
Stark et al. have undertaken asystematic search for line emis-sion in the J-band (1.143-1.375µm) within carefully-selectedregions which offer very highmagnifications (10–50 times)for background sources withredshifts z ≈ 10.
LAEs
The survey has yielded six
promising (> 5σ) candidate
LAEs which lie between z = 8.7and z = 10.2.
All but one of the candidates re-
main undetected in deep HST
optical images and lower red-
shift line interpretations can be
excluded, with reasonable as-
sumptions, through the non-
detection of secondary emis-
sion in further spectroscopy.
At least two of the candidates
are likely to be a z ≈ 9:
8.99 and 9.32.
LAEs
Main conclusions:
– Assuming two or more of the LAE candidates are real, then
the cumulative abundance of low luminosity galaxies (defined
as those with L > 1041.5 erg/s) is at least 0.3 Mpc−3. Such a
large abundance of low luminosity LAEs supports the
contention of a steep faint end slope for the star-forming
luminosity function at z ≈ 10.
– The first glimpse at the z ≈ 10 Universe suggests that low
luminosity star-forming galaxies contribute a significant
proportion of the UV photons necessary for cosmic reionization.
Summary
z ≥ 5 galaxies:
– compact (∼1–5 kpc)
– asymmetric
– high rest-frame surface brightness and luminosity
(µ0(B) ∼ 18m/�′′, L ∼ L∗)
– young (∼ 100 Myr)
– low mass (∼ 109 − 1010 M⊙)
– high SFR (∼ 101 − 102 M⊙/yr)
– spatial density ≈ spatial density of bright galaxies at z = 0
– evidence of LSS
Summary
These characteristics are very strongly biased by the selection
procedure itself, and it is therefore unclear to what extent they
reflect actual properties of all objects located at z ≥ 5.
The observed objects can be “building blocks” that later merge
and accrete the surrounding matter to form the galaxies we
now know in our vicinity. On the other hand, some of these
objects can represent bulges of massive spirals under forma-
tion or elliptical galaxies.
Summary
Some important questions (Schaerer 2007):
◮ How do different high-z populations such as LAE and LBG fit together?
Are there other currently unknown populations? What are the
evolutionary links between these populations and galaxies at lower
redshift?
◮ What is the metallicity of the high-z galaxies? Where is Pop III?
◮ What is the star formation history of the universe during the first Gyr
after Big Bang?
◮ Are there dusty galaxies at z ≥ 6? How, where, when, and how much
dust is produced at high redshift?
◮ Which are the sources of reionisation? And, are these currently
detectable galaxies or very faint low mass objects? What is the history
of cosmic reionisation?
Summary Summary
Useful literature