gabelli pump, valve & water systems symposium
TRANSCRIPT

Gabelli Pump, Valve & Water Systems SymposiumGabelli Pump, Valve & Water Systems Symposium
Amy SchwetzSenior Vice PresidentChief Financial Officer
February 25, 2021

Flowserve Q4 2020 Earnings Conference Call
2
Forward Looking Statements and Non-GAAP MeasuresSafe Harbor Statement: This presentation includes forward-looking statements within the meaning of Section 27A of the Securities Act of 1933 and Section 21E of the Securities Exchange Act of 1934, which aremade pursuant to the safe harbor provisions of the Private Securities Litigation Reform Act of 1995, as amended. Words or phrases such as, "may," "should," "expects," "could," "intends," "plans," "anticipates,""estimates," "believes," "forecasts," "predicts" or other similar expressions are intended to identify forward-looking statements, which include, without limitation, earnings forecasts, statements relating to ourbusiness strategy and statements of expectations, beliefs, future plans and strategies and anticipated developments concerning our industry, business, operations and financial performance and condition.
The forward-looking statements included in this presentation are based on our current expectations, projections, estimates and assumptions. These statements are only predictions, not guarantees. Such forward-looking statements are subject to numerous risks and uncertainties that are difficult to predict. These risks and uncertainties may cause actual results to differ materially from what is forecast in such forward-looking statements, and include, without limitation, the following: the impact of the global outbreak of COVID-19 on our business and operations; a portion of our bookings may not lead to completed sales, and ourability to convert bookings into revenues at acceptable profit margins; changes in global economic conditions and the potential for unexpected cancellations or delays of customer orders in our reported backlog;our dependence on our customers’ ability to make required capital investment and maintenance expenditures; if we are not able to successfully execute and realize the expected financial benefits from ourstrategic transformation and realignment initiatives, our business could be adversely affected; risks associated with cost overruns on fixed-fee projects and in taking customer orders for large complex customengineered products; the substantial dependence of our sales on the success of the oil and gas, chemical, power generation and water management industries; the adverse impact of volatile raw materials priceson our products and operating margins; economic, political and other risks associated with our international operations, including military actions, trade embargoes, epidemics or pandemics or changes to tariffs ortrade agreements that could affect customer markets, particularly North African, Russian and Middle Eastern markets and global oil and gas producers, and non-compliance with U.S. export/re-export control,foreign corrupt practice laws, economic sanctions and import laws and regulations; increased aging and slower collection of receivables, particularly in Latin America and other emerging markets; our exposure tofluctuations in foreign currency exchange rates, including in hyperinflationary countries such as Venezuela and Argentina; our furnishing of products and services to nuclear power plant facilities and other criticalprocesses; potential adverse consequences resulting from litigation to which we are a party, such as litigation involving asbestos-containing material claims; expectations regarding acquisitions and the integrationof acquired businesses; our relative geographical profitability and its impact on our utilization of deferred tax assets, including foreign tax credits; the potential adverse impact of an impairment in the carrying valueof goodwill or other intangible assets; our dependence upon third-party suppliers whose failure to perform timely could adversely affect our business operations; the highly competitive nature of the markets inwhich we operate; environmental compliance costs and liabilities; potential work stoppages and other labor matters; access to public and private sources of debt financing; our inability to protect our intellectualproperty in the U.S., as well as in foreign countries; obligations under our defined benefit pension plans; our internal control over financial reporting may not prevent or detect misstatements because of its inherentlimitations, including the possibility of human error, the circumvention or overriding of controls, or fraud; the recording of increased deferred tax asset valuation allowances in the future or the impact of tax lawchanges on such deferred tax assets could affect our operating results; our information technology infrastructure could be subject to service interruptions, data corruption, cyber-based attacks or network securitybreaches, which could disrupt our business operations and result in the loss of critical and confidential information; ineffective internal controls could impact the accuracy and timely reporting of our business andfinancial results; and other factors described from time to time in our filings with the Securities and Exchange Commission.
All forward-looking statements included in this presentation are based on information available to us on the date hereof, and we assume no obligation to update any forward-looking statement.
The Company reports its financial results in accordance with U.S. generally accepted accounting principles (GAAP). However, management believes that non-GAAP financial measures which exclude certainnon-recurring items present additional useful comparisons between current results and results in prior operating periods, providing investors with a clearer view of the underlying trends of the business.Management also uses these non-GAAP financial measures in making financial, operating, planning and compensation decisions and in evaluating the Company's performance. Throughout our materials we referto non-GAAP measures as “Adjusted.” Non-GAAP financial measures, which may be inconsistent with similarly captioned measures presented by other companies, should be viewed in addition to, and not as asubstitute for, the Company’s reported results prepared in accordance with GAAP.
We have provided tables in the appendix that reconcile these non-GAAP measures to their corresponding GAAP-based measures.

3
Distinguished history in flow control expertise with a 225+ year heritage
Diversified business model – geographies, end markets and products
Significant installed base provides recurring aftermarket opportunities
Flowserve 2.0 Transformation building a better business model for higher performance through cycles
Accelerated cost reduction measures in 2020 during COVID-related downturn
Returning focus to the growth and optimization phases in 2021
Strong year-end liquidity position of $1.8 billion, including cash of nearly $1.1 billion driven by 2020 free cash flow of over $250 million
Returned ~$135 million to shareholders in dividends and share repurchase in 2020
Investment Highlights
Co
mp
an
y
Overv
iew
FLS 2.0
Tra
nsfo
rmati
on
Ag
en
da
Fin
an
cia
l S
tren
gth

Over 50 Countries
4
Flowserve at a Glance
Capturing highly profitable aftermarket opportunity
across global installed base of pumps, valves and seals
Geographic diversification including significant high growth emerging market
exposure
Rapid response to customers supported by
global localized aftermarket presence
Increasingly engaged associates focused on meeting and exceeding customer expectations
Respected brands and technical expertise across
broad industry process applications
History of strong customer relationships including end-users, E&Cs and
distributors
~16,000 Employees
Over 50 Leading
Product Brands
10,000+Customers Annually
163Aftermarket QRCs
(Quick Response Centers)
5,000,000+ Assets(Installed Base)

34%
24%
13%
26%
3%
Oil & GasChemicalPowerGeneral IndustryWater
Diversified Business Model
5
~60% of Business Outside North America
Attractive End Markets Powerful Aftermarket Franchise
Balanced Platform
39%
21%
22%
12%6%
North AmericaEuropeAsia PacificMiddle East & AfricaLatin America
51%49%
Original EquipmentAftermarket
2020Sales
2020Sales
2020Bookings
Pumps and Seals72%
28%
Flowserve Pump Division
Flow Control Division
2020Sales
Valves and Actuation

A Comprehensive, Pure-Play Flow Control Company
PUMPS
SEALS
VALVES
AFTERMARKET• Only company with significant global presence
in pumps, valves and seals
• Unmatched aftermarket capabilities to serve customers across industries and geographies‒ Enterprise Frame Agreements‒ LifeCycle Advantage Agreements
• Leveraging portfolio breadth of mission-critical products and services to deliver enhanced value to our customers
• Estimated Total Available Market is $145 billion*
* Company estimate from multiple industry sources.
Highlights
6

Flowserve 2.0 Transformation Journey
7
2018-2020 20222021
Customer ExperienceCustomer ExperienceCustomer Experience
Innovative Products & Services
Flowserve 2.0Flowserve 2.0Flowserve 2.0
Fix
th
e C
ore
Op
tim
ize &
Gro
w
Operational Excellence + Process Discipline

RedRaven – Flowserve’s IoT Platform
8
• Digitally connect with our customers
• Realtime actionable operating data
• Monitoring and prediction capabilities
• Improves productivity and plant reliabilityPREDICT. ACT. PROTECT.
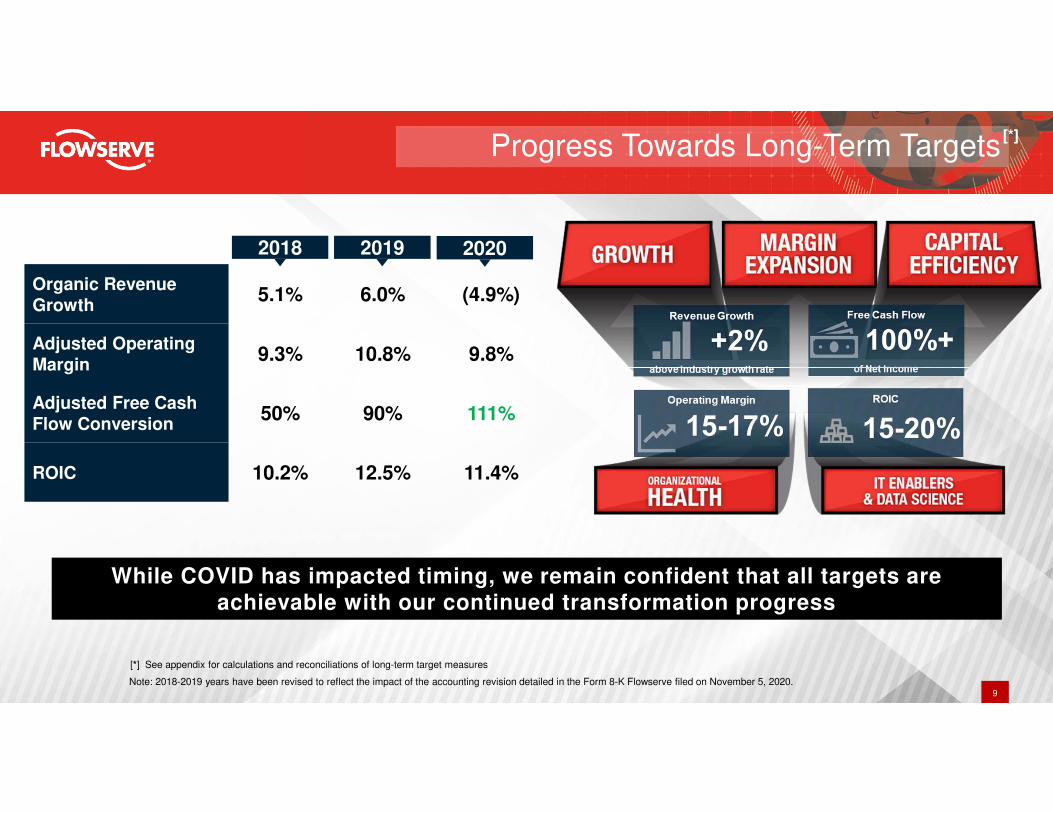
Progress Towards Long-Term Targets
9
[*]
Organic Revenue Growth
5.1% 6.0% (4.9%)
Adjusted Operating Margin
9.3% 10.8% 9.8%
Adjusted Free Cash Flow Conversion
50% 90% 111%
ROIC 10.2% 12.5% 11.4%
[*] See appendix for calculations and reconciliations of long-term target measures
While COVID has impacted timing, we remain confident that all targets are achievable with our continued transformation progress
2018 2019 2020
Note: 2018-2019 years have been revised to reflect the impact of the accounting revision detailed in the Form 8-K Flowserve filed on November 5, 2020.

2020 ESG Accomplishments
10
Together, we create extraordinary flow control solutions to make the world better for everyone
SocialEnvironmental
• Continued commitment to safety
and integrity – Top decile safety
performance
• Focus on social justice and change
in communities where our
associates live and work
• Launched Flowserve Cares and
partnered with local organizations
to help communities impacted by
COVID-19
Governance
• Focused board refreshment – 4
new board members since 2018
• 40% Board Diversity; 3 Directors
are Women
• Board level oversight of ESG
• Strong corporate governance
practices in place
• 50% of Executive Team are Women
• Committed to reduce carbon
emissions intensity by 40% by 2030
• Implemented Sustainability
Accounting Standards Board (SASB)
disclosures for Industrial Machinery
and Goods
• Signed WASH Pledge
• Products and services support
clean technology including
desalination, flare gas recovery,
flood control, carbon capture,
concentrated solar power and
energy transition

Questions & Answers

Appendix

2021 Guidance Assumptons
13
Guidance Assumptions 2021 Guidance
Revenue Guidance Down 4.0% - 7.0%
Reported EPS Guidance $1.15 - $1.40
Adjusted EPS Guidance $1.30 - $1.55
EUR Rate 1.20
Adjusted Tax Rate 22% - 24%
Capital Expenditures $70 - $80 million
[1] 2021 Reported and Adjusted EPS guidance assumes 131 million diluted shares
[2] Adjusted EPS guidance excludes expected realignment charges of approximately $25 million, below-the-line FX impact and other specific discrete items, and includes approximately $10 million of transformation expense
[1]
[2]

1. Cost of sales includes $6.7 million of realignment charges
2. SG&A includes $3.1 million of realignment charges and $6.7 million of transformation charges
3. Below-the-line FX impacts
4. Includes tax impact of items above and $13.2 million benefit related to legal entity simplification and restructuring.
Q4 2020 Consolidated Financial Results
- Diluted EPS calculated using fully diluted shares of 131.0 and 131.8 million shares for Q4 2020 and Q4 2019, respectively
* Constant FX represents the year-over-year variance assuming 2020 results at 2019 FX rates
** Fourth Quarter 2020 and 2019 include losses of $15.1 million and $0.7 million arising from transactions in
currencies other than our sites’ functional currencies and impact of foreign exchange contracts, respectively
5. Excludes $4.5 million of realignment charges and $0.2 million of voluntary retirement program charges
6. Excludes $7.0 million of transformation charges, $4.3 million of realignment charges and $3.3 million of voluntary
retirement program charges
7. Excludes below-the-line FX loss
8. Excludes tax impact of above items
Note: Prior period comparisons are impacted by the accounting revision detailed in the Form 8-K Flowserve filed on November 5, 2020.
2020
($ millions) 2020 2019 Delta ($) Delta (%) Adjusted Delta ($) Delta (%)
Results
Bookings 825.1$ 1,052.1$ (227.0)$ -21.6% -22.7% -$ 825.1$ 1,052.1$ (227.0)$ -21.6% -22.7%
Sales 985.3$ 1,068.2$ (82.9)$ -7.8% -8.9% -$ 985.3$ 1,068.2$ (82.9)$ -7.8% -8.9%
Gross Profit 295.4$ 349.6$ (54.2)$ -15.5% (6.7)$ (1)
302.1$ 354.2$ (5)
(52.1)$ -14.7%
Gross Margin (%) 30.0% 32.7% (270) bps 30.7% 33.2% (250) bps
SG&A 202.7$ 247.6$ (44.9)$ -18.1% -17.6% 9.8$ (2)
192.9$ 233.0$ (6)
(40.1)$ -17.2% -16.6%
SG&A (%) 20.6% 23.2% (260) bps 19.6% 21.8% (220) bps
Income from Affiliates 2.6$ 2.4$ 0.2$ 8.3% -$ 2.6$ 2.4$ 0.2$ 8.3%
Operating Income 95.3$ 104.4$ (9.1)$ -8.7% -8.0% (16.5)$ 111.8$ 123.7$ (11.9)$ -9.6% -9.0%
Operating Margin (%) 9.7% 9.8% (10) bps 11.3% 11.6% (30) bps
Other Income / (Expense),
net **(17.8)$ (2.5)$ 15.3$ -612.0% (15.1)$
(3)(2.7)$ (1.8)$ (7) (0.9)$ 49.2%
Tax Expense (0.9)$ (16.9)$ (16.0)$ -94.7% 18.6$ (4)
(19.5)$ (24.6)$ (8)
(5.1)$ -20.7%
Net Earnings 56.9$ 72.6$ (15.7)$ -21.6% (13.0)$ 69.8$ 84.8$ (15.0)$ -17.7%
Diluted EPS 0.43$ 0.55$ (0.12)$ -21.8% (0.10)$ 0.53$ 0.64$ (0.11)$ -17.2%
4th Quarter 4th Quarter Adjusted
Constant
FX(%)*
2020 2019Constant
FX(%)*Adjusted Adjusted
Items Results
14

1. Cost of sales includes $47.3 million of realignment charges
2. SG&A includes $34.8 million of realignment charges, $22.7 million of transformation charges and $11.5 million related
to discrete asset write-downs
3. Below-the-line FX impacts
4. Includes tax impact of items above, $25.4 million related to Italian tax valuation allowance and $15.6 million benefit
related to legal entity simplification and restructuring.
Full Year 2020 Consolidated Financial Results
- Diluted EPS calculated using fully diluted shares of 131.1 and 131.7 million shares for YTD 2020 and YTD 2019, respectively
* Constant FX represents the year-over-year variance assuming 2020 results at 2019 FX rates
** YTD 2020 and 2019 include losses of $5.9 million and $14.5 million arising from transactions in currencies other
than our sites’ functional currencies and impact of foreign exchange contracts, respectively
5. Excludes $17.2 million of realignment charges and $0.2 million of voluntary retirement program charges
6. Excludes $9.3 million of net realignment benefit, $28.0 million of transformation charges and $3.3 million of voluntary
retirement program charges
7. Excludes below-the-line FX loss
8. Excludes tax impact of above items
Note: Prior period comparisons are impacted by the accounting revision detailed in the Form 8-K Flowserve filed on November 5, 2020.
2020 2019
($ millions) 2020 2019 Delta ($) Delta (%) Adjusted Adjusted Delta ($) Delta (%)
Results Results
Bookings 3,411.6$ 4,238.3$ (826.7)$ -19.5% -18.9% -$ 3,411.6$ 4,238.3$ (826.7)$ -19.5% -18.9%
Sales 3,728.1$ 3,939.7$ (211.6)$ -5.4% -4.9% -$ 3,728.1$ 3,939.7$ (211.6)$ -5.4% -4.9%
Gross Profit 1,116.8$ 1,289.3$ (172.5)$ -13.4% (47.3)$ (1)
1,164.1$ 1,306.8$ (5)
(142.7)$ -10.9%
Gross Margin (%) 30.0% 32.7% (270) bps 31.2% 33.2% (200) bps
SG&A 878.2$ 913.2$ (35.0)$ -3.8% -3.7% 69.0$ (2)
809.2$ 891.2$ (6)
(82.0)$ -9.2% -9.1%
SG&A (%) 23.6% 23.2% 40 bps 21.7% 22.6% (90) bps
Income from Affiliates 11.8$ 10.5$ 1.3$ 12.4% -$ 11.8$ 10.5$ 1.3$ 12.3%
Operating Income 250.3$ 386.6$ (136.3)$ -35.3% -32.9% (116.3)$ 366.6$ 426.1$ (59.5)$ -14.0% -11.9%
Operating Margin (%) 6.7% 9.8% (310) bps 9.8% 10.8% (100) bps
Other Income / (Expense),
net ** (10.3)$ (17.6)$ (7.3)$ -41.5% (5.9)$ (3)
(4.4)$ (3.1)$ (7)
1.3$ 41.9%
Tax Expense (60.0)$ (75.5)$ (15.5)$ -20.5% 11.1$ (4)
(71.2)$ (93.7)$ (8)
(22.5)$ -24.0%
Net Earnings 116.3$ 238.8$ (122.5)$ -51.3% (111.1)$ 227.4$ 274.5$ (47.1)$ -17.2%
Diluted EPS 0.89$ 1.81$ (0.92)$ -50.8% (0.84)$ 1.74$ 2.08$ (0.34)$ -16.3%
Full Year Full Year Adjusted
Constant
FX(%)*
2020Constant
FX(%)*Adjusted
Items
15

Flowserve Pump Division:2020 Segment Results
* Constant FX represents the year over year variance assuming 2020 results at 2019 FX rates** Adjusted Operating Income and Adjusted Operating Margin exclude realignment charges/(benefit) of $6.9 million and $50.2 million for Q3 2020 and YTD 2020, respectively, and $3.0 million and ($1.9) million for Q4 2019 and YTD 2019, respectively, $8.5 million of non-cash asset write-down for YTD 2020, and $0.3 million of voluntary retirement program charges for Q4 2019 and YTD 2019
Note: Prior period comparisons are impacted by the accounting revision detailed in the Form 8-K Flowserve filed on November 5, 2020.
($ millions) 2020 2019 Delta ($) Delta (%) 2020 2019 Delta ($) Delta (%)
Bookings 566.5$ 756.0$ (189.5)$ -25.1% -26.0% 2,358.4$ 3,007.9$ (649.5)$ -21.6% -20.9%
Sales 695.7$ 739.5$ (43.8)$ -5.9% -7.4% 2,675.7$ 2,706.3$ (30.6)$ -1.1% -0.4%
Gross Profit 207.7$ 245.6$ (37.9)$ -15.4% 811.4$ 899.3$ (87.9)$ -9.8%
Gross Margin (%) 29.9% 33.2% (330) bps 30.3% 33.2% (290) bps
SG&A 126.1$ 146.6$ (20.5)$ -14.0% -15.4% 552.2$ 566.3$ (14.1)$ -2.5% -2.2%
SG&A (%) 18.1% 19.8% (170) bps 20.6% 20.9% (30) bps
Income from Affiliates 2.6$ 2.4$ 0.2$ 8.3% 11.8$ 10.5$ 1.3$ 12.4%
Operating Income 84.2$ 101.4$ (17.2)$ -17.0% -16.3% 271.0$ 343.5$ (72.5)$ -21.1% -18.5%
Operating Margin (%) 12.1% 13.7% (160) bps 10.1% 12.7% (260) bps
Adjusted Operating Income** 91.1$ 104.7$ (13.6)$ -13.0% -12.3% 329.6$ 341.9$ (12.3)$ -3.6% -1.0%
Adjusted Operating Margin%** 13.1% 14.2% (110) bps 12.3% 12.6% (30) bps
4th Quarter Full Year
Constant
FX(%)*
Constant
FX(%)*
16

Flowserve Pump Division:2020 Bookings and Sales
* Constant FX represents the year over year variance assuming 2020 results at 2019 FX rates** Gross bookings and sales do not include interdivision eliminations
Note: Prior period Sales comparisons are impacted by the accounting revision detailed in the Form 8-K Flowserve filed on November 5, 2020.
214 301 -29% -30% 835 1,261 -34% -34%
38% 40% (200) bps 35% 42% (700) bps
352 455 -23% -23% 1,523 1,747 -13% -12%
62% 60% 200 bps 65% 58% 700 bps
287 289 -1% -3% 1,093 995 10% 10%
41% 39% 200 bps 41% 37% 400 bps
409 451 -9% -10% 1,583 1,711 -7% -7%
59% 61% (200) bps 59% 63% (400) bps
Delta (%)Constant
FX(%)*
4th Quarter Full Year
($ millions) 2020 2019Constant
FX(%)*2020 2019 Delta (%)
Bookings Mix **
Sales Mix **
OE
AM
OE
AM
17

Flow Control Division:2020 Segment Results
* Constant FX represents the year over year variance assuming 2020 results at 2019 FX rates** Adjusted Operating Income and Adjusted Operating Margin exclude realignment charges of $0.7 million and $13.3 million for Q4 2020 and YTD 2020, respectively, and $3.3 million and $5.2 million for Q4 2019 and YTD 2019, respectively, and $1.1 million of voluntary retirement program charges for Q4 2019 and YTD 2019, respectively, and $3.0 million of non-cash asset write-down for YTD 2020
Note: Prior period comparisons are impacted by the accounting revision detailed in the Form 8-K Flowserve filed on November 5, 2020.
($ millions) 2020 2019 Delta ($) Delta (%) 2020 2019 Delta ($) Delta (%)
Bookings 258.4$ 298.6$ (40.2)$ -13.5% -15.1% 1,065.8$ 1,240.9$ (175.1)$ -14.1% -13.8%
Sales 290.7$ 330.2$ (39.5)$ -12.0% -12.3% 1,057.5$ 1,238.9$ (181.4)$ -14.6% -14.7%
Gross Profit 92.8$ 111.8$ (19.0)$ -17.0% 321.9$ 405.5$ (83.6)$ -20.6%
Gross Margin (%) 31.9% 33.9% (200) bps 30.4% 32.7% (230) bps
SG&A 41.4$ 54.5$ (13.1)$ -24.0% -25.3% 196.3$ 213.6$ (17.3)$ -8.1% -8.1%
SG&A (%) 14.2% 16.5% (230) bps 18.6% 17.2% 140 bps
Operating Income 51.4$ 57.3$ (5.9)$ -10.3% -2.7% 125.6$ 191.9$ (66.3)$ -34.5% -34.5%
Operating Margin (%) 17.7% 17.4% 30 bps 11.9% 15.5% (360) bps
Adjusted Operating Income** 52.1$ 61.7$ (9.6)$ -15.6% -8.6% 141.9$ 198.2$ (56.3)$ -28.4% -28.3%
Adjusted Operating Margin%** 17.9% 18.7% (80) bps 13.4% 16.0% (260) bps
4th Quarter Full Year
Constant
FX(%)*
Constant
FX(%)*
18
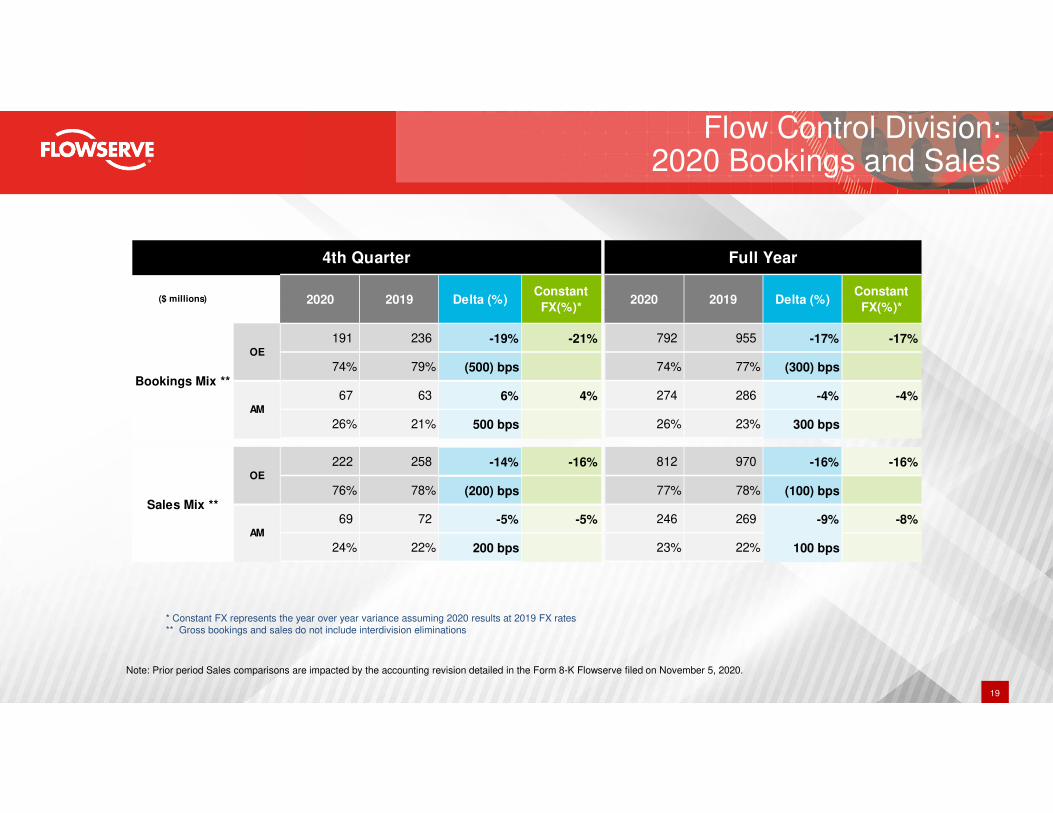
Flow Control Division:2020 Bookings and Sales
* Constant FX represents the year over year variance assuming 2020 results at 2019 FX rates** Gross bookings and sales do not include interdivision eliminations
Note: Prior period Sales comparisons are impacted by the accounting revision detailed in the Form 8-K Flowserve filed on November 5, 2020.
191 236 -19% -21% 792 955 -17% -17%
74% 79% (500) bps 74% 77% (300) bps
67 63 6% 4% 274 286 -4% -4%
26% 21% 500 bps 26% 23% 300 bps
222 258 -14% -16% 812 970 -16% -16%
76% 78% (200) bps 77% 78% (100) bps
69 72 -5% -5% 246 269 -9% -8%
24% 22% 200 bps 23% 22% 100 bps
Bookings Mix **
OE
AM
Sales Mix **
OE
AM
4th Quarter Full Year
($ millions) 2020 2019 Delta (%)Constant
FX(%)*2020 2019 Delta (%)
Constant
FX(%)*
19

Reconciliation of Non-GAAP Measures
Note: Reconciliation includes the impact of the accounting revision detailed in the Form 8-K Flowserve filed on November 5, 2020.
Twelve Months Ended December 31, 2018(Amounts in millions, except per share data) As Reported (a) Adjustments As Adjusted
Sales 3,835.7$ -$ 3,835.7$
Operating income 227.7 (127.5) (1) 355.2 Operating income as a percentage of sales 5.9% 9.3%
Other (expense) income, net (19.6) (18.7) (2) 0.9
Earnings (loss) before income taxes 156.4 (146.2) 302.6
Provision for income taxes (46.6) 36.2 (3) (82.8)
Tax Rate 29.8% -24.8% 27.4%
Net earnings (loss) attributable
to Flowserve Corporation 104.5$ (110.1)$ 214.6$
Diluted earnings per share 0.80$ (0.84)$ 1.64$
(a) Reported in conformity with U.S. GAAP
(1) Includes $53.9 million of realignment charges, $17.4 million of FPD divestiture write-down of assets, $41.2 million
of Flowserve 2.0 transformation costs, $7.3 million of ASC 606 adoption costs and $7.7 million loss on sale of IPD business
(2) Includes $18.7 million of below-the-line foreign exchange impacts
(3) Includes tax impact of footnotes (1) and (2) and a $5.7 million tax benefit related to the U.S. Tax Cuts and Jobs Act of 2017
20

Reconciliation of Non-GAAP Measures
Adjusted Free Cash Flow Conversion
$ millions 2018 2019 2020
Cash Flow from Operations 190.8$ 324.1$ 310.5$
Capital Expenditures (84.0) (75.7) (57.4)
Free Cash Flow 106.8$ 248.4$ 253.1$
Adjusted Net Earnings 214.6$ 274.5$ 227.4$
Adjusted Free Cash Flow conversion 50% 90% 111%
Note: Reconciliation includes the impact of the accounting revision detailed in the Form 8-K Flowserve filed on November 5, 2020.
Organic Revenue Growth
$ millions 2018 2019 2020
Reported Revenue 3,835.7$ 3,939.7$ 3,728.1$
Foreign exchange impact 31.0 (94.0) (17.0)
Divestiture impact (41.2) (31.0) -
Organic Revenue 3,845.9$ 4,064.7$ 3,745.1$
Prior Year Reported Revenue 3,660.8$ 3,835.7$ 3,939.7$
Organic Revenue Growth 5.1% 6.0% -4.9%
21
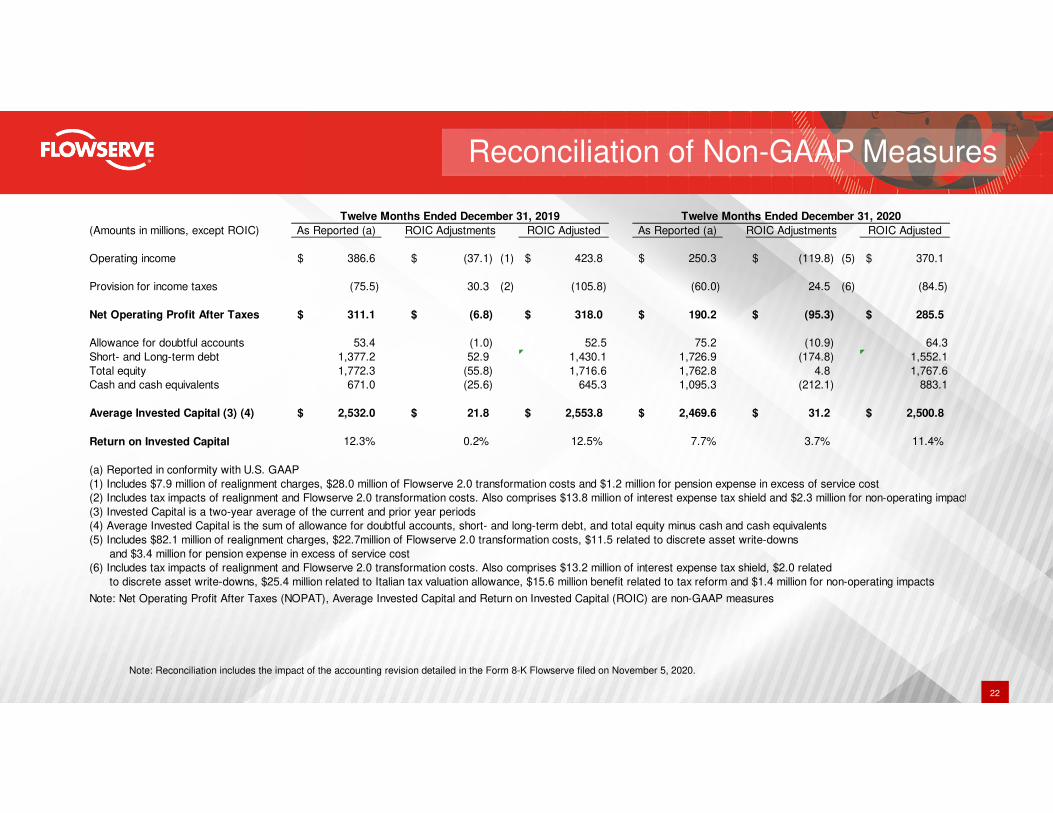
Reconciliation of Non-GAAP Measures
Note: Reconciliation includes the impact of the accounting revision detailed in the Form 8-K Flowserve filed on November 5, 2020.
(Amounts in millions, except ROIC) As Reported (a) ROIC Adjustments ROIC Adjusted As Reported (a) ROIC Adjustments ROIC Adjusted
Operating income 386.6$ (37.1)$ (1) 423.8$ 250.3$ (119.8)$ (5) 370.1$
Provision for income taxes (75.5) 30.3 (2) (105.8) (60.0) 24.5 (6) (84.5)
Net Operating Profit After Taxes 311.1$ (6.8)$ 318.0$ 190.2$ (95.3)$ 285.5$
Allowance for doubtful accounts 53.4 (1.0) 52.5 75.2 (10.9) 64.3
Short- and Long-term debt 1,377.2 52.9 1,430.1 1,726.9 (174.8) 1,552.1
Total equity 1,772.3 (55.8) 1,716.6 1,762.8 4.8 1,767.6
Cash and cash equivalents 671.0 (25.6) 645.3 1,095.3 (212.1) 883.1
Average Invested Capital (3) (4) 2,532.0$ 21.8$ 2,553.8$ 2,469.6$ 31.2$ 2,500.8$
Return on Invested Capital 12.3% 0.2% 12.5% 7.7% 3.7% 11.4%
(a) Reported in conformity with U.S. GAAP
(1) Includes $7.9 million of realignment charges, $28.0 million of Flowserve 2.0 transformation costs and $1.2 million for pension expense in excess of service cost
(2) Includes tax impacts of realignment and Flowserve 2.0 transformation costs. Also comprises $13.8 million of interest expense tax shield and $2.3 million for non-operating impacts
(3) Invested Capital is a two-year average of the current and prior year periods
(4) Average Invested Capital is the sum of allowance for doubtful accounts, short- and long-term debt, and total equity minus cash and cash equivalents
(5) Includes $82.1 million of realignment charges, $22.7million of Flowserve 2.0 transformation costs, $11.5 related to discrete asset write-downs
and $3.4 million for pension expense in excess of service cost
(6) Includes tax impacts of realignment and Flowserve 2.0 transformation costs. Also comprises $13.2 million of interest expense tax shield, $2.0 related
to discrete asset write-downs, $25.4 million related to Italian tax valuation allowance, $15.6 million benefit related to tax reform and $1.4 million for non-operating impacts
Note: Net Operating Profit After Taxes (NOPAT), Average Invested Capital and Return on Invested Capital (ROIC) are non-GAAP measures
Twelve Months Ended December 31, 2019 Twelve Months Ended December 31, 2020
22

Reconciliation of Non-GAAP Measures
Note: Reconciliation includes the impact of the accounting revision detailed in the Form 8-K Flowserve filed on November 5, 2020.
(Amounts in millions, except ROIC) As Reported (a) ROIC Adjustments ROIC Adjusted
Operating income 227.7$ (126.2)$ (1) 353.9$
Provision for income taxes (46.6) 45.9 (2) (92.4)
Net Operating Profit After Taxes 181.2$ (80.3)$ 261.5$
Allowance for doubtful accounts 51.5 3.8 55.3
Short- and Long-term debt 1,483.0 46.1 1,529.2
Total equity 1,632.0 13.3 1,645.3
Cash and cash equivalents 619.7 41.9 661.6
Average Invested Capital (3) (4) 2,546.9$ 21.3$ 2,568.2$
Return on Invested Capital 7.1% 3.1% 10.2%
(a) Reported in conformity with U.S. GAAP
(1) Includes $53.9 million of realignment charges, $17.4 million of FPD divestiture write-down of assets, $41.2 million of Flowserve 2.0 transformation costs, $7.3 million of ASC 606
adoption costs, $7.7 million loss on sale from the divestiture of two FPD locations and related product lines and $1.3 million for service cost in excess of pension expense
(2) Includes tax impacts of: realignment, write-down of assets, Flowserve 2.0 transformation costs, ASC 606 adoption costs, and loss on sale.
Also comprises $15.1 million of interest expense tax shield and $3.4 million for non-operating impacts
(3) Invested Capital is a two-year average of the current and prior year periods
(4) Average Invested Capital is the sum of allowance for doubtful accounts, short- and long-term debt, and total equity minus cash and cash equivalents
Note: Net Operating Profit After Taxes (NOPAT), Average Invested Capital and Return on Invested Capital (ROIC) are non-GAAP measures
Twelve Months Ended December 31, 2018
23

Jay Roueche
972.443.6560
Mike Mullin
972.443.6636
Investor Relations Contacts