gabelli & company’s 2017 pump, valve & water systems symposium · gabelli &...
TRANSCRIPT

1 1
Gabelli & Company’s 2017 Pump, Valve & Water
Systems Symposium
EnPro Industries, Inc.
Presented by Milt Childress, CFO & SVP March 1, 2017

2 2
Forward-Looking Statements
Statements in presentation that express a belief, expectation or intention, as well as those that are not historical fact, are forward-looking statements under the Private Securities Litigation Reform Act of 1995. They involve a number of risks and uncertainties that may cause actual events and results to differ materially from such forward-looking statements. These risks and uncertainties include, but are not limited to: general economic conditions in the markets served by our businesses, some of which are cyclical and experience periodic downturns; the effect of changes in currency exchange rates, expected volumes of purchases of parts denominated in euros used for engines to be sold in U.S. dollars; prices and availability of raw materials; and the amount of any payments required to satisfy contingent liabilities related to discontinued operations of our predecessors, including liabilities for certain products, environmental matters, employee benefit obligations and other matters. In addition, adverse developments could arise in regard to voluntary petitions filed by certain of our subsidiaries in U.S. Bankruptcy Court to establish a trust that would resolve all current and future asbestos claims. Our filings with the Securities and Exchange Commission, including the Form 10-K for the year ended December 31, 2016, describe these and other risks and uncertainties in more detail. We do not undertake to update any forward-looking statement made in this presentation to reflect any change in management's expectations or any change in the assumptions or circumstances on which such statements are based. We own a number of direct and indirect subsidiaries and, from time to time, we may refer collectively to EnPro and one or more of our subsidiaries as “we” or to the businesses, assets, debts or affairs of EnPro or a subsidiary as “ours.” These and similar references are for convenience only and should not be construed to change the fact that EnPro and each subsidiary is an independent entity with separate management, operations, obligations and affairs. This presentation also contains certain non-GAAP financial measures as defined by the Securities Exchange Commission. A reconciliation of these measures to the most directly comparable GAAP equivalents is included as an appendix to this presentation. We will also be referencing certain pro forma unaudited condensed consolidated financials. Please refer to our earnings releases for important information regarding how pro forma financial information is derived, as well as related risks and uncertainties.

3 3
EnPro Industries Snapshot
Pro Forma Sales(2)
Pro Forma Adjusted EBITDA & Margin(3)
$ in millions
$ in millions
$1,378 $1,338 $1,404 $1,371 $1,338
2012A 2013A 2014A 2015A 2016A
$225 $216 $208 $200 $186
16.3% 16.2% 14.8% 14.6% 13.9%
2012A 2013A 2014A 2015A 2016A
Key EnPro Highlights: • NYSE Stock Ticker: NPO • Market Cap: ~$1.4 billion • Shares Outstanding: ~21.4 million • Dividend: $0.88/share(1)
• Dividend Yield: ~1.4% • # of Employees: ~6,000 • History:
― Founded June 1, 2002 ― Spin-off from Goodrich Corp. ― Several brands >100 years old
EnPro Segments: • Reports in 3 Segments
― Sealing Products ― Engineered Products ― Power Systems
• Garlock Sealing Technologies (GST) ― Deconsolidated business ― Chapter 11 bankruptcy protection from asbestos-
related claims ― A profitable business
(1) Quarterly dividend increased to $0.22/share that will be payable starting in March 2017. (2) See appendix for reconciliations. (3) Represents pro forma adjusted EBITDA per reconciliations in appendix.
4 4
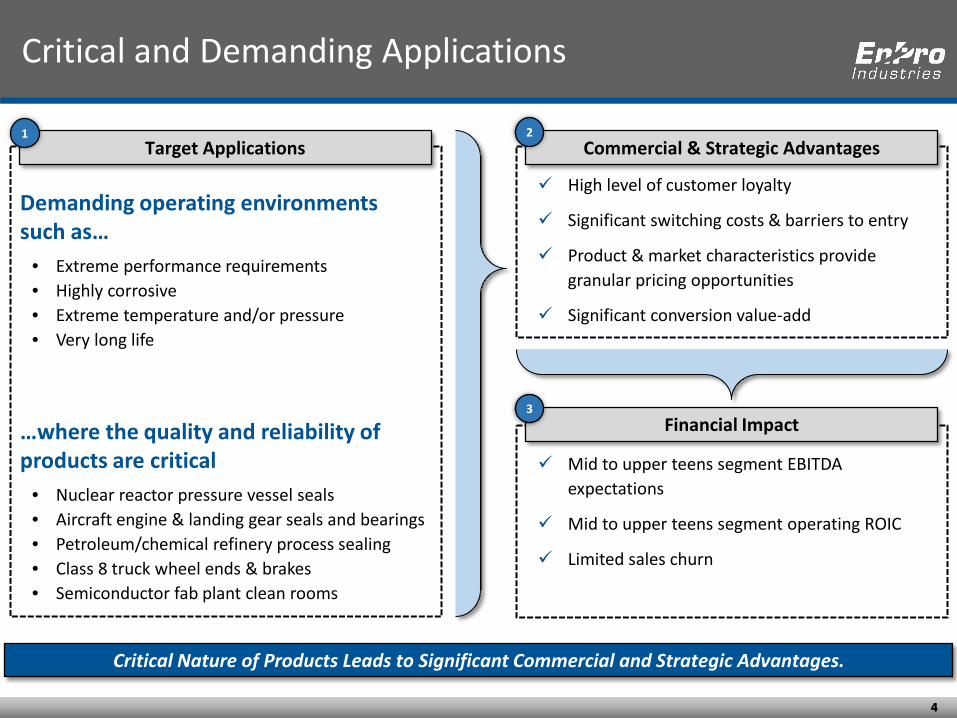
Critical and Demanding Applications
Critical Nature of Products Leads to Significant Commercial and Strategic Advantages.
Demanding operating environments such as…
• Extreme performance requirements • Highly corrosive • Extreme temperature and/or pressure • Very long life
…where the quality and reliability of products are critical
• Nuclear reactor pressure vessel seals • Aircraft engine & landing gear seals and bearings • Petroleum/chemical refinery process sealing • Class 8 truck wheel ends & brakes • Semiconductor fab plant clean rooms
Target Applications
High level of customer loyalty
Significant switching costs & barriers to entry
Product & market characteristics provide granular pricing opportunities
Significant conversion value-add
Commercial & Strategic Advantages
Mid to upper teens segment EBITDA expectations
Mid to upper teens segment operating ROIC
Limited sales churn
Financial Impact
1 2
3

5 5
Leading Brands Drive Recurring Business
Core Brands Select Supporting Brands Flagship Products
• Gylon • Klozure • Lubrikup
• Pikotek • PSI • Gar-Seal
• PTFE-based gasket material for high pressure, high temperature applications
• Pro-Torq • STEMCO Duroline
• STEMCO Kaiser • Aeris • Class 8 truck wheel-end seals, bearings and accessories
• Helicoflex • Cefil‘Air • Origraf
• Bio-Guardian • Feltmetal
• Spring energized seals, advanced polymer seals, abradable seals, and edge welded bellows seals
• DU • DX
• DP-4 • GAR-MAX
• Metal and polymer-backed, self-lubricating plain bearings
• Hi-Flo • Twin Ring • Valvealert • High flow valves, piston and rider rings, and monitoring
devices
• FM/Alco • FM OP Engines
• FM-MAN • Colt-Pielstick
• Medium-speed diesel engines for marine and stationary power applications

6 6
Highly Diversified Business Leads to Stable Cash Flows
58% 22%
7%
6% 5% 3%
United States
Europe
Asia Pacific
Canada Latin America
Other
(1) FCF defined as pro forma adjusted EBITDA less pro forma capital expenditures. (2) Refer to appendix for reconciliations.
Pro Forma Free Cash Flow(1)(2)
$ in millions
$177 $166
$147 $147 $134
2012A 2013A 2014A 2015A 2016A
Diversified Geographic and End Market Mix Leads to Stable Cash Flow Generation.
2016 Pro Forma Sales by Market
2016 Pro Forma Sales by Geography
24%
16%
13% 13%
10%
7%
6% 5%
3% 2% Medium/Heavy-Duty Truck
General Industrial
Navy & Marine
Chemical & Material Processing
Power Generation
Oil & Gas
Automotive
Semiconductor Aerospace
Avg. = $154
Other

7 7
Overview of EnPro
Sealing Products(1) Engineered Products(1) Power Systems(1)
Pro Forma Sales:
$211.1
Pro Forma Segment Adjusted
EBITDA:
$22.6
Pro Forma
Segment Adjusted EBITDA Margin:
10.7%
Pro Forma Sales:
$278.0
Pro Forma Segment Adjusted
EBITDA:
$37.5
Pro Forma
Segment Adjusted EBITDA Margin:
13.5%
Pro Forma Sales:
$852.3
Pro Forma Segment Adjusted
EBITDA:
$156.4
Pro Forma
Segment Adjusted EBITDA Margin:
18.4%
• Gaskets & Packing • Oil Seals • Pipeline Insulating
Products
• High Performance Metal Seals
• Brush Seals • Bellows • Turbine Hot Gas Path
Section Components • Polymer Products
• Wheel End • Suspension • Brake Products • Intelligent
Transportation Systems
• Plain Bearings • Bushing Blocks • Bearing
Assemblies
• Sealing Components, Valves, and Lubrication Systems for Reciprocating Compressors
• Medium-Speed Diesel Engines
• Parts & Service • Systems Packager
Products:
• General Industry • Oil & Gas • Basic Materials • Chemical Processing • Power Generation • Water
• Electronics & Semiconductors
• Aerospace • Power Generation • General Industry • Oil & Gas • Food & Beverage
• Class 8 Heavy Duty Truck
• Medium Duty Vocational Truck
• Auto • Construction &
Agriculture • Fluid Power • General Industry
• Oil & Gas • Compressors • Services • Chemical Processing • Other Industries
• Commercial • Government
Markets:
(1) Financial information based on pro forma 2016 results; pro forma sales and pro forma segment adjusted EBITDA reconciliations located in appendix.
$ in millions

8 8
Sealing Products
Pro Forma Sales & Pro Forma Segment Adjusted EBITDA Margin(1)
$ in millions
2016 Pro Forma Sales Mix As % of Pro Forma Sales
$801 $811 $844 $868 $852
21.7% 23.0% 20.1% 19.0% 18.4%
2012A 2013A 2014A 2015A 2016A
55%
45%
Aftermarket
62% 14%
8%
7% 6% 3%
Sales by Channel Sales by Geography
OEM
United States
Europe
Asia Pacific
Latin America
Canada Other
Secular Market Trends: • Aging global infrastructure of pipelines • Low oil and gas prices driving demand for
petro-chem • Stable durable goods shipments by trucking • Global growth of distributed power • Growth in global aerospace production
Organic Growth Strategies: • Leverage commercial synergies from
acquisitions • New product development
― Food & pharma sealing ― Aerospace applications and sub-systems ― Aeris mileage and safety systems
Inorganic Growth Strategies: • Increase size of addressable market • Gain scale in sanitary sealing markets • Grow presence in aerospace and industrial
turbine
(1) See appendix for pro forma sales and pro forma segment adjusted EBITDA reconciliations.

9 9
Engineered Products
$ in millions
2016 Pro Forma Sales Mix As % of Pro Forma Sales
33%
67%
Aftermarket
52%
28%
8%
4% 4% 4%
Sales by Channel Sales by Geography
OEM Europe
United States
Asia Pacific
Canada Latin America
Other
$365 $358 $360
$299 $278
13.4% 13.0% 14.3% 11.1%
13.5%
2012A 2013A 2014A 2015A 2016A
Secular Market Trends: • Industrial activity in Europe and North
America: slow growth • Automotive markets have been steady • Low oil and gas prices affecting demand for
compressor parts
Organic Growth Strategies: • Focus on core refinery and petro-chem
markets at CPI • Convert more of U.S. industrial market to
plain bearings • Leverage global manufacturing and service
presence
Strategic Focus: • Right size for demand levels • Improve operational performance • Tightly manage SG&A costs
Pro Forma Sales & Pro Forma Segment Adjusted EBITDA Margin(1)
(1) See appendix for pro forma sales and pro forma segment adjusted EBITDA reconciliations.
10 10
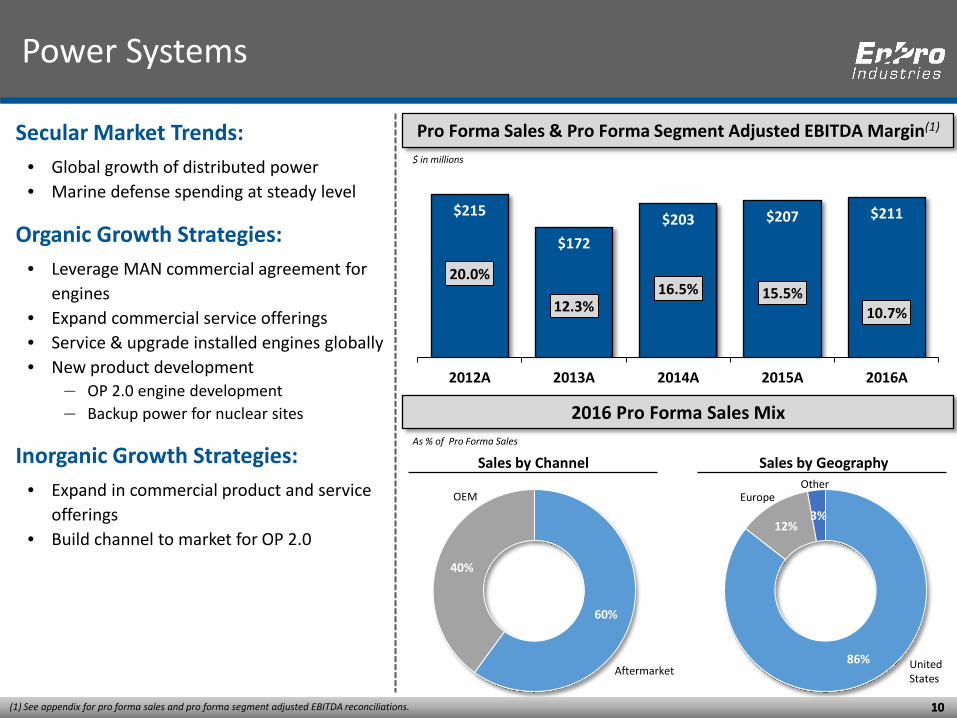
Power Systems
$ in millions
2016 Pro Forma Sales Mix As % of Pro Forma Sales
60%
40%
Aftermarket 86%
12% 3%
Sales by Channel Sales by Geography
OEM
United States
Europe Other
$215
$172 $203 $207 $211
20.0%
12.3% 16.5% 15.5%
10.7%
2012A 2013A 2014A 2015A 2016A
Secular Market Trends: • Global growth of distributed power • Marine defense spending at steady level
Organic Growth Strategies: • Leverage MAN commercial agreement for
engines • Expand commercial service offerings • Service & upgrade installed engines globally • New product development
― OP 2.0 engine development ― Backup power for nuclear sites
Inorganic Growth Strategies: • Expand in commercial product and service
offerings • Build channel to market for OP 2.0
Pro Forma Sales & Pro Forma Segment Adjusted EBITDA Margin(1)
(1) See appendix for pro forma sales and pro forma segment adjusted EBITDA reconciliations.
11 11
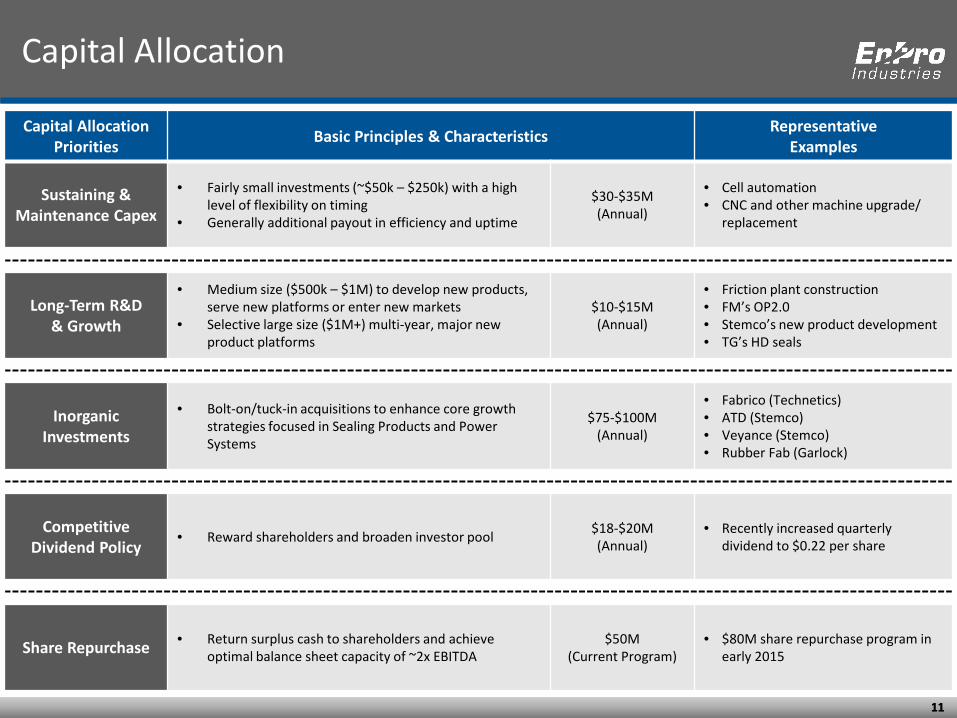
Capital Allocation
Capital Allocation Priorities Basic Principles & Characteristics Representative
Examples
Sustaining & Maintenance Capex
• Fairly small investments (~$50k – $250k) with a high level of flexibility on timing
• Generally additional payout in efficiency and uptime
$30-$35M (Annual)
• Cell automation • CNC and other machine upgrade/
replacement
Long-Term R&D & Growth
• Medium size ($500k – $1M) to develop new products, serve new platforms or enter new markets
• Selective large size ($1M+) multi-year, major new product platforms
$10-$15M (Annual)
• Friction plant construction • FM’s OP2.0 • Stemco’s new product development • TG’s HD seals
Inorganic Investments
• Bolt-on/tuck-in acquisitions to enhance core growth strategies focused in Sealing Products and Power Systems
$75-$100M (Annual)
• Fabrico (Technetics) • ATD (Stemco) • Veyance (Stemco) • Rubber Fab (Garlock)
Competitive Dividend Policy
• Reward shareholders and broaden investor pool $18-$20M (Annual)
• Recently increased quarterly dividend to $0.22 per share
Share Repurchase • Return surplus cash to shareholders and achieve optimal balance sheet capacity of ~2x EBITDA
$50M (Current Program)
• $80M share repurchase program in early 2015

12 12
Understanding the Asbestos Claims Resolution Process (ACRP)
ACRP Summary Background ACRP Settlement Agreement
GST sought protection from asbestos claims on June 5, 2010 via voluntary bankruptcy protection
• Fully operational wholly-owned subsidiary of EnPro • Deconsolidated from EnPro financial results
Court also enjoined affiliate asbestos claims • Preserved remaining common insurance for GST • Protects EnPro and other EnPro businesses during case
Liability estimate was volatile • Assumptions challenged by tort system abuses,
concealment of 524g trust claims on other companies • Insurance was diminishing
Presiding judge endorsed GST’s liability estimate on January 10, 2014
• Scientific evidence showed product did not contribute to asbestos-related diseases
• $125M versus claimants’ estimates of $970M - $1.26B for mesothelioma liability
• Sets path to permanent resolution of asbestos claims
Settlement Agreement reached March 17, 2016
Comprehensive settlement • Resolves claims against GST, its affiliates and Coltec;
protecting all of EnPro
Plan follows 524(g) safe harbor provision of asbestos bankruptcy law
• Proven path to resolution performed by previous asbestos bankruptcies
• Preserves equity in GST for Coltec • Significantly reduces appellate risk
GST and Coltec (EnPro’s sub) have the means to fund the Trust
• $400M cash contribution would be made upon consummation of the plan
• Additional $80M contribution would be made no later than the first anniversary of plan consummation
• Additional $20M cash payment for Canadian claims would be payable on the fourth anniversary of plan consummation
• Above amounts all deductible against taxable income

13 13
ACRP Path Toward Reconsolidation
Next Steps and Path toward Reconsolidation
We continue to progress on the ACRP timeline towards plan confirmation and reconsolidation.
# Activity 2016 2017
Status Q2 Q3 Q4 Q1 Q2 Q3 Q4
1 Parties file all plan documents including plan and disclosure statement. Complete
2 Court hears motion to approve disclosure statement & claimant solicitation process; issues approval. Complete
3 Solicitation begins for GST & Coltec claimants. Complete
4 4-month notice period ends. Votes are tabulated and certified within a month thereafter. Complete
5 Assuming successful vote, Coltec reorganization accomplished (operating businesses moved outside of Coltec corp. family; Coltec merges into newly formed “OldCo”. Complete
6 OldCo files the claimant-approved prepackaged chapter 11 & Bankruptcy Court agrees to jointly administer the cases. Complete
7 Bankruptcy Court holds confirmation hearing for all debtors (GST, Garrison & OldCo); issues positive confirmation decision shortly thereafter, assuming no objection. On-Track
8 District Court affirms BC decision; issues confirmation orders & 524(g) channeling injunction, directing all current and future claims to Trust, assuming no objection. On-Track
9 Confirmation orders become final 30 days later, assuming no appeal. On-Track
10 Plan of Reorganization is consummated & becomes effective; GST and OldCo reconsolidated into EnPro. On-Track
14 14
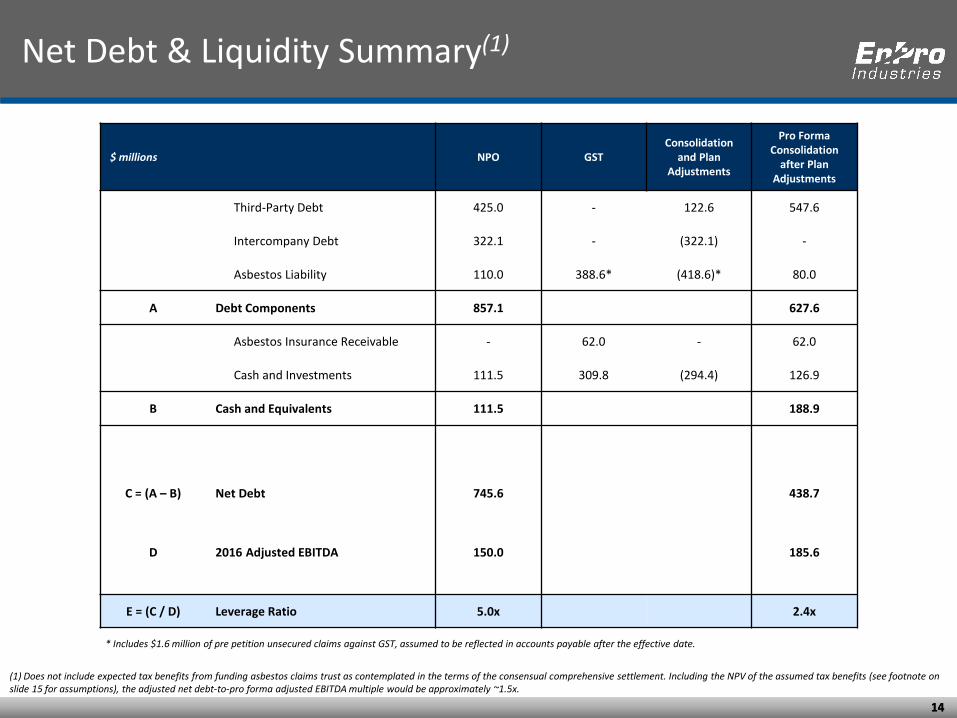
Net Debt & Liquidity Summary(1)
(1) Does not include expected tax benefits from funding asbestos claims trust as contemplated in the terms of the consensual comprehensive settlement. Including the NPV of the assumed tax benefits (see footnote on slide 15 for assumptions), the adjusted net debt-to-pro forma adjusted EBITDA multiple would be approximately ~1.5x.
$ millions NPO GST Consolidation
and Plan Adjustments
Pro Forma Consolidation
after Plan Adjustments
Third-Party Debt 425.0 - 122.6 547.6
Intercompany Debt 322.1 - (322.1) -
Asbestos Liability 110.0 388.6* (418.6)* 80.0
A Debt Components 857.1 627.6
Asbestos Insurance Receivable - 62.0 - 62.0
Cash and Investments 111.5 309.8 (294.4) 126.9
B Cash and Equivalents 111.5 188.9
C = (A – B) Net Debt 745.6 438.7
D 2016 Adjusted EBITDA 150.0 185.6
E = (C / D) Leverage Ratio 5.0x 2.4x
* Includes $1.6 million of pre petition unsecured claims against GST, assumed to be reflected in accounts payable after the effective date.

15 15
NPO Valuation Considerations
Internal Valuation Summary: • On a pro forma basis, taking into account
ACRP settlement plan and reconsolidation of GST, EnPro trades at ~9.0x
• Peer median is ~13.8x
Peer Enterprise Value/TTM EBITDA Multiples(3)
9.0x
9.6x
9.8x
11.5x
11.8x
12.6x
13.7x
13.8x
13.8x
13.8x
14.8x
15.0x
15.3x
15.8x
20.7x
EnPro (Pro Forma)
Regal Beloit
Crane
Barnes Group
Curtiss-Wright
Mueller Water
Colfax
TriMas
EnPro (NPO)
Actuant
IDEX
Woodward
Graco
Nordson
CIRCOR
$ in millions
Market Cap(1) $1,392
Pro Forma Net Debt (Per Slide 14) $439
(A) Enterprise Value $1,831
(B) Estimated Trust Funding Tax Benefits (NPV)(2) $154
(C) Adjusted Enterprise Value (A - B) $1,677
(D) Pro Forma Adjusted 2016 EBITDA $186
Pro Forma EV/TTM EBITDA Multiple (C / D) 9.0x
Peer Median: 13.8x
(1) Market capitalization for NPO per CapitalIQ as of 2/22/17. (2) Estimated Trust Funding Tax Benefit of $154 million assumes that 1/3 of benefit will be realized based on two-year carryback and 2/3 will be realized equally over four years. Detailed tax evaluation underway. (3) EV/TTM EBITDA multiples per CapitalIQ as of 2/22/17. Peer median EV/TTM EBITDA multiple excludes NPO and EnPro (Pro Forma) from calculation. TTM = “Trailing Twelve Months”.

16 16
Why Invest in EnPro?
Critical Nature of Products Leads to Commercial
& Strategic Advantages Leading Brands
Drive a Portfolio of Attractive,
Recurring Business
Highly Diversified
Business Leads to Stable Cash
Flows
Growth Focus Includes
Multiple Levers
Disciplined Investment
Strategy
Favorable ACRP Developments
Attractive Share Price Relative to
Peers

17 17
Appendix

18 18
EnPro Adjusted EBITDA & FCF Reconciliation
($ in millions) 2012 2013 2014 2015 2016
Net Income (Loss) $41.0 $27.4 $22.0 $(20.9) $(40.1)
Plus:
Interest Expense, net 42.8 44.3 44.1 52.1 55.1
Income Tax Expense (Benefit) 22.5 8.4 10.6 2.3 (28.6)
Depreciation and Amortization 55.5 56.6 57.5 58.1 57.1
Restructuring Costs 5.0 6.7 2.3 6.6 13.4
Environmental Reserve Adjustment 1.2 6.3 4.5 1.4 8.6
Asbestos-Related Expenses - - 30.0 - 80.0
Goodwill and Intangible Impairment - - - 47.0 -
Loss on Debt Exchange - - 10.0 2.8 -
Gain on Sale of Business - - (27.7) - -
Other 4.2 5.1 3.0 7.0 4.5
Adjusted EBITDA $172.2 $154.8 $156.3 $156.4 $150.0
Less: Capital Expenditures(1)(2) (40.9) (39.9) (54.7) (47.2) (45.3)
Free Cash Flow(3) $131.3 $114.9 $101.6 $109.2 $104.7
(1) Includes PP&E and software capex. (2) For each period, amount includes capex which EnPro had purchased during the period but for which cash payments had not yet been made. See footnote 1 in the “Notes to Consolidated Financial Statements” of the 2016 Form 10-K for reference. (3) FCF defined as adjusted EBITDA less capex.
19 19
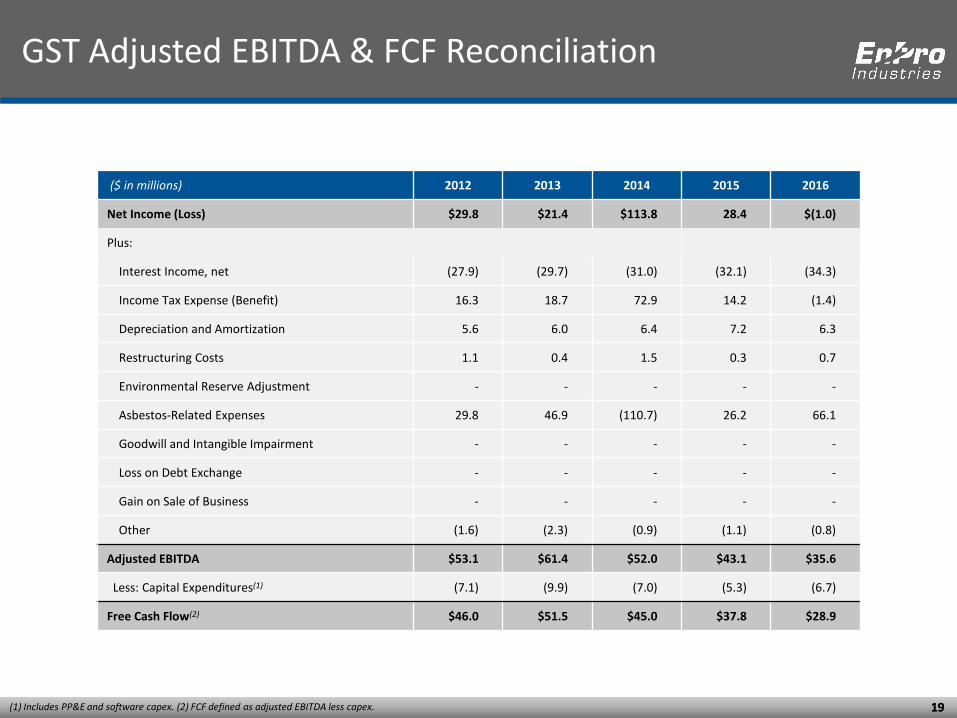
GST Adjusted EBITDA & FCF Reconciliation
($ in millions) 2012 2013 2014 2015 2016
Net Income (Loss) $29.8 $21.4 $113.8 28.4 $(1.0)
Plus:
Interest Income, net (27.9) (29.7) (31.0) (32.1) (34.3)
Income Tax Expense (Benefit) 16.3 18.7 72.9 14.2 (1.4)
Depreciation and Amortization 5.6 6.0 6.4 7.2 6.3
Restructuring Costs 1.1 0.4 1.5 0.3 0.7
Environmental Reserve Adjustment - - - - -
Asbestos-Related Expenses 29.8 46.9 (110.7) 26.2 66.1
Goodwill and Intangible Impairment - - - - -
Loss on Debt Exchange - - - - -
Gain on Sale of Business - - - - -
Other (1.6) (2.3) (0.9) (1.1) (0.8)
Adjusted EBITDA $53.1 $61.4 $52.0 $43.1 $35.6
Less: Capital Expenditures(1) (7.1) (9.9) (7.0) (5.3) (6.7)
Free Cash Flow(2) $46.0 $51.5 $45.0 $37.8 $28.9
(1) Includes PP&E and software capex. (2) FCF defined as adjusted EBITDA less capex.

20 20
GST Adjusted EBITDA & FCF Reconciliation
($ in millions) 2012 2013 2014 2015 2016
Adjusted EBITDA
EnPro $172.2 $154.8 $156.3 $156.4 $150.0
GST 53.1 61.4 52.0 43.1 35.6
Pro Forma Adjusted EBITDA(1) $225.3 $216.2 $208.3 $199.5 $185.6
Capex
EnPro $40.9 $39.9 $54.7 $47.2 $45.3
GST 7.1 9.9 7.0 5.3 6.7
Pro Forma Capex(2) $48.0 $49.8 $61.7 $52.5 $52.0
Pro Forma FCF(3) $177.3 $166.4 $146.6 $147.0 $133.6
(1) See adjusted EBITDA reconciliations for EnPro and GST in appendix. (2) “Pro Forma Capex” defined as sum of total EnPro capex and total GST capex. (3) “Pro Forma FCF” defined as pro forma adjusted EBITDA less pro forma capex.

21 21
Reconciliation of Net Sales to Pro Forma Net Sales
Sealing Products 2012 2013 2014 2015 2016 Net Sales $609.1 $622.9 $664.3 $705.6 $705.6 Adjustments:
Sales of Unconsolidated Entities 230.4 232.7 230.3 210.4 189.2 Intercompany Sales (38.3) (44.2) (50.3) (47.6) (42.5)
Pro Forma Net Sales $801.2 $811.4 $844.3 $868.4 $852.3
Engineered Products 2012 2013 2014 2015 2016 Net Sales $363.0 $356.4 $357.6 $297.8 $277.1 Adjustments:
Sales of Unconsolidated Entities 5.3 4.8 4.5 3.0 2.4 Intercompany Sales (3.3) (3.3) (2.4) (1.7) (1.5)
Pro Forma Net Sales $365.0 $357.9 $359.7 $299.1 $278.0
Power Systems 2012 2013 2014 2015 2016 Net Sales $214.6 167.6 $200.1 $204.6 $208.3 Adjustments:
Sales of Unconsolidated Entities 4.4 7.3 5.8 4.2 4.2 Intercompany Sales (4.3) (3.2) (2.9) (1.8) (1.4)
Pro Forma Net Sales $214.7 $171.7 $203.0 $207.0 $211.1
EnPro 2012 2013 2014 2015 2016 Net Sales $1,184.2 $1,144.2 $1,219.3 $1,204.4 $1,187.7 Adjustments:
Sales of Unconsolidated Entities 240.1 244.8 240.6 217.6 195.8 Intercompany Sales (46.3) (50.9) (55.8) (51.4) (45.8)
Pro Forma Net Sales $1,378.0 $1,338.1 $1,404.1 $1,370.6 $1,337.7

22 22
Reconciliation of Segment Profit to Pro Forma Adjusted Segment EBITDA
Sealing Products 2012 2013 2014 2015 2016 Segment Profit $88.8 $97.1 $85.6 $84.3 $81.8 Adjustments:
Segment Profit of Unconsolidated Entities 44.4 51.5 42.5 34.5 28.3 Pro Forma D&A Adjustments (6.6) (6.6) (6.6) (6.6) (6.6)
Pro Forma Segment Profit $126.6 $142.0 $121.5 $112.2 $103.5 Acquisition Expenses 2.6 0.3 0.2 3.8 1.0 Restructuring Costs 2.4 1.3 3.8 0.6 4.0 Depreciation and Amortization Expenses 42.4 42.9 43.9 48.1 47.9
Pro Forma Adjusted Segment EBITDA $174.0 $186.5 $169.4 $164.7 $156.4
Engineered Products 2012 2013 2014 2015 2016 Segment Profit $20.5 $17.6 $26.8 $6.4 $12.4 Adjustments:
Segment Profit of Unconsolidated Entities 2.0 2.4 1.9 1.0 0.6 Pro Forma D&A Adjustments - - - - -
Pro Forma Segment Profit $22.5 $20.0 $28.7 $7.4 $13.0 Acquisition Expenses 1.0 0.2 0.1 - 0.1 Restructuring Costs 3.7 3.7 - 6.2 6.8 Depreciation and Amortization Expenses 21.8 22.5 22.5 19.5 17.6
Pro Forma Adjusted Segment EBITDA $49.0 $46.4 $51.3 $33.1 $37.5
Power Systems 2012 2013 2014 2015 2016 Segment Profit $39.2 $14.0 $28.5 $27.1 $17.0 Adjustments:
Segment Profit of Unconsolidated Entities 0.8 1.5 1.1 0.8 0.7 Pro Forma D&A Adjustments - - - - -
Pro Forma Segment Profit $40.0 $15.5 $29.6 $27.9 $17.7 Acquisition Expenses - - - - - Restructuring Costs - 2.0 - - 0.4 Depreciation and Amortization Expenses 3.1 3.6 3.8 4.1 4.5
Pro Forma Adjusted Segment EBITDA $43.1 $21.1 $33.4 $32.0 $22.6