gabaa receptor 1subunitmutationa322dassociated ... · gaba a receptor...
TRANSCRIPT
GABAA Receptor �1 Subunit Mutation A322D Associatedwith Autosomal Dominant Juvenile Myoclonic EpilepsyReduces the Expression and Alters the Composition of WildType GABAA Receptors*□S
Received for publication, May 10, 2010, and in revised form, June 11, 2010 Published, JBC Papers in Press, June 15, 2010, DOI 10.1074/jbc.M110.142299
Li Ding‡, Hua-Jun Feng‡, Robert L. Macdonald‡§¶, Emanuel J. Botzolakis‡, Ningning Hu‡, and Martin J. Gallagher‡1
From the Departments of ‡Neurology, §Molecular Physiology and Biophysics, and ¶Pharmacology, Vanderbilt University,Nashville, Tennessee 37232
A GABAA receptor (GABAAR) �1 subunit mutation, A322D(AD), causes an autosomal dominant formof juvenilemyoclonicepilepsy (ADJME). Previous studies demonstrated that themutation caused�1(AD) subunitmisfolding and rapid degrada-tion, reducing its total and surface expression substantially.Here, we determined the effects of the residual �1(AD) subunitexpression on wild type GABAAR expression to determinewhether the ADmutation conferred a dominant negative effect.We found that although the �1(AD) subunit did not substitutefor wild type �1 subunits on the cell surface, it reduced the sur-face expression of�1�2�2 and�3�2�2 receptors by associatingwith the wild type subunits within the endoplasmic reticulumand preventing them from trafficking to the cell surface. The�1(AD) subunit reduced surface expression of �3�2�2 recep-tors by a greater amount than �1�2�2 receptors, thus alteringcell surface GABAAR composition. When transfected into cul-tured cortical neurons, the �1(AD) subunit altered the timecourse ofminiature inhibitory postsynaptic current kinetics andreduced miniature inhibitory postsynaptic current amplitudes.These findings demonstrated that, in addition to causing a het-erozygous loss of function of �1(AD) subunits, this epilepsymutation also elicited a modest dominant negative effect thatlikely shapes the epilepsy phenotype.
GABAARs2 are ligand-gated ion channels that provide themajor source of inhibitory control to the mammalian centralnervous system. Each GABAAR is a pentamer whose five sub-units arise from seven subunit families that contain multiplesubtype isoforms. Neurons preferentially express GABAARscomposed of distinct combinations of subunit isoforms in dif-ferent brain regions at well defined times in development (1–3).
Atmaturity, themost prevalent GABAAR throughout the brainconsists of two �1 subunits, two �2 subunits, and one �2 sub-unit in a �2-�1-�2-�1-�2 assembly (4–6). To date, 13 autoso-mal dominant mutations in GABAAR subunit genes have beenassociated with different epilepsy syndromes (7).The missense ADmutation in the GABAAR �1 subunit gene
(GABRA1) causes ADJME (8), a monogenic form of a commonepilepsy syndrome that begins at a distinct developmental timepoint (adolescence) and confers myoclonic, generalized tonic-clonic, and absence seizures as well as neuropsychiatric co-morbidities (9). We demonstrated previously that the ADmutation, which substitutes a negatively charged aspartatefor a neutral alanine within the M3 transmembrane domain,causes the �1(AD) subunit to misfold with altered topology(10). Cells rapidly degrade the misfolded �1(AD) subunitthrough both proteasome- and lysosome-mediated processes(10, 11). Therefore, the�1(AD) subunit is expressed at substan-tially lower levels than the wild type �1 subunit. GABAARs thatdo incorporate the residual, nondegraded �1(AD) subunitsexhibit substantially altered electrophysiological properties (8,12, 13). Therefore, a major consequence of heterozygousexpression of the AD mutation is a heterozygous loss of func-tional �1 subunits.However, it is unlikely that �1 subunit haploinsufficiency
alone explains the entire ADJME phenotype. HeterozygousGabra1 knock-out mice do not exhibit spontaneous behavioralseizures. Moreover, a recently discovered GABRA1 frameshiftmutation that causes complete elimination of the mutant �1subunit protein causes a much milder form of epilepsy thanjuvenile myoclonic epilepsy (14, 15). These findings suggestthat despite being misfolded and substantially degraded, theresidual �1(AD) subunit likely has other pathophysiologicalactions that lead to a more severe phenotype than would becaused by haploinsufficiency alone. Recently, an extremelysmall dominant negative effect caused by another epilepsy-as-sociated GABAAR subunit mutation, �2(R43Q), proved to becritical for causing the epilepsy phenotype (16–19). Therefore,we set out to determine whether the �1(AD) subunit alteredwild type GABAAR expression, physiology, or cellular viability.
MATERIALS AND METHODS
Cell Culture—HEK293T cells were purchased from Ameri-can Type Culture Collection and were cultured at 37 °C in 5%CO2, 95% air in Dulbecco’s modified Eagle’s medium (DMEM,
* This work was supported, in whole or in part, by National Institutes of HealthGrants NS055979 (to M. J. G.), NS33300 (to R. L. M.), and NS51590 (toR. L. M.) from the USPHS.
□S The on-line version of this article (available at http://www.jbc.org) containssupplemental Figs. 1–3.
1 To whom correspondence should be addressed: Dept. of Neurology,Vanderbilt University, 6140 Medical Research Bldg. III, 465 21st Ave., South,Nashville, TN 37232-8552. Tel.: 615-322-5979; Fax: 615-322-5517; E-mail:[email protected].
2 The abbreviations used are: GABAAR, GABA receptor type A; mIPSC, minia-ture inhibitory postsynaptic current; ER, endoplasmic reticulum; ADJME,autosomal dominant form of juvenile myoclonic epilepsy; DIV, daysin vitro.
THE JOURNAL OF BIOLOGICAL CHEMISTRY VOL. 285, NO. 34, pp. 26390 –26405, August 20, 2010© 2010 by The American Society for Biochemistry and Molecular Biology, Inc. Printed in the U.S.A.
26390 JOURNAL OF BIOLOGICAL CHEMISTRY VOLUME 285 • NUMBER 34 • AUGUST 20, 2010
by guest on February 19, 2019http://w
ww
.jbc.org/D
ownloaded from
Invitrogen) with 10% fetal bovine serum (FBS, Invitrogen) and100 IU/ml streptomycin and penicillin (Invitrogen). Cells werereplated twice weekly.We adapted our neuron culture protocol from one described
previously (20). Briefly, we dissected cerebral cortices fromthe brains of embryonic day 18 (E18) Sprague-Dawley ratpups. After trypsin digestion and trituration, we plated 6.7 �105 neurons in 35-mm dishes on polyornithine-coated cov-erslips. The neurons were initially cultured in DMEM con-taining 80�Mglutamine, 8% FBS, and 8% F-12 nutrientmixture(Invitrogen). After 3 days, we added cytosine arabinoside to afinal concentration of 1 �M to control glial proliferation(Sigma). On the following day, we exchanged the media withNeurobasalmedia that containedB27 supplement (Invitrogen).One-half volumes of Neurobasal media were exchanged threetimes/week.Expression Vectors and Transfection—The pcDNA3.1 plas-
mids containing cDNAs that encode human �1, �1(AD), �2S,and �2S GABAAR receptor subunits were described previously(10, 13, 21). The DNA encoding the �3 subunit was obtainedfrom Origin Technologies, Inc. It was subcloned into thepcDNA3.1 vector and modified to match the coding sequencesfound in the GenBankTM and Swiss Protein Databases. ThecDNA encoding hemagglutinin (HA) epitope-tagged trans-forming growth factor � (TGFHA) protein was generouslycontributed by Dr. Robert Coffey, Vanderbilt University. ThepmaxGFP vector was from Lonza. The wild type and dominantnegative K44A dynamin1 plasmids were a kind gift from Dr.Pietro De Camilli (Yale University). We purchased the pLVX-IRES-ZsGreen1 bicistronic vector from Clontech.In this study, we numbered amino acids starting from the
initiation methionine in the signal peptide. Using standardmolecular biology techniques, we deleted the codon thatencodes leucine 31 (leucine 4 as numbered from the putative Nterminus of the mature peptide) from the human �1 subunitcDNA (�1h) tomake a cDNAencoding the rat�1 subunit (�1r).We also introduced the nucleotides encoding the hemaggluti-nin (HA) epitope tag (YPYDVPDYA) between the codonsencoding the 31st and 32nd amino acids (fourth and fifth aminoacids as numbered from the putative N terminus of the maturepeptide) of the�1h subunit to form the�1HA subunit. Similarly,we inserted the HA epitope in the homologous positions of the�2 and �2 sequences to form the �2HA and �2HA subunits. Wemade the AD mutation in the �1HA and �1r subunit cDNAusing the QuikChange site-directed mutagenesis kit (Strat-agene). To make constructs for use in neuronal transfections,we inserted the cDNA encoding the human �1, �1(AD), �1HA,and �1(AD)HA subunits into the pLVX-IRES-ZsGreen1 vector.
We transfected HEK293T cells in 6-cm dishes with 3 �g oftotal cDNA using the FuGENE 6 transfection reagent (RocheDiagnostics, 3 �l/�g DNA). The amount of cDNA encodingeach subunit is listed in the figure legends. If the total GABAARsubunit cDNA was less than 3 �g, we added sufficient emptypcDNA3.1 vector so that the total DNA transfected equaled 3�g. Neurons were transfected 10 days after plating (DIV10)using a calcium phosphatemethod as described elsewhere (22).Antibodies—The mouse monoclonal anti-�1 subunit anti-
body N95/35 was from the University of California, Davis/Na-
tional Institutes of Health NeuroMab Facility. The mousemonoclonal anti-human GABAAR �1 (�1h) subunit antibody(BD24), the rabbit polyclonal anti-rat �1 subunit antibody (�1r,06-868, lot 026K4848), the rabbit polyclonal anti-�2 subunitantibody (AB5561, lot LV1512412), and themousemonoclonalanti-neuronal nuclei (NeuN) antibody (clone A60) were fromMillipore. The rabbit polyclonal anti-GABAAR�3 subunit anti-body (AGA-003, lot AN-02) was from Alamone. The unconju-gated and Alexa 647- (A647) and Alexa 555 (A555)-conjugatedmouse monoclonal anti-HA antibodies (HA-555, HA-647)were from Covance (clone 16B12). The rabbit polyclonal anti-glyceraldehyde-3-phosphate dehydrogenase (GAPDH, AB948,lot 708812) and mouse monoclonal anti-sodium potassiumATPase �1 subunit (ATPase, AB7671) were from Abcam. Forthe flow cytometry experiments, we directly conjugatedthe mouse anti-�1h antibody to the A647 fluorphore (�1h-647) using a commercial monoclonal antibody labeling rea-gent (Invitrogen).Biotinylation and Western Blot Assays—The biotinylation
and Western blot assays have been described previously (13,23). Briefly, live cells were washed in PBS containing 1 mM
CaCl2 and 0.5 mM MgCl2 (PBS-CM) and incubated with themembrane-impermeable, amine-reactive biotinylation re-agent, NHS-SS-biotin (3 mM, Thermo), for 15 min at 4 °C. Thebiotinylation reaction was quenched by washing the cells threetimes with PBS-CM containing 100 mM glycine.We lysed the biotinylated cells in modified radioimmunoas-
say solution (RIPA, 20 mM Tris, pH 7.4, 1% Triton X-100, 250mM NaCl, 0.5% deoxycholate, 0.1% SDS) that also contained 1pellet of protease inhibitor per 10 ml (Roche Diagnostics). Thelysates were centrifuged at 10,000 � g for 30 min, and the pro-tein concentration was measured using a bicinchoninic acid-based assay (Thermo). To determine total GABAAR subunitexpression, we applied the unpurified lysates directly to a 10%SDS-polyacrylamide gel. To measure surface protein, we incu-bated equal masses of biotinylated lysates with immobilizedneutravidin beads (Thermo) overnight. The neutravidin beadswerewashedwithRIPAbuffer, and the biotinylated proteinwasliberated by incubation with Laemmli sample buffer and frac-tionated on a 10% SDS-polyacrylamide gel. We confirmed thatthe proteins of interest did not nonspecifically adhere to theneutravidin beads by also incubating lysates from nonbiotiny-lated cells with the beads before applying them to SDS-PAGE(data not shown). In each experiment, we confirmed that thebiotinylation reagent did not modify intracellular proteins bymeasuring GAPDH immunoreactivity in the neutravidin-puri-fied lysates (data not shown).After SDS-PAGE, we electrotransferred the proteins to
nitrocellulose membranes. For the Western blots using theanti-�1, -�1h, -�3, -�2, -ATPase, and -GAPDH antibodies, weblocked the membranes with Tris-buffered saline containing0.1%Tween (TTBS) and 5% nonfatmilk.We blocked theWest-ern blots using the anti-HA antibody with PBS containing 0.1%Tween and 0.5% bovine serum albumin (BSA, Sigma).After incubation with the primary antibody, the immunob-
lots were incubated with a horseradish peroxidase-coupledgoat anti-mouse or anti-rabbit secondary antibody (JacksonImmunoResearch, 1:5000 dilution) and then visualized with a
GABRA1 A322D Mutation Causes Dominant Negative Effects
AUGUST 20, 2010 • VOLUME 285 • NUMBER 34 JOURNAL OF BIOLOGICAL CHEMISTRY 26391
by guest on February 19, 2019http://w
ww
.jbc.org/D
ownloaded from
chemiluminescent detection system (Amersham Biosciences)using a digital imager (Alpha Innotech). The integrated inten-sities of the Western blot bands were calculated using theImageJ software (National Institutes of Health). We confirmedthat the integrated intensities of all the bands remained in thelinear range of detection by loading three different masses ofprotein on the gels and performing a linear regression throughthe origin of the integrated intensity versus protein mass. Theintegrated intensities of all proteins were normalized to theloading control (ATPase).Flow Cytometry and Fluorescent Resonance Energy Transfer
(FRET)—Flow cytometry and FRET were performed as de-scribed previously (24, 25). Briefly, transfected cells weredetached from the plastic plates by incubating them with tryp-sin for 1min at room temperature, a process that does not causedegradation of surface GABAAR protein (24). All subsequentsteps were performed at 0 °C.We stopped the trypsinization byadding 5 ml of FACS buffer (PBS containing 2% FBS and 0.05%sodium azide). The cells were pelleted and placed into 96-wellplates. To measure surface protein expression, the cells werestained without fixation, and to measure total protein, the cellswere treated with a commercial fixation/permeabilization rea-gent (BD Biosciences) before staining. The cells were stainedwith the anti-�1h-647 (1:100), -�1r (1:50), -�3 (1:50), andHA-555 or HA-647 (1:100) antibodies for 1 h. The cells stainedwith the anti-�1r and -�3 antibodies were then stained withA647-conjugated goat anti-rabbit antibody (1:250, Invitrogen).In each experiment, we confirmed that these dilutions repre-sented saturating concentrations of the respective antibodiesby also staining negative control cells and wild type GABAARcells with a 2-fold higher concentration of antibody and verify-ing that the fluorescence did not substantially change (data notshown). After staining, the cells were fixed with 2% paraform-aldehyde in PBS.For each sample, we analyzed 10,000 cells on an LSR II digital
flow cytometer (BD Biosciences). We identified viable cellsbased upon their forward and side scatter properties (data notshown) that were originally determined from staining with themembrane-impermeable dye, 7-aminoactinomycin D (Invitro-gen) (24, 25). The A647 fluorophore was excited by a 635 nmlaser and detected with a 675/20 bandpass filter, and the A555fluorophore was excited with a 535 nm laser and detected witha 575/26 bandpass filter. GFPwas excited by a 488-nm laser anddetected using a 530/30 bandpass filter. In each of the samples,we measured the mean GFP, A555, and A647 fluorescence inviable cells using the FlowJo 7.2 software (Treestar) and sub-tracted the mean fluorescence obtained from negative controlcells.We measured the FRET between the samples stained with
A555-coupled antibody (donor) and a A647-coupled antibody(acceptor) by exciting the A555 fluorophore with the 535-nmlaser and detecting the FRET to the A647 fluorophore using670/20 bandpass filter. To eliminate the fluorescence resultingfrom direct 535 nm stimulation to the A555 and A647 fluoro-phores from the FRET signal, we performed spectral compen-sation using singly stained samples and the FlowJo 7.2 software(Treestar). We then subtracted the mean FRET fluorescencefrom the samples stained with only the A647 fluorophore from
those stained with both the A555 and A647 fluorophores tocalculate the specific mean FRET fluorescence.Confocal Microscopy and Image Analysis—Microscopic
analyseswere performedusing the coverslips onwhich the neu-ronswere originally plated.OnDIV17, 7 days after transfection,we washed the neurons three times in PBS and then fixed themin 4% paraformaldehyde, 4% sucrose in PBS for 15 min at roomtemperature.Wewashed the neurons three times with PBS andthen incubated them with 0.1% Triton X-100 in PBS for 5 minbefore washing three more times with PBS. We blocked non-specific binding by incubating the fixed neurons with 0.5% BSAin PBS for 1 h at room temperature. We stained the neuronswith either anti-NeuN (1:200) or anti-�1h antibody (1:1000)diluted in 0.2%BSA in PBS overnight at 4 °C. The following day,we washed the neurons five times with PBS and then incubatedthem for 1 h with Alexa 546-conjugated goat anti-mouse anti-body diluted in PBS containing 0.2% BSA. We washed themwith PBS five more times and counterstained them with 4�,6-diamidino-2-phenylindole (DAPI).Confocal imaging was performed through the use of the
Vanderbilt University Medical Center Cell Imaging SharedResource.We visualized the neurons with an Olympus FV1000confocal microscope using a 60�/1.45 numerical apertureplan-apochromat objective.We used the recommendedOlym-pus laser and filter combinations to separately detect DAPI,ZsGreen1, andA546 fluorescence and used singly stained spec-imens to verify that these fluorophores did not spectrally over-lap. We adjusted the pinhole of all channels to obtain 3-�msections, and we obtained a single section at the level of thenucleus. In each experiment, we adjusted the laser intensity anddetector sensitivity to utilize the full linear range of detection,and we used the same settings for all the samples acquired dur-ing the experiment. Images were obtained with 12-bit, 1024 �1024 pixel resolution.To determine the percentage of cells in the culture that con-
sisted of neurons, we stained the cells with an antibody againstNeuN. In three different regions of the slide, we determined thefraction of cells stained with DAPI that were also stained withNeuN. To determine the percentage of neurons transfected, wecalculated the fraction of neurons stained with NeuN that alsoexpressed ZsGreen1.To determine the expression of recombinant �1h and
�1(AD)h subunits, we visually identified several ZsGreen1-ex-pressing neurons fromeach culture.We then acquired confocalimages of each neuron. We analyzed the images off line usingthe ImageJ software.Wedetermined themean fluorescence of a5-pixel wide line drawn either through the nucleus (forZsGreen1 fluorescence) or though the soma excluding thenucleus (for �1h fluorescence). We normalized the fluores-cence of each neuron to the mean fluorescence of the neuronstransfected with wild type �1h that were imaged on the sameday.Electrophysiology—We recorded mIPSCs on pyramidal
neurons on DIV17, 7 days after transfection. The coverslipsthat contained the neurons were placed in 35-mm plasticculture dishes and covered with external recording solutionthat contained the following (in mM): NaCl (142), HEPES(10), KCl (8), CaCl2 (1), glucose (10), andMgCl2 (6), pH 7.4.We
GABRA1 A322D Mutation Causes Dominant Negative Effects
26392 JOURNAL OF BIOLOGICAL CHEMISTRY VOLUME 285 • NUMBER 34 • AUGUST 20, 2010
by guest on February 19, 2019http://w
ww
.jbc.org/D
ownloaded from
added 1�M tetrodotoxin, 40�M D-(�)-2-amino-5-phosphono-valeric acid, 10 �M 6-cyano-7-nitroquinoxaline-2,3-dione, and1 �M CGP52432 to the external solution to block action poten-tials and NMDA, AMPA, and GABAB currents. The intrapi-pette solution contained the following (in mM): KCl (153),EGTA (5), HEPES (10), MgCl2 (1), and Mg-ATP (2), pH 7.3.Recording electrodes were pulled from borosilicate capillaryglass (Fisher) on a micropipette electrode puller (Sutter) andtypically had a resistance of �2 megohms.We visually identified transfected pyramidally shaped neu-
rons by ZsGreen1 fluorescence using an inverted fluorescencemicroscope (Nikon). After making a gigaohm seal with thesoma, we broke through the membrane to establish electricalcontact with the cytoplasm. We voltage-clamped the neuronsat �60 mV using an Axopatch 200B amplifier and using thepClamp software (Molecular Devices).We recordedmore than100 mIPSC events from each neuron. Each mIPSC recordingwas analyzed off line by an investigator who was blinded to thetransfection conditions. The mIPSCs were chosen manuallyusing the Mini Analysis software (Synaptosoft). The detectionthreshold was set at 15 pA. The inter-mIPSC intervals, mIPSCamplitude, rise time, and decay time constants were recorded.Data Analysis—Expression levels of the GABAAR subunits
were normalized to those obtained from thewild type conditionand were reported as means � S.E. Statistical significance wasdetermined using the Student’s paired or unpaired t test orpaired or unpaired analysis of variance test, as appropriate.To simplify the presentation of our data, which determined
the effects of co-transfecting different masses of �1(AD) sub-unit cDNAonwild typeGABAAR expression, we fit the expres-sion levels to the sigmoidal concentration-response equation asfollows:Y� 100%/(1� (X/IC50)Hill slope), whereY is the expres-sion level of the GABAAR subunit normalized to that obtainedin the absence of the �1(AD) subunit, and X is the mass of�1(AD) subunit cDNA. We must emphasize that although weconnected our data points with the fit concentration depen-dence equation, we are not asserting that the �1(AD) subunitnecessarily acted by binding competitively with wild typeGABAARs. Therefore, we made statistical comparisons be-tween themean expression levels instead of the fit IC50 andHillslope values.The mIPSC inter-mIPSC intervals, rise times, decay time
constants, and peak amplitudes were compared using both anonparametric analysis of variance and Kolmogorov-Smirnovtests. For theKolmogorov-Smirnov test, the Bonferroni correc-tion was applied to assess statistical significance among thethree transfection conditions.
RESULTS
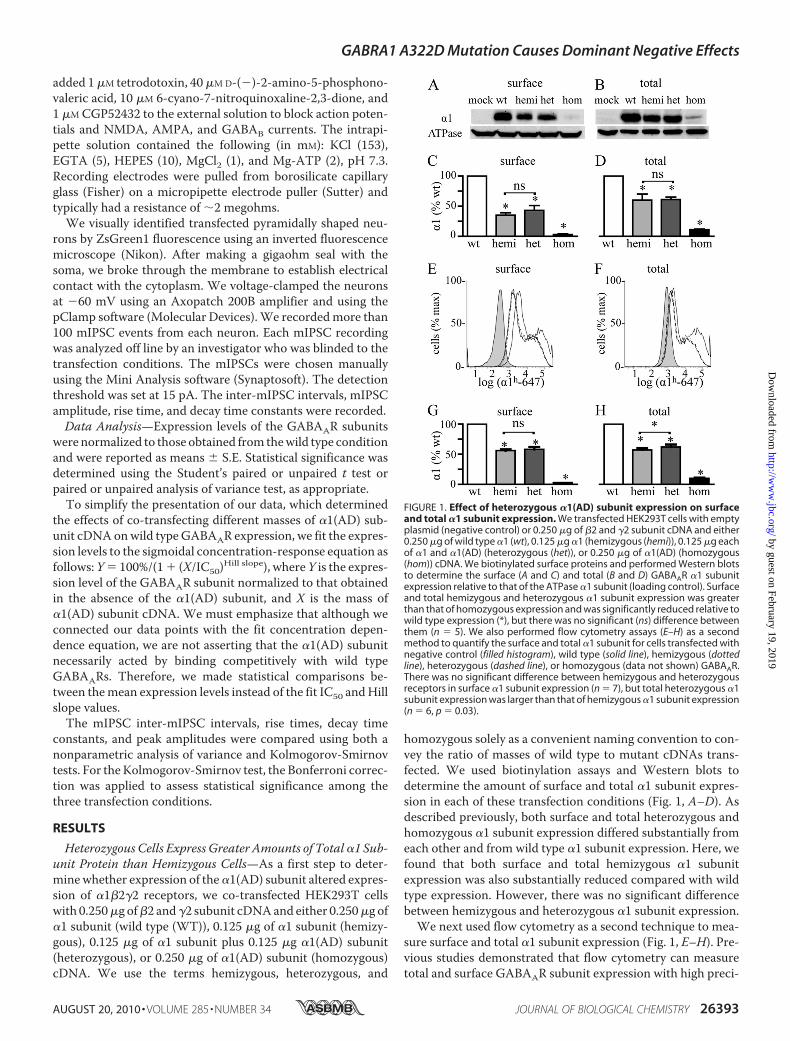
Heterozygous Cells Express Greater Amounts of Total�1 Sub-unit Protein than Hemizygous Cells—As a first step to deter-minewhether expression of the�1(AD) subunit altered expres-sion of �1�2�2 receptors, we co-transfected HEK293T cellswith 0.250�g of�2 and�2 subunit cDNAand either 0.250�g of�1 subunit (wild type (WT)), 0.125 �g of �1 subunit (hemizy-gous), 0.125 �g of �1 subunit plus 0.125 �g �1(AD) subunit(heterozygous), or 0.250 �g of �1(AD) subunit (homozygous)cDNA. We use the terms hemizygous, heterozygous, and
homozygous solely as a convenient naming convention to con-vey the ratio of masses of wild type to mutant cDNAs trans-fected. We used biotinylation assays and Western blots todetermine the amount of surface and total �1 subunit expres-sion in each of these transfection conditions (Fig. 1, A–D). Asdescribed previously, both surface and total heterozygous andhomozygous �1 subunit expression differed substantially fromeach other and from wild type �1 subunit expression. Here, wefound that both surface and total hemizygous �1 subunitexpression was also substantially reduced compared with wildtype expression. However, there was no significant differencebetween hemizygous and heterozygous �1 subunit expression.
We next used flow cytometry as a second technique to mea-sure surface and total �1 subunit expression (Fig. 1, E–H). Pre-vious studies demonstrated that flow cytometry can measuretotal and surface GABAAR subunit expression with high preci-
FIGURE 1. Effect of heterozygous �1(AD) subunit expression on surfaceand total �1 subunit expression. We transfected HEK293T cells with emptyplasmid (negative control) or 0.250 �g of �2 and �2 subunit cDNA and either0.250 �g of wild type �1 (wt), 0.125 �g �1 (hemizygous (hemi)), 0.125 �g eachof �1 and �1(AD) (heterozygous (het)), or 0.250 �g of �1(AD) (homozygous(hom)) cDNA. We biotinylated surface proteins and performed Western blotsto determine the surface (A and C) and total (B and D) GABAAR �1 subunitexpression relative to that of the ATPase �1 subunit (loading control). Surfaceand total hemizygous and heterozygous �1 subunit expression was greaterthan that of homozygous expression and was significantly reduced relative towild type expression (*), but there was no significant (ns) difference betweenthem (n � 5). We also performed flow cytometry assays (E–H) as a secondmethod to quantify the surface and total �1 subunit for cells transfected withnegative control (filled histogram), wild type (solid line), hemizygous (dottedline), heterozygous (dashed line), or homozygous (data not shown) GABAAR.There was no significant difference between hemizygous and heterozygousreceptors in surface �1 subunit expression (n � 7), but total heterozygous �1subunit expression was larger than that of hemizygous �1 subunit expression(n � 6, p � 0.03).
GABRA1 A322D Mutation Causes Dominant Negative Effects
AUGUST 20, 2010 • VOLUME 285 • NUMBER 34 JOURNAL OF BIOLOGICAL CHEMISTRY 26393
by guest on February 19, 2019http://w
ww
.jbc.org/D
ownloaded from
sion and thus could potentially detect differences betweenhemizygous and heterozygous expression that could not bedetected with Western blot assays (24). We found that flowcytometry did quantify �1 subunit expression with smallerstandard deviations than Western blot experiments and wasable to detect that heterozygous cells expressed 9% more total�1 subunit than hemizygous cells (p� 0.05). However, the flowcytometry experiments did not detect a difference betweenheterozygous and hemizygous cells in surface �1 subunitexpression.Wild Type �1 Subunit Accounted for 92–96% of the Surface
�1 Subunit with Heterozygous Expression—The experiments inFig. 1 demonstrated that compared with hemizygous cells, het-erozygous cells possessed increased amounts of total �1 sub-unit protein but did not have significantly different amounts ofsurface �1 subunit protein. We thought that the increase intotal �1 subunit protein expression in the heterozygous cellslikely resulted from the residual, nondegraded �1(AD) subunitin intracellular compartments and that the lack of a significantchange in surface expression resulted because the residual�1(AD) subunit did not efficiently traffic to the cell surface.Therefore, we next determined the fraction of surface �1 sub-unitwith heterozygous expression that consisted ofwild type ormutant �1 subunit.Previously, we used �1 and �1(AD) subunits fused to differ-
ent fluorescent proteins and estimated that 5–25%of surface�1subunit with heterozygous expression consisted of the �1(AD)subunit (21). Here, we used flow cytometry with two naturallyoccurring �1 subunits to obtain a more precise estimate of theamount of wild type and mutant �1 subunit on the cell surfacein heterozygous expression. Although fluorescent protein- andepitope-tagged GABAAR subunits incorporate into pentamersto form functional receptors, the addition of the fused fluores-cent protein or epitope tag alters post-translational processingand surface expression of the GABAAR subunits (10, 21).Therefore, we differentiated between wild type and mutant �1subunits by transfecting cells using natural�1 and�1(AD) sub-units from two different species (human and rat) and thendetecting them individually with species-selective antibodies.The mature human �1 (�1h) and rat �1 (�1r) subunit proteinsdiffer by only one amino acid; human �1 subunits possess anadditional leucine at position 31 (position 4 as numbered fromthe putative N terminus of themature peptide) that is absent inthe rat sequence (Fig. 2A). Two commercially available anti-bodies, mouse anti-�1h and rabbit anti-�1r, bind specifically totheir respective subunits.Initial flow cytometry experiments demonstrated that the
species-selective antibodies were very specific for the corre-sponding species of �1 subunit (supplemental Fig. 1). More-over, the anti-�1h-647 antibody demonstrated remarkable spe-cies specificity such that compared with cells transfected with0.250 �g of �2 and �2 subunits and only 0.125 �g of the �1hsubunit, cells transfected with a 16-fold excess (2 �g) of �1rsubunit exhibited 0� 0% the surface fluorescence and 2� 0.2%of the total fluorescence (data not shown). Because the anti-�1rantibody could not be directly coupled to a fluorophore, itsdetection required use of a fluorescent secondary antibody,which produced high levels of background staining in perme-
abilized cells. Therefore, the anti-�1r antibody was only usedfor surface staining.We transfected HEK293T cells with 0.250 �g of �2 and �2
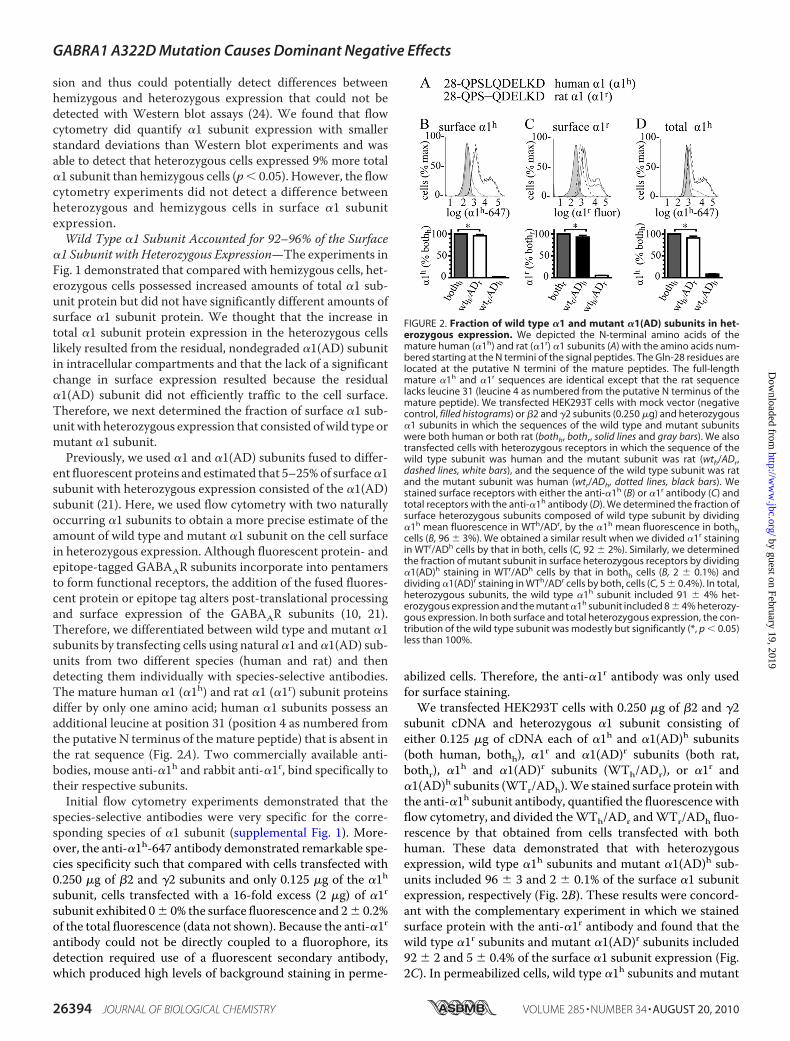
subunit cDNA and heterozygous �1 subunit consisting ofeither 0.125 �g of cDNA each of �1h and �1(AD)h subunits(both human, bothh), �1r and �1(AD)r subunits (both rat,bothr), �1h and �1(AD)r subunits (WTh/ADr), or �1r and�1(AD)h subunits (WTr/ADh).We stained surface proteinwiththe anti-�1h subunit antibody, quantified the fluorescence withflow cytometry, and divided theWTh/ADr andWTr/ADh fluo-rescence by that obtained from cells transfected with bothhuman. These data demonstrated that with heterozygousexpression, wild type �1h subunits and mutant �1(AD)h sub-units included 96 � 3 and 2 � 0.1% of the surface �1 subunitexpression, respectively (Fig. 2B). These results were concord-ant with the complementary experiment in which we stainedsurface protein with the anti-�1r antibody and found that thewild type �1r subunits and mutant �1(AD)r subunits included92 � 2 and 5 � 0.4% of the surface �1 subunit expression (Fig.2C). In permeabilized cells, wild type �1h subunits and mutant
FIGURE 2. Fraction of wild type �1 and mutant �1(AD) subunits in het-erozygous expression. We depicted the N-terminal amino acids of themature human (�1h) and rat (�1r) �1 subunits (A) with the amino acids num-bered starting at the N termini of the signal peptides. The Gln-28 residues arelocated at the putative N termini of the mature peptides. The full-lengthmature �1h and �1r sequences are identical except that the rat sequencelacks leucine 31 (leucine 4 as numbered from the putative N terminus of themature peptide). We transfected HEK293T cells with mock vector (negativecontrol, filled histograms) or �2 and �2 subunits (0.250 �g) and heterozygous�1 subunits in which the sequences of the wild type and mutant subunitswere both human or both rat (bothh, bothr, solid lines and gray bars). We alsotransfected cells with heterozygous receptors in which the sequence of thewild type subunit was human and the mutant subunit was rat (wth/ADr,dashed lines, white bars), and the sequence of the wild type subunit was ratand the mutant subunit was human (wtr/ADh, dotted lines, black bars). Westained surface receptors with either the anti-�1h (B) or �1r antibody (C) andtotal receptors with the anti-�1h antibody (D). We determined the fraction ofsurface heterozygous subunits composed of wild type subunit by dividing�1h mean fluorescence in WTh/ADr, by the �1h mean fluorescence in bothhcells (B, 96 � 3%). We obtained a similar result when we divided �1r stainingin WTr/ADh cells by that in bothr cells (C, 92 � 2%). Similarly, we determinedthe fraction of mutant subunit in surface heterozygous receptors by dividing�1(AD)h staining in WTr/ADh cells by that in bothh cells (B, 2 � 0.1%) anddividing �1(AD)r staining in WTh/ADr cells by bothr cells (C, 5 � 0.4%). In total,heterozygous subunits, the wild type �1h subunit included 91 � 4% het-erozygous expression and the mutant �1h subunit included 8 � 4% heterozy-gous expression. In both surface and total heterozygous expression, the con-tribution of the wild type subunit was modestly but significantly (*, p � 0.05)less than 100%.
GABRA1 A322D Mutation Causes Dominant Negative Effects
26394 JOURNAL OF BIOLOGICAL CHEMISTRY VOLUME 285 • NUMBER 34 • AUGUST 20, 2010
by guest on February 19, 2019http://w
ww
.jbc.org/D
ownloaded from
�1(AD)h subunits included 91 � 4 and 8 � 4% of total �1 sub-unit (Fig. 2D). Therefore, the preponderance (92–96%) of �1subunits on the surface of heterozygous cells was wild type �1subunits.Our data also demonstrated that in both surface and total
heterozygous expression, the contribution of the wild type sub-unit was modestly, but significantly (p � 0.05), less than 100%.This result suggests that the mutant �1(AD) subunit couldcause a dominant negative effect either by substituting for wildtype �1 subunit or by reducing wild type �1 subunit surfaceexpression.Finally, we compared the surface expression of wild type �1h
or �1r protein in heterozygous cells (WTh/ADr or WTr/ADh)with the corresponding hemizygous receptors (hemizygous�1h or �1r). The presence of the mutant subunit caused smallbut, in the case of the�1r protein, statistically significant reduc-tions in surface wild type �1 subunit protein expression (8 �2%, p � 0.009, not shown). This result also suggested that the�1(AD) subunit could reduce wild type �1 subunit surfaceexpression.
�1(AD) Subunit Did Not Substitute for Wild Type �1 Sub-units on the Cell Surface—Experiments in Fig. 2 demonstratedthat when heterozygously expressed in HEK293T cells, mutant�1(AD) subunits included 8% of the total�1 subunits and 2–5%of the surface �1 subunits. However, the fraction of mutant�1(AD) subunits expressed in neurons fromADJME patients isunknown. If the neurons of patients expressed a greater fractionof total �1(AD) subunit than HEK293T cells, would more�1(AD) subunit be expressed on the cell surface and confer adominant negative effect by substituting mutant �1(AD) sub-units for wild type �1 subunits?In a heterologous expression system, we can increase the
amount of protein expression by increasing the mass of cDNAtransfected. Therefore, we transfected cells with�2 and �2 sub-unit cDNA (0.250 �g) and hemizygous (0.125 �g) �1r subunitsand a range (0- 2�g) of wild type�1h or�1(AD)h �1 cDNA.Wequantified the amount of relative total and surface �1h and�1(AD)h subunit expression by flow cytometry and normalizedall the values to the total or surface expression cells transfectedwith hemizygous �1h (“positive control,” �1h�2�2 0.125, 0.250,and 0.250 �g).As expected, increasing the masses of wild type �1h and
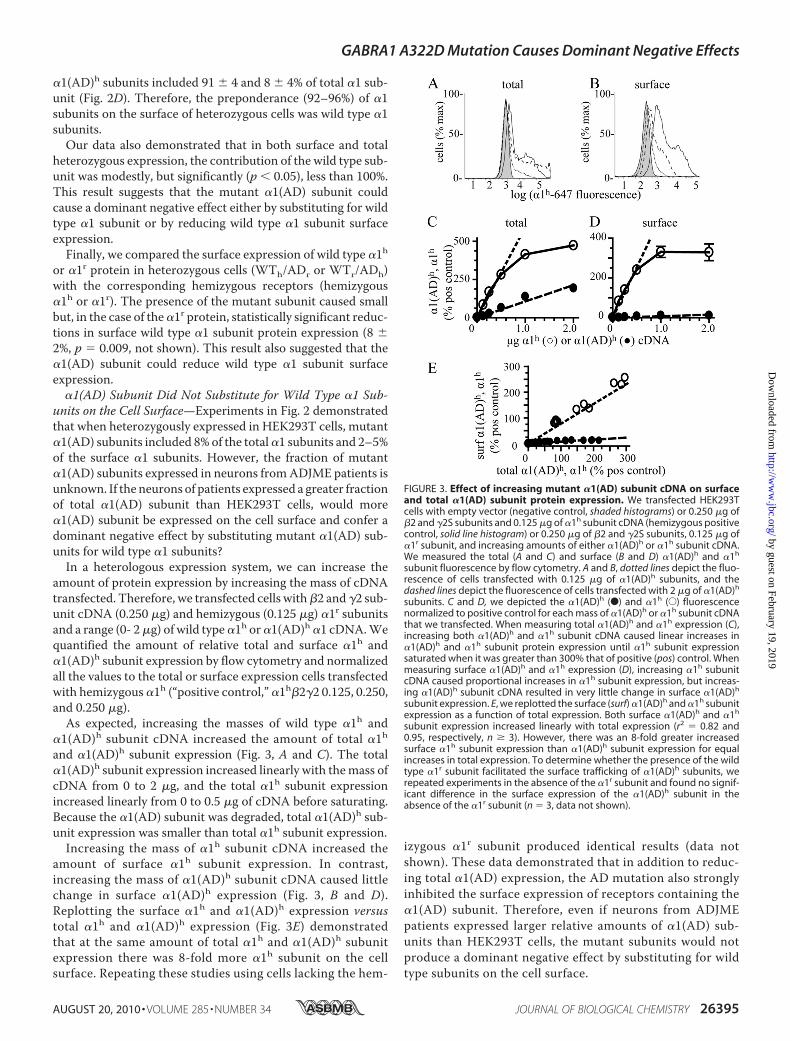
�1(AD)h subunit cDNA increased the amount of total �1hand �1(AD)h subunit expression (Fig. 3, A and C). The total�1(AD)h subunit expression increased linearly with themass ofcDNA from 0 to 2 �g, and the total �1h subunit expressionincreased linearly from 0 to 0.5 �g of cDNA before saturating.Because the �1(AD) subunit was degraded, total �1(AD)h sub-unit expression was smaller than total �1h subunit expression.Increasing the mass of �1h subunit cDNA increased the
amount of surface �1h subunit expression. In contrast,increasing the mass of �1(AD)h subunit cDNA caused littlechange in surface �1(AD)h expression (Fig. 3, B and D).Replotting the surface �1h and �1(AD)h expression versustotal �1h and �1(AD)h expression (Fig. 3E) demonstratedthat at the same amount of total �1h and �1(AD)h subunitexpression there was 8-fold more �1h subunit on the cellsurface. Repeating these studies using cells lacking the hem-
izygous �1r subunit produced identical results (data notshown). These data demonstrated that in addition to reduc-ing total �1(AD) expression, the AD mutation also stronglyinhibited the surface expression of receptors containing the�1(AD) subunit. Therefore, even if neurons from ADJMEpatients expressed larger relative amounts of �1(AD) sub-units than HEK293T cells, the mutant subunits would notproduce a dominant negative effect by substituting for wildtype subunits on the cell surface.
FIGURE 3. Effect of increasing mutant �1(AD) subunit cDNA on surfaceand total �1(AD) subunit protein expression. We transfected HEK293Tcells with empty vector (negative control, shaded histograms) or 0.250 �g of�2 and �2S subunits and 0.125 �g of �1h subunit cDNA (hemizygous positivecontrol, solid line histogram) or 0.250 �g of �2 and �2S subunits, 0.125 �g of�1r subunit, and increasing amounts of either �1(AD)h or �1h subunit cDNA.We measured the total (A and C) and surface (B and D) �1(AD)h and �1h
subunit fluorescence by flow cytometry. A and B, dotted lines depict the fluo-rescence of cells transfected with 0.125 �g of �1(AD)h subunits, and thedashed lines depict the fluorescence of cells transfected with 2 �g of �1(AD)h
subunits. C and D, we depicted the �1(AD)h (F) and �1h (E) fluorescencenormalized to positive control for each mass of �1(AD)h or �1h subunit cDNAthat we transfected. When measuring total �1(AD)h and �1h expression (C),increasing both �1(AD)h and �1h subunit cDNA caused linear increases in�1(AD)h and �1h subunit protein expression until �1h subunit expressionsaturated when it was greater than 300% that of positive (pos) control. Whenmeasuring surface �1(AD)h and �1h expression (D), increasing �1h subunitcDNA caused proportional increases in �1h subunit expression, but increas-ing �1(AD)h subunit cDNA resulted in very little change in surface �1(AD)h
subunit expression. E, we replotted the surface (surf) �1(AD)h and �1h subunitexpression as a function of total expression. Both surface �1(AD)h and �1h
subunit expression increased linearly with total expression (r2 � 0.82 and0.95, respectively, n � 3). However, there was an 8-fold greater increasedsurface �1h subunit expression than �1(AD)h subunit expression for equalincreases in total expression. To determine whether the presence of the wildtype �1r subunit facilitated the surface trafficking of �1(AD)h subunits, werepeated experiments in the absence of the �1r subunit and found no signif-icant difference in the surface expression of the �1(AD)h subunit in theabsence of the �1r subunit (n � 3, data not shown).
GABRA1 A322D Mutation Causes Dominant Negative Effects
AUGUST 20, 2010 • VOLUME 285 • NUMBER 34 JOURNAL OF BIOLOGICAL CHEMISTRY 26395
by guest on February 19, 2019http://w
ww
.jbc.org/D
ownloaded from
�1(AD) Subunit Reduced Surface Expression of theWild Type�1 Subunit—Experiments in Fig. 3 demonstrated that �1(AD)subunits did not cause a dominant negative effect by substitut-ing for wild type �1 subunits on the cell surface, and experi-ments in Fig. 2 suggested that compared with hemizygousexpression the heterozygous expression reduced the wild type�1 subunit on the cell surface. Therefore, we next determinedthe effect transfecting different amounts of �1(AD)r subunit onwild type �1h subunit expression.We transfected HEK293T cells with �2 and �2 subunits
(0.250 �g), hemizygous (0.125 �g) human �1h subunits, and arange (0–2 �g) of rat �1(AD)r cDNAs and measured surfaceand total �1h expression by flow cytometry using the anti-�1hsubunit antibody (Fig. 4). For comparison, we also determinedthe effect of wild type �1r subunit on �1h�2�2 expression.
Because the wild type �1r subunits are not detected by the �1hsubunit antibody, they reduce �1h subunit expression by sub-stitution rather than �1(AD)r subunit-mediated inhibition ofexpression.The �1(AD)r subunit caused a concentration-dependent
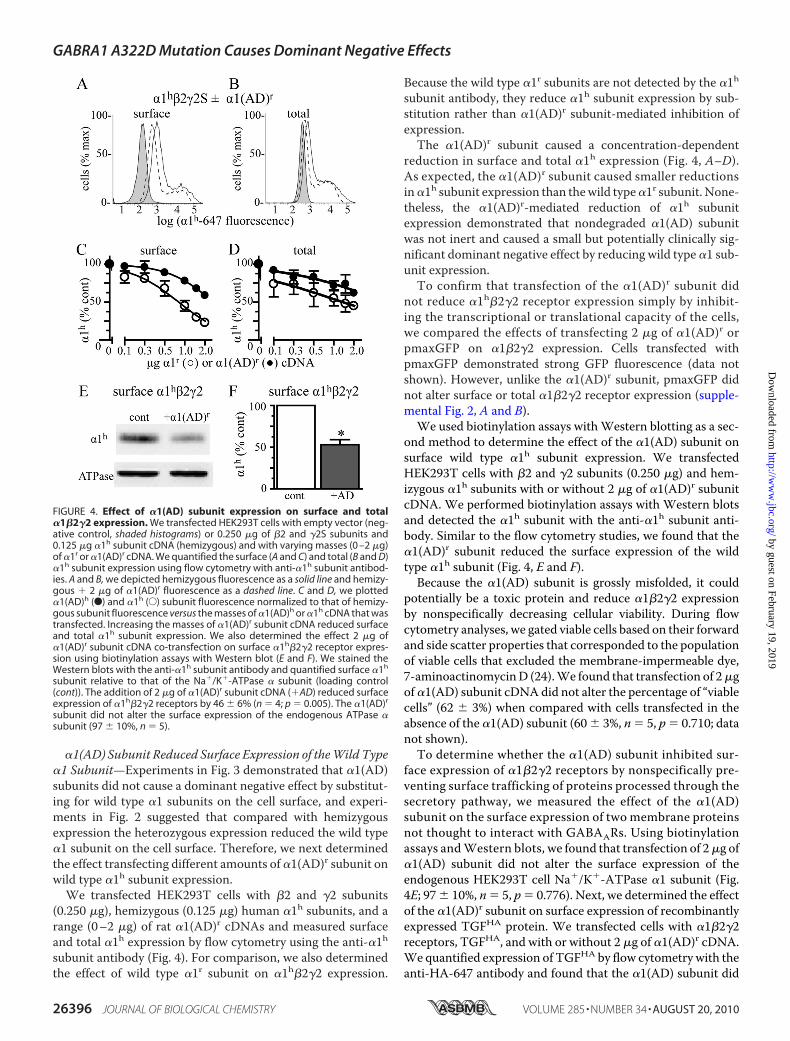
reduction in surface and total �1h expression (Fig. 4, A–D).As expected, the �1(AD)r subunit caused smaller reductionsin�1h subunit expression than thewild type�1r subunit. None-theless, the �1(AD)r-mediated reduction of �1h subunitexpression demonstrated that nondegraded �1(AD) subunitwas not inert and caused a small but potentially clinically sig-nificant dominant negative effect by reducing wild type �1 sub-unit expression.To confirm that transfection of the �1(AD)r subunit did
not reduce �1h�2�2 receptor expression simply by inhibit-ing the transcriptional or translational capacity of the cells,we compared the effects of transfecting 2 �g of �1(AD)r orpmaxGFP on �1�2�2 expression. Cells transfected withpmaxGFP demonstrated strong GFP fluorescence (data notshown). However, unlike the �1(AD)r subunit, pmaxGFP didnot alter surface or total �1�2�2 receptor expression (supple-mental Fig. 2, A and B).
We used biotinylation assays withWestern blotting as a sec-ond method to determine the effect of the �1(AD) subunit onsurface wild type �1h subunit expression. We transfectedHEK293T cells with �2 and �2 subunits (0.250 �g) and hem-izygous �1h subunits with or without 2 �g of �1(AD)r subunitcDNA. We performed biotinylation assays with Western blotsand detected the �1h subunit with the anti-�1h subunit anti-body. Similar to the flow cytometry studies, we found that the�1(AD)r subunit reduced the surface expression of the wildtype �1h subunit (Fig. 4, E and F).
Because the �1(AD) subunit is grossly misfolded, it couldpotentially be a toxic protein and reduce �1�2�2 expressionby nonspecifically decreasing cellular viability. During flowcytometry analyses, we gated viable cells based on their forwardand side scatter properties that corresponded to the populationof viable cells that excluded the membrane-impermeable dye,7-aminoactinomycinD (24).We found that transfection of 2�gof�1(AD) subunit cDNAdid not alter the percentage of “viablecells” (62 � 3%) when compared with cells transfected in theabsence of the �1(AD) subunit (60 � 3%, n � 5, p � 0.710; datanot shown).To determine whether the �1(AD) subunit inhibited sur-
face expression of �1�2�2 receptors by nonspecifically pre-venting surface trafficking of proteins processed through thesecretory pathway, we measured the effect of the �1(AD)subunit on the surface expression of two membrane proteinsnot thought to interact with GABAARs. Using biotinylationassays andWestern blots, we found that transfection of 2�g of�1(AD) subunit did not alter the surface expression of theendogenous HEK293T cell Na�/K�-ATPase �1 subunit (Fig.4E; 97� 10%, n� 5, p� 0.776). Next, we determined the effectof the �1(AD)r subunit on surface expression of recombinantlyexpressed TGFHA protein. We transfected cells with �1�2�2receptors, TGFHA, and with or without 2 �g of �1(AD)r cDNA.We quantified expression of TGFHA by flow cytometry with theanti-HA-647 antibody and found that the �1(AD) subunit did
FIGURE 4. Effect of �1(AD) subunit expression on surface and total�1�2�2 expression. We transfected HEK293T cells with empty vector (neg-ative control, shaded histograms) or 0.250 �g of �2 and �2S subunits and0.125 �g �1h subunit cDNA (hemizygous) and with varying masses (0 –2 �g)of �1r or �1(AD)r cDNA. We quantified the surface (A and C) and total (B and D)�1h subunit expression using flow cytometry with anti-�1h subunit antibod-ies. A and B, we depicted hemizygous fluorescence as a solid line and hemizy-gous � 2 �g of �1(AD)r fluorescence as a dashed line. C and D, we plotted�1(AD)h (F) and �1h (E) subunit fluorescence normalized to that of hemizy-gous subunit fluorescence versus the masses of �1(AD)h or �1h cDNA that wastransfected. Increasing the masses of �1(AD)r subunit cDNA reduced surfaceand total �1h subunit expression. We also determined the effect 2 �g of�1(AD)r subunit cDNA co-transfection on surface �1h�2�2 receptor expres-sion using biotinylation assays with Western blot (E and F). We stained theWestern blots with the anti-�1h subunit antibody and quantified surface �1h
subunit relative to that of the Na�/K�-ATPase � subunit (loading control(cont)). The addition of 2 �g of �1(AD)r subunit cDNA (�AD) reduced surfaceexpression of �1h�2�2 receptors by 46 � 6% (n � 4; p � 0.005). The �1(AD)r
subunit did not alter the surface expression of the endogenous ATPase �subunit (97 � 10%, n � 5).
GABRA1 A322D Mutation Causes Dominant Negative Effects
26396 JOURNAL OF BIOLOGICAL CHEMISTRY VOLUME 285 • NUMBER 34 • AUGUST 20, 2010
by guest on February 19, 2019http://w
ww
.jbc.org/D
ownloaded from
not reduce expression of TGFHA (116 � 10%, see supple-mental Fig. 3). These data demonstrated that the dominantnegative effect conferred by �1(AD) subunit did not result sim-ply by nonspecifically inhibiting protein expression through thesecretory pathway.
�1(AD) Subunit Reduced �1 Subunit Expression in aDynamin-independent Manner—Bradley et al. (11) demon-strated that total homozygous �1(AD)�2�2 expression in-creased by co-expression of dominant negative dynamin amutant protein that inhibits clathrin-mediated endocytosis.These data suggested that in addition to causing degradation ofthe �1(AD) subunit by ER-associated degradation, the ADmutation also increased endocytosis of �1(AD)�2�2 receptorsfrom the cell surface.Here, we determined whether the �1(AD) subunit conferred
its dominant negative effect by increasing �1�2�2 receptorendocytosis through a dynamin-dependent mechanism. Weco-transfected HEK293T cells with �2 and �2 subunits andeither hemizygous �1h, homozygous �1(AD)h, or hemizygous�1h subunits that also contained 2 �g of �1(AD)r cDNA(�AD). In addition, we co-transfected cells with 0.375 �g ofcDNA expressing either wild type dynamin or a dominant neg-ative mutant dynamin (K44A) that inhibits endocytosis.Wemeasured the amount of surface and total human �1h or
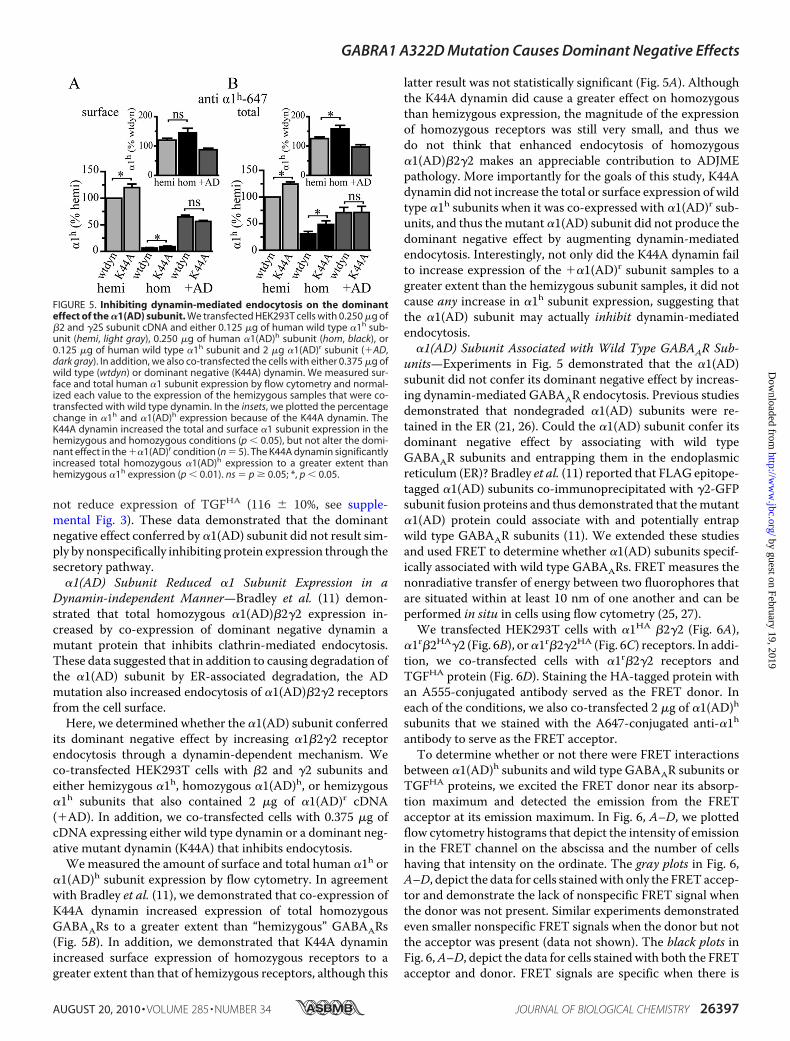
�1(AD)h subunit expression by flow cytometry. In agreementwith Bradley et al. (11), we demonstrated that co-expression ofK44A dynamin increased expression of total homozygousGABAARs to a greater extent than “hemizygous” GABAARs(Fig. 5B). In addition, we demonstrated that K44A dynaminincreased surface expression of homozygous receptors to agreater extent than that of hemizygous receptors, although this
latter result was not statistically significant (Fig. 5A). Althoughthe K44A dynamin did cause a greater effect on homozygousthan hemizygous expression, the magnitude of the expressionof homozygous receptors was still very small, and thus wedo not think that enhanced endocytosis of homozygous�1(AD)�2�2 makes an appreciable contribution to ADJMEpathology. More importantly for the goals of this study, K44Adynamin did not increase the total or surface expression of wildtype �1h subunits when it was co-expressed with �1(AD)r sub-units, and thus themutant �1(AD) subunit did not produce thedominant negative effect by augmenting dynamin-mediatedendocytosis. Interestingly, not only did the K44A dynamin failto increase expression of the ��1(AD)r subunit samples to agreater extent than the hemizygous subunit samples, it did notcause any increase in �1h subunit expression, suggesting thatthe �1(AD) subunit may actually inhibit dynamin-mediatedendocytosis.
�1(AD) Subunit Associated with Wild Type GABAAR Sub-units—Experiments in Fig. 5 demonstrated that the �1(AD)subunit did not confer its dominant negative effect by increas-ing dynamin-mediated GABAAR endocytosis. Previous studiesdemonstrated that nondegraded �1(AD) subunits were re-tained in the ER (21, 26). Could the �1(AD) subunit confer itsdominant negative effect by associating with wild typeGABAAR subunits and entrapping them in the endoplasmicreticulum (ER)? Bradley et al. (11) reported that FLAG epitope-tagged �1(AD) subunits co-immunoprecipitated with �2-GFPsubunit fusion proteins and thus demonstrated that themutant�1(AD) protein could associate with and potentially entrapwild type GABAAR subunits (11). We extended these studiesand used FRET to determine whether �1(AD) subunits specif-ically associated with wild type GABAARs. FRET measures thenonradiative transfer of energy between two fluorophores thatare situated within at least 10 nm of one another and can beperformed in situ in cells using flow cytometry (25, 27).We transfected HEK293T cells with �1HA �2�2 (Fig. 6A),
�1r�2HA�2 (Fig. 6B), or�1r�2�2HA (Fig. 6C) receptors. In addi-tion, we co-transfected cells with �1r�2�2 receptors andTGFHA protein (Fig. 6D). Staining the HA-tagged protein withan A555-conjugated antibody served as the FRET donor. Ineach of the conditions, we also co-transfected 2 �g of �1(AD)hsubunits that we stained with the A647-conjugated anti-�1hantibody to serve as the FRET acceptor.To determine whether or not there were FRET interactions
between �1(AD)h subunits and wild type GABAAR subunits orTGFHA proteins, we excited the FRET donor near its absorp-tion maximum and detected the emission from the FRETacceptor at its emission maximum. In Fig. 6, A–D, we plottedflow cytometry histograms that depict the intensity of emissionin the FRET channel on the abscissa and the number of cellshaving that intensity on the ordinate. The gray plots in Fig. 6,A–D, depict the data for cells stainedwith only the FRET accep-tor and demonstrate the lack of nonspecific FRET signal whenthe donor was not present. Similar experiments demonstratedeven smaller nonspecific FRET signals when the donor but notthe acceptor was present (data not shown). The black plots inFig. 6,A–D, depict the data for cells stainedwith both the FRETacceptor and donor. FRET signals are specific when there is
FIGURE 5. Inhibiting dynamin-mediated endocytosis on the dominanteffect of the �1(AD) subunit. We transfected HEK293T cells with 0.250 �g of�2 and �2S subunit cDNA and either 0.125 �g of human wild type �1h sub-unit (hemi, light gray), 0.250 �g of human �1(AD)h subunit (hom, black), or0.125 �g of human wild type �1h subunit and 2 �g �1(AD)r subunit (�AD,dark gray). In addition, we also co-transfected the cells with either 0.375 �g ofwild type (wtdyn) or dominant negative (K44A) dynamin. We measured sur-face and total human �1 subunit expression by flow cytometry and normal-ized each value to the expression of the hemizygous samples that were co-transfected with wild type dynamin. In the insets, we plotted the percentagechange in �1h and �1(AD)h expression because of the K44A dynamin. TheK44A dynamin increased the total and surface �1 subunit expression in thehemizygous and homozygous conditions (p � 0.05), but not alter the domi-nant effect in the ��1(AD)r condition (n � 5). The K44A dynamin significantlyincreased total homozygous �1(AD)h expression to a greater extent thanhemizygous �1h expression (p � 0.01). ns � p � 0.05; *, p � 0.05.
GABRA1 A322D Mutation Causes Dominant Negative Effects
AUGUST 20, 2010 • VOLUME 285 • NUMBER 34 JOURNAL OF BIOLOGICAL CHEMISTRY 26397
by guest on February 19, 2019http://w
ww
.jbc.org/D
ownloaded from
greater FRET signal in the doubly stained (Fig. 6, A–D, black)than in the singly stained (gray) samples. The regions of thehistograms where one finds specific FRET signals are indicatedby arrows in Fig. 6, A–D.
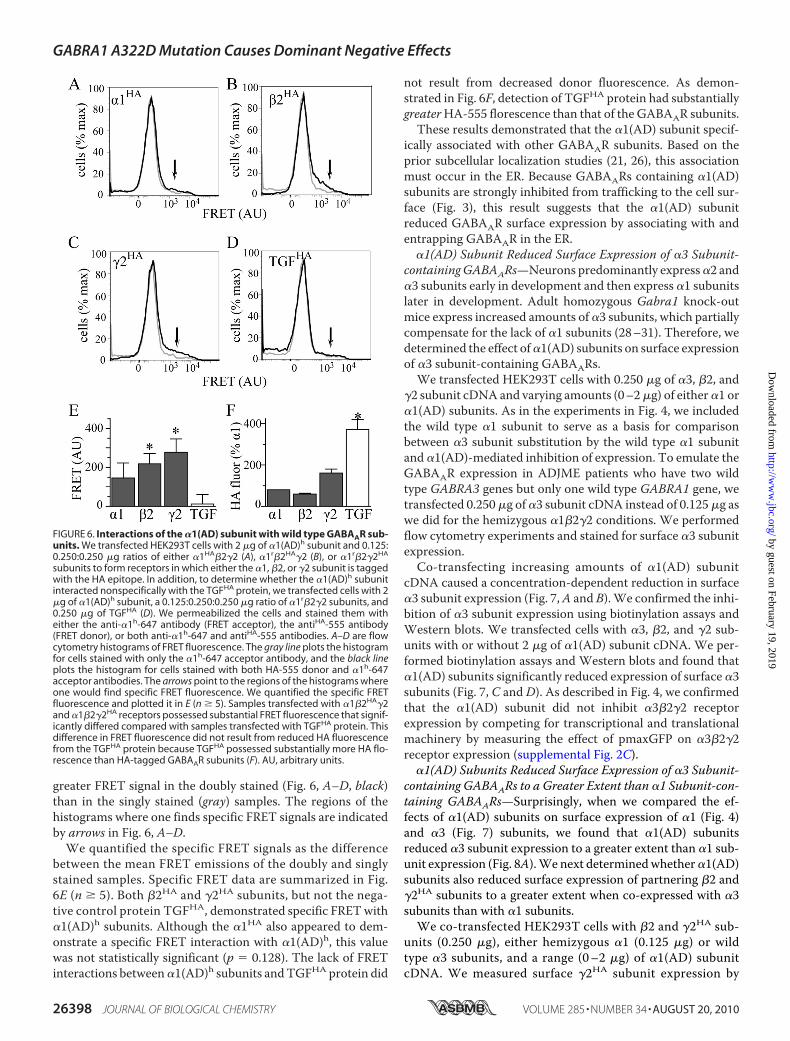
We quantified the specific FRET signals as the differencebetween the mean FRET emissions of the doubly and singlystained samples. Specific FRET data are summarized in Fig.6E (n � 5). Both �2HA and �2HA subunits, but not the nega-tive control protein TGFHA, demonstrated specific FRETwith�1(AD)h subunits. Although the �1HA also appeared to dem-onstrate a specific FRET interaction with �1(AD)h, this valuewas not statistically significant (p � 0.128). The lack of FRETinteractions between�1(AD)h subunits andTGFHA protein did
not result from decreased donor fluorescence. As demon-strated in Fig. 6F, detection of TGFHA protein had substantiallygreaterHA-555 florescence than that of the GABAAR subunits.These results demonstrated that the �1(AD) subunit specif-
ically associated with other GABAAR subunits. Based on theprior subcellular localization studies (21, 26), this associationmust occur in the ER. Because GABAARs containing �1(AD)subunits are strongly inhibited from trafficking to the cell sur-face (Fig. 3), this result suggests that the �1(AD) subunitreduced GABAAR surface expression by associating with andentrapping GABAAR in the ER.
�1(AD) Subunit Reduced Surface Expression of �3 Subunit-containingGABAARs—Neurons predominantly express�2 and�3 subunits early in development and then express �1 subunitslater in development. Adult homozygous Gabra1 knock-outmice express increased amounts of �3 subunits, which partiallycompensate for the lack of �1 subunits (28–31). Therefore, wedetermined the effect of�1(AD) subunits on surface expressionof �3 subunit-containing GABAARs.We transfected HEK293T cells with 0.250 �g of �3, �2, and
�2 subunit cDNA and varying amounts (0–2�g) of either�1 or�1(AD) subunits. As in the experiments in Fig. 4, we includedthe wild type �1 subunit to serve as a basis for comparisonbetween �3 subunit substitution by the wild type �1 subunitand �1(AD)-mediated inhibition of expression. To emulate theGABAAR expression in ADJME patients who have two wildtype GABRA3 genes but only one wild type GABRA1 gene, wetransfected 0.250�g of �3 subunit cDNA instead of 0.125�g aswe did for the hemizygous �1�2�2 conditions. We performedflow cytometry experiments and stained for surface �3 subunitexpression.Co-transfecting increasing amounts of �1(AD) subunit
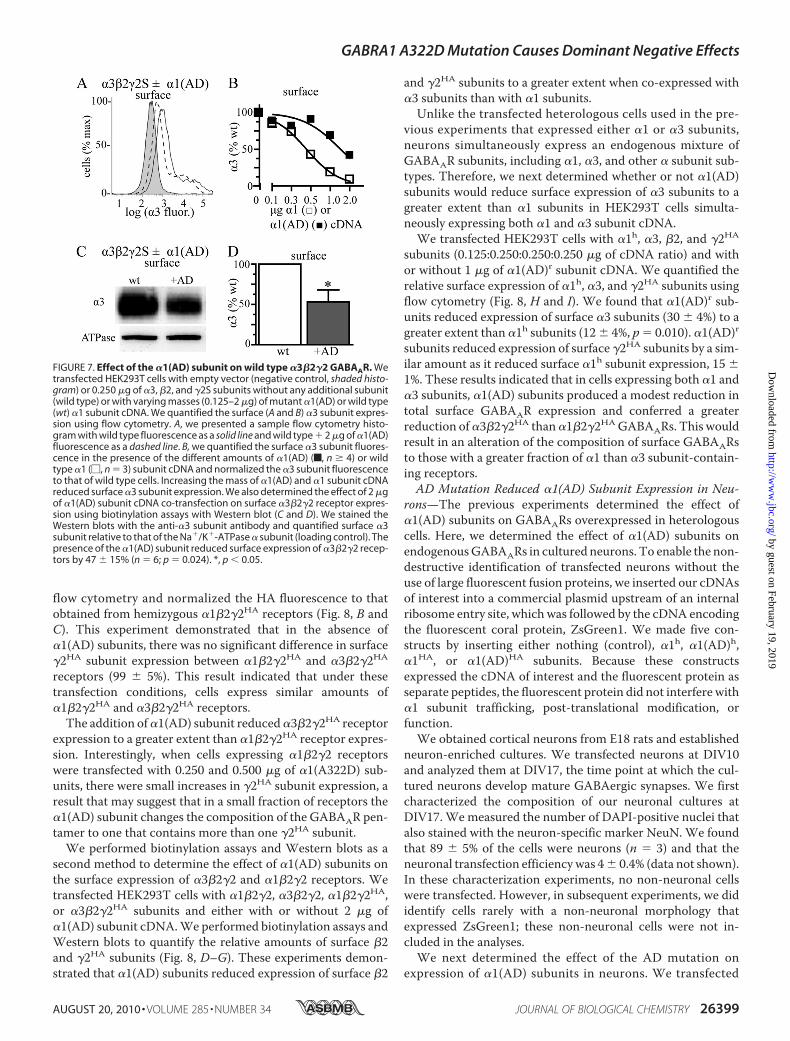
cDNA caused a concentration-dependent reduction in surface�3 subunit expression (Fig. 7,A and B).We confirmed the inhi-bition of �3 subunit expression using biotinylation assays andWestern blots. We transfected cells with �3, �2, and �2 sub-units with or without 2 �g of �1(AD) subunit cDNA. We per-formed biotinylation assays and Western blots and found that�1(AD) subunits significantly reduced expression of surface �3subunits (Fig. 7, C and D). As described in Fig. 4, we confirmedthat the �1(AD) subunit did not inhibit �3�2�2 receptorexpression by competing for transcriptional and translationalmachinery by measuring the effect of pmaxGFP on �3�2�2receptor expression (supplemental Fig. 2C).
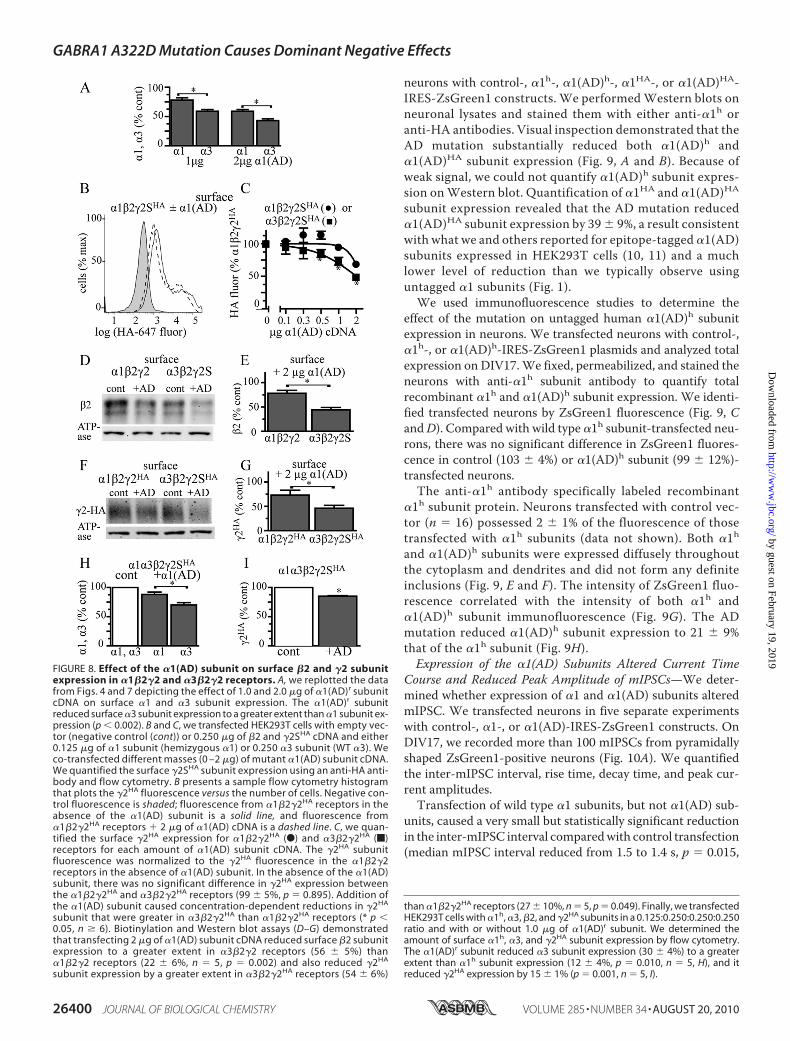
�1(AD) Subunits Reduced Surface Expression of �3 Subunit-containing GABAARs to a Greater Extent than �1 Subunit-con-taining GABAARs—Surprisingly, when we compared the ef-fects of �1(AD) subunits on surface expression of �1 (Fig. 4)and �3 (Fig. 7) subunits, we found that �1(AD) subunitsreduced �3 subunit expression to a greater extent than �1 sub-unit expression (Fig. 8A).We next determinedwhether�1(AD)subunits also reduced surface expression of partnering �2 and�2HA subunits to a greater extent when co-expressed with �3subunits than with �1 subunits.
We co-transfected HEK293T cells with �2 and �2HA sub-units (0.250 �g), either hemizygous �1 (0.125 �g) or wildtype �3 subunits, and a range (0–2 �g) of �1(AD) subunitcDNA. We measured surface �2HA subunit expression by
FIGURE 6. Interactions of the �1(AD) subunit with wild type GABAAR sub-units. We transfected HEK293T cells with 2 �g of �1(AD)h subunit and 0.125:0.250:0.250 �g ratios of either �1HA�2�2 (A), �1r�2HA�2 (B), or �1r�2�2HA
subunits to form receptors in which either the �1, �2, or �2 subunit is taggedwith the HA epitope. In addition, to determine whether the �1(AD)h subunitinteracted nonspecifically with the TGFHA protein, we transfected cells with 2�g of �1(AD)h subunit, a 0.125:0.250:0.250 �g ratio of �1r�2�2 subunits, and0.250 �g of TGFHA (D). We permeabilized the cells and stained them witheither the anti-�1h-647 antibody (FRET acceptor), the antiHA-555 antibody(FRET donor), or both anti-�1h-647 and antiHA-555 antibodies. A–D are flowcytometry histograms of FRET fluorescence. The gray line plots the histogramfor cells stained with only the �1h-647 acceptor antibody, and the black lineplots the histogram for cells stained with both HA-555 donor and �1h-647acceptor antibodies. The arrows point to the regions of the histograms whereone would find specific FRET fluorescence. We quantified the specific FRETfluorescence and plotted it in E (n � 5). Samples transfected with �1�2HA�2and �1�2�2HA receptors possessed substantial FRET fluorescence that signif-icantly differed compared with samples transfected with TGFHA protein. Thisdifference in FRET fluorescence did not result from reduced HA fluorescencefrom the TGFHA protein because TGFHA possessed substantially more HA flo-rescence than HA-tagged GABAAR subunits (F). AU, arbitrary units.
GABRA1 A322D Mutation Causes Dominant Negative Effects
26398 JOURNAL OF BIOLOGICAL CHEMISTRY VOLUME 285 • NUMBER 34 • AUGUST 20, 2010
by guest on February 19, 2019http://w
ww
.jbc.org/D
ownloaded from
flow cytometry and normalized the HA fluorescence to thatobtained from hemizygous �1�2�2HA receptors (Fig. 8, B andC). This experiment demonstrated that in the absence of�1(AD) subunits, there was no significant difference in surface�2HA subunit expression between �1�2�2HA and �3�2�2HA
receptors (99 � 5%). This result indicated that under thesetransfection conditions, cells express similar amounts of�1�2�2HA and �3�2�2HA receptors.
The addition of�1(AD) subunit reduced�3�2�2HA receptorexpression to a greater extent than �1�2�2HA receptor expres-sion. Interestingly, when cells expressing �1�2�2 receptorswere transfected with 0.250 and 0.500 �g of �1(A322D) sub-units, there were small increases in �2HA subunit expression, aresult that may suggest that in a small fraction of receptors the�1(AD) subunit changes the composition of the GABAAR pen-tamer to one that contains more than one �2HA subunit.We performed biotinylation assays and Western blots as a
second method to determine the effect of �1(AD) subunits onthe surface expression of �3�2�2 and �1�2�2 receptors. Wetransfected HEK293T cells with �1�2�2, �3�2�2, �1�2�2HA,or �3�2�2HA subunits and either with or without 2 �g of�1(AD) subunit cDNA.We performed biotinylation assays andWestern blots to quantify the relative amounts of surface �2and �2HA subunits (Fig. 8, D–G). These experiments demon-strated that �1(AD) subunits reduced expression of surface �2
and �2HA subunits to a greater extent when co-expressed with�3 subunits than with �1 subunits.
Unlike the transfected heterologous cells used in the pre-vious experiments that expressed either �1 or �3 subunits,neurons simultaneously express an endogenous mixture ofGABAAR subunits, including �1, �3, and other � subunit sub-types. Therefore, we next determined whether or not �1(AD)subunits would reduce surface expression of �3 subunits to agreater extent than �1 subunits in HEK293T cells simulta-neously expressing both �1 and �3 subunit cDNA.
We transfected HEK293T cells with �1h, �3, �2, and �2HA
subunits (0.125:0.250:0.250:0.250 �g of cDNA ratio) and withor without 1 �g of �1(AD)r subunit cDNA. We quantified therelative surface expression of �1h, �3, and �2HA subunits usingflow cytometry (Fig. 8, H and I). We found that �1(AD)r sub-units reduced expression of surface �3 subunits (30 � 4%) to agreater extent than �1h subunits (12� 4%, p� 0.010). �1(AD)rsubunits reduced expression of surface �2HA subunits by a sim-ilar amount as it reduced surface �1h subunit expression, 15 �1%. These results indicated that in cells expressing both �1 and�3 subunits, �1(AD) subunits produced a modest reduction intotal surface GABAAR expression and conferred a greaterreduction of�3�2�2HA than�1�2�2HAGABAARs. This wouldresult in an alteration of the composition of surface GABAARsto those with a greater fraction of �1 than �3 subunit-contain-ing receptors.AD Mutation Reduced �1(AD) Subunit Expression in Neu-
rons—The previous experiments determined the effect of�1(AD) subunits on GABAARs overexpressed in heterologouscells. Here, we determined the effect of �1(AD) subunits onendogenousGABAARs in cultured neurons. To enable the non-destructive identification of transfected neurons without theuse of large fluorescent fusion proteins, we inserted our cDNAsof interest into a commercial plasmid upstream of an internalribosome entry site, which was followed by the cDNA encodingthe fluorescent coral protein, ZsGreen1. We made five con-structs by inserting either nothing (control), �1h, �1(AD)h,�1HA, or �1(AD)HA subunits. Because these constructsexpressed the cDNA of interest and the fluorescent protein asseparate peptides, the fluorescent protein did not interfere with�1 subunit trafficking, post-translational modification, orfunction.We obtained cortical neurons from E18 rats and established
neuron-enriched cultures. We transfected neurons at DIV10and analyzed them at DIV17, the time point at which the cul-tured neurons develop mature GABAergic synapses. We firstcharacterized the composition of our neuronal cultures atDIV17. We measured the number of DAPI-positive nuclei thatalso stained with the neuron-specific marker NeuN. We foundthat 89 � 5% of the cells were neurons (n � 3) and that theneuronal transfection efficiencywas 4� 0.4% (data not shown).In these characterization experiments, no non-neuronal cellswere transfected. However, in subsequent experiments, we dididentify cells rarely with a non-neuronal morphology thatexpressed ZsGreen1; these non-neuronal cells were not in-cluded in the analyses.We next determined the effect of the AD mutation on
expression of �1(AD) subunits in neurons. We transfected
FIGURE 7. Effect of the �1(AD) subunit on wild type �3�2�2 GABAAR. Wetransfected HEK293T cells with empty vector (negative control, shaded histo-gram) or 0.250 �g of �3, �2, and �2S subunits without any additional subunit(wild type) or with varying masses (0.125–2 �g) of mutant �1(AD) or wild type(wt) �1 subunit cDNA. We quantified the surface (A and B) �3 subunit expres-sion using flow cytometry. A, we presented a sample flow cytometry histo-gram with wild type fluorescence as a solid line and wild type � 2 �g of �1(AD)fluorescence as a dashed line. B, we quantified the surface �3 subunit fluores-cence in the presence of the different amounts of �1(AD) (f, n � 4) or wildtype �1 (�, n � 3) subunit cDNA and normalized the �3 subunit fluorescenceto that of wild type cells. Increasing the mass of �1(AD) and �1 subunit cDNAreduced surface �3 subunit expression. We also determined the effect of 2 �gof �1(AD) subunit cDNA co-transfection on surface �3�2�2 receptor expres-sion using biotinylation assays with Western blot (C and D). We stained theWestern blots with the anti-�3 subunit antibody and quantified surface �3subunit relative to that of the Na�/K�-ATPase � subunit (loading control). Thepresence of the �1(AD) subunit reduced surface expression of �3�2�2 recep-tors by 47 � 15% (n � 6; p � 0.024). *, p � 0.05.
GABRA1 A322D Mutation Causes Dominant Negative Effects
AUGUST 20, 2010 • VOLUME 285 • NUMBER 34 JOURNAL OF BIOLOGICAL CHEMISTRY 26399
by guest on February 19, 2019http://w
ww
.jbc.org/D
ownloaded from
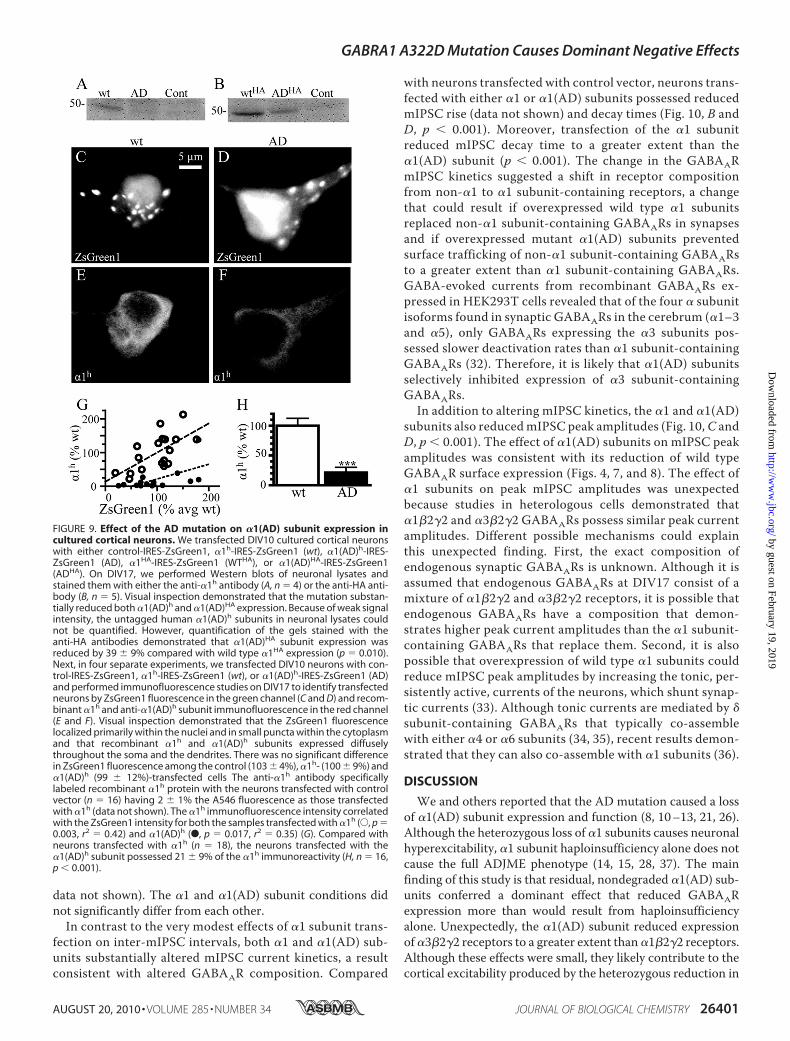
neurons with control-, �1h-, �1(AD)h-, �1HA-, or �1(AD)HA-IRES-ZsGreen1 constructs. We performedWestern blots onneuronal lysates and stained them with either anti-�1h oranti-HA antibodies. Visual inspection demonstrated that theAD mutation substantially reduced both �1(AD)h and�1(AD)HA subunit expression (Fig. 9, A and B). Because ofweak signal, we could not quantify �1(AD)h subunit expres-sion onWestern blot. Quantification of �1HA and �1(AD)HA
subunit expression revealed that the AD mutation reduced�1(AD)HA subunit expression by 39 � 9%, a result consistentwith what we and others reported for epitope-tagged �1(AD)subunits expressed in HEK293T cells (10, 11) and a muchlower level of reduction than we typically observe usinguntagged �1 subunits (Fig. 1).We used immunofluorescence studies to determine the
effect of the mutation on untagged human �1(AD)h subunitexpression in neurons. We transfected neurons with control-,�1h-, or �1(AD)h-IRES-ZsGreen1 plasmids and analyzed totalexpression on DIV17.We fixed, permeabilized, and stained theneurons with anti-�1h subunit antibody to quantify totalrecombinant �1h and �1(AD)h subunit expression. We identi-fied transfected neurons by ZsGreen1 fluorescence (Fig. 9, CandD). Compared with wild type �1h subunit-transfected neu-rons, there was no significant difference in ZsGreen1 fluores-cence in control (103 � 4%) or �1(AD)h subunit (99 � 12%)-transfected neurons.The anti-�1h antibody specifically labeled recombinant
�1h subunit protein. Neurons transfected with control vec-tor (n � 16) possessed 2 � 1% of the fluorescence of thosetransfected with �1h subunits (data not shown). Both �1hand �1(AD)h subunits were expressed diffusely throughoutthe cytoplasm and dendrites and did not form any definiteinclusions (Fig. 9, E and F). The intensity of ZsGreen1 fluo-rescence correlated with the intensity of both �1h and�1(AD)h subunit immunofluorescence (Fig. 9G). The ADmutation reduced �1(AD)h subunit expression to 21 � 9%that of the �1h subunit (Fig. 9H).Expression of the �1(AD) Subunits Altered Current Time
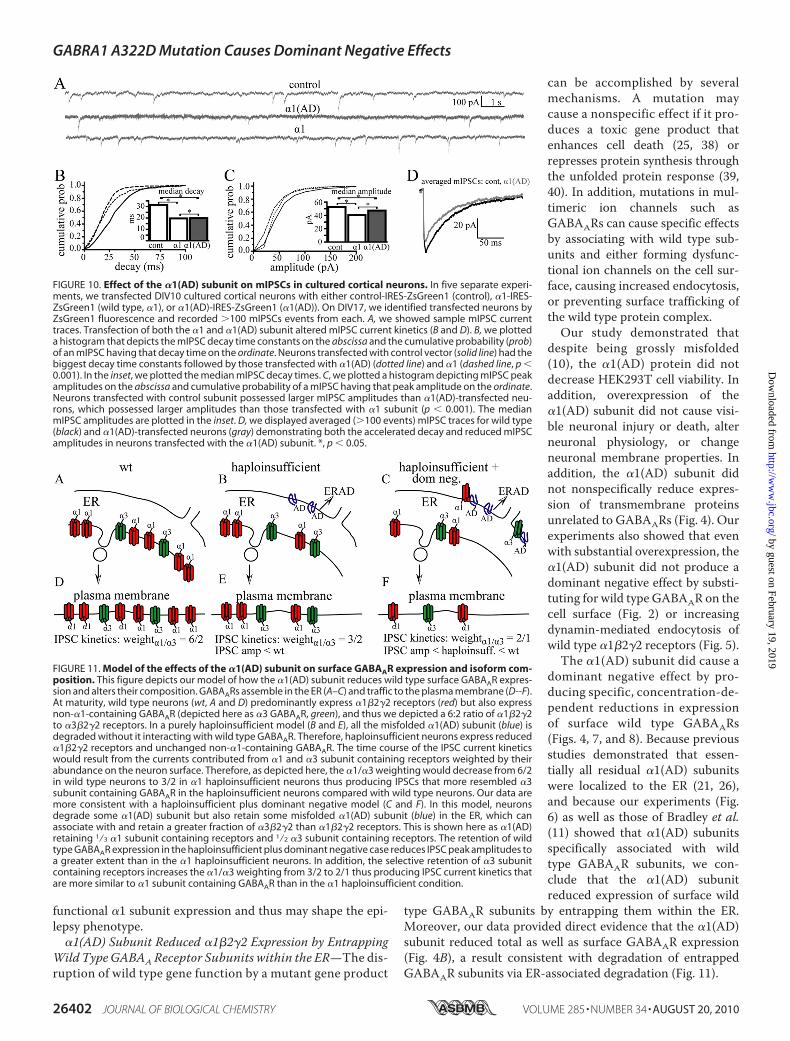
Course and Reduced Peak Amplitude of mIPSCs—We deter-mined whether expression of �1 and �1(AD) subunits alteredmIPSC. We transfected neurons in five separate experimentswith control-, �1-, or �1(AD)-IRES-ZsGreen1 constructs. OnDIV17, we recorded more than 100 mIPSCs from pyramidallyshaped ZsGreen1-positive neurons (Fig. 10A). We quantifiedthe inter-mIPSC interval, rise time, decay time, and peak cur-rent amplitudes.Transfection of wild type �1 subunits, but not �1(AD) sub-
units, caused a very small but statistically significant reductionin the inter-mIPSC interval comparedwith control transfection(median mIPSC interval reduced from 1.5 to 1.4 s, p � 0.015,
FIGURE 8. Effect of the �1(AD) subunit on surface �2 and �2 subunitexpression in �1�2�2 and �3�2�2 receptors. A, we replotted the datafrom Figs. 4 and 7 depicting the effect of 1.0 and 2.0 �g of �1(AD)r subunitcDNA on surface �1 and �3 subunit expression. The �1(AD)r subunitreduced surface �3 subunit expression to a greater extent than �1 subunit ex-pression (p � 0.002). B and C, we transfected HEK293T cells with empty vec-tor (negative control (cont)) or 0.250 �g of �2 and �2SHA cDNA and either0.125 �g of �1 subunit (hemizygous �1) or 0.250 �3 subunit (WT �3). Weco-transfected different masses (0 –2 �g) of mutant �1(AD) subunit cDNA.We quantified the surface �2SHA subunit expression using an anti-HA anti-body and flow cytometry. B presents a sample flow cytometry histogramthat plots the �2HA fluorescence versus the number of cells. Negative con-trol fluorescence is shaded; fluorescence from �1�2�2HA receptors in theabsence of the �1(AD) subunit is a solid line, and fluorescence from�1�2�2HA receptors � 2 �g of �1(AD) cDNA is a dashed line. C, we quan-tified the surface �2HA expression for �1�2�2HA (F) and �3�2�2HA (f)receptors for each amount of �1(AD) subunit cDNA. The �2HA subunitfluorescence was normalized to the �2HA fluorescence in the �1�2�2receptors in the absence of �1(AD) subunit. In the absence of the �1(AD)subunit, there was no significant difference in �2HA expression betweenthe �1�2�2HA and �3�2�2HA receptors (99 � 5%, p � 0.895). Addition ofthe �1(AD) subunit caused concentration-dependent reductions in �2HA
subunit that were greater in �3�2�2HA than �1�2�2HA receptors (* p �0.05, n � 6). Biotinylation and Western blot assays (D–G) demonstratedthat transfecting 2 �g of �1(AD) subunit cDNA reduced surface �2 subunitexpression to a greater extent in �3�2�2 receptors (56 � 5%) than�1�2�2 receptors (22 � 6%, n � 5, p � 0.002) and also reduced �2HA
subunit expression by a greater extent in �3�2�2HA receptors (54 � 6%)
than �1�2�2HA receptors (27 � 10%, n � 5, p � 0.049). Finally, we transfectedHEK293T cells with �1h, �3, �2, and �2HA subunits in a 0.125:0.250:0.250:0.250ratio and with or without 1.0 �g of �1(AD)r subunit. We determined theamount of surface �1h, �3, and �2HA subunit expression by flow cytometry.The �1(AD)r subunit reduced �3 subunit expression (30 � 4%) to a greaterextent than �1h subunit expression (12 � 4%, p � 0.010, n � 5, H), and itreduced �2HA expression by 15 � 1% (p � 0.001, n � 5, I).
GABRA1 A322D Mutation Causes Dominant Negative Effects
26400 JOURNAL OF BIOLOGICAL CHEMISTRY VOLUME 285 • NUMBER 34 • AUGUST 20, 2010
by guest on February 19, 2019http://w
ww
.jbc.org/D
ownloaded from
data not shown). The �1 and �1(AD) subunit conditions didnot significantly differ from each other.In contrast to the very modest effects of �1 subunit trans-
fection on inter-mIPSC intervals, both �1 and �1(AD) sub-units substantially altered mIPSC current kinetics, a resultconsistent with altered GABAAR composition. Compared
with neurons transfected with control vector, neurons trans-fected with either �1 or �1(AD) subunits possessed reducedmIPSC rise (data not shown) and decay times (Fig. 10, B andD, p � 0.001). Moreover, transfection of the �1 subunitreduced mIPSC decay time to a greater extent than the�1(AD) subunit (p � 0.001). The change in the GABAARmIPSC kinetics suggested a shift in receptor compositionfrom non-�1 to �1 subunit-containing receptors, a changethat could result if overexpressed wild type �1 subunitsreplaced non-�1 subunit-containing GABAARs in synapsesand if overexpressed mutant �1(AD) subunits preventedsurface trafficking of non-�1 subunit-containing GABAARsto a greater extent than �1 subunit-containing GABAARs.GABA-evoked currents from recombinant GABAARs ex-pressed in HEK293T cells revealed that of the four � subunitisoforms found in synaptic GABAARs in the cerebrum (�1–3and �5), only GABAARs expressing the �3 subunits pos-sessed slower deactivation rates than �1 subunit-containingGABAARs (32). Therefore, it is likely that �1(AD) subunitsselectively inhibited expression of �3 subunit-containingGABAARs.In addition to altering mIPSC kinetics, the �1 and �1(AD)
subunits also reducedmIPSC peak amplitudes (Fig. 10,C andD, p � 0.001). The effect of �1(AD) subunits on mIPSC peakamplitudes was consistent with its reduction of wild typeGABAAR surface expression (Figs. 4, 7, and 8). The effect of�1 subunits on peak mIPSC amplitudes was unexpectedbecause studies in heterologous cells demonstrated that�1�2�2 and �3�2�2 GABAARs possess similar peak currentamplitudes. Different possible mechanisms could explainthis unexpected finding. First, the exact composition ofendogenous synaptic GABAARs is unknown. Although it isassumed that endogenous GABAARs at DIV17 consist of amixture of �1�2�2 and �3�2�2 receptors, it is possible thatendogenous GABAARs have a composition that demon-strates higher peak current amplitudes than the �1 subunit-containing GABAARs that replace them. Second, it is alsopossible that overexpression of wild type �1 subunits couldreduce mIPSC peak amplitudes by increasing the tonic, per-sistently active, currents of the neurons, which shunt synap-tic currents (33). Although tonic currents are mediated by �subunit-containing GABAARs that typically co-assemblewith either �4 or �6 subunits (34, 35), recent results demon-strated that they can also co-assemble with �1 subunits (36).
DISCUSSION
We and others reported that the AD mutation caused a lossof �1(AD) subunit expression and function (8, 10–13, 21, 26).Although the heterozygous loss of �1 subunits causes neuronalhyperexcitability, �1 subunit haploinsufficiency alone does notcause the full ADJME phenotype (14, 15, 28, 37). The mainfinding of this study is that residual, nondegraded �1(AD) sub-units conferred a dominant effect that reduced GABAARexpression more than would result from haploinsufficiencyalone. Unexpectedly, the �1(AD) subunit reduced expressionof�3�2�2 receptors to a greater extent than�1�2�2 receptors.Although these effects were small, they likely contribute to thecortical excitability produced by the heterozygous reduction in
FIGURE 9. Effect of the AD mutation on �1(AD) subunit expression incultured cortical neurons. We transfected DIV10 cultured cortical neuronswith either control-IRES-ZsGreen1, �1h-IRES-ZsGreen1 (wt), �1(AD)h-IRES-ZsGreen1 (AD), �1HA-IRES-ZsGreen1 (WTHA), or �1(AD)HA-IRES-ZsGreen1(ADHA). On DIV17, we performed Western blots of neuronal lysates andstained them with either the anti-�1h antibody (A, n � 4) or the anti-HA anti-body (B, n � 5). Visual inspection demonstrated that the mutation substan-tially reduced both �1(AD)h and �1(AD)HA expression. Because of weak signalintensity, the untagged human �1(AD)h subunits in neuronal lysates couldnot be quantified. However, quantification of the gels stained with theanti-HA antibodies demonstrated that �1(AD)HA subunit expression wasreduced by 39 � 9% compared with wild type �1HA expression (p � 0.010).Next, in four separate experiments, we transfected DIV10 neurons with con-trol-IRES-ZsGreen1, �1h-IRES-ZsGreen1 (wt), or �1(AD)h-IRES-ZsGreen1 (AD)and performed immunofluorescence studies on DIV17 to identify transfectedneurons by ZsGreen1 fluorescence in the green channel (C and D) and recom-binant �1h and anti-�1(AD)h subunit immunofluorescence in the red channel(E and F). Visual inspection demonstrated that the ZsGreen1 fluorescencelocalized primarily within the nuclei and in small puncta within the cytoplasmand that recombinant �1h and �1(AD)h subunits expressed diffuselythroughout the soma and the dendrites. There was no significant differencein ZsGreen1 fluorescence among the control (103 � 4%), �1h- (100 � 9%) and�1(AD)h (99 � 12%)-transfected cells The anti-�1h antibody specificallylabeled recombinant �1h protein with the neurons transfected with controlvector (n � 16) having 2 � 1% the A546 fluorescence as those transfectedwith �1h (data not shown). The �1h immunofluorescence intensity correlatedwith the ZsGreen1 intensity for both the samples transfected with �1h (E, p �0.003, r2 � 0.42) and �1(AD)h (F, p � 0.017, r2 � 0.35) (G). Compared withneurons transfected with �1h (n � 18), the neurons transfected with the�1(AD)h subunit possessed 21 � 9% of the �1h immunoreactivity (H, n � 16,p � 0.001).
GABRA1 A322D Mutation Causes Dominant Negative Effects
AUGUST 20, 2010 • VOLUME 285 • NUMBER 34 JOURNAL OF BIOLOGICAL CHEMISTRY 26401
by guest on February 19, 2019http://w
ww
.jbc.org/D
ownloaded from
functional �1 subunit expression and thus may shape the epi-lepsy phenotype.
�1(AD) Subunit Reduced �1�2�2 Expression by EntrappingWild TypeGABAAReceptor Subunits within the ER—The dis-ruption of wild type gene function by a mutant gene product
can be accomplished by severalmechanisms. A mutation maycause a nonspecific effect if it pro-duces a toxic gene product thatenhances cell death (25, 38) orrepresses protein synthesis throughthe unfolded protein response (39,40). In addition, mutations in mul-timeric ion channels such asGABAARs can cause specific effectsby associating with wild type sub-units and either forming dysfunc-tional ion channels on the cell sur-face, causing increased endocytosis,or preventing surface trafficking ofthe wild type protein complex.Our study demonstrated that
despite being grossly misfolded(10), the �1(AD) protein did notdecrease HEK293T cell viability. Inaddition, overexpression of the�1(AD) subunit did not cause visi-ble neuronal injury or death, alterneuronal physiology, or changeneuronal membrane properties. Inaddition, the �1(AD) subunit didnot nonspecifically reduce expres-sion of transmembrane proteinsunrelated to GABAARs (Fig. 4). Ourexperiments also showed that evenwith substantial overexpression, the�1(AD) subunit did not produce adominant negative effect by substi-tuting for wild type GABAAR on thecell surface (Fig. 2) or increasingdynamin-mediated endocytosis ofwild type �1�2�2 receptors (Fig. 5).
The �1(AD) subunit did cause adominant negative effect by pro-ducing specific, concentration-de-pendent reductions in expressionof surface wild type GABAARs(Figs. 4, 7, and 8). Because previousstudies demonstrated that essen-tially all residual �1(AD) subunitswere localized to the ER (21, 26),and because our experiments (Fig.6) as well as those of Bradley et al.(11) showed that �1(AD) subunitsspecifically associated with wildtype GABAAR subunits, we con-clude that the �1(AD) subunitreduced expression of surface wild
type GABAAR subunits by entrapping them within the ER.Moreover, our data provided direct evidence that the �1(AD)subunit reduced total as well as surface GABAAR expression(Fig. 4B), a result consistent with degradation of entrappedGABAAR subunits via ER-associated degradation (Fig. 11).
FIGURE 10. Effect of the �1(AD) subunit on mIPSCs in cultured cortical neurons. In five separate experi-ments, we transfected DIV10 cultured cortical neurons with either control-IRES-ZsGreen1 (control), �1-IRES-ZsGreen1 (wild type, �1), or �1(AD)-IRES-ZsGreen1 (�1(AD)). On DIV17, we identified transfected neurons byZsGreen1 fluorescence and recorded 100 mIPSCs events from each. A, we showed sample mIPSC currenttraces. Transfection of both the �1 and �1(AD) subunit altered mIPSC current kinetics (B and D). B, we plotteda histogram that depicts the mIPSC decay time constants on the abscissa and the cumulative probability (prob)of an mIPSC having that decay time on the ordinate. Neurons transfected with control vector (solid line) had thebiggest decay time constants followed by those transfected with �1(AD) (dotted line) and �1 (dashed line, p �0.001). In the inset, we plotted the median mIPSC decay times. C, we plotted a histogram depicting mIPSC peakamplitudes on the abscissa and cumulative probability of a mIPSC having that peak amplitude on the ordinate.Neurons transfected with control subunit possessed larger mIPSC amplitudes than �1(AD)-transfected neu-rons, which possessed larger amplitudes than those transfected with �1 subunit (p � 0.001). The medianmIPSC amplitudes are plotted in the inset. D, we displayed averaged (100 events) mIPSC traces for wild type(black) and �1(AD)-transfected neurons (gray) demonstrating both the accelerated decay and reduced mIPSCamplitudes in neurons transfected with the �1(AD) subunit. *, p � 0.05.
FIGURE 11. Model of the effects of the �1(AD) subunit on surface GABAAR expression and isoform com-position. This figure depicts our model of how the �1(AD) subunit reduces wild type surface GABAAR expres-sion and alters their composition. GABAARs assemble in the ER (A–C) and traffic to the plasma membrane (D--F).At maturity, wild type neurons (wt, A and D) predominantly express �1�2�2 receptors (red) but also expressnon-�1-containing GABAAR (depicted here as �3 GABAAR, green), and thus we depicted a 6:2 ratio of �1�2�2to �3�2�2 receptors. In a purely haploinsufficient model (B and E), all the misfolded �1(AD) subunit (blue) isdegraded without it interacting with wild type GABAAR. Therefore, haploinsufficient neurons express reduced�1�2�2 receptors and unchanged non-�1-containing GABAAR. The time course of the IPSC current kineticswould result from the currents contributed from �1 and �3 subunit containing receptors weighted by theirabundance on the neuron surface. Therefore, as depicted here, the �1/�3 weighting would decrease from 6/2in wild type neurons to 3/2 in �1 haploinsufficient neurons thus producing IPSCs that more resembled �3subunit containing GABAAR in the haploinsufficient neurons compared with wild type neurons. Our data aremore consistent with a haploinsufficient plus dominant negative model (C and F). In this model, neuronsdegrade some �1(AD) subunit but also retain some misfolded �1(AD) subunit (blue) in the ER, which canassociate with and retain a greater fraction of �3�2�2 than �1�2�2 receptors. This is shown here as �1(AD)retaining 1⁄3 �1 subunit containing receptors and 1⁄2 �3 subunit containing receptors. The retention of wildtype GABAAR expression in the haploinsufficient plus dominant negative case reduces IPSC peak amplitudes toa greater extent than in the �1 haploinsufficient neurons. In addition, the selective retention of �3 subunitcontaining receptors increases the �1/�3 weighting from 3/2 to 2/1 thus producing IPSC current kinetics thatare more similar to �1 subunit containing GABAAR than in the �1 haploinsufficient condition.
GABRA1 A322D Mutation Causes Dominant Negative Effects
26402 JOURNAL OF BIOLOGICAL CHEMISTRY VOLUME 285 • NUMBER 34 • AUGUST 20, 2010
by guest on February 19, 2019http://w
ww
.jbc.org/D
ownloaded from
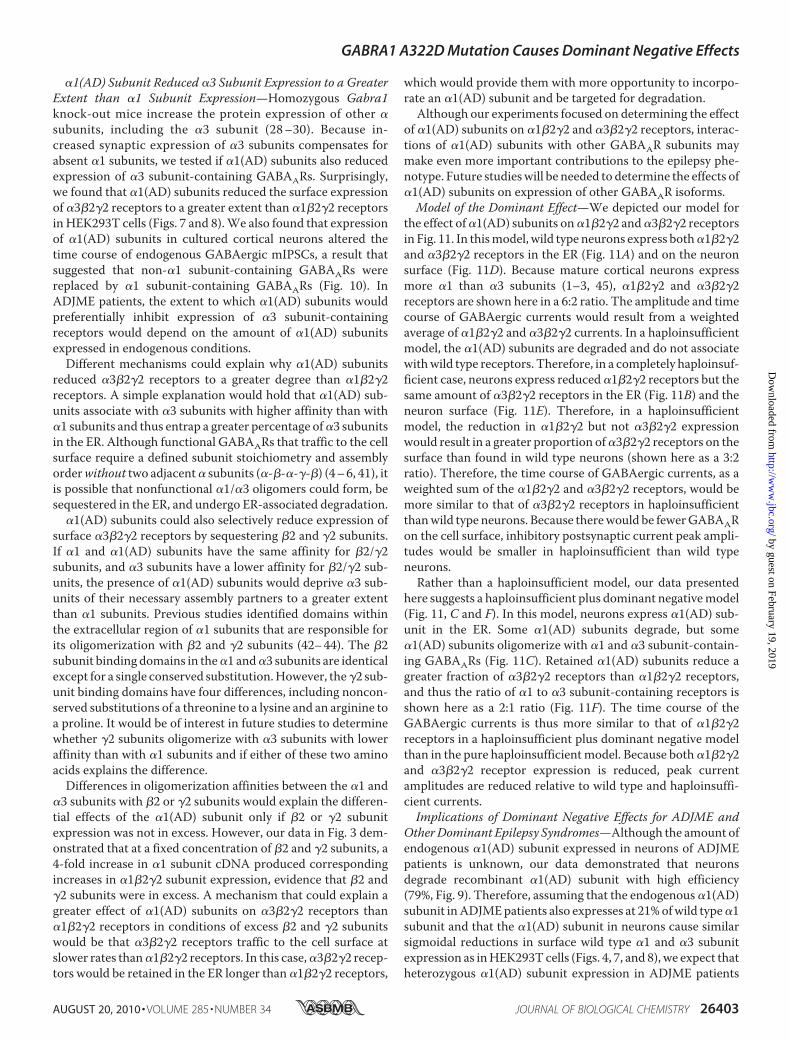
�1(AD) Subunit Reduced �3 Subunit Expression to a GreaterExtent than �1 Subunit Expression—Homozygous Gabra1knock-out mice increase the protein expression of other �subunits, including the �3 subunit (28–30). Because in-creased synaptic expression of �3 subunits compensates forabsent �1 subunits, we tested if �1(AD) subunits also reducedexpression of �3 subunit-containing GABAARs. Surprisingly,we found that �1(AD) subunits reduced the surface expressionof �3�2�2 receptors to a greater extent than �1�2�2 receptorsinHEK293T cells (Figs. 7 and 8).We also found that expressionof �1(AD) subunits in cultured cortical neurons altered thetime course of endogenous GABAergic mIPSCs, a result thatsuggested that non-�1 subunit-containing GABAARs werereplaced by �1 subunit-containing GABAARs (Fig. 10). InADJME patients, the extent to which �1(AD) subunits wouldpreferentially inhibit expression of �3 subunit-containingreceptors would depend on the amount of �1(AD) subunitsexpressed in endogenous conditions.Different mechanisms could explain why �1(AD) subunits
reduced �3�2�2 receptors to a greater degree than �1�2�2receptors. A simple explanation would hold that �1(AD) sub-units associate with �3 subunits with higher affinity than with�1 subunits and thus entrap a greater percentage of�3 subunitsin the ER. Although functional GABAARs that traffic to the cellsurface require a defined subunit stoichiometry and assemblyorderwithout two adjacent� subunits (�-�-�-�-�) (4–6, 41), itis possible that nonfunctional �1/�3 oligomers could form, besequestered in the ER, and undergo ER-associated degradation.
�1(AD) subunits could also selectively reduce expression ofsurface �3�2�2 receptors by sequestering �2 and �2 subunits.If �1 and �1(AD) subunits have the same affinity for �2/�2subunits, and �3 subunits have a lower affinity for �2/�2 sub-units, the presence of �1(AD) subunits would deprive �3 sub-units of their necessary assembly partners to a greater extentthan �1 subunits. Previous studies identified domains withinthe extracellular region of �1 subunits that are responsible forits oligomerization with �2 and �2 subunits (42–44). The �2subunit binding domains in the�1 and�3 subunits are identicalexcept for a single conserved substitution.However, the�2 sub-unit binding domains have four differences, including noncon-served substitutions of a threonine to a lysine and an arginine toa proline. It would be of interest in future studies to determinewhether �2 subunits oligomerize with �3 subunits with loweraffinity than with �1 subunits and if either of these two aminoacids explains the difference.Differences in oligomerization affinities between the �1 and
�3 subunits with �2 or �2 subunits would explain the differen-tial effects of the �1(AD) subunit only if �2 or �2 subunitexpression was not in excess. However, our data in Fig. 3 dem-onstrated that at a fixed concentration of �2 and �2 subunits, a4-fold increase in �1 subunit cDNA produced correspondingincreases in �1�2�2 subunit expression, evidence that �2 and�2 subunits were in excess. A mechanism that could explain agreater effect of �1(AD) subunits on �3�2�2 receptors than�1�2�2 receptors in conditions of excess �2 and �2 subunitswould be that �3�2�2 receptors traffic to the cell surface atslower rates than�1�2�2 receptors. In this case,�3�2�2 recep-tors would be retained in the ER longer than �1�2�2 receptors,
which would provide them with more opportunity to incorpo-rate an �1(AD) subunit and be targeted for degradation.
Although our experiments focused on determining the effectof �1(AD) subunits on �1�2�2 and �3�2�2 receptors, interac-tions of �1(AD) subunits with other GABAAR subunits maymake even more important contributions to the epilepsy phe-notype. Future studieswill be needed to determine the effects of�1(AD) subunits on expression of other GABAAR isoforms.Model of the Dominant Effect—We depicted our model for
the effect of�1(AD) subunits on�1�2�2 and�3�2�2 receptorsin Fig. 11. In thismodel, wild type neurons express both�1�2�2and �3�2�2 receptors in the ER (Fig. 11A) and on the neuronsurface (Fig. 11D). Because mature cortical neurons expressmore �1 than �3 subunits (1–3, 45), �1�2�2 and �3�2�2receptors are shown here in a 6:2 ratio. The amplitude and timecourse of GABAergic currents would result from a weightedaverage of �1�2�2 and �3�2�2 currents. In a haploinsufficientmodel, the �1(AD) subunits are degraded and do not associatewithwild type receptors. Therefore, in a completely haploinsuf-ficient case, neurons express reduced�1�2�2 receptors but thesame amount of �3�2�2 receptors in the ER (Fig. 11B) and theneuron surface (Fig. 11E). Therefore, in a haploinsufficientmodel, the reduction in �1�2�2 but not �3�2�2 expressionwould result in a greater proportion of�3�2�2 receptors on thesurface than found in wild type neurons (shown here as a 3:2ratio). Therefore, the time course of GABAergic currents, as aweighted sum of the �1�2�2 and �3�2�2 receptors, would bemore similar to that of �3�2�2 receptors in haploinsufficientthanwild type neurons. Because therewould be fewerGABAARon the cell surface, inhibitory postsynaptic current peak ampli-tudes would be smaller in haploinsufficient than wild typeneurons.Rather than a haploinsufficient model, our data presented
here suggests a haploinsufficient plus dominant negativemodel(Fig. 11, C and F). In this model, neurons express �1(AD) sub-unit in the ER. Some �1(AD) subunits degrade, but some�1(AD) subunits oligomerize with �1 and �3 subunit-contain-ing GABAARs (Fig. 11C). Retained �1(AD) subunits reduce agreater fraction of �3�2�2 receptors than �1�2�2 receptors,and thus the ratio of �1 to �3 subunit-containing receptors isshown here as a 2:1 ratio (Fig. 11F). The time course of theGABAergic currents is thus more similar to that of �1�2�2receptors in a haploinsufficient plus dominant negative modelthan in the pure haploinsufficientmodel. Because both�1�2�2and �3�2�2 receptor expression is reduced, peak currentamplitudes are reduced relative to wild type and haploinsuffi-cient currents.Implications of Dominant Negative Effects for ADJME and
OtherDominant Epilepsy Syndromes—Although the amount ofendogenous �1(AD) subunit expressed in neurons of ADJMEpatients is unknown, our data demonstrated that neuronsdegrade recombinant �1(AD) subunit with high efficiency(79%, Fig. 9). Therefore, assuming that the endogenous �1(AD)subunit inADJMEpatients also expresses at 21%ofwild type�1subunit and that the �1(AD) subunit in neurons cause similarsigmoidal reductions in surface wild type �1 and �3 subunitexpression as inHEK293T cells (Figs. 4, 7, and 8), we expect thatheterozygous �1(AD) subunit expression in ADJME patients
GABRA1 A322D Mutation Causes Dominant Negative Effects
AUGUST 20, 2010 • VOLUME 285 • NUMBER 34 JOURNAL OF BIOLOGICAL CHEMISTRY 26403
by guest on February 19, 2019http://w
ww
.jbc.org/D
ownloaded from
would reduce surface �1 and �3 subunit expression by an addi-tional 4 and 5%, respectively,more than hemizygous�1 subunitexpression.Could such a seemingly small additional reduction in surface
�1 and �3 subunit expression alter the epilepsy phenotype?Both empirical and theoretical systems do suggest that seizuresare threshold events and that even small changes in GABAARavailability can transition an organism into a seizure-pronestate. For example, even though the GABAAR antagonists,bicuculline and pentylenetetrazole, inhibit GABA-evoked cur-rentswith typical sigmoidal concentration-response curves (46,47), they produce seizures in experimental animals at specificdoses with very small variances (48, 49). These findings suggestthat a specific threshold of functional GABAARs is required toprevent an organism from experiencing a seizure. Moreover,recent computationalmodels of neural networks predicted thatvery small changes in ion channel function can produce sei-zure-like activities (50).Small changes in GABAAR expression and composition
may shape the phenotypes of other autosomal dominantGABAAR subunit mutations that are associated with epi-lepsy. The best studied mutation is the �2(R43Q) mutationassociated with childhood absence epilepsy and febrile sei-zures (51). The �2(R43Q) subunit produces smaller changes inGABAAR expression and composition than the �1(AD) sub-unit. Although the R43Q mutation does not reduce the totalexpression of the �2(R43Q) subunit, it disrupts its ability todirectly oligomerize with �2 subunits (52). The inability of�2(R43Q) subunits to oligomerizemay explain why they do notproduce a dominant negative effect on �1, �3, or �2 subunitexpression or alter mIPSC amplitude or current kinetics (17,18). The �2(R43Q) subunit does reduce surface trafficking ofthe �5 subunit-containing GABAARs and thereby reducestonic GABAAR currents (17). Although the effects of the�2(R43Q) subunit are small, they do shape the epilepsy pheno-type because the heterozygous �2(R43Q) subunit knock-inmice but not heterozygous �2 subunit knock-out mice experi-ence seizures (16, 19, 53).Therefore, we think that the small dominant negative effects
of the �1(AD) subunit could confer an epilepsy phenotype thatis different from the one conferred by �1 subunit haploinsuffi-ciency alone. This hypothesis needs to be directly tested bycomparing heterozygous �1 knock-out with �1(AD) knock-ingenetically modified mice.
Acknowledgments—We thank Dr. Bruce Carter (Vanderbilt Univer-sity) for helpful comments concerning this manuscript. Flow cytom-etry experiments were performed in the VMC Flow Cytometry SharedResource. The Vanderbilt University Medical Center Flow CytometryShared Resource is supported by the Vanderbilt Ingram Cancer Cen-ter Grant P30 CA68485 and the Vanderbilt Digestive DiseaseResearch Center Grant DK058404. Flow cytometry was supported inpart by National Institutes of Health Vanderbilt CTSA Grant 5UL1RR024975-03 from NCRR.
REFERENCES1. Brooks-Kayal, A. R., Jin, H., Price, M., and Dichter, M. A. (1998) J. Neuro-
chem. 70, 1017–1028
2. Laurie, D. J., Wisden, W., and Seeburg, P. H. (1992) J. Neurosci. 12,4151–4172
3. Pirker, S., Schwarzer, C., Wieselthaler, A., Sieghart, W., and Sperk, G.(2000) Neuroscience 101, 815–850
4. Tretter, V., Ehya, N., Fuchs, K., and Sieghart, W. (1997) J. Neurosci. 17,2728–2737
5. Baumann, S. W., Baur, R., and Sigel, E. (2001) J. Biol. Chem. 276,36275–36280
6. Baumann, S. W., Baur, R., and Sigel, E. (2002) J. Biol. Chem. 277,46020–46025
7. Macdonald, R. L., Kang, J. Q., and Gallagher, M. J. (2010) J. Physiol. 588,1861–1869
8. Cossette, P., Liu, L., Brisebois, K., Dong, H., Lortie, A., Vanasse, M., Saint-Hilaire, J.M., Carmant, L., Verner, A., Lu,W. Y.,Wang, Y. T., and Rouleau,G. A. (2002) Nat. Genet. 31, 184–189
9. Alfradique, I., and Vasconcelos, M. M. (2007) Arq Neuropsiquiatr. 65,1266–1271
10. Gallagher, M. J., Ding, L., Maheshwari, A., and Macdonald, R. L. (2007)Proc. Natl. Acad. Sci. U.S.A. 104, 12999–13004
11. Bradley, C. A., Taghibiglou, C., Collingridge, G. L., andWang, Y. T. (2008)J. Biol. Chem. 283, 22043–22050
12. Fisher, J. L. (2004) Neuropharmacology 46, 629–63713. Gallagher, M. J., Song, L., Arain, F., and Macdonald, R. L. (2004) J. Neuro-
sci. 24, 5570–557814. Kang, J. Q., Shen, W., and Macdonald, R. L. (2009) J. Neurosci. 29,
2833–284415. Maljevic, S., Krampfl, K., Cobilanschi, J., Tilgen,N., Beyer, S.,Weber, Y.G.,
Schlesinger, F., Ursu, D.,Melzer,W., Cossette, P., Bufler, J., Lerche,H., andHeils, A. (2006) Ann. Neurol. 59, 983–987
16. Berry, R. B., Chandra, D., Diaz-Granados, J. L., Homanics, G. E., andMat-thews, D. B. (2009) Neurosci. Lett. 455, 84–87
17. Eugene, E., Depienne, C., Baulac, S., Baulac, M., Fritschy, J. M., Le Guern,E., Miles, R., and Poncer, J. C. (2007) J. Neurosci. 27, 14108–14116
18. Frugier, G., Coussen, F., Giraud,M. F., Odessa, M. F., Emerit, M. B., Boue-Grabot, E., and Garret, M. (2007) J. Biol. Chem. 282, 3819–3828
19. Tan, H. O., Reid, C. A., Single, F. N., Davies, P. J., Chiu, C., Murphy, S.,Clarke, A. L., Dibbens, L., Krestel, H., Mulley, J. C., Jones, M. V., Seeburg,P. H., Sakmann, B., Berkovic, S. F., Sprengel, R., and Petrou, S. (2007) Proc.Natl. Acad. Sci. U.S.A. 104, 17536–17541
20. Zeiger, S. L., Musiek, E. S., Zanoni, G., Vidari, G., Morrow, J. D., Milne,G. J., and McLaughlin, B. (2009) Free Radic. Biol. Med. 47, 1422–1431
21. Gallagher, M. J., Shen, W., Song, L., and Macdonald, R. L. (2005) J. Biol.Chem. 280, 37995–38004
22. Jiang, M., and Chen, G. (2006) Nat. Protoc. 1, 695–70023. Saliba, R. S., Pangalos, M., and Moss, S. J. (2008) J. Biol. Chem. 283,
18538–1854424. Lo, W. Y., Botzolakis, E. J., Tang, X., and Macdonald, R. L. (2008) J. Biol.
Chem. 283, 29740–2975225. Zhao, J., Matthies, D. S., Botzolakis, E. J., Macdonald, R. L., Blakely, R. D.,
and Hedera, P. (2008) J. Neurosci. 28, 13938–1395126. Krampfl, K., Maljevic, S., Cossette, P., Ziegler, E., Rouleau, G. A., Lerche,
H., and Bufler, J. (2005) Eur. J. Neurosci. 22, 10–2027. Kumar, A., Kremer, K. N., Sims, O. L., and Hedin, K. E. (2009) Methods
Enzymol. 460, 379–39728. Kralic, J. E., Korpi, E. R., O’Buckley, T. K., Homanics, G. E., and Morrow,
A. L. (2002) J. Pharmacol. Exp. Ther. 302, 1037–104529. Kralic, J. E., Sidler, C., Parpan, F., Homanics, G. E., Morrow, A. L., and
Fritschy, J. M. (2006) J. Comp. Neurol. 495, 408–42130. Ogris, W., Lehner, R., Fuchs, K., Furtmuller, B., Hoger, H., Homanics,
G. E., and Sieghart, W. (2006) J. Neurochem. 96, 136–14731. Bosman, L. W., Heinen, K., Spijker, S., and Brussaard, A. B. (2005) J. Neu-
rophysiol. 94, 338–34632. Picton, A. J., and Fisher, J. L. (2007) Brain Res. 1165, 40–4933. Brickley, S. G., Cull-Candy, S. G., and Farrant, M. (1996) J. Physiol. 497,
753–75934. Jones, A., Korpi, E. R., McKernan, R. M., Pelz, R., Nusser, Z., Makela, R.,
Mellor, J. R., Pollard, S., Bahn, S., Stephenson, F. A., Randall, A. D.,Sieghart, W., Somogyi, P., Smith, A. J., andWisden,W. (1997) J. Neurosci.
GABRA1 A322D Mutation Causes Dominant Negative Effects
26404 JOURNAL OF BIOLOGICAL CHEMISTRY VOLUME 285 • NUMBER 34 • AUGUST 20, 2010
by guest on February 19, 2019http://w
ww
.jbc.org/D
ownloaded from
17, 1350–136235. Sur, C., Farrar, S. J., Kerby, J., Whiting, P. J., Atack, J. R., and McKernan,
R. M. (1999)Mol. Pharmacol. 56, 110–11536. Glykys, J., Peng, Z., Chandra, D., Homanics, G. E., Houser, C. R., and
Mody, I. (2007) Nat. Neurosci. 10, 40–4837. Kralic, J. E., O’Buckley, T. K., Khisti, R. T., Hodge, C.W., Homanics, G. E.,
and Morrow, A. L. (2002) Neuropharmacology 43, 685–69438. Szegezdi, E., Logue, S. E., Gorman, A. M., and Samali, A. (2006) EMBO
Rep. 7, 880–88539. Page, K. M., Heblich, F., Davies, A., Butcher, A. J., Leroy, J., Bertaso, F.,
Pratt, W. S., and Dolphin, A. C. (2004) J. Neurosci. 24, 5400–540940. Page, K.M., Heblich, F., Margas,W., Pratt,W. S., Nieto-Rostro,M., Chag-
gar, K., Sandhu, K., Davies, A., andDolphin,A.C. (2010) J. Biol. Chem.285,835–844
41. Connolly, C.N., Krishek, B. J.,McDonald, B. J., Smart, T. G., andMoss, S. J.(1996) J. Biol. Chem. 271, 89–96
42. Klausberger, T., Sarto, I., Ehya, N., Fuchs, K., Furtmuller, R., Mayer, B.,Huck, S., and Sieghart, W. (2001) J. Neurosci 21, 9124–9133
43. Bollan, K., King, D., Robertson, L. A., Brown, K., Taylor, P. M., Moss, S. J.,and Connolly, C. N. (2003) J. Biol. Chem. 278, 4747–4755
44. Bollan, K., Robertson, L. A., Tang, H., andConnolly, C. N. (2003)Biochem.
Soc. Trans. 31, 875–87945. Poulter, M. O., Barker, J. L., O’Carroll, A.M., Lolait, S. J., andMahan, L. C.
(1992) J. Neurosci. 12, 2888–290046. Zhang, J., Xue, F., and Chang, Y. (2008)Mol. Pharmacol. 74, 941–95147. Huang, R.Q., Bell-Horner, C. L., Dibas,M. I., Covey,D. F., Drewe, J. A., and
Dillon, G. H. (2001) J. Pharmacol. Exp. Ther. 298, 986–99548. Vlainiæ, J., and Periciæ, D. (2009) Neuropharmacology 56, 1124–113049. Hentschke, M., Wiemann, M., Hentschke, S., Kurth, I., Hermans-Borgm-
eyer, I., Seidenbecher, T., Jentsch, T. J., Gal, A., and Hubner, C. A. (2006)Mol. Cell. Biol. 26, 182–191
50. Thomas, E. A., Reid, C. A., Berkovic, S. F., and Petrou, S. (2009) Arch.Neurol. 66, 1225–1232
51. Wallace, R. H.,Marini, C., Petrou, S., Harkin, L. A., Bowser, D.N., Panchal,R. G., Williams, D. A., Sutherland, G. R., Mulley, J. C., Scheffer, I. E., andBerkovic, S. F. (2001) Nat. Genet. 28, 49–52
52. Hales, T. G., Tang, H., Bollan, K. A., Johnson, S. J., King, D. P., McDonald,N. A., Cheng, A., and Connolly, C. N. (2005) Mol. Cell. Neurosci. 29,120–127
53. Chiu, C., Reid, C. A., Tan, H. O., Davies, P. J., Single, F. N., Koukoulas, I.,Berkovic, S. F., Tan, S. S., Sprengel, R., Jones, M. V., and Petrou, S. (2008)Ann. Neurol. 64, 284–293
GABRA1 A322D Mutation Causes Dominant Negative Effects
AUGUST 20, 2010 • VOLUME 285 • NUMBER 34 JOURNAL OF BIOLOGICAL CHEMISTRY 26405
by guest on February 19, 2019http://w
ww
.jbc.org/D
ownloaded from

Martin J. GallagherLi Ding, Hua-Jun Feng, Robert L. Macdonald, Emanuel J. Botzolakis, Ningning Hu and
ReceptorsAComposition of Wild Type GABADominant Juvenile Myoclonic Epilepsy Reduces the Expression and Alters the
1 Subunit Mutation A322D Associated with Autosomalα Receptor AGABA
doi: 10.1074/jbc.M110.142299 originally published online June 15, 20102010, 285:26390-26405.J. Biol. Chem.
10.1074/jbc.M110.142299Access the most updated version of this article at doi:
Alerts:
When a correction for this article is posted•
When this article is cited•
to choose from all of JBC's e-mail alertsClick here
Supplemental material:
http://www.jbc.org/content/suppl/2010/06/15/M110.142299.DC1
http://www.jbc.org/content/285/34/26390.full.html#ref-list-1
This article cites 53 references, 27 of which can be accessed free at
by guest on February 19, 2019http://w
ww
.jbc.org/D
ownloaded from