fyq4 2010 investor call february 18, 2011 bill lucia, ceo walter hosp, cfo
TRANSCRIPT

FYQ4 2010 Investor CallFebruary 18, 2011
Bill Lucia, CEO
Walter Hosp, CFO

2
Discussion Outline
• FYQ4 2010 Financial Performance
• Strategic Progress
• Reform Activity 2011-2014
• Q&A

3
Consolidated Statements of Income ($ in thousands)
Percentage Change
2010 2009
$ 87,167 $ 66,318 31%
30,878 22,671 36%5,337 3,604 48%3,761 3,108 21%9,787 7,214 36%4,750 4,190 13%
1,651 1,423 16%
56,164 42,210 33%
Selling, general & administrative expenses 10,165 7,902 29%
66,329 50,112 32% 20,838 16,206 29%
(314) (233) 35%
20,524 15,973 28% 8,169 6,647 23%
$ 12,355 $ 9,326 32%
$ 0.43 $ 0.33 30%
28,717 27,981 3%
Three months ended December 31,
Amortization of acquisition related software
Data processingOccupancyDirect project costsOther operating costs
and intangibles
Total cost of services
Net income
Operating income
Income taxes
Revenue
Total operating expenses
Cost of services:Compensation
Weighted average common shares, diluted
Net income per diluted shareDiluted income per share data:
Income before income taxes
Net interest expense

Consolidated Statements of Income ($ in thousands)
Percentage Change
2010 2009
$302,867 $ 229,237 32%
109,601 77,208 42% 18,086 13,717 32% 13,643 10,877 25% 35,383 28,384 25% 16,835 14,019 20%
6,217 5,066 23%
199,765 149,271 34%
Selling, general & administrative expenses 36,085 28,098 28% 235,850 177,369 33%
67,017 51,868 29%
342 854 -60%
66,675 51,014 31% 26,583 20,966 27%
$ 40,092 $ 30,048 33%
$ 1.41 $ 1.09 29%
28,458 27,621 3%
Year ended December 31,
Amortization of acquisition related software
Data processingOccupancyDirect project costsOther operating costs
and intangibles
Total cost of services
Net income
Operating income
Income taxes
Revenue
Total operating expenses
Cost of services:Compensation
Weighted average common shares, diluted
Net income per diluted shareDiluted income per share data:
Income before income taxes
Net Interest expense
4

5
Condensed Balance Sheets ($ in thousands)
2010 2009 Assets
Current assets:Cash and cash equivalents 94,836$ 64,863$ Accounts receivable, net of allowance of $799 and $614 at December 31, 75,123 64,750 2010 and 2009, respectivelyPrepaid expenses and other current assets 10,089 10,828
Total current assets 180,048 140,441
Property and equipment, net 44,713 20,902 Other non-current assets 128,144 109,301
Total assets 352,905$ 270,644$
Liabilities and Shareholders' Equity
Current liabilities: Accounts payable and accrued expenses and other liabilties 32,502$ 26,474$
Other liabilities 12,765 5,877
Total liabilities 45,267 32,351
Total shareholders' equity 307,638 238,293
Total liabilities and shareholders' equity 352,905$ 270,644$
Year EndedDecember 31,
6
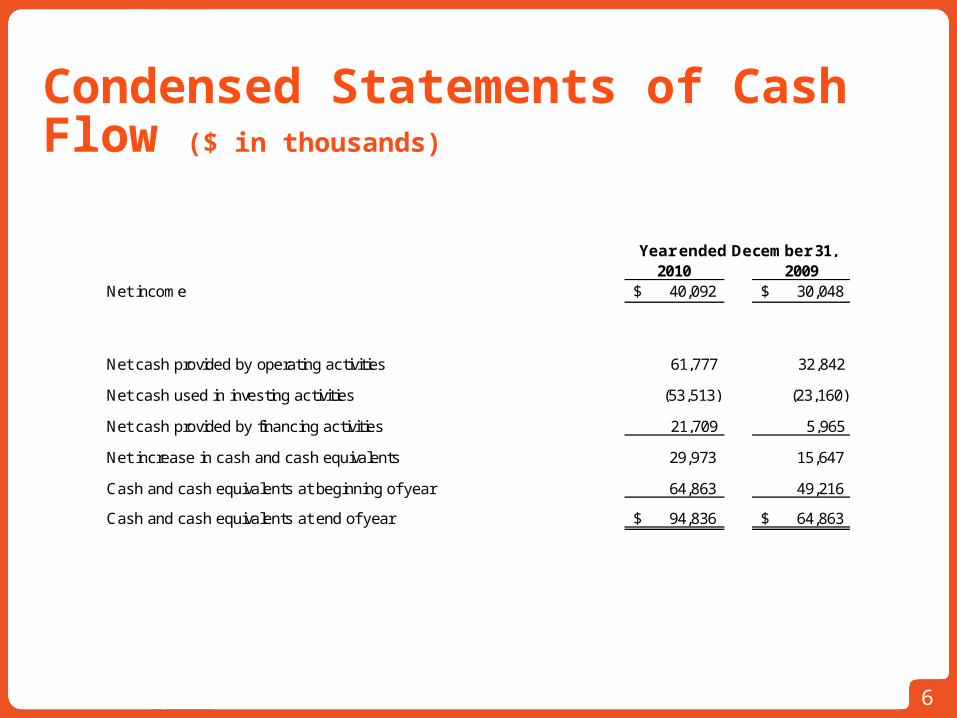
Condensed Statements of Cash Flow ($ in thousands)
2010 2009Net income 40,092$ 30,048$
Net cash provided by operating activities 61,777 32,842
Net cash used in investing activities (53,513) (23,160)
Net cash provided by financing activities 21,709 5,965
Net increase in cash and cash equivalents 29,973 15,647
Cash and cash equivalents at beginning of year 64,863 49,216
Cash and cash equivalents at end of year 94,836$ 64,863$
Year ended December 31,

GuidanceActual Guidance
Revenue 2010 2010 2011$ $302.9 $300.0 $370.0
% change y/y 32.1% 30.9% 22.2%
Operating Profit$ $67.0 $66.9 $85.0
% change y/y 29.2% 29.0% 26.9%
Margin 22.1% 22.3% 23.0%
GAAP EPS$ $1.41 $1.40 $1.74
% change y/y 29.4% 28.7% 23.4%
Adjusted EPS$ $1.69 $1.68 $2.03
% change y/y 27.1% 25.9% 20.1%7

Strategic Progress
• Continued execution on multi-year plan
• Successful diversification through product development and acquisition
• Continued new sales across all products, all markets
• Well-positioned for 2011-2012
8
9
9
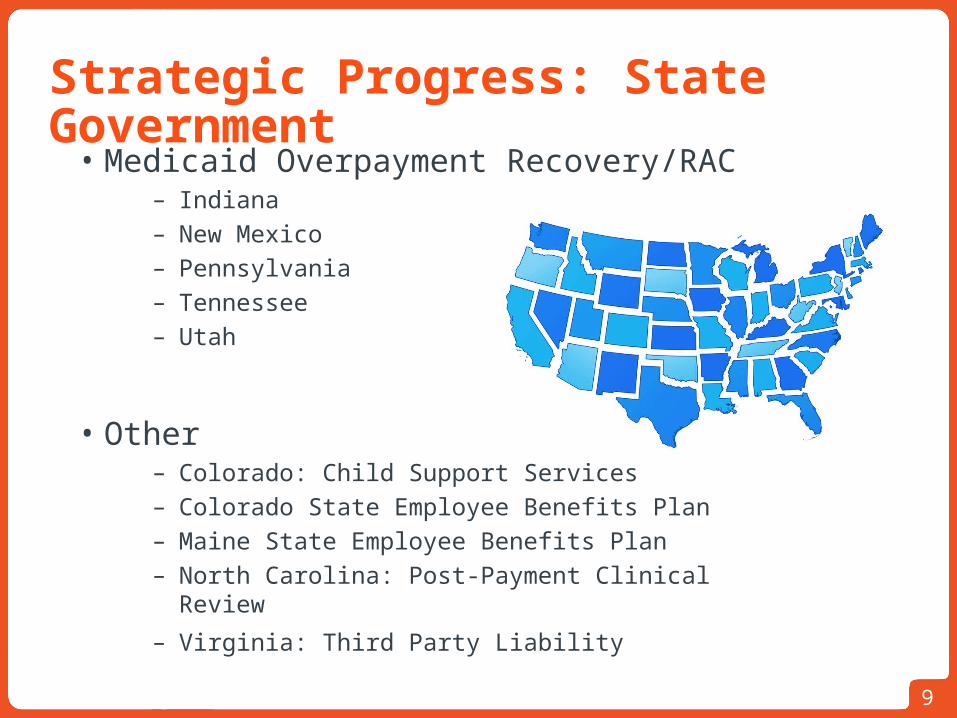
Strategic Progress: State Government
• Medicaid Overpayment Recovery/RAC– Indiana – New Mexico– Pennsylvania– Tennessee– Utah
• Other– Colorado: Child Support Services– Colorado State Employee Benefits Plan– Maine State Employee Benefits Plan– North Carolina: Post-Payment Clinical Review
– Virginia: Third Party Liability

10
Strategic Progress: Federal
• Zone Program Integrity Contractors (ZPIC)
– Zone 1 (sub to Safeguard Services)
– Zone 2 (sub to AdvanceMed)
• CHAMPVA: Insurance Identification and Verification
10
Strategic Progress: Managed Care• New
– Phoenix Health Plan, Advantage Health Care
– Missouri Care Plan, Aetna
– HealthPlus Prepaid Health Services Plan
• Expansions– BlueCross Blue Shield of Tennessee
– Gateway Health Plan
– Health Net of California
– Healthfirst Health Plan
– Value Options
– Wellcare Health Plans
11
Reform Activity: 2011-2014• Early adoption
– Massachusetts – Connecticut– District of Columbia– California– Minnesota– New Jersey
• Program integrity and compliance– Medicaid RACs– Benefit plan audits– Focus on fraud, waste and abuse
• Exchanges– Exchange planning grants– Coordination of benefits required– Right insurance home– Eligibility verification required
12

13
Safe Harbor Statement This Press Release contains “forward-looking statements” within the meaning of the U.S. Private Securities Litigation Reform Act of 1995.
Such statements give our expectations or forecasts of future events; they do not relate strictly to historical or current facts. Forward-
looking statements can be identified by words such as “anticipates,” “estimates,” “expects,” “projects,” “intends,” “plans,” “believes,” “will,”
“target,” “seeks,” “forecast” and similar expressions. In particular, these include statements relating to future actions, business plans,
objects and prospects, and future operating or financial performance. Forward-looking statements are based on our current expectations
and assumptions regarding our business, the economy and other future conditions. Should known or unknown risks or uncertainties
materialize, or should underlying assumptions prove inaccurate, actual results could differ materially from past results and those
anticipated, estimated or projected. We caution you therefore against relying on any of these forward-looking statements. Factors that
could cause or contribute to such differences include, but are not limited to: the development by competitors of new or superior services
or products or the entry into the market of new competitors; all the risks inherent in the development, introduction, and implementation of
new products and services; the loss of a major customer, customer dissatisfaction or early termination of customer contracts triggering
significant costs or liabilities; variations in our results of operations; negative results of government reviews, audits or investigations to
verify our compliance with contracts and applicable laws and regulations; changing conditions in the healthcare environment, particularly
as they relate to current healthcare reform initiatives; government regulatory, political and budgetary pressures that could affect the
procurement practices and operations of healthcare organizations, reducing the demand for our services; and, our failure to comply with
laws and regulations governing health data or to protect such data from theft and misuse. A further description of risks, uncertainties, and
other matters can be found in the Company’s Annual Report on Form 10-K for the fiscal year ended December 31, 2009, a copy of which
may be obtained from the Company’s website at www.hms.com under the “Investor Relations” tab. Any forward-looking statements
made by us in this Press Release speak only as of the date of this Press Release. Factors or events that could cause actual results to
differ may emerge from time to time and it is not possible for us to predict all of them. We undertake no obligation to publicly update
forward-looking statements, whether as a result of new information, future events or otherwise, except as may be required by law.

14
NASDAQ: HMSY