fydp final report g13.pdf
DESCRIPTION
Final Year Report Chemical and Biomolecular EngineeringTRANSCRIPT

School of Chemical & Biomedical Engineering
Nanyang Technological University
AY2012/2013
CH4701 Final Year Design Project
Cumene Plant Design
Group 13
Group Members Matriculation No.
Bee Sui Chan
Lim Ye Chiek
Goh Chern Chiat
Jeanette Hong May Hurn
Soon Wei Jian
Tan Ming Feng
Tham Wai Lap
Tong Kok Wah
U0920483D
U0920454G
U0923366F
U0920486F
U0922921E
U0922022F
U0920457J
U0920472J
i
TABLE OF CONTENTS
TABLE OF CONTENTS ...................................................................................................................................................................... i
LIST OF TABLES................................................................................................................................................................................. ii
LIST OF FIGURES ............................................................................................................................................................................... ii
EXECUTIVE SUMMARY................................................................................................................................................................. iii
SECTION 1.0 PROCESS DESIGN AND SIMULATION .................................................................................................... 1
1.1 Reaction Kinetics…………………………………………………………………………………………………………..1
1.2 Thermodynamic Package Validation………………………………………………………………………………………1
1.3 Process Description………………………………………………………………………………………………………..2
SECTION 2.0 OPTIMIZATION OF DESIGN VARIABLES .............................................................................................. 2
2.1 Classification of Dominant and Local Design Variables……………………………………………………………….....2
2.2 Dominant Variable Economic Trade-Offs………………………………………………………………………………...3
2.3 Optimization of Dominant Design Variables……………………………………………………………………………...4
2.4 Optimization of Local Design Variables…………………………………………………………………………………..6
SECTION 3.0 HEAT INTEGRATION ..................................................................................................................................... 8
3.1 Determination of Energy Requirements and ΔTmin………………………………………………………………………..8
3.2 Development of Heat Exchanger Network………………………………………………………………………………...9
3.3 Other Considerations in Development of Heat Exchanger Network………………………………………………….…10
3.4 Economic Comparison of Stage 2 and 3………………………………………………………………………………....11
SECTION 4.0 DETAILED DESIGN OF MAIN REACTOR ............................................................................................. 12
4.1 Reactor Design Parameters……………………………………………………………………………………………….12
SECTION 5.0 SAFETY, HEALTH, AND ENVIRONMENT ............................................................................................ 13
5.1 Fire and Explosion Assessment…………………………………………………………………………………………..13
5.2 Chemical Exposure Assessment………………………………………………………………………………………….14
5.3 Environmental Assessment……………………………………………………………………………………………….14
5.4 General Safety Measures………………………………………………………………………………………………....15
5.5 Considerations for Non-Steady State Plant Operation………………………………………………………………..….16
5.6 Hazard and Operability Study (HAZOP) for Main Reactor……………………………………………………………...19
SECTION 6.0 RECOMMENDATIONS ................................................................................................................................. 22
SECTION 7.0 CONCLUSION.................................................................................................................................................. 22
REFERENCES......................................................................................................................................................................................A
APPENDIX............................................................................................................................................................................................ B

ii
LIST OF TABLES Table 1 : List of plant-wide design variables and respective categorizat ion as dominant/local ........................................... 3
Table 2 : Economic comparison between stage 2 and 3 ............................................................................................................ 11
Table 3 : Justificat ions for choice reactor design parameters ................................................................................................... 12
Table 4 : General process flow conditions for the main reactor ............................................................................................... 13
Table 5 : F&EI values of main process units with corresponding degree of hazard and main risk factor ........................ 13
Table 6 : General hazards of raw materials and products for cumene manufacture ............................................................. 14
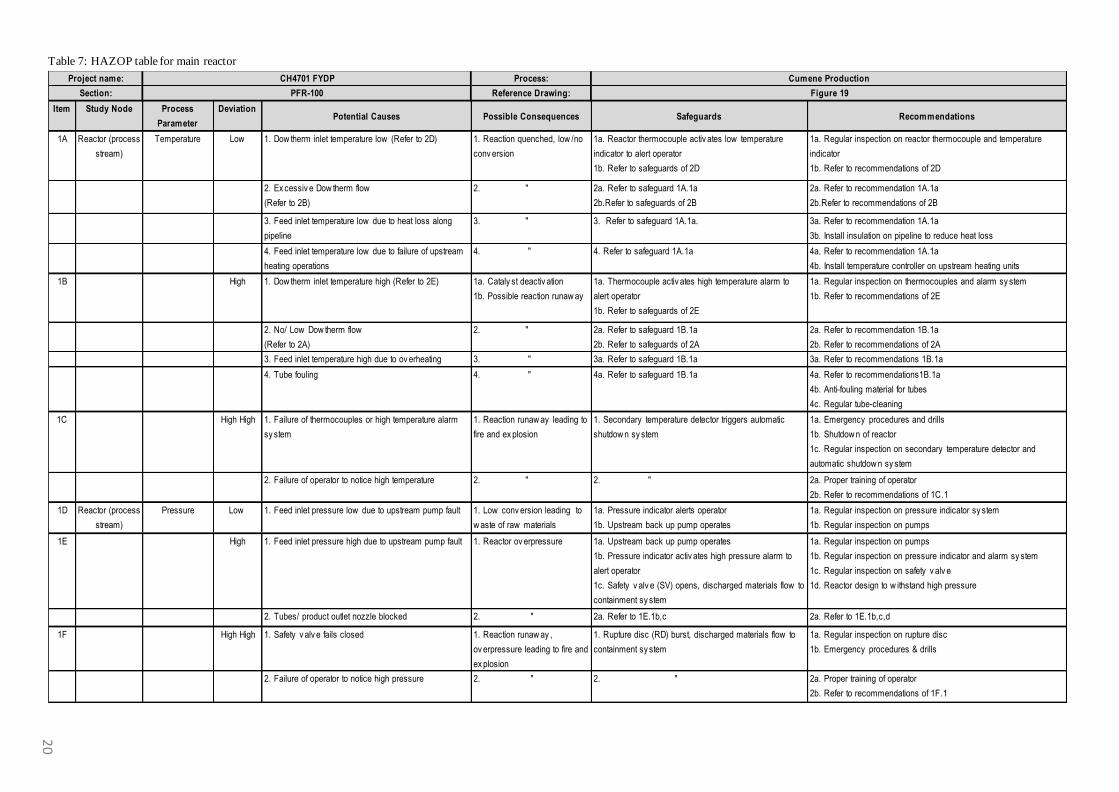
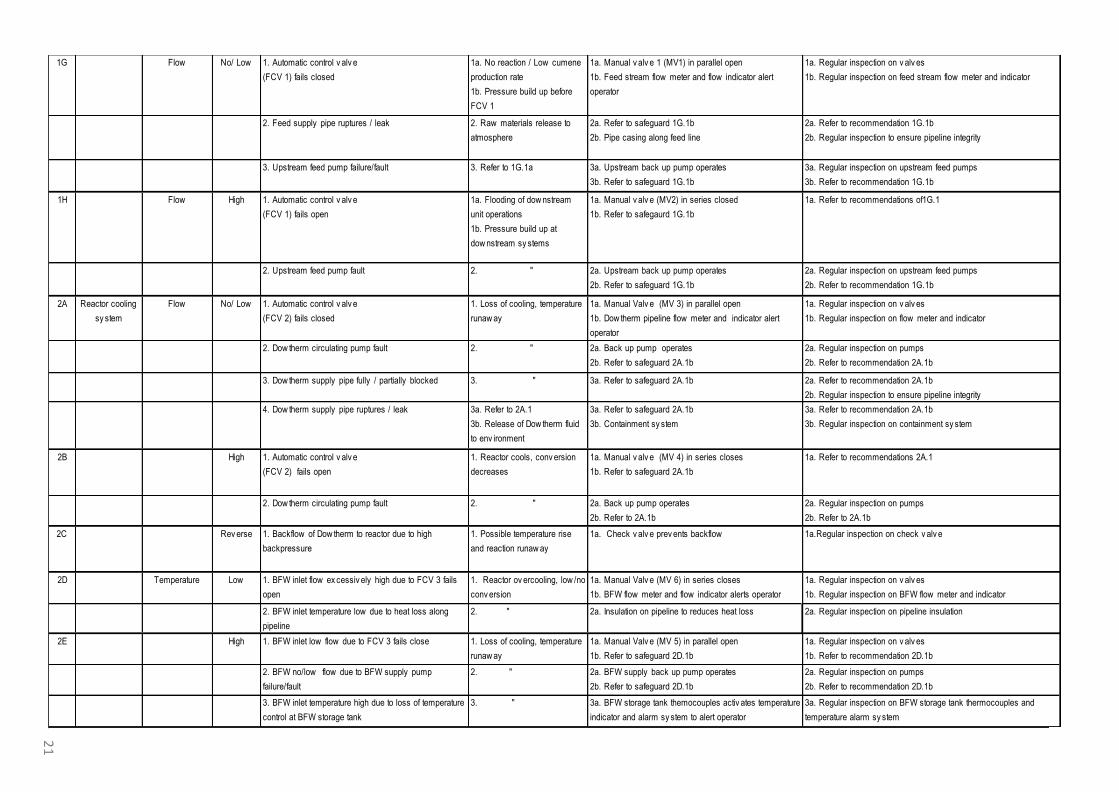
Table 7 : HAZOP table for main reactor ...................................................................................................................................... 20
Table A 1: Equipment Design Parameters, Capital and Energy Costs for Economic Optimum…………………………….B
Table A 2: Equipment Sizing, Cost Correlations, and Unit Price Dataa………………………………………………….C
Table A 3: Stream Table for Final Design………………………………………………………………………………..D
LIST OF FIGURES Figure 1: Temperature vs benzene fract ion for saturated liquid and gas phase of benzene-cumene system ......................... 1
Figure 2: Profit vs main reactor pressure........................................................................................................................................... 3
Figure 3: Profit vs main reactor temperature .................................................................................................................................... 3
Figure 4: Profit vs total benzene ......................................................................................................................................................... 4
Figure 5: Profit vs main reactor volume ............................................................................................................................................ 4
Figure 6: Profit vs main reactor volume at different pressures ...................................................................................................... 5
Figure 7: Profit vs reactor volume at d ifferent temperatures ......................................................................................................... 5
Figure 8 Profit vs total benzene at different reactor volumes ........................................................................................................ 5
Figure 9: Profit vs column 2 (T-101) cumene fractions in distillate stream ................................................................................ 6
Figure 10: Profit vs transalkylator pressure at different temperatures .......................................................................................... 7
Figure 11: Profit vs transalkylator volume at d ifferent B/DIPB rat ios ......................................................................................... 7
Figure 12: Total annualized cost vs min imum temperature d ifference ........................................................................................ 9
Figure 13: Composite curve of hot and cold streams ...................................................................................................................... 9
Figure 14: Heat exchanger network design to meet minimum energy requirements.............................................................. 10
Figure 15: Finalized heat exchanger network ................................................................................................................................. 11
Figure 16: Contribution of various unit operations to total capital cost for stage 2 & 3 ......................................................... 12
Figure 17 : Contribution of various unit operations to total energy cost for stage 2 & 3........................................................ 12
Figure 18: Typical configuration of a natural draft spray tower.................................................................................................. 15
Figure 19: HAZOP schemat ic fo r main reactor and associated boiler ....................................................................................... 19

iii
EXECUTIVE SUMMARY
The goal of this project is to design and optimize a cumene production plant with an output of 200,000 tons
per year or 231.12 kilo moles per hour. Cumene which is used in the manufacturing o f phenol, nylon-6,6 and resins, is
produced from the alkylat ion of benzene with propylene over an acid catalyst. An undesirable side reaction occurs
where cumene is further alky lated to di-isopropyl benzene (DIPB) by propylene. Section 1 of this report further
discusses the detailed reaction kinetics that take place. Also discussed is the choice of a suitable thermodynamic
package as an important input needed for computer simulation using Aspen HYSYS. A detailed process description for
the final plant design as shown in the inserted process flow diagram is included at the end of the section.
Section 2 deals with the dominant and local design variables that are thus classified based on their impact on
economic profit. Optimization is done with the purpose of obtaining the maximum economic profit that is technically
feasible. The design of the plant was done in 3 stages; Stage 1 involved identifying and optimizing the dominant design
variables without DIPB recycle to extinction, which led to Stage 2 where a DIPB recycle stream and init ial heat
integration were added. Stage 3 was focused on improving energy efficiency by using heat integration methods to
further modify the Stage 2 design. In this report, only the results from Stage 2 and 3 are d iscussed. The dominant
variables identified are the main reactor temperature, pressure and volume, and the total amount of benzene fed to the
main reactor. These variables have the greatest effect on plant economics as they affect propylene conversion and thus
raw material costs that form the bulk o f expenditure. The optimized variables for the main reactor were found to be
inlet temperature of 300 °C, pressure of 30 bar and volume of 51 m3, using a total benzene flow rate of 335 kgmole/hr
(B/P ratio o f 1.36). Local variables revolve around specificat ions for the distillation columns and transalkylator in the
DIPB recycle loop. Though local variables are of less significance in comparison to dominant variab les, they were also
optimized as their total sum contributed to a large part of capital and operating costs.
Section 3 delves into the approach used to determine the minimum temperature difference, ΔT min between the
hot and cold streams for heat integration. A ΔTmin of 20°C corresponding to the min imum total annualized cost (TAC)
was obtained using the Aspen Energy Analyzer. Pairing of process streams and heat exchanger network design were
then developed and shown in the form of grid diagrams. A comparison of Stage 2 and 3 economics and steam
consumption was done to quantify the benefits of the implemented heat integration. Section 4 describes the
considerations for detailed engineering design of the main reactor. In general, the reactor consists of a multi-tubular
packed bed that utilizes shell cooling which is linked to a steam generating boiler. It was designed in a similar way to a
shell-and-tube heat exchanger using a triangular pitch layout. The mechanical drawing of the reactor is inserted in this
report.
Safety, health, and environmental concerns are addressed in Section 5. Fire and exp losion and chemical
exposure analysis were conducted using Dow indices to grade the degree of hazards associated with major p rocess
units. The main reactor and propylene storage tank were identified as process units with the highest risk po tential due to
several risk factors. Environmental hazards identified include flare emissions and hot water disposal. To prevent and
mitigate these hazards, general safety measures were outlined. Special safety procedures involved in the
commissioning, start-up, shut-down and emergency shut-down of the plant were also discussed. Finally, a separate
Hazard and Operability Study was conducted on the main reactor to ensure its safe operation, which is of greatest
concern as it is operated at high temperatures and pressures that may lead to a reaction runaway.
1
SECTION 1.0 PROCESS DESIGN AND SIMULATION
1.1 Reaction Kinetics
The main reaction for our process is shown in (1), where p ropylene reacts with benzene over an acid catalyst
to produce cumene. Cumene is then further alky lated by propylene in side reaction (2) which produces di-
isopropylbenzene (DIPB), an undesirable side product. Other side reactions that involve trace impurities are not
considered in this study. Both reactions (1) and (2) are exothermic. It is known that the activation energy of side
reaction (2) is higher than (1), hence operation at higher temperature will favor the side-reaction and reduce the single-
pass selectivity. In order to achieve an overall select ivity of 100%, a third, mildly endothermic reaction (3) is designed
to take place in the transalkylator to convert any DIPB back to the cumene, indicat ing a need of recycling DIPB to
extinction in the process loop. The relevant reaction kinetics as shown below are applied in the simulat ion along with
specified catalyst properties and range of reaction.
(1)
(2)
(3) (
)
1.2 Thermodynamic Package Validation
The accuracy of a process simulat ion outcome greatly depends on the thermodynamic models chosen. Hence,
the thermodynamic package for our process was carefully studied based on graphical comparison. The Peng -Robinson
(PR) EOS model [1] and NRTL model [2] have been used in previous studies of the same process and were selected to
do a comparison with experimental data from DECHEMA. This was done by plotting a temperature versus composition
(T – xy) graph for the three pairs of heavy key and light key components of the respective distillat ion columns using
VLE data from DECHEMA. Those values obtained from HYSYS simulation that using PR and NRTL models are
under the same physical conditions.
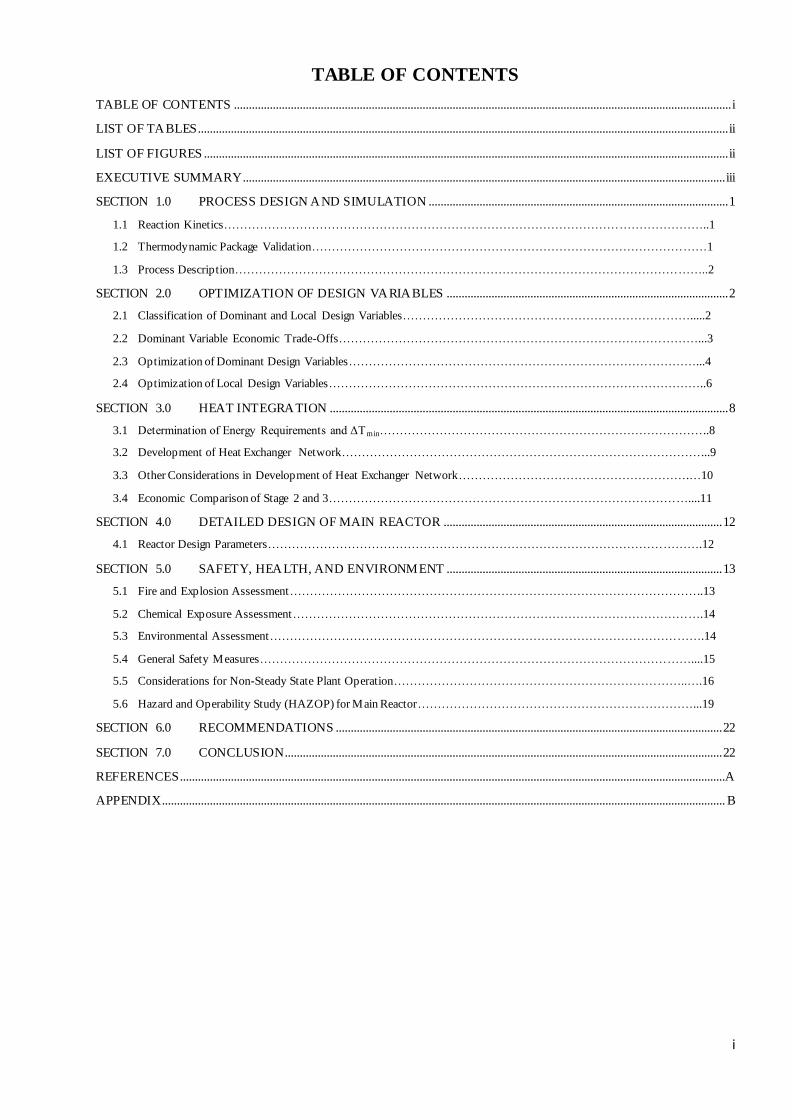
Figure 1 shows that the PR model
results in data closest to experimental values for
the benzene-cumene system in Column 2,
indicating higher accuracy for approximat ion of
real conditions. Similar results were obtained
from the other pairs of propylene-benzene and
cumene-DIPB. This result also corresponds to
Carlson’s recommendation which indicates that
PR or SRK is the most suitable one for modeling
a non-polar real mixture [3]. Therefore, the PR
model was chosen as the basis used in HYSYS
simulation.
Figure 1: Temperature vs benzene fraction for saturated liquid and gas
phase of benzene-cumene system

2
1.3 Process Description
Fresh propylene consisting of 95 mol% propylene and 5 mol% propane stored as pressurized liquid is mixed
with the benzene stream, which consists of pure and recycled benzene. The liquid mixture at high pressure and low
temperature (37.43°C, 31.95 bar) is heated up by heat exchangers (E-100, E-101) and 1 heater (E-102). Subsequently, it
is divided into 2 streams that are vaporized by heat exchanger (E-103) and vaporizer (E-104) respectively. The
saturated vapor streams are then combined and heated by another 2 heat exchangers (E-105, E-106) and furnace (H-
100) to achieve the desired reactor feed inlet temperature of 300°C and pressure of 30 bar.
The reactant stream enters the vertical, mult i-tubular packed bed reactor (R-100) from the top and exits at the
bottom. A catalyzed, exothermic reaction occurs that achieves a high propylene conversion rate. As it enters the reactor,
the process stream is initially heated up by the circulat ing shell-side flu id (Dowtherm A) to kick-start the reaction, after
which the process stream temperature rises due to heat produced from the exothermic reaction. The temperature is
controlled to be below 400°C to prevent catalyst deactivation by subsequent heat removal by Dowtherm A, which is
circulated co-currently with the process stream at a high flow rate. The heated Dowtherm A that exits the reactor is
used to generate high pressure steam by heating up boiler feed water in an external bo iler (E-107). The cooled
Dowtherm A is then returned to the reactor shell at the desired temperature.
The product stream from the reactor is cooled by the feed-effluent heat exchanger (FEHE, E-106) and divided
into 2 streams that are cooled to saturated liquid by heat exchanger (E-105) and 1 condenser (E-108) respectively. The
saturated liquid streams are combined and further cooled by 2 heat exchangers (E-109, E-103) consecutively. The
pressure of the process stream is then reduced by a pressure reducing valve before it is fed as a liquid to the 3
distillation columns for separation.
The first column (T-100) distills over propylene and propane gas as top products which are flared, while the
bottom stream in liquid phase is mixed with the transalkylator outlet stream. This mixed stream is then cooled by heat
exchanger (E-100) before being fed to the second distillation column (T -101). The distillate of the second column (T-
101) that is rich in benzene is split into a benzene recycle stream that rejoins the fresh benzene as feed to the main
reactor and a benzene feed stream to the transalky lator, which consists of a small fract ion of the total benzene d istillate.
The bottom product is fed to the third column (T-102) after being cooled by cooler (E-114). The cumene product with
purity of 99.9 mol% and less than 0.03 mol% of DIPB is recovered as the distillate in T-102, and subsequently cooled
by cooler (E-117) before being stored. Meanwhile, the bottom DIPB product is mixed with the benzene stream from the
second column (T-101) as mentioned previously.
The benzene-DIPB mixture is then heated by the main reactor e ffluent in heat exchanger (E-109) and a heater
(E-118) before being fed to a single tube, adiabatic transalkylator (R-101). In R-101, a mildly endothermic,
transalkylation reaction produces a product stream rich in cumene which is cooled by the reactant stream in heat
exchanger (E-101). This stream is mixed with the bottom product of the first column (T -100) as mentioned above, thus
completing the DIPB recycle loop.
SECTION 2.0 OPTIMIZATION OF DESIGN VARIABLES
2.1 Classification of Dominant and Local Design Variables
The identification of plant-wide degrees of freedom allowed the listing of different design variables as shown
in Tab le 1 below. The economic impact o f d ifferent variables was studied by obtaining plots for profit, J versus the
respective variables for Stage 2 of the plant design. Dominant variab les were classified as those which caused a change
in J that was greater than $0.05 mil upon its variation, whereas local variab les caused a change of less than $0.01 mil.

3
Figure 2: Profit vs main reactor temperature
For all studies, the production rate was maintained at 200 000 tons per annum with ±1% tolerance and the benzene to
propylene ratio (B/P) at the reactor feed stream was adjusted by controlling the total amount of benzene in the reactor
feed mixture.
Table 1: List of plant-wide design variables and respective categorization as dominant/local
Design variables Category: Dominant/local Impact on J
Main reactor pressure (Main P) Dominant
Change of J
> $0.05 millions
Main reactor temperature (Main T) Dominant
Benzene to Propylene ratio for feed to reactor (B/P ratio) Dominant
Main reactor volume (Main V) Dominant
Main reactor length to diameter ratio (L/D ratio) Local
Change of J
< $0.01millions
Column operating pressure Local
Column impurity specifications Local
Feed stage location of columns Local
Transalkylator temperature (Trans T) Local
Transalkylator pressure (Trans P) Local
Transalkylator volume (Trans V) Local
Transalkylator L/D ratio Local
Benzene to DIPB ratio (B/DIPB ratio) Local
2.2 Dominant Variable Economic Trade-Offs
The engineering design trade-offs for each dominant variab le are shown in Figure 2-5 below. Plant profit is
calculated by: Profit per annum, J ($/yr) = Revenue – Raw material costs – TAC + Steam credit………………… (4)
Total annualized cost, TAC ($/yr) = (Total capital cost/3 + Total energy cost per year); 3-year payback period… (5)
Figure 2 shows the impact of main reactor pressure on J. For this study, the main reactor temperature,
volume and total benzene in reactor feed mixture we re set at 320oC, 50m
3 and 380 kgmole/hr respectively. As pressure
was increased from 25 to 32bar, the total conversion of propylene in main reactor increased from 92% to 98%, while
cumene selectivity remained high and almost constant at 96%. This caused the raw material cost to decrease from
$58.37 mil to $57.66 mil. The total annualized cost (TAC) increased, but in a smaller extent from $5.98 mil to $6.15
mil, mainly due to increase in the capital and energy costs of the furnace and BFW heat exchanger. The decrease of raw
material cost outweighed the increase in TAC, resulting in increased J.
Figure 3 shows the impact of main reactor temperature on J. For this study, the main reactor pressure,
volume and total benzene in reactor feed mixture were set at 30 bar, 50 m3
and 380 kgmole/hr respectively. As
temperature increased from 300 to 330oC, total propylene conversion and cumene single-pass selectivity remained high
Figure 3: Profit vs main reactor pressure

4
and almost unchanged, both at around 97%, because the reactor maximum temperature was maintained around 399-
400oC by adjusting the shell-side fluid in let temperature. Hence, raw material cost remained almost unchanged at
$57.70 mil. However, TAC increased from $59.02 mil to $63.18 mil due to main ly due to increase in capital and energy
costs of the furnace and BFW heat exchanger. Therefore, J decreased by approximately $0.3 mil over the entire range
of study.
Figure 4 shows the impact of total benzene in
reactor feed mixture on J. For this study, the main reactor
temperature, p ressure and volume were set at 300oC, 30 bar, and
50 m3
respectively. As total benzene in the feed mixture
increased from 300 to 380 kgmole/hr (B/P ratio increased from
1.12 to 1.55), total conversion of propylene increased from 95%
and slowly achieved a maximum value of 97%. Init ially, raw
material cost decreased from $58.06 mil due to increased
conversion, but eventually achieved a min imum value of $57.76
mil at maximum conversion. Cumene single-pass selectivity
also increased from 94% to 96% as increasing excess benzene
consumed propylene in the main reaction. Meanwhile, TAC
increased linearly from $5.64 mil to $5.87 mil, mainly due to increased capital and energy costs of the vaporizer, FEHE
and benzene recycle line. The J value was dominated by decrease of raw material cost at first, but this was eventually
outweighed by the increased TAC, causing J to first increase and then decrease.
Figure 5 shows the impact of main reactor volume
on J. For th is study, the main reactor temperature, pressure and
total benzene in mixture were set at 300oC, 30 bar and 340
kgmole/hr. Reactor tube length was set at 15 m in order to
achieve the aspect ratio range of 5-10. As volume increased
from 35 m3 to 70 m
3 by increasing the number of tubes, total
conversion of propylene gradually increased from 93% to a
maximum of 98% due to increased residence time, whereas
cumene single-pass selectivity remained high and almost
unchanged at 96%. This was reflected by raw material cost that
gradually decreased from $58.22mil to a constant value of
$57.57 mil. Meanwhile, TAC increased almost linearly from
$57.48 mil to $64.23 mil due to increase in reactor capital cost and furnace capital and energy cost. Hence, J was first
increased by savings in raw material cost before decreasing due to increased TAC.
2.3 Optimization of Dominant Design Variables
The dominant variables were optimized first as they have the greates t effect on plant economics. Their
resulting optimal values formed the base case for subsequent optimization of local design variables
Figure 4: Profit vs total benzene
Figure 5: Profit vs main reactor volume

5
Figure 6: Profit vs main reactor volume at different pressures
45.50
45.60
45.70
45.80
45.90
46.00
46.10
35 45 55 65 75
J, $
Mil
lio
ns
Main reactor volume, V (m3)
J vs main reactor volume at different pressures
27 bar 29 bar 30 bar
Reactor volume
(m3)
Figure 7 Profit vs total benzene at different reactor volumes
(kgmole/hr)
Figure 6 shows the optimization main
reactor pressure. The reactor temperature and total
benzene in feed mixture we re set at 300oC and 340
kgmole/hr. Cumene single-pass selectivity remained
high at around 96%. For fixed reactor volumes of 40 m3
to 57 m3, J increased with increased pressure due to
increased propylene conversion and decreased raw
material cost. However, as maximum conversion was
approached, the raw material cost savings gradually
became constant. Further increase in pressure would
result in higher J, but incurs higher risk of reactor
overpressure, fire and explosion. Therefore, 30 bar was
chosen as the optimal pressure.
Figure 7 shows the optimization of main
reactor feed temperature. The reactor p ressure and total
benzene in feed mixture were set at 30 bar and 340
kgmole/hr. Cumene single-pass selectivity remained
high at around 96%. At smaller volumes of 30 m3 to 37
m3 that were constrained by shorter residence times ,
higher temperatures resulted in higher J, since raw
material cost savings due to increased convers ion
dominated over the increase in energy costs. However,
when residence time was further increased with volume,
maximum conversions could be achieved at lower
temperatures, thus saving on energy costs without
sacrificing raw material cost savings. Hence, the lower
limit of the catalyst operating range, 300oC was chosen as the optimal temperature.
Based on the optimal temperature, 300°C and
pressure, 30 bar, that were limited due to react ion
constraints, the total benzene in the reactor feed
mixture was varied for different reactor volumes. From
the previous studies shown above, it was known that
optimum conditions were approximately 50 m3 for
reactor volume and 340 kgmole/hr for total benzene
flow rate. Hence, the reactor volume and total benzene
flow rate were varied at smaller intervals for greater
accuracy. Figure 8 shows the three determining plots
that gave the optimal parameters for reactor volume: 51
m3 (746 tubes at 15 m tube length) and total benzene:
335 kgmole/hr (B/P ratio of 1.36).
45.70
45.80
45.90
46.00
46.10
46.20
46.30
25 35 45 55 65
J, $
Mil
lio
ns
Main reactor volume, V (m3)
J vs main reactor volume at different temperatures
T 300 T 310 T 320
Figure 8: Profit vs reactor volume at different temperatures

6
2.4 Optimization of Local Design Variables
2.4.1 Optimization of columns
All 3 columns were designed using the short-cut distillat ion column in HYSYS with the reflux ratio specified
as 1.5 times of minimum reflux and the total number of trays as 3 t imes of the min imum. Column d iameters we re sized
according to Fair’s method, whereas other tray, sieve and weir sizing parameters were taken from industrial ru les of
thumb. Column purity specificat ion, operating pressure and feed position were variables that were considered in the
column design.
The effect of purity specifications for both the product streams of column 1 (T-100) and the top stream of
column 2 (T-101) were studied together since they are consecutively linked. The specifications for the bottom stream of
T-101and the top stream of column 3 (T -102) were already set to meet the cumene product requirements and cannot be
further optimized. Hence, actual variables were the benzene impurity fraction in the d istillate and the propane impurity
fraction in the bottoms for T-100, the cumene impurity fraction in the distillate for T-101, and the cumene impurity
fraction in the bottoms for T-102.
Figure 9: Profit vs column 2 (T-101) cumene fractions in distillate stream
Figure 9 shows J vs. cumene impurity specificat ions in T-101 for various specification combinations of T-100.
For T-100, increased propane fraction at the bottom stream brings down with it more unconsumed propylene . This
small amount of propylene is eventually recycled back to the main reactor and results in savings to raw material cost.
However, more inert propane also accumulates in the system and increases heating costs. From this trade -off, an
optimal value of 0.025 for the propane impurity fraction was obtained. The amount of benzene in the distillate o f T-100
should be minimized to prevent loss of raw material. However, fo r increased benzene fraction in the distillate, the
column can be operated at lower pressure which in turn reduces T-100 reboiler heat load. Thus, there is a tradeoff
between benzene loss and reboiler duty, resulting in an optimal benzene impurity fraction of 0.01.
For all T-100 combinations, a more stringent cumene impurity specification for T -101 resulted in higher J.
Less cumene in the d istillate stream of T -101 prevents benzene from stripping down to the bottom product and thus
affecting the purity of the cumene product in T-102. Furthermore, the d istillate stream of T -101 is recycled back to the
main reactor and also diverted to the transalkylator. A higher cumene fraction in the feed stream to the reactor increases
the vaporizer and T-100 reboiler duty. Thus, the cumene impurity fraction of T-101 was set at a stringent value of
0.001.
In T-102, the cumene fraction at the bottom can be slightly relaxed to reduce column height. Increased cumene
impurity at the bottom brings down with it more DIPB that is subsequently channeled to the transalkylator. More
45.50
45.60
45.70
45.80
45.90
46.00
46.10
46.20
0 0.01 0.02 0.03 0.04 0.05 0.06 0.07 0.08 0.09 0.1
J ,(
$ M
illio
ns/
yr)
T-101 Condenser Cumene Fraction
J vs T-101 Distillate - Cumene Impurities
T-100 Prop Frac 0.001;Ben Frac 0.001 T-100 Prop Frac 0.01;Ben Frac 0.001
T-100 Prop Frac 0.025;Ben Frac 0.001 T-100 Prop Frac 0.001;Ben Frac 0.1
T-100 Prop Frac 0.01;Ben Frac 0.1 T-100 Prop Frac 0.025;Ben Frac 0.1

7
Figure 10: Profit vs transalkylator volume at different B/DIPB
ratios
Figure 11: Profit vs transalkylator pressure at different
temperatures
J vs. transalkylator pressure at different
temperatures (at 2.25m3 and B/DIPB ratio
2.0)
cumene feed to the transalkylator would typically decrease the equilibrium conversion, but in this case the effect is
offset by increasing the amount of benzene that is entering the transalkylator from T -101. This ultimately results in
more DIPB converted back to cumene and savings in raw material costs. However, increasing the cumene fraction in
the bottom stream increases condenser duty as more energy is needed to condense more cumene vapor. This trade-off
results in a minimum TAC corresponding to an optimal cumene fraction of 0.01.
The operating pressure of T-101 and T-102 were specified at low pressures in the range of 1.5-2.5 bar to
achieve easier separation and to min imize reboiler duty. The optimum pressure of T-100 was found to be at a higher
pressure of 7.5 bar as the benefit from reduced reboiler duty was offset by benzene loss in the distillate stream. The
feed position for T-100, T-101 and T-102 are at the 6th
, 10th
, and 23rd
plate respectively, each corresponding to
minimum reboiler duty in their respective columns.
2.4.2 Optimization of transalkylator
Local variables identified for the transalkylator that was operated in liquid phase were operating temperature,
pressure, volume, and feed B/DIPB ratio. The optimizat ion of these variables is summarized in Figures 10 and 11
below.
Figure 10 shows the optimizat ion of transalky lator pressure and temperature with respect to J. Increased
pressure had little effect on equilibrium conversion but incurred higher pump capital and energy costs. Meanwhile,
equilibrium conversion was increased by higher temperatures, which resulted in raw material costs savings and reduced
capital and energy costs for the condenser of column 2 and the reboiler of column 3. Th is outweighed the increased in
heating costs, leading to increased J at h igher temperatures. Optimal operating conditions were chosen to be 30 bar and
238oC. Pressures lower than 30 bar resulted in viscosity calculation issues as the reactants start to vaporize. The
temperature was set slightly below 240oC to avoid catalyst deactivation.
Figure 11 shows the optimizat ion of transalky lator volume and different B/DIPB ratio s with respect to J.
This study was conducted at the optimal pressure and temperature obtained earlier. Decreased B/DIPB rat io and
increased volume of up to 2.75 m3 caused increased equilibrium conversion, which resulted in raw material costs
savings and reduced capital and energy costs for the condenser of column 2 and the reboiler of co lumn 3 as mentioned

8
above. The B/DIPB rat io has to be at least 2.0 to prevent problems due to sticky flow. Optimal B/DIPB ratio and
volume was chosen to be 2.0 and 2.75 m3 respectively for the highest J. Further increase in volume would only take up
space and increase the reactor capital cost as equilibrium conversion reaches a maximum at 88%.
2.4.3 Optimization of length-to-diameter aspect ratios
Optimization of the main reactor and transalky lator L/D ratio share the same approach. Using fixed optimal
volumes, the d iameter of the reactor was varied and the corresponding tube length that achieved the desired volume
was calculated. The results showed that a longer design (higher L/D ratio) resulted in lower profit due to increased
capital cost of the reactor. For the main reactor, an L/D rat io of 5-10 [4] for efficient heat transfer to approximate shell-
and-tube heat exchanger was used as a standard, whereas for the transalkylator, typical aspect ratios for single-tube
plug flow reactors based on literature were in the range of 1-5 [5]. Hence, for both the main reactor and transalky lator,
the minimum L/D ratios for standard industrial manufacture were chosen as approximately 5 and 1 respectively.
SECTION 3.0 HEAT INTEGRATION
Heat integration involved several steps with the aim to ach ieve minimum energy requirement (MER) with the least
capital cost incurred. Started with determining MER, we proceeded to determine the minimum t emperature difference
(ΔTmin), pinch temperatures and matching streams with considerations, then finally reducing the number of heat
exchangers (HE) to achieve the final heat exchanger network (HEN) design.
3.1 Determination of Energy Requirements and ΔTmin
3.1.1 MER determination
MER was calculated prior to the design of HEN. Selection and data extraction of major process streams were
essential steps for MER calculat ion. MER value of 1.68 MW of excess heat available was obtained by the difference
between the enthalpy of hot and cold streams [6].
3.1.2 ΔTmin determination
Energy Targeting: QHmin and QCmin of the process for a given ΔTmin were considered as the energy targets. A higher
ΔTmin will incur higher energy costs as streams that are unable to be matched will need to be heated or cooled by
utilities. Energy requirements affect the operating cost.
Area Targeting: On the other hand, a lower ΔT min will result in h igher heat exchanger cap ital costs due to a smaller
temperature d ifference driving fo rce that would require greater network area to achieve the desired heat exchange duty.
This area is to the sum of all heat exchanger areas of each segment based on heat capacity with all heat availab le
utilized and the calculat ion was made using the Bath’s formula [7] as shown in equation 6 below, where Q is the
amount of energy transferred at n-th interval and U is the heat transfer coefficient at n-th interval. As ΔTmin increases
from 10°C to 50°C, the area decreases constantly from 837.5 to 484.9 m2. The size of heat exchangers, heaters and
coolers affect the capital cost.
∑
(
)
……………………………...…………….. (6)

9
0
50
100
150
200
250
300
350
400
0.00 20.00 40.00 60.00 80.00Te
mp
era
ture
(°C
) Enthalpy ( x109 J/hr)
Temperature vs Enthalpy
ColdHot
QH, min = 18.88
Figure 12: Composite curve of hot and cold streams
QC, min
= 12.88
There was a trade-off between utility requirements and heat exchanger area for vary ing ΔTmin. To compare
the effect of operating vs. capital costs, a plot of TAC which totaled the operating and capital costs against ΔTmin was
plotted as shown in Figure 12. From the plot, we can see that from 10°C to 20°C of ΔTmin, TAC decreased as energy
saving outweighed increased capital cost. Beyond 20°C, capital cost outweighed utility savings and TAC increased.
The optimal ΔTmin of 20°C corresponding to the lowest TAC of $1.28 mil/yr was obtained before proceeding to
exchanger network (HEN) design.
3.1.3 Pinch Temperature Analysis
Hot and cold p inch temperatures of 183.7ºC and 163.7ºC were determined using HYSYS Energy Analyzer.
The pinch temperature(s), minimum hot utility requirement (QHmin) and min imum co ld utility requirement (QCmin ) were
further verified manually using the Temperature Interval (TI) and Composite Curve (CC) method.
Figure 13 shows the Composite Curves that consist of temperature-enthalpy profiles of heat availability ("hot
composite curve") and heat demands (the "cold composite curve"). The minimum energy target for the process was
achieved by overlapping the hot and cold composite curves, separating them by ΔT min of 20ºC. This overlap shows the
maximum process heat recovery possible, ind icating that the remaining heating and cooling needs are QHmin of
18.88x10⁹ J/hr (5254 MW) and QCmin of 12.88x10
9 J/h (3579MW).
3.2 Development of Heat Exchanger Network
The problem was div ided at the pinch; each part designed separately starting at the pinch and moving away.
For pairing above pinch, CPC ≥ CP
H and for below pinch, CP
H ≤ CPC. By maximizing all exchanger loads, supplying
external heating above the pinch, and external cooling belowthe pinch, the HEN design was completed as shown
below in Figure 14.
1.26
1.28
1.30
1.32
1.34
1.36
1.38
1.40
1.42
1.44
1.46
0 10 20 30 40 50
TAC
($ M
il /y
r)
∆Tmin (ºC)
TAC vs ∆Tmin
Figure 13: Total annualized cost vs minimum temperature
difference
10
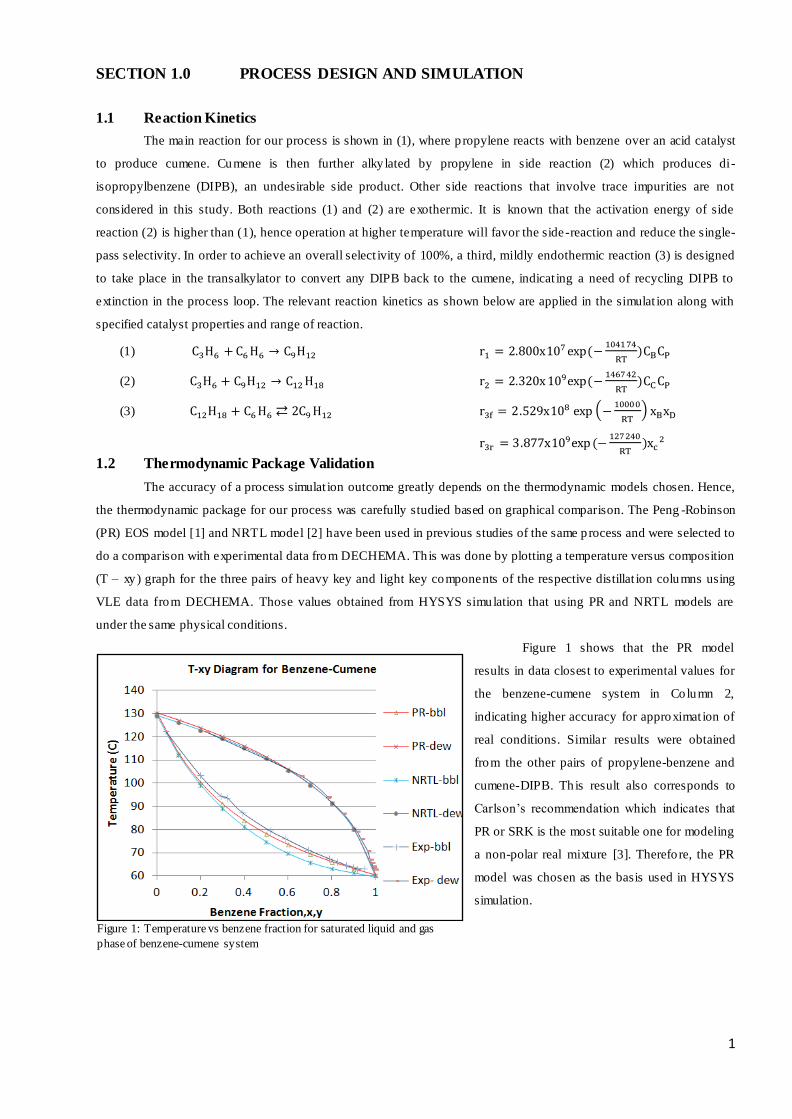
Figure 14: Heat exchanger network design to meet minimum energy requirements
3.3 Other Considerations in Development of Heat Exchanger Network
3.3.1 Stream matching considerations
Forbidden matches [8]: The condenser and reboiler streams were not allowed to be matched in heat exchange due to
reasons of operability for start-up and control. These resulted in coolers and heaters that needed to be added to the 6 of
the streams (C1 Vap to 26, C1 Liq to 27, C2 Vap to 31, C2 Liq to 32, C3 Vap to 35 and C3 Liq to 36) from the columns
[9]. Imposing such criteria on our design affected the energy recovery of the network and resulted in an energy penalty
of 5.692 MW from the existing MER system [6].
Stream 8 to 17 was segmented into 3 sections (8 to 11, 11 to 14, and 14 to 17): From source temperature of 36.8ºC to
final target temperature of 300ºC, there was phase change involved for streams 11 to 14, as such there is a large
variation in heat capacity across the phase change. By dividing this stream into 3 segments, a more accurate CP was
achieved compared to taking the average CP, resulting in a more accurate HEN designed. ΔTmin violation was better
avoided and calculation of heat transfer coefficients was simplified.
Stream split of 11 to 14 between 129.2°C to 204.1°C: The stream split was necessary to ensure saturated condition in
all outlet streams. [10]
3.3.2 Minimizing number of heat exchanger units
Calculated Nmin=16, and the orig inal HEN Nact=23 indicated there are 7 independent heat paths. These paths
were then broken by transferring duty from s mall cooler or heater to nearby heat exchanger, further reducing the
number of heater and cooler required for the system. The network temperatures were checked whenever a path was
broken to ensure no ∆Tmin v iolations. The ∆Tmin for the Final HEN Design (Figure 15) after earlier considerations
and minimization of is around 25 ºC.
183.7 101.5 40.7 2 0.132
0.132
183.7 127.9 68.8 32 1.915
1.915
183.7 168.1 167.6 6769 3.385
18 to 19 1.404
27 0.620 339.5 316.7 183.7
19 to 22 65 2.546 316.7 277.4 183.7
22 to 25 26 2.442 277.4 268.3 221.6 183.7 158.2 155.1 26 0.745
0.08128 to 30 24 0.156 190.2 183.7 140.8 24 1.023
32 to 34 19 0.731 221.2 183.7 174.3 19 0.182
42 to 44 2 0.087 239.1 183.7 178.4 148.6 2 0.055
0.047129.2 36.8 21 1.981
8 to 11 163.7x1= 30.0 y1= 21.0 132.1 1.981
11 to 14 54 2.190 204.1 181.7 200.2 0.156 x2= 20.0 163.7 y2= 19.0 109.8 129.2 54 1.868
1.216 184.8 0.731 x3= 4.1 y3= 14.1 1.023150.8
0.087 0.18214 to 17 22 2.157 300.0 231.7 204.1 163.7
1.536 0.62040 to 41 2 0.117 238.0 163.7 158.4 2 0.008
0.117 0.00834 0.987 192.8 163.7
4265 3.067 221.2 220.5 163.7
2.829
1763 3.317 235.7 235.3 233.8 163.7
0.772 2.546
M CP
(kW/C)
H
(MW)Stream
M CP
(kW/C
H
(MW)
167.8
C1 Liq to
27
C2 Liq to
32
C3 Liq to
36
C1 Vap to
26
0.664
C2 Vap to
31
C3 Vap to
35
0.987
168.9
220.6
0.238
sa
9
5
1
2
3
4
51
sa
0
1
2
4
3
7
8
6
2
3
2
1
3
4

11
Figure 15: Finalized heat exchanger network
C1 Liq to 27 2.2 0.132 101.5 40.7
0.132C2 Liq to 32 32.4 1.915 127.9 68.8
1.915C3 Liq to 36 6769.3 3.385 168.1 167.6
3.38518 to 19 27.3 0.620 339.5 316.71
y1= 0.0
19 to 22 64.8 2.546 316.7 277.4
y2= 0.0
22 to 25 26.0 3.187 277.4 272.6 155.1
28 to 30 23.9 1.179 190.2 140.8
32 to 34 19.4 0.912 221.2 174.3
0.91242 to 44 1.6 0.143 239.1 148.6
8 to 11 21.4 1.981 129.2 92 36.8
x1= 40.8 0.660 0.143 1.17911 to 14 54.1 4.058 204.1 129.2
3.1 x2= 13.3
0.99714 to 17 22.5 2.157 300.0 272.4 204.1
0.620 1.53640 to 41 1.6 0.125 238.0 158.4
0.125C1 Vap to 26 33.9 0.987 192.8 163.7
0.987C2 Vap to 31 4265.0 3.067 221.2 220.5
3.067C3 Vap to 35 1762.9 3.317 235.7 233.8
3.317
1.009
98.4
StreamM CP
(kW/C)
H
(MW)
5
4
62
3
2
2
3.186
1
1
3
4
5
3
4
5
1
3.4 Economic Comparison of Stage 2 and 3
The effect of heat integration was evaluated by economic comparison as shown in Table 2 below.
Table 2: Economic comparison between stage 2 and 3
After heat integration, steam credit was reduced by 26.4% as heat was recovered directly and less steam was
produced. Energy costs were reduced by 44.5% due to increased energy efficiency. Total capital cost increased by
1.93% mainly due the addition of more heat exchangers. Since savings in energy costs far outweighed the additional
capital costs incurred, TAC was reduced by 26.5% and J was increased by 2.51% ($1.16 mil).
Criteria Stage 2 Stage 3 % increase / decrease
Raw material cost ($/yr) 57,780,965
Product sales ($/yr) 108,178,200
Conversion (%) 97.38
Selectivity (%) 100% overall selectivity due to DIPB recycle to extinction
Energy consumption per kg product (kJ/kg) 0.0191 0.0106 -44.47
Steam credit ($/yr) 1,861,230 1,369,356 -26.43
Total energy cost ($/yr) 1,952,721 748,619 -61.66
Total capital cost ($) 7,202,558 7,341,905 +1.93
Total annualized cost, TAC ($/yr) 6,214,803 4,565,277 -26.54
Profit, J ($/yr) 46,043,661 47,201,314 +2.51

12
8.70546
0.39379
87.87644
45%
24%
6%1%
24%
Stage 3 Capital
Reactor
Columns
Pumps
Transalkylator
Heat Exchangers,Heaters & Coolers
45%
25%
6%1%
23%
Stage 2 CapitalContribution of Various Unit Operations to Total Capital Cost for Stage 2 and 3
$7,202,557/yr $7,341,905/yr
Stage 2 Stage 3
Figure 16: Contribution of various unit operations to total capital cost for stage 2 & 3
49%
1%
50%
Stage 2 Energy
88%
1%11%
Stage 2 Energy
Columns
Pumps
HeatExchangers,
Heaters &Coolers
Contribution of Various Unit Operations to Total Energy Cost for Stage 2 and 3
$3,813,950/yr $2,117,975/yr
Stage 2 Stage 3
Figure 17 : Contribution of various unit operations to total energy cost for stage 2 & 3
Figure 16 shows that
the contribution of heat exchangers
increased from 23% to 24% in the
total capital cost as the replacement
of from the original 2 coolers and 1
heater with 5 heat exchangers was
more costly.
Figure 17 shows that
the contribution of heat exchangers
in total energy cost dropped from
50% to 11%. Such great savings
were mainly due to increased heat
efficiency of the new HEN design.
In Stage 3, columns became the
highest in energy consumption as
most of the reboilers were still
using high pressure steam for
operation.
SECTION 4.0 DETAILED DESIGN OF MAIN REACTOR
4.1 Reactor Design Parameters
Table 3: Justifications for choice reactor design parameters
Design choice Description
Reactor type A multi-tubular, packed bed reactor with cooling was chosen to approximate a shell-and-tube heat
exchanger design for efficient heat removal.
Tube diameter
Smaller tube diameters provide larger surface area for heat transfer but increase pressure drop an d
capital cost for a fixed reactor volume. 3 inch (7.62 x 10⁻²
m) outer diameter tubes were chosen to
optimize capital cost, pressure drop and heat removal.
Pitch layout Triangular pitch layout was chosen as it can accommodate more tubes than a square pattern. This
layout also produces high turbulence and hence a higher overall heat transfer coefficient. [11]
Configuration The reactor was placed vertically to facilitate loading and removal of solid catalysts in the packed bed.
Length-to-
diameter aspect
ratio
An aspect ratio of 4.85 (L=15.00 m, D=3.09 m) was chosen to approximate typical heat exchanger
aspect ratios of 5-10. Further increase in length was constrained by standard manufacturing limits and
stability of vertical configuration. [5]
Baffle cut and
spacing
Standard segmental baffles with 25% baffle cut were chosen. Optimum baffle spacing of 0.625 m
(approximately one-fifth of the shell diameter) was chosen to promote cross -flow between shell-fluid
and process tubes while ensuring the maximum allowable pressure drop of 300 kPa (0.1 times of
operating pressure) was not exceeded. [12]
Fluid flow
Co-current flow between the process stream and shell side fluid (Dowtherm A) was chosen as
Dowtherm is initially used as a heating medium to kick-start the reaction, after which it acts as a
cooling medium to remove heat from the exothermic reaction.
Impingement
The area about the shell inlet nozzle was enlarged to reduce Dowtherm velocity and resulting
impingement of tubes. A flared shell inlet nozzle and an impingement plate were also used to further
reduce impingement effects. [12]

13
Table 4: General process flow conditions for the main reactor
SECTION 5.0 SAFETY, HEALTH, AND ENVIRONMENT
5.1 Fire and Explosion Assessment
The Dow Fire and Explosion Index (F&EI) [14] was used to gauge the risk potential of a fire or exp losion
event occurring in several major process units as shown in Table 5 below.
Table 5: F&EI values of main process units with corresponding degree of hazard and main risk factor
Process Unit F&EI Degree of
Hazard Main risk factor
Main reactor 168 Severe Exothermic reaction involving flammable vapors (400°C, 30 bar)
Propylene
storage tank 156 Heavy Storage of liquefied flammable gas under compression (25°C, 15 bar)
Furnace 135 Heavy Fired heating that is potential ignition source (300°C, 30 bar)
Benzene storage
tank 106 Intermediate Storage of flammable liquid at atmospheric conditions (25°C, 1 bar)
As shown in Table 5, the main reactor has the highest fire or explosion risk potential and is further discussed
using the Hazard and Operab ility Study (HAZOP) in Sect ion 5.6. Using bow-tie risk analysis for the top event of
reactor cooling loss, the safeguards implemented reduced the estimated frequency of a dangerous reaction runaway to
only once in 1481 years, thus minimizing the risk of such an occurrence. The propylene storage facility poses a heavy
hazard as leaked propylene may form a vapor cloud that risks ignition by open flames or sparks. Therefore, efficient
ventilation is necessary to dissipate the vapor concentration to below flammable levels. The furnace is a potential
ignition source for flammable mixtures. Hence, there needs to be adequate spacing between the furnace and other
process units, especially the storage tanks where large quantities of chemicals are kept. Ign ition sources should be
eliminated in classified hazardous areas where flammable materials are stored. Compared to the other process units, the
benzene storage facility has the lowest risk potential as it exists as a liquid at atmospheric conditions, and leakages can
be contained more effect ively. Overall, this quick analysis highlights a few major risk factors such as elevated process
conditions, inherent chemical properties, quantity of flammable material, and distance of ignit ion point to possible leak
sources.
Flow Condition Value
Process stream inlet temperature 300.0 °C (573.15 K)
Process stream outlet temperature 339.2 °C (612.35 K)
Shell-side fluid inlet temperature 330.2 °C (603.35 K)
Shell-side fluid outlet temperature 335.0 °C (608.15 K)
Tube-side pressure drop 8.51 x 10³ Pa
Shell-side baffled pressure drop 283.98 x 10³ Pa
Heat transfer area 2678.77 m2
Heat duty 5580 x 103 W
Tube side heat-transfer coefficient 70.18 W/(m2.K)
Shell side heat-transfer coefficient 1214.46 W/(m2.K)
Overall heat-transfer coefficient 13.34 W/(m2.K)
Velocity in tubes 6.55 x 10⁻²
m/s
Nominal Re in tubes 13460.59 (Turbulent)
Velocity in shell 1.58 m/s
Nominal Re in shell 386967.93 (Turbulent)
Calculation methods
Tube-side pressure drop: Ergun’s equation for packed
beds
Tube-side heat transfer coefficient: Gnielinski’s
correlation [13] fo r packed beds to calculate Nu for
turbulent flow reg ime. Heat transfer coefficient
determined from obtained Nu.
Shell-side pressure drop and heat-transfer coefficient:
Kern’s method [4]
Overall heat transfer coefficient: Equation 12.2 of
Chemical Engineering Design, 5th
edition [4]

14
5.2 Chemical Exposure Assessment
The general hazards of chemicals involved in cumene production, all of which are hydrocarbons, are extracted
from their Material Safety Data Sheets and summarized below.
Table 6: General hazards of raw materials and products for cumene manufacture
Chemical &
Formula
Name
*Flammability
Rating
**OEL (ppm)
General Hazards 8hrs
(TWA)
15mins
(STEL)
Benzene
(C6H6) 3 1 5
Carcinogenic effect; Toxic to blood, bone marrow, central
nervous system (CNS), liver and urinary system
Propylene
(C3H6) 4 500 N/A
As asphyxiant; May cause unconsciousness, nausea and
depression of all the senses
Propane
(C3H8) 4 1000 N/A
As asphyxiant; May cause damage to the nervous system,
heart and central nervous system
Cumene
(C9H12) 3 25 50 Toxic to lungs, the nervous system and mucous membranes
DIPB
(C12H18) 2 0.5 2.5
Vapors and liquid are irritating to eyes, respiratory tract and
mucous membrane; Cause headache and unconsciousness
*Based on NFPA 704 standards **Occupational Exposure Limits
Among the substances involved, benzene is the most hazardous to human health as it is a carcinogen. To
prevent toxic effects, Personal Protection Equipment (PPE) such as clean suits and masks are to be worn. For
asphyxiants such as propylene and propane, it is essential that workers obtain proper Permit -To-Work (PTW) before
entering confined spaces that may contain such gases. The PTW can only be issued after ensuring oxygen and toxic gas
levels in the confined space are within acceptable limits. If necessary, workers should be equipped with PPE such as
breathing apparatus and gas monitoring devices. The Dow Chemical Exposure Index (CEI) [15] was used to investigate
a few release scenarios and determine the largest airborne quantity resulting from such a release. The hazard distance
was subsequently determined based on the respective chemical Emergency Response Planning Guidelines (ERPG)
values. Generally, storage in vapor form or pressurized tank is the most significant in terms of CEI value and
corresponding hazard distance. Comparable to the fire and explosion hazard analysis, release scenarios involving the
main reactor and liquefied propylene storage tanks both resulted in the most severe hazards, with maximum hazard
distances of up to 10 km. This further enforces the need to put in p lace stringent preventive measures for these two
process units. In summary, personnel must ensure that all work being carried out in the chemical plant is in accordance
to Standard Operating Procedures (SOP) and in compliance with government rules and regulations to ensure the well-
being of workers.
5.3 Environmental Assessment
Two major environmental hazards that are of concern fo r our process are emissions due to flaring o f waste
gases and disposal of heated water. The composition of the waste gas stream is approximately 71.16% propane, 24.44%
propylene, and 4.40% benzene for a total mass flow rate of 768.83 kg/hr. Products of flaring mainly consist of carbon
dioxide and water vapor, with some amounts of carbon monoxide (CO), carbon particles (soot), unburned
hydrocarbons, and other partially altered hydrocarbons that are releas ed as emissions. Nitrogen oxides (NOx) are also
emitted due to oxidation of atmospheric nit rogen. Industrial emissions contribute to air pollution and need to be kept
below the published standards set by the Singapore National Environmental Agency (NEA) [16]. In order to reduce
emissions, part of the waste gas can be used to supplement natural gas burned in other process units such as the furnace.
This adds fuel credit to the overall process and reduces the amount of hydrocarbons that are flared. Flares sho uld be
operated at maximum combustion efficiency with min imum excess air. High combustion efficiencies of up to 98% are

15
able to reduce the amount of intermediate products formed from incomplete combustion, resulting in less than 2% of
hydrocarbon and CO emissions. Furthermore, usage of excess air is minimized to reduce the amount of NOx produced
and to optimize fuel consumption [17].
Next, the disposal of heated water is a major concern since water is used in large quantities to control the
temperature of processes in cumene production. The hot water
effluent consists of heated cooling water discharged from condensers
and coolers, and boiler b low down water. Direct discharge of heated
water into a public sewer or water course can potentially increase the
temperature of natural aquatic environments and cause harm to
marine life. According to NEA regulat ions, the temperature of trade
effluent needs to be cooled down to below 45°C before discharge
into any public sewer [16]. Cooling towers may be used to reduce the
temperature of heated water before discharge. There are many
categories of cooling towers, one of which is the natural draught
spray tower [18] as shown in Figure 18. In general, the environmental
impact of any chemical process needs to be carefully weighed and
minimized in order to maintain the health of our ecosystem and
achieve sustainable development in the long term.
5.4 General Safety Measures
General safety measures are very important in protecting personnel or the environment from hazardous events
that could stem from failure in equipment design, containment and storage, poor risk management systems o r
inexperience of employees.
5.4.1 Preventive measures
Design of equipment - Process and storage vessels were designed at higher set values than normal maximum operating
conditions, resulting in greater tolerance to disturbances in the system. For example, the reactor vessel thickness was
designed to withstand conditions up to 428°C and 35 bar, providing a tolerance range of 28°C and 5 bar above normal
operating conditions of 400°C and 30 bar. Additional allowances were also made for corrosion and wind -load for
vertically placed vessels.
Inventory minimization - The storage of raw materials and products should be optimized to reduce the availability of
materials for a fire, exp losion or chemical release, while ensuring sufficient supply for continuous plant operation. For
a fixed production rate, inventory minimizat ion should be balanced against the need for higher transportation frequency
by analyzing the associated cost and risk factors.
Equipment spacing - The plant layout of process units should take into consideration the radius of exposure resulting
from a hazardous event. Adequate spacing is needed to prevent escalation of a loss event due to a “domino effect” in
adjacent units and to provide access to emergency equipment. When limited by space constraints, other methods such
as fireproofing of steel structures, barricading control rooms and tanks, etc. may be employed [19].
Redundancy systems – Back-up equipment is provided for essential services such as the reactor cooling circulation
pump, remote control valves and emergency power supply. This great ly reduces the frequency of hazardous events due
to equipment failure.
Figure 18: Typical configuration of a natural draft
spray tower.

16
Maintenance & training – Regular maintenance of process control equipment is needed to increase their reliab ility.
Similarly, regular training of personnel ensures their compliance to standard operating procedures and raises awareness
of potential hazards.
5.4.2 Mitigation measures
Drainage and containment – In general, flammable liquids are stored in tanks that contain less than 15,000 gallons
(56.78 m3) to reduce the amount of flammable material that would be involved in a spill [20]. Dikes are designed to
direct the spill to an impounding basin. “De-inventory” or evacuation of liquid from leaking equipment to a secondary
storage tank can also be used to reduce and terminate leakage.
Dispersion – Process areas should be designed to have good natural or mechanical ventilat ion to prevent the
aggregation of flammable or toxic vapors that may lead to a hazardous event. Inert gases such as nitrogen or carbon
dioxide can be used to lower the concentration of oxygen needed for combustion. Vents can be directed to a flare
system that burns off the leaked gases.
Emergency response – Emergency response efforts should be focused on preventing further escalation and human
exposure. Mitigation systems such as automatic shutdown, water curtains, and foam may be implemented. Early
warning systems and evacuation plans that are regularly rehearsed can reduce the risk of public exposure. If human
exposures do occur, quick response and medical preparedness are crucial to prevent loss of lives.
5.5 Considerations for Non-Steady State Plant Operation
5.5.1 Dynamic operation
Dynamic operation contributes to more than 5 times of chemical industry accidents in comparison to normal
steady state operation, main ly due to operators unfamiliar with these infrequent activities and necessity of parameter
deviation [21]. Thus, general safety considerations for commissioning, normal start-up, shut-down, and emergency
shut-down activities are important and will be briefly described in this section.
5.5.2 Commissioning
Commissioning after complet ion of mechanical construction or after turnaround requires a functional check of
the auxiliary items, utilit ies, and equipment to ensure that process units will perform as intended. It starts with physical
inspection of auxiliary items such as pipe supports, insulation and protective coating of high temperature equipment to
ensure they are manufactured and assembled as specified, followed by verification of ut ility capacity to provide cooling
water, low pressure steam, Dowtherm A and boiler feed water for all heat transfer requirements. Subsequen tly,
commissioning of equipment is performed by running inert materials such as water and inert gas through the units to
examine operating limit stability and for possible leakage. The tested equipment and piping are subsequently cleaned
and dried by purging with compatible inert gas before start-up.
The final stage of commissioning focuses on safety precautions and control systems. Sensors, analyzers,
interlocks, alarms, control loops system as illustrated in Figure 19 fo r the main reactor as well as other units are
calibrated and inspected in this stage. Finally, a safety review checklist on all above items is performed. If all
requirements are met, the plant is ready for start-up, otherwise modifications are implemented as required and the
commissioning process is repeated.
5.5.3 Start-up
Normal start-up of the plant is performed after commissioning where reactant materials are brought into
service and monitored until processes run as normal by the end of start -up. During start-up, process parameters may
17
violate constraints valid for steady state operations. Thus, safeguarding elements such as interlocks are removed to
avoid unreasonable shut-downs which in turn increase the risk of start-up. A complex process network is broken down
in several unit operations for simplicity during start-up operation. As a general procedure, the distillation columns (T-
100, T-101, T-102) are started up first as they consist of reversible unit operations which can be operated on a stand -
alone basis without any continuous feed. Feed is charged into the 3 columns and brought to operating conditions under
total reflux until the units are ready to be put online [22].
Subsequently, for better control and inventory optimization, non-reversible unit operations, such as the main
reactor are started up next. The reactor is charged with benzene and cumene with is recycled over the entire process
section including the reactor feed system, reactor, and recovery system. The recovery of benzene is driven to
production state condition to ensure the recovery system can process the reactor effluent without significant process
upsets once propylene is introduced into the reactor. The temperature of the reactor is controlled by heat exchange with
Dowtherm A in the main reactor, whereas the reactor feed temperature is controlled by the pre-heater and furnace
before stable heat integration comes into place. Finally, the required amount of propylene in correct rat io to benzene is
supplied continuously into the reactor as soon as the benzene flow rate an d reactor feed temperature reach the target
values in steady state operations.
One concern during start-up is process runaway from expected trajectories. The dynamic behaviour of the
process system is a function of init ial p rocess conditions, process distu rbances and the trajectories of the manipulated
process variables. Thus, correct start-up conditions and sufficient control o f the manipulated variables must be verified.
Hazards present during the commissioning phase must be guarded against during start -up. In addition, the start-up
phase is characterized by peak physical and physiological stress for operating personnel as extra physical activit ies and
accurate observations are needed.
5.5.4 Shut-down
Shut-down is a sequence of steps used to bring a chemical process from operational to non-operational status
through a relatively short period of dynamic operation. In general the operational steps of shut -down include emptying,
purging, cleaning, cooling and verifying the safety of the non-operational environment for maintenance personnel to
work in.
As an initiation step, the fresh feed to the main reactor is shut off, the benzene recycled to the reactor from
separation units will gradually decreased and finally ceased. For separation units, the reflux flow rate is adjusted
proportionally with reduced feed flow rate. The reboiler is turned off first, followed by the condenser. All the liquid is
then drained out from the column and reflux d rum before being cooled to room temperature by flushing with inert
nitrogen [23].
The decontamination process following shut-down commonly encounters a problem, which is the
flammability and toxicity of process chemicals. As mention in Section 5.1, chemicals present in the process are all
flammable, which poses a hazard when a mixture of these chemicals and air come into contact with an ignition source.
Hence, the decontamination process has to avoid flammable range operation and leakage using proper purge systems.
Chemical inventory minimization is also considered during the shut-down process to make sure off-grade product is
produced in the least amount.
5.5.5 Emergency shut-down
Emergency shut-down differs from normal shutdown in that it is an unplanned shut-down caused by any of the
critical process parameters exceeding its operating window, unexpected utilit ies failure, or equipment failu re. These
deviations can potentially trigger catastrophic consequence such as a fire and explosion. Thus, safety interlock systems,

18
such as emergency auto shut-down of the reactors during high and unnoticeable temperatures are present to avoid
dangerous conditions.
Safety interlocks in the reactor section of this project is a combination of manual shutdown valves and
sophisticated computer systems that rely on signals from sensors and programmable logic controllers which control
valves for shutdown. Events such as loss of power, loss of coolant, relief valve failure, reactor runaway and loss of
reaction can trigger automatic shut-down of the reactor. In general, if the failed equipment can be bypassed individually
from the normal process with redundant units, other operations may still be continued, but if it is a critical unit
operation like the main reactor, it can t rigger the shut-down of the entire plant. Production will be resumed once the
sudden shut-down is attended by proper investigation on the root causes of the emergency situation, and
recommendations for preventing recurrence founded and implemented.

19
5.6 Hazard and Operability Study (HAZOP) for Main Reactor
Figure 19: HAZOP schematic for main reactor and associated boiler
19
20
Table 7: HAZOP table for main reactor
Process:
Reference Drawing:
Item Study Node Process
Parameter
DeviationPotential Causes Possible Consequences Safeguards Recommendations
1A Reactor (process
stream)
Temperature Low 1. Dow therm inlet temperature low (Refer to 2D) 1. Reaction quenched, low /no
conv ersion
1a. Reactor thermocouple activ ates low temperature
indicator to alert operator
1b. Refer to safeguards of 2D
1a. Regular inspection on reactor thermocouple and temperature
indicator
1b. Refer to recommendations of 2D
2. Ex cessiv e Dow therm flow
(Refer to 2B)
2. " 2a. Refer to safeguard 1A.1a
2b.Refer to safeguards of 2B
2a. Refer to recommendation 1A.1a
2b.Refer to recommendations of 2B
3. Feed inlet temperature low due to heat loss along
pipeline
3. " 3. Refer to safeguard 1A.1a. 3a. Refer to recommendation 1A.1a
3b. Install insulation on pipeline to reduce heat loss
4. Feed inlet temperature low due to failure of upstream
heating operations
4. " 4. Refer to safeguard 1A.1a 4a. Refer to recommendation 1A.1a
4b. Install temperature controller on upstream heating units
1B High 1. Dow therm inlet temperature high (Refer to 2E) 1a. Cataly st deactiv ation
1b. Possible reaction runaw ay
1a. Thermocouple activ ates high temperature alarm to
alert operator
1b. Refer to safeguards of 2E
1a. Regular inspection on thermocouples and alarm sy stem
1b. Refer to recommendations of 2E
2. No/ Low Dow therm flow
(Refer to 2A)
2. " 2a. Refer to safeguard 1B.1a
2b. Refer to safeguards of 2A
2a. Refer to recommendation 1B.1a
2b. Refer to recommendations of 2A
3. Feed inlet temperature high due to ov erheating
upstream
3. " 3a. Refer to safeguard 1B.1a 3a. Refer to recommendations 1B.1a
4. Tube fouling 4. " 4a. Refer to safeguard 1B.1a 4a. Refer to recommendations1B.1a
4b. Anti-fouling material for tubes
4c. Regular tube-cleaning
1C High High 1. Failure of thermocouples or high temperature alarm
sy stem
1. Reaction runaw ay leading to
fire and ex plosion
1. Secondary temperature detector triggers automatic
shutdow n sy stem
1a. Emergency procedures and drills
1b. Shutdow n of reactor
1c. Regular inspection on secondary temperature detector and
automatic shutdow n sy stem
2. Failure of operator to notice high temperature 2. " 2. " 2a. Proper training of operator
2b. Refer to recommendations of 1C.1
1D Reactor (process
stream)
Pressure Low 1. Feed inlet pressure low due to upstream pump fault 1. Low conv ersion leading to
w aste of raw materials
1a. Pressure indicator alerts operator
1b. Upstream back up pump operates
1a. Regular inspection on pressure indicator sy stem
1b. Regular inspection on pumps
1E High 1. Feed inlet pressure high due to upstream pump fault 1. Reactor ov erpressure 1a. Upstream back up pump operates
1b. Pressure indicator activ ates high pressure alarm to
alert operator
1c. Safety v alv e (SV) opens, discharged materials flow to
containment sy stem
1a. Regular inspection on pumps
1b. Regular inspection on pressure indicator and alarm sy stem
1c. Regular inspection on safety v alv e
1d. Reactor design to w ithstand high pressure
2. Tubes/ product outlet nozzle blocked 2. " 2a. Refer to 1E.1b,c 2a. Refer to 1E.1b,c,d
1F High High 1. Safety v alv e fails closed 1. Reaction runaw ay ,
ov erpressure leading to fire and
ex plosion
1. Rupture disc (RD) burst, discharged materials flow to
containment sy stem
1a. Regular inspection on rupture disc
1b. Emergency procedures & drills
2. Failure of operator to notice high pressure 2. " 2. " 2a. Proper training of operator
2b. Refer to recommendations of 1F.1
Cumene Production
Figure 19
Project name:
Section:
CH4701 FYDP
PFR-100
20
21
1G Flow No/ Low 1. Automatic control v alv e
(FCV 1) fails closed
1a. No reaction / Low cumene
production rate
1b. Pressure build up before
FCV 1
1a. Manual v alv e 1 (MV1) in parallel open
1b. Feed stream flow meter and flow indicator alert
operator
1a. Regular inspection on v alv es
1b. Regular inspection on feed stream flow meter and indicator
2. Feed supply pipe ruptures / leak 2. Raw materials release to
atmosphere
2a. Refer to safeguard 1G.1b
2b. Pipe casing along feed line
2a. Refer to recommendation 1G.1b
2b. Regular inspection to ensure pipeline integrity
3. Upstream feed pump failure/fault 3. Refer to 1G.1a 3a. Upstream back up pump operates
3b. Refer to safeguard 1G.1b
3a. Regular inspection on upstream feed pumps
3b. Refer to recommendation 1G.1b
1H Flow High 1. Automatic control v alv e
(FCV 1) fails open
1a. Flooding of dow nstream
unit operations
1b. Pressure build up at
dow nstream sy stems
1a. Manual v alv e (MV2) in series closed
1b. Refer to safegaurd 1G.1b
1a. Refer to recommendations of1G.1
2. Upstream feed pump fault 2. " 2a. Upstream back up pump operates
2b. Refer to safeguard 1G.1b
2a. Regular inspection on upstream feed pumps
2b. Refer to recommendation 1G.1b
2A Reactor cooling
sy stem
Flow No/ Low 1. Automatic control v alv e
(FCV 2) fails closed
1. Loss of cooling, temperature
runaw ay
1a. Manual Valv e (MV 3) in parallel open
1b. Dow therm pipeline flow meter and indicator alert
operator
1a. Regular inspection on v alv es
1b. Regular inspection on flow meter and indicator
2. Dow therm circulating pump fault 2. " 2a. Back up pump operates
2b. Refer to safeguard 2A.1b
2a. Regular inspection on pumps
2b. Refer to recommendation 2A.1b
3. Dow therm supply pipe fully / partially blocked 3. " 3a. Refer to safeguard 2A.1b 2a. Refer to recommendation 2A.1b
2b. Regular inspection to ensure pipeline integrity
4. Dow therm supply pipe ruptures / leak 3a. Refer to 2A.1
3b. Release of Dow therm fluid
to env ironment
3a. Refer to safeguard 2A.1b
3b. Containment sy stem
3a. Refer to recommendation 2A.1b
3b. Regular inspection on containment sy stem
2B High 1. Automatic control v alv e
(FCV 2) fails open
1. Reactor cools, conv ersion
decreases
1a. Manual v alv e (MV 4) in series closes
1b. Refer to safeguard 2A.1b
1a. Refer to recommendations 2A.1
2. Dow therm circulating pump fault 2. " 2a. Back up pump operates
2b. Refer to 2A.1b
2a. Regular inspection on pumps
2b. Refer to 2A.1b
2C Rev erse 1. Backflow of Dow therm to reactor due to high
backpressure
1. Possible temperature rise
and reaction runaw ay
1a. Check v alv e prev ents backflow 1a.Regular inspection on check v alv e
2D Temperature Low 1. BFW inlet flow ex cessiv ely high due to FCV 3 fails
open
1. Reactor ov ercooling, low /no
conv ersion
1a. Manual Valv e (MV 6) in series closes
1b. BFW flow meter and flow indicator alerts operator
1a. Regular inspection on v alv es
1b. Regular inspection on BFW flow meter and indicator
2. BFW inlet temperature low due to heat loss along
pipeline
2. " 2a. Insulation on pipeline to reduces heat loss 2a. Regular inspection on pipeline insulation
2E High 1. BFW inlet low flow due to FCV 3 fails close 1. Loss of cooling, temperature
runaw ay
1a. Manual Valv e (MV 5) in parallel open
1b. Refer to safeguard 2D.1b
1a. Regular inspection on v alv es
1b. Refer to recommendation 2D.1b
2. BFW no/low flow due to BFW supply pump
failure/fault
2. " 2a. BFW supply back up pump operates
2b. Refer to safeguard 2D.1b
2a. Regular inspection on pumps
2b. Refer to recommendation 2D.1b
3. BFW inlet temperature high due to loss of temperature
control at BFW storage tank
3. " 3a. BFW storage tank themocouples activ ates temperature
indicator and alarm sy stem to alert operator
3a. Regular inspection on BFW storage tank thermocouples and
temperature alarm sy stem
21
22
SECTION 6.0 RECOMMENDATIONS
For fu rther study, a unit operation to separate propane from propylene may be included in the design in order to
allow recycling of propylene in the overall process. Potential separation methods include using extractive distillation
with aqueous acetonitrile [24] or a hybrid adsorption-distillation process [25] among others. Heat integration can be
improved by adjusting the column pressures to allow matching of condenser and reboiler streams in heat exchange.
Based on current optimized conditions, stream matching of the condensers and reboilers was not possible due to
temperature conditions. In addition, reactive d istillation is also a potential option to combine reaction and separation
processes to reduce operating costs [1].
SECTION 7.0 CONCLUSION
This project was conducted in three stages to highlight the progression and improvement from the base model of a
steady state cumene production plant. The base model also supported the identification of dominant and local variab les
which were studied to yield optimal profit. The common trade-off encountered during the optimization of design
variables was between raw material and total annualized costs. Raw material cost was affected by conversion and
selectivity issues, whereas the total annualized cost was affected by capital and energy costs based on specified
operating conditions. Introduction of the transalkylator in Stage 2 eliminated overall production of the DIPB by -
product, allowing further optimization of p rocess conditions to reduce reactant wastage and operating costs. Subsequent
heat integration in Stage 3 utilized existing process streams to perform mutual heating and cooling operations, thus
reducing reliance on utilit ies. The result was a reduction in total annualized costs of 26.5%, and a profit increment of
2.51% ($1.16 mil), with a final estimated profit of $47,201,314 per annum.

A
REFERENCES
[1] Ashok S. Pathak, Sankalp Agarwal, Vivek Gera, Nitin Kaistha, “Design an d Control of a Vapor-Phase
Conventional Process and Reactive Distillation Process for Cumene Production”, Ind. Eng. Chem. Res. 2011,50,3312-
3326
[2] Luyben, W.L. “Design and Control of the Cumene Process ”, Ind. Eng. Chem. Res.2010. 49,719-734
[3] Carlson E. C. “Don’t Gamble with Physical Properties for Simulations”, Chemical Engineering Progress, 1996.
[4] Sinnott R. K., Towler G., Chemical Engineering Design 5th ed.” Elsevier, 2009.
[5] Eigenberger G., “Fixed Bed Reactors”, Institut flir Chemische Verfahrenstechnik, Universitiit Stuttgart, Stuttgart,
Federal Republic of Germany. 2009<http://elib.uni-stuttgart.de/opus/volltexte/2009/4798/pdf/eig16.pdf>
[6] Ian C. Kemp, “Pinch Analysis and Process Integration, 2nd ed .”, Elsevier Ltd, 2007.
[7] Aspen Technology, Inc,” Aspen Energy Analyzer Reference Guide, V7.1”, Burlington, MA., 2009.
[8] Shenoy U. V. “Heat Exchanger Network Synthesis: Process Optimization by Energy and Resource Analysis”, Gulf
Publishing Company, 1995.
[9] Sloley Andrew W. “Heat Integration Can Complicate Control.”Sustainable Planet.(N.p.) 2010.
<http://www.sustainableplant.com/2010/heat-integration-can-complicate-control/>
[10] Eaton, Ben A., et. al., “The Predict ion of Flow Patterns, Liquid Holdup and Pressure Losses Occurring During
Continuous Two-Phase Flow In Horizontal Pipelines”, Journal of Petroleum Technology. V19,6, 1967.
<http://www.onepetro.org/mslib/servlet/onepetropreview?id=00001525>
[11] Rajiv Mukherjee, “Effectively Design Shell-and-Tube Heat Exchangers”, Chemical Engineering Progress, 1998
[12] Richard L. S., Patrick M. B., et. al., “Perry’s Chemical Engineers’ Handbook, 8th
ed, Chapter 11”, McGraw Hill
Inc., 2008.
[13]Koning G. W. “Heat and Mass Transport in Tubular Packed Bed Reactor s at Reacting and Non -reacting
Conditions”, Twente University Press, 2002.
[14] Scheffler N. E., Heitzig W. R., et. al. “ Dow’s Fire & Explosion Index Hazard Classification Guide, 7th
ed.”,
American Institute of Chemical Engineers (AIChE), 1994.
[15] Dauwe R., Marshall J. T., Thayer J. C., et. al.“ Dow’s Chemical Exposure Index Guide, First Edition”, American
Institute of Chemical Engineers (AIChE), 1994.
[16] “Code of Practice on Pollution Control, Third Edition”. National Environment Agency (NEA),
2000.<http://app2.nea.gov.sg/data/cmsresource/20090401728616415372.pdf >
[17] “Industrial Flares”. United States Environment Protection Agency (EPA)
http://www.epa.gov/ttnchie1/ap42/ch13/final/c13s05.pdf
[18] Dobney P. W. “AIRAH DA17 Cooling Towers”. Australian Institute of Refrigerat ion, Air-Conditioning & Heating
Incorporated, 2009. <http://mct.hugedev.com/wp-content/uploads/2010/09/Cooling-Tower-Types-Table-2.1.pdf >
[19] “Plant Layout”. Health & Safety Executive (HSE) <http://www.hse.gov.uk/comah/sragtech/techmeasplantlay.htm>
[20] Branan C. R. “Rules of Thumb for Chemical Engineers”, Gulf Professional Publishing. 2011.
[21] Centre for Chemical Process Safety, “Guidelines for Safe Process Operations and Maintenance”. NY: American
Institute of Chemical Engineers. 1995.
[22] Verwijs J. W., Kosters P. H., et. al. “Reactor Operating Procedures for Startup of Continuously-Operated
Chemical Plants ”. AIChE Journal Vol. 41, No. 1”. 1995.
[23] Verwijs J. W., H. van den Berg and Westerterp K. R.“Startup of an Industrial Adiabatic Tubular Reactor”, AIChE
Journal. Vol. 38 No. 12”. 1992.
[24] Bo Liao, Zhigang Lei, et. al., “New process for separating propylene and propane by extractive distillation with
aqueous acetonitrile”. Chemical Engineering Journal, V84. 2001.
<http://www.sciencedirect.com/science/article/pii/S1385894701001759>
[25] Ghosh T. K., Hon-Da Lin & Hines A. L., “Hybrid adsorption-distillation process for separating propane and
propylene”, Ind. Eng. Chem. Res., 1993. <http://pubs.acs.org/doi/abs/10.1021/ie00022a024>

B
APPENDIX
Table A 1: Equipment Design Parameters, Capital and Energy Costs for Economic Optimum
Heat
Exchanger
Area
(m2)
TEMA
type
Duty
(kW)
U
(kW/K.m2)
Minimum
∆T (K)
Energy
Cost ($)
Capital
Cost ($)
Total
Cost ($)
E-100 80.97 BFU 1853.68 1175.81 66.89 - 126,907.38 126,907.38
E-101 8.22 AEL 149.76 1175.81 25.64 - 28,688.03 28,688.03
E-103 310.11 BFU 3203.87 999.59 26.07 - 303,787.36 303,787.36
E-105 321.24 AEL 1553.68 295.23 43.68 - 310,832.42 310,832.42
E-106 231.77 AEL 605.60 240.14 39.04 - 251,402.27 251,402.27
E-109 5.66 AEL 142.49 1175.81 44.61 - 22,507.93 22,507.93
Cooler Area
(m2)
Duty (kW) U
(kW/K.m2)
Minimum
∆T (K)
SteamCredit
($/yr)
Capital
Cost ($)
Total Cost
($/yr)
E-107 327.15 5574.71 0.57 30.00 966,132.28 314,538.55 314,538.55
E-108
(Condenser) 53.36 909.33 0.57 30.00 105,356.42 96,783.22 96,783.22
E-114 17.24 293.81 0.57 30.00 36,782.76 46,437.63 46,437.63
E-117 122.39 2085.45 0.57 30.00 261,084.09 166,000.05 166,000.05
Heater Area
(m2)
*Duty (kW) U
(kW/K.m2)
Minimum
∆T (K)
Energy
Cost ($/yr)
Capital
Cost ($)
Total Cost
($/yr)
E-102 117.57 38.07 (2003.38) 0.57 30.00 9,428.94 161,724.75 171,153.69
E-104
(Vaporizer) 52.41
893.02
(4134.98) 0.57 30.00 223,351.11 95,650.73 319,001.84
E-118 8.36 0.54 (142.46) 0.57 30.00 163.59 29,009.98 29,173.57
H-100
(Furnace) 161.72 0.00 (2755.67) 0.57 30.00 0.00 198,965.07 198,965.07
*Value for duty in brackets is duty required for startup, equipment sizing is based on this duty.
Condenser Area
(m2)
Duty(kW) U
(kW/K.m2)
Minimum
∆T (K)
Energy
Cost ($/yr)
Capital
Cost ($)
Total Cost
($/yr)
E-111 10.67 126.38 0.85 13.90 529.87 33995.82 34,525.69
E-113 149.96 1775.93 0.85 13.90 7393.48 189437.73 196,831.21
E-116 283.73 3360.14 0.85 13.90 13944.55 286729.19 300,673.74
Reboiler Area
(m2)
Duty(kW) U
(kW/K.m2)
Minimum
∆T (K)
Energy
Cost($/yr)
Capital
Cost ($)
Total Cost
($/yr)
E-110 56.16 957.03 0.57 30.00 98,584.42 243,845.28 342,429.70
E-112 175.61 2992.37 0.57 30.00 209,444.41 762,437.78 971,882.19
E-115 194.08 3307.08 0.57 30.00 224,112.53 842,621.90 1,066,734.43
Column Height
(m)
Diameter
(m)
Number of
Tray
Tray
spacing
(m)
Feed
tray
Reflux
Ratio Capital Cost ($)
T-100 5.12 1.22 8 0.61 6 1.91 80,748.14
T-101 16.09 1.52 25 0.61 10 1.66 256,621.45
T-102 22.68 1.83 32 0.55 23 0.37 410,345.11
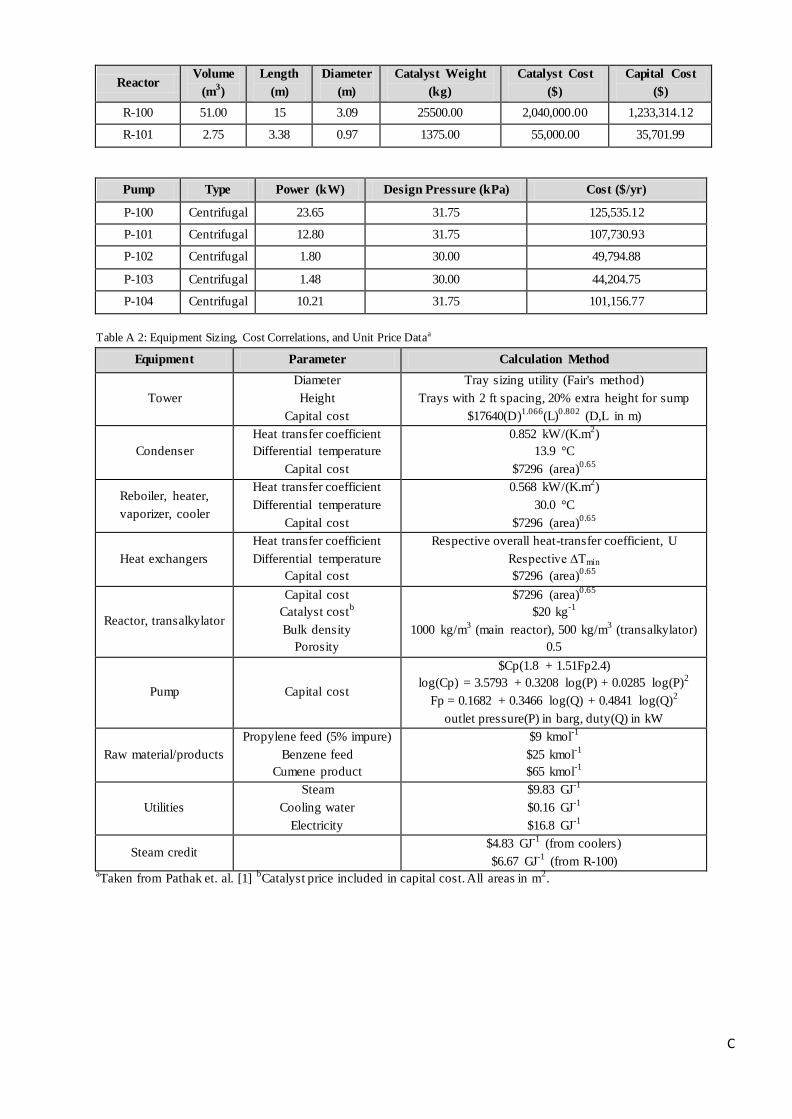
C
Reactor Volume
(m3)
Length
(m)
Diameter
(m)
Catalyst Weight
(kg)
Catalyst Cost
($)
Capital Cost
($)
R-100 51.00 15 3.09 25500.00 2,040,000.00 1,233,314.12
R-101 2.75 3.38 0.97 1375.00 55,000.00 35,701.99
Pump Type Power (kW) Design Pressure (kPa) Cost ($/yr)
P-100 Centrifugal 23.65 31.75 125,535.12
P-101 Centrifugal 12.80 31.75 107,730.93
P-102 Centrifugal 1.80 30.00 49,794.88
P-103 Centrifugal 1.48 30.00 44,204.75
P-104 Centrifugal 10.21 31.75 101,156.77
Table A 2: Equipment Sizing, Cost Correlations, and Unit Price Dataa
Equipment Parameter Calculation Method
Tower
Diameter
Height
Capital cost
Tray sizing utility (Fair's method)
Trays with 2 ft spacing, 20% extra height for sump
$17640(D)1.066
(L)0.802
(D,L in m)
Condenser
Heat transfer coefficient
Differential temperature
Capital cost
0.852 kW/(K.m2)
13.9 °C
$7296 (area)0.65
Reboiler, heater,
vaporizer, cooler
Heat transfer coefficient
Differential temperature
Capital cost
0.568 kW/(K.m2)
30.0 °C
$7296 (area)0.65
Heat exchangers
Heat transfer coefficient
Differential temperature
Capital cost
Respective overall heat-transfer coefficient, U
Respective ∆Tmin
$7296 (area)0.65
Reactor, transalkylator
Capital cost
Catalyst costb
Bulk density
Porosity
$7296 (area)0.65
$20 kg-1
1000 kg/m3 (main reactor), 500 kg/m
3 (transalkylator)
0.5
Pump Capital cost
$Cp(1.8 + 1.51Fp2.4)
log(Cp) = 3.5793 + 0.3208 log(P) + 0.0285 log(P)2
Fp = 0.1682 + 0.3466 log(Q) + 0.4841 log(Q)2
outlet pressure(P) in barg, duty(Q) in kW
Raw material/products
Propylene feed (5% impure)
Benzene feed
Cumene product
$9 kmol-1
$25 kmol-1
$65 kmol-1
Utilities
Steam
Cooling water
Electricity
$9.83 GJ-1
$0.16 GJ-1
$16.8 GJ-1
Steam credit $4.83 GJ
-1 (from coolers)
$6.67 GJ-1
(from R-100) aTaken from Pathak et. al. [1]
bCatalyst price included in capital cost. All areas in m
2.

D
Temp C 25.0 26.5 31.5 31.5 25.0 27.0 27.0 31.3 120.0 126.1 127.6 127.6 127.6 203.7 203.9 203.7 274.3 300.0 300.0 339.0
Pressure bar 1.0 31.8 31.8 31.8 15.0 31.8 31.8 31.8 31.5 31.3 31.2 31.2 31.2 30.9 31.1 30.9 30.5 30.2 30.2 30.1
Vapor fraction 0.0 0.0 0.0 0.0 0.0 0.0 0.0 0.0 0.0 0.0 0.0 0.0 0.0 1.0 1.0 1.0 1.0 1.0 1.0 1.0
Total kmol/h 231.9 231.9 335.0 335.0 247.6 247.6 247.6 582.6 582.6 582.6 582.6 457.9 124.6 457.9 124.6 582.6 582.6 582.6 582.6 351.3
Total kg/h 18111.8 18111.8 25803.8 25803.8 10443.4 10443.4 10443.4 36247.1 36247.1 36247.1 36247.1 28492.4 7754.7 28492.4 7754.7 36247.1 36247.1 36247.1 36247.1 36247.9
Flowrates kmol/h
Propylene 0.00 0.00 2.30 2.30 235.20 235.20 235.20 237.50 237.50 237.50 237.50 186.69 50.81 186.69 50.81 237.50 237.50 237.50 237.50 6.22
Propane 0.00 0.00 8.36 8.36 12.38 12.38 12.38 20.74 20.74 20.74 20.74 16.31 4.44 16.31 4.44 20.74 20.74 20.74 20.74 20.74
Benzene 231.88 231.88 324.23 324.23 0.00 0.00 0.00 324.23 324.23 324.23 324.23 254.87 69.37 254.87 69.37 324.23 324.23 324.23 324.23 98.53
Cumene 0.00 0.00 0.10 0.10 0.00 0.00 0.00 0.10 0.10 0.10 0.10 0.08 0.02 0.08 0.02 0.10 0.10 0.10 0.10 220.21
DIPB 0.00 0.00 0.00 0.00 0.00 0.00 0.00 0.00 0.00 0.00 0.00 0.00 0.00 0.00 0.00 0.00 0.00 0.00 0.00 5.59
Temp C 318.0 318.0 318.0 282.1 282.7 282.3 277.7 153.6 154.0 40.0 29.6 189.5 186.8 106.1 106.3 41.2 191.4 175.8 175.8 170.3
Pressure bar 29.7 29.7 29.7 29.4 29.6 29.4 29.0 28.5 7.8 7.8 1.0 7.9 7.9 7.4 2.3 2.2 2.4 2.3 1.7 1.5
Vapor fraction 1.0 1.0 1.0 0.0 0.0 0.0 0.0 0.0 0.0 1.0 1.0 0.0 0.0 0.0 0.0 0.0 0.0 0.0 0.0 0.0
Total kmol/h 351.3 228.1 123.2 228.1 123.2 351.3 351.3 351.3 351.3 16.7 16.7 334.6 358.1 358.1 358.1 119.3 238.8 238.8 238.8 231.5
Total kg/h 36247.9 23532.9 12715.0 23532.9 12715.0 36247.9 36247.9 36247.9 36247.9 743.2 743.2 35504.7 37905.2 37905.2 37905.2 8900.4 29004.7 29004.7 29004.7 27812.8
Flowrates kmol/h
Propylene 6.22 4.04 2.18 4.04 2.18 6.22 6.22 6.22 6.22 3.91 3.91 2.30 2.66 2.66 2.66 2.66 0.00 0.00 0.00 0.00
Propane 20.74 13.47 7.28 13.47 7.28 20.74 20.74 20.74 20.74 12.38 12.38 8.36 9.68 9.68 9.68 9.68 0.00 0.00 0.00 0.00
Benzene 98.53 63.97 34.56 63.97 34.56 98.53 98.53 98.53 98.53 0.42 0.42 98.12 107.10 107.10 107.10 106.87 0.24 0.24 0.24 0.24
Cumene 220.21 142.96 77.24 142.96 77.24 220.21 220.21 220.21 220.21 0.00 0.00 220.21 231.34 231.34 231.34 0.12 231.22 231.22 231.22 231.15
DIPB 5.59 3.63 1.96 3.63 1.96 5.59 5.59 5.59 5.59 0.00 0.00 5.59 7.36 7.36 7.36 0.00 7.36 7.36 7.36 0.07
Temp C 35.0 35.0 235.0 236.8 236.8 147.0 237.6 238.0 239.1 239.1 145.6 146.1 41.2 42.6 42.6 41.2 42.7 42.7 42.7
Pressure bar 1.4 1.0 1.8 30.0 30.0 30.0 29.8 29.7 29.6 29.6 29.2 7.9 2.2 30.0 30.0 2.2 31.8 31.8 31.8
Vapor fraction 0.0 0.0 0.0 0.0 0.0 0.0 0.0 0.0 0.0 0.0 0.0 0.0 0.0 0.0 0.0 0.0 0.0 0.0 0.0
Total kmol/h 231.5 231.5 7.4 7.4 7.4 23.6 23.6 23.6 23.6 23.6 23.6 23.6 16.2 16.2 16.2 103.1 103.1 103.1 103.1
Total kg/h 27812.8 27812.8 1192.0 1192.0 1192.0 2400.5 2400.5 2400.5 2400.5 2400.5 2400.5 2400.5 1208.5 1208.5 1208.5 7691.9 7691.9 7691.9 7691.9
Flowrates kmol/h
Propylene 0.00 0.00 0.00 0.00 0.00 0.36 0.36 0.36 0.36 0.36 0.36 0.36 0.36 0.36 0.36 2.30 2.30 2.30 2.30
Propane 0.00 0.00 0.00 0.00 0.00 1.31 1.31 1.31 1.31 1.31 1.31 1.31 1.31 1.31 1.31 8.36 8.36 8.36 8.36
Benzene 0.24 0.24 0.00 0.00 0.00 14.51 14.51 14.51 8.99 8.99 8.99 8.99 14.51 14.51 14.51 92.35 92.35 92.35 92.35
Cumene 231.15 231.15 0.07 0.07 0.07 0.09 0.09 0.09 11.13 11.13 11.13 11.13 0.02 0.02 0.02 0.10 0.10 0.10 0.10
DIPB 0.07 0.07 7.29 7.29 7.29 7.29 7.29 7.29 1.77 1.77 1.77 1.77 0.00 0.00 0.00 0.00 0.00 0.00 0.00
35-1 35-2 36 37
2221-221-120-219 20-1
46 47 48 49 50 50*43 44 4539 40 41
31
Stream Number
32 33 34 35
38
25 26 26-1 27 28 29
42 42*
13-1 13-2 14 15
3023 24
12-1 12-211 18Stream Number 1 2 3 4 5 6 7 8 9 10 16
Stream Number
17
Table A 3: Stream Table for Final Design
D