fy5/2015 1st half performance - ir pocketpdf.irpocket.com/c2678/bszl/msx2/c9ie.pdf · of operating...
TRANSCRIPT

Disclaimer This is an English translation of the captioned release. This translation is prepared and provided for the purpose of the reader’s convenience. All readers are recommended to refer to the original version in Japanese of the release for complete information
News Release dated: December 17, 2014
To whom it may concern: Company Name: ASKUL Corporation (Code No.: 2678, Tokyo Stock Exchange First Section)
Representative: Shoichiro Iwata President and Chief Executive Officer
Contact Person: Tsuguhiro Tamai Executive Officer, Finance & Corporate Communication Unit Phone: (03) 4330-5130
FY5/2015 1st Half Performance
(Consolidated financial summary for first half of fiscal year ending May 2015)
ASKUL Corporation (hereinafter referred to as the “Company”) herewith attach the “FY5/2015 1st Half
Performance” (Consolidated financial summary for first half of fiscal year ending May 2015 ) to
provide supplementary information with respect to the “Summary of Consolidated Financial Results
for First Half of Fiscal Year Ending May 2015 (Japanese GAAP).”
These supplementary materials include forward-looking statements concerning current plans and the
outlook for operating results. These statements are based on plans and forecasts that use currently
available information. Forward-looking statements are not promises or guarantees about the future
because actual operating results may differ from the Company’s outlook for a variety of reasons.
These supplementary materials are unaudited and have not been reviewed by certified public
accountants or auditors.

December 17, 2014
Accelerate Speed of Growth and Boost Returns FurtherDouble-digit Growth in 1st Half, Both in Sales and Profits
FY5/2015 1st Half Performance
DisclaimerThis is an English translation of the captioned presentation material. This translation is prepared and provided for the purpose of the convenience of non-Japanese-speaking people. All readers are recommended to refer to the original version in Japanese of the presentation material for complete information.

1
Notes:This material contains ASKUL Group’s current plans and performance outlook. These plans, forecasts, and other forward-looking statements represent ASKUL’s plans and forecasts based on information currently available. Actual performance may differ from these plans and forecasts due to a variety of conditions and factors that could occur in the future. This material does not represent promises or guarantees regarding the achievement of these plans. The terms such as Largest, Optimum, Fastest, Best are used for illustrative purposes and do not guarantee such achievement. This material has not been audited by certified public accountants or auditing firms.
For the purposes of this material, LOHACO refers to the online mail-order business for general consumers, launched in October 2012 in alliance with Yahoo Japan Corporation.B-to-B refers to business-to-business transactions.
Reproduction or reprint in any form of all or part of this material (including trademarks and images) without the permission of ASKUL is prohibited.

2
I. First Half Results– Double-digit Growth in Sales and Profits –
II. Strengthening of Logistics Capability– Pursuit of Higher Efficiency –
III. Status of LOHACO Business– Shift Gears for Becoming No. 1 in Second-generation E-commerce –
IV. Status of B-to-B Business– Accelerate Speed of Growth and Boost Returns Further –

(¥million) (¥million) (¥million) (%)
Net Sales 119,215 100 131,944 100 132,500 99.6 110.7
Gross Profit 26,678 22.4 28,690 21.7 29,100 98.6 107.5
Selling, General andAdminis trative
Expens es25,211 21.1 27,053 20.5 27,100 99.8 107.3
Operating Income 1,467 1.2 1,637 1.2 2,000 81.9 111.6
Ordinary Income 1,523 1.3 1,705 1.3 1,980 86.1 112.0
Net Income 558 0.5 885 0.7 1,000 88.5 158.7
% ofsales
% ofsales
% of planPlan
FY5/2014 1H FY5/2015 1H
YoYchange
ActualActual
3
FY5/2015 1H Consolidated Performance
Double-digit growth in net sales by overcoming the impact of the consumption tax increase
A -¥270 million impact of a temporary loss at a subsidiary on operating income
Double-digit growth in all of operating, ordinary and net income

Yo Y c h a n g e(% )
B-to-B Bus ine s s , e tc. 114.9 123.0 107.0L OHA CO 4.2 8.9 208.1Tota l 119.2 131.9 110.7
107 0B-to-B Bus ine s s , e tc. 2.8 3.6 128.9L OHA CO -1.3 -1.7 -S ubtota l 1.4 1.9 130.1Te mpora ry los s a t as ubs idia ry - -0.2 -
Tota l 1.4 1.6 111.6
Net sales
Op
erating
inco
me
FY5/2015 1HActua l
(¥b i l l i o n )
FY5/2014 1HActua l
(¥b i l l i o n )
4
FY5/2015 1H Consolidated Performance (By Business)
Net salesB-to- B Business, etc.:
Growth rate has been accelerated
LOHACO: More than doubled
Operating incomeB-to- B Business, etc.:
Returns increased 28.9% YoY
LOHACO: Actively implementing growth measures

Factors Affecting FY5/2015 1H Consolidated Net Sales
+4.6
+5.5+2.5
5
FY5/2014 1H (actual)Net sales ¥119.2 billionYoY change +¥9.4 billionYoY growth +8.6%
FY5/2015 1H (actual)Net sales ¥131.9 billionYoY change +¥12.7 billionYoY growth +10.7%
Incr
ease
due
to LO
HAC
O
Incr
ease
due
to M
RO/M
edic
al
busin
esse
s*
Incr
ease
from
oth
er B
-to-
B bu
sines
s, et
c.
*MRO/Medical businesses do not include LOHACO portion
(¥billion)
LOHACONet sales ¥8.9 billionYoY change +¥4.6 billion
MRO/Medical businesses*Net sales ¥20.2 billionYoY change +¥2.5 billion
Other B-to-B business, etc.Net sales ¥102.8 billionYoY change +¥5.5 billion

+0.8
1.4 1.6
Factors Affecting FY5/2015 1H Consolidated Operating Income
-0.3
-0.2
1.9
6
FY5/2014 1H operating income(actual) ¥1.4 billion
Incr
ease
in o
pera
ting
inco
me
due
to sa
les
incr
ease
s in
B-to
-B b
usin
ess,
etc.
Dec
reas
e in
ope
ratin
g in
com
e du
e to
act
ive
sale
s pro
mot
ion
at
LOHA
CO b
usin
ess,
etc.
FY5/2015 1H operating income(actual) ¥1.6 billion
Dec
reas
e in
ope
ratin
g in
com
e du
e to
a te
mpo
rary
loss
at a
su
bsid
iary
FY5/2014 1H (actual)Net sales growth YoY +8.6%Gross profit margin 22.4%SG&A expense ratio 21.1%
FY5/2015 1H (actual)Net sales growth YoY +10.7%Gross profit margin 21.7%SG&A expense ratio 20.5%
(¥billion)

Q o Q c h a n g e(% )
B-to-B Bus ine s s , e tc. 59.0 64.0 108.7L OHA CO 4.0 4.8 117.9Tota l 63.0 68.9 109.3
107 0B-to-B Bus ine s s , e tc. 1.2 2.3 185.6L OHA CO -0.9 -0.8 -S ubtota l 0.3 1.5 401.0Te mpora ry los s a t as ubs idia ry - -0.2 -
Tota l 0.3 1.2 329.6
Net sales
Op
erating
inco
me
FY5/2015 2QActua l
(¥b i l l i o n )
FY5/2015 1QActua l
(¥b i l l i o n )
7
FY5/2015 1Q and 2Q Consolidated Performances (By Business)
B-to-B Business, etc.Profitability increased significantly(a 1.5 p.p. improvement in the ratio of operating income to net sales)
LOHACOOperating loss narrowed(top line has been robust)
OverallOperating income grew four-fold from the previous quarter(excluding the impact of the temporary factor)

21
22
23
Aug Sep Oct Nov
Trend of Gross Profit* on Merchandise Sales at B-to-B Business (Non-consolidated)
*The figures have been calculated by excluding sales promotion premium and incentives for agents, etc.
Previous catalog is valid
Limited time discount offer with new catalog
New prices apply to all
products
Maintained price competitiveness and carried
out price revision
Latest profitability has significantly improved
The number of customers continues to increase
Net sales have increased reflecting increased average customer spending
Up
1.1 p.p.
Gross profit on merchandise sales
8
Average 1H gross profit on merchandise salesat B-to-B Business (non-consolidated)

(¥billio n) (¥billio n) (%)
Net Sales 253.4 100 277.0 100 109.3
Gross Profit 55.7 22.0 61.5 22.2 110.4
Selling, General andAdminis trative
Expens es51.4 20.3 55.0 19.9 107.0
Operating Income 4.2 1.7 6.5 2.3 152.0
Ordinary Income 4.4 1.8 6.4 2.3 145.2
Net Income 2.1 0.9 3.4 1.2 157.0
FY5/2014Full-year Actual
Amount YoY change
FY5/2015Full-year Plan
Amount% of netsales
% of netsales
Latest profitability has been improving
The full-year plan is left
unchanged9
FY5/2015 Full-year Consolidated Performance Plan

Yo Y c h a n g e( % )
B - t o - BB u si n e ss, e t c . 126.3 131.9 104.4
LO H AC O 7.8 13.0 167.1
To t a l 134.1 145.0 108.1
B - t o - BB u si n e ss, e t c . 4.3 6.1 139.3
LO H AC O -1.5 -1.2 -
To t a l 2.7 4.8 174.0
Net Sales
Operating Incom
e
FY5/20152H Pl a n
(¥b i l l i o n )
FY5/20142H Actua l(¥b i l l i o n )
10
FY5/2015 2H Consolidated Performance Plan (By Business)
Net salesTaking into consideration the reaction to the last-minute demand before the consumption tax increase
Operating incomeLogistics productivity has been firmly improving
Profitability is rising due to price revision, etc.

Further improve logistics efficiency to become No. 1 in e-commerceEvolve logistics service through innovation
Continue to focus on top line in LOHACO businessGrowth engine is e-commerce marketing that starts from customers
Solid B-to-B business to focus on growth fieldsSteadily generate sales and profits
FY5/2015 Company-wide Policy
11

12
I. First Half Results– Double-digit Growth in Sales and Profits –
II. Strengthening of Logistics Capability– Pursuit of Higher Efficiency –
III. Status of LOHACO Business– Shift Gears for Becoming No. 1 in Second-generation E-commerce –
IV. Status of B-to-B Business– Accelerate Speed of Growth and Boost Returns Further –

13

Initiative being implemented Progress in the 1st half
(1) Center operation (local operation perspective): 1Q
Stable operation in linewith plan
(2) Material handling equipment and system (engineer’s perspective): 2Q
Investments completedResults from 3Q onwards
(3) Business process, model (business perspective): 2Q, 3Q
To focus from now on
Initiatives for Improving Logistics Efficiency in FY5/2015 Warehouse operation
14

40.0
45.0
50.0
55.0
60.0
65.0
70.0
75.0
1Q 2Q 3Q 4Q 1Q 2Q
Improvement from the local operation perspective• Optimized distribution of inventory
products• Leveling of packing and replenishment
operation• Optimization of man-hour management
FY5/2014 FY5/2015
Average Warehouse Operation Unit Cost of All Centers
The core distribution centers in east and w
est start operation
15
Warehouse operation
Productivity has improved significantly

Delivery share in ASKUL Group
About 60%Covers high density areas
Value-added services such as ECO-TURN Delivery*, etc.are being offered in the B-to-B business
Delivery operation
Controls company-wide delivery costs
Performance for Jun–Nov 2014 (based on the number of parcels)
BizexOthers
*ECO-TURN Delivery is an environment-friendly delivery service that uses foldable containers to eliminate packing materials and waste.We have switched returnable bags to paper bags from late August 2013 onwards 16
Returnable bag
Foldable container

Further Strengthening of Overwhelming Logistics Capability
Aim to become No.1 in second-generatione-commerce by accelerating the pace of business
growth while evolving the logistics service
17

18
I. First Half Results– Double-digit Growth in Sales and Profits –
II. Strengthening of Logistics Capability– Pursuit of Higher Efficiency –
III. Status of LOHACO Business– Shift Gears for Becoming No. 1 in Second-generation E-commerce –
IV. Status of B-to-B Business– Accelerate Speed of Growth and Boost Returns Further –
×
19
Life changes with LOHACO.
It became convenient.Let’s be happy.

Second-generation e-commerce as envisionedby LOHACO
Daily useWhenever, wherever
EC for daily necessities
20

×Largest Product RangeOptimum PriceFastest Distribution SystemBest Customer Support
Best Customer Appeal
Best Settlement
CustomerAppeal
ProductRange Price Settlement Distribution Customer
Support
Structural Strengths
21

Measures to be crystallized based on big data analysis ofthese two axes
Aim for net sales expansion and profitability improvement
Product-centered Customer-centered
22
Shifting Gears towards No.1 in Second-generation e-commerce

Jun Jul
Aug
Sep
Oct
Nov De
cJa
nFe
bM
arAp
rM
ay Jun Jul
Aug
Sep
Oct
Nov
LOHACO net sales to grow significantlytowards becoming
No.1 insecond-generation
e-commerce
LOHACO Business Net Sales Trend
LOHACO
208%of the same period
a year earlier
2014 2015
23

0
20,000
40,000
60,000
80,000
100,000
120,000
140,000
160,000
180,000
Jul Aug Sep Oct Nov Dec Jan Feb Mar Apr May Jun Jul Aug Sep Oct Nov
(Number of people)Trend in LOHACO-san*
*LOHACO-san:Among repeat customers, loyal customers who satisfy certain criteria
2013 2014
LOHACO-san expanding steadily
Second-generation e-commerce Steadily Spreading
The number of LOHACO-san
150,000 peoplein about 2 years
The next milestone
1 million people
24

Massproduction
Massadvertising
Massdistribution
Securingregular item
status
(1) Immediate startup(2) Upfront investment(3) Negotiation for regular item
status(4) Reduction of regular items,
inventory disposal,own-brand products
Issues facing manufacturers
Innovation
Conventional process
LOHACO’s process
(1) Small start(2) High-speed
implementation of PDCA(3) Visualization of evaluation(4) Expansion at low cost
Smallstart Communication
Productevaluation
Improve Spread Nurture,establish
25
Taking on Challenge to Enable Distribution Process from Customer Perspective

We will focus onfurther vitalization of
existing storesfrom now on
Pursue profits through added
value
New Open!
8stores
at the time of opening(August 2013)
35stores
(As of December 17, 2014)
2Q
2Q
1Q
2Q
26
関氏さんに確認伊藤
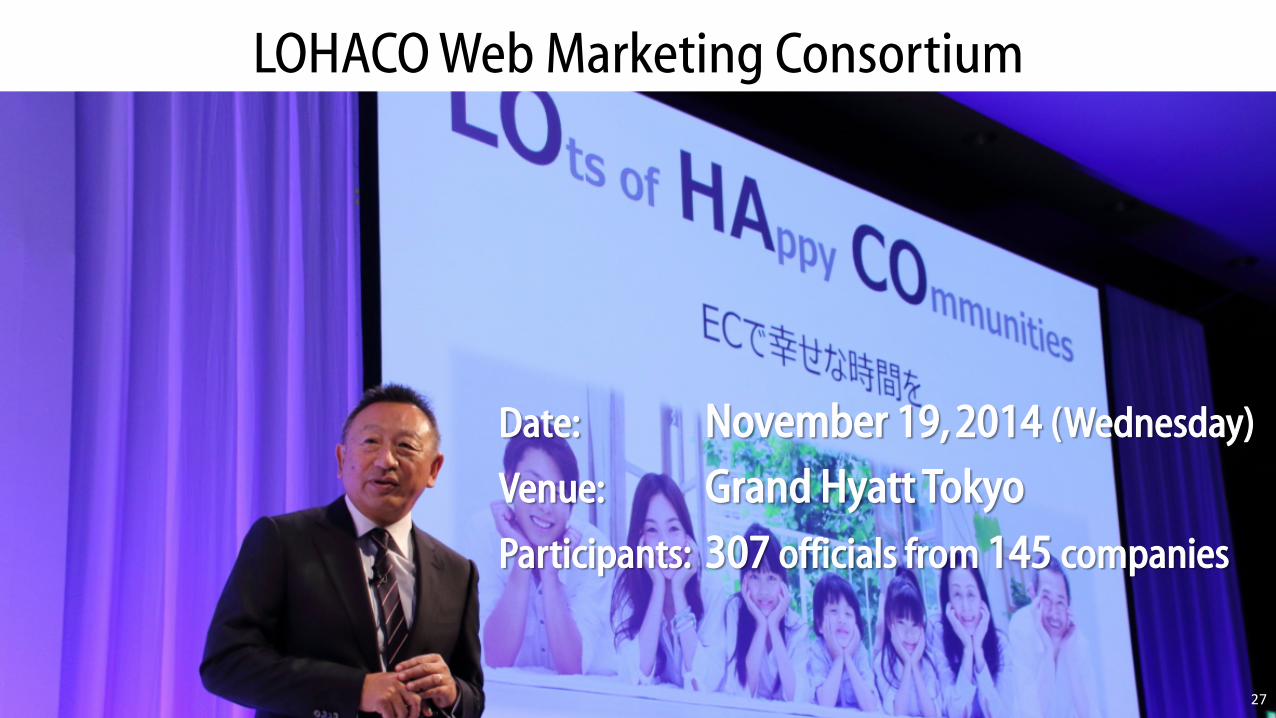
Date: November 19, 2014 (Wednesday)
Venue: Grand Hyatt TokyoParticipants: 307 officials from 145 companies
LOHACO Web Marketing Consortium
27

LOHACO will shift gearsin pursuit of further expansion
28

29
I. First Half Results– Double-digit Growth in Sales and Profits –
II. Strengthening of Logistics Capability– Pursuit of Higher Efficiency –
III. Status of LOHACO Business– Shift Gears for Becoming No. 1 in Second-generation E-commerce –
IV. Status of B-to-B Business– Accelerate Speed of Growth and Boost Returns Further –

30
TargetingB-to-B Business

FY5/2002 FY5/2004 FY5/2006 FY5/2008 FY5/2010 FY5/2012 FY5/2014
Net Sales of B-to-B Business to Post Continuous Growth
Great East Japan Earthquake
Collapse of Lehman Brothers
Actual/plan
31
*Trend of B-to-B business’s net sales(non-consolidated) 32

102
104
106
108
110
112
114
FY5/2014 2Q 3Q 4Q FY5/2015 1Q 2Q
Trend of YoY Change in Net Sales of B-to-B Business, etc.(%)
Net sales increased 8.3% in 2Q compared with the same period a year earlier
By overcoming the reaction to the last minute
demand ahead of the consumption tax rate
increase
Last minute demandahead of the consumption
tax rate increase
32

Increase the number of customers(primarily in manufacturing and medical/nursing care)
Introduce new high-demand products (MRO, medical)
Evolve e-commerce purchasing website to boost active customer rate
3 Measures That Support Growth of B-to-B Business
33

Manufacturing/construction
Medical/nursing care
Other
Manufacturing/construction
Medical/nursing care
Other
Increase the Number of Customers(Primarily in Manufacturing and Medical/Nursing Care)
34
FY5/2014 actual FY5/2015 target
Develop
approx. 170,000companies
in manufacturing/construction and medical/nursing care fields
As of the end of November 2014
More than 90,000 companieshave been developed

0
2
4
6
8
10
12
1Q 1H 9 months Full year
FY5/2014 actual
FY5/2015 actual/plan
0
5
10
15
20
25
30
1Q 1H 9 months Full year
FY5/2014 actual
FY5/2015 actual/plan
Net Sales in Growth Areas Continue to Expand
35
MRO business’s net sales at ASKUL Group
FY5/2015 target
20% growth¥34.0 billion
*Including sales through LOHACO
(¥billion) Net sales of the medical business
FY5/2015 target
13% growth ¥11.4 billion
*Including products sold through LOHACO (LOHACO DRUG pharmaceuticals, etc.)
(¥billion)

The number of customers in manufacturing/construction and medical/nursing care expanded
Focus on offering new products targeting these customers in all categories
20
21
22
23
24
25
26
27
FY5/2014 1H FY5/2015 1H
+¥2.1 billion
*Excluding sales through LOHACO
Trend of Living Supplies Net Sales(B-to-B Business)
Speed of growth of existing categories led by living supplies has been
accelerated36
(¥billion)

B-to-B business advancing towards development of new markets and further
bolstering of profits37

38
Appendix

100
110
120
130
FY5/2013 FY5/2014 FY5/2015
Trend in FY5/2015 1H Consolidated Net Sales
Marked a record high
Achieved net sales exceeding
¥130.0 billion
39
(¥billion)

Amount YoY change Amount YoY change(¥billio n) (%) (¥billio n) (%)
OA&PC 41.4 103.8 42.8 103.3
Stationery 25.4 107.3 27.3 107.8
Living Supplies 27.2 120.4 33.2 122.2
Furniture 8.7 103.2 9.5 108.3Others
(Medical, etc.) 8.1 112.7 9.2 113.2
Total 111.0 108.9 122.2 110.1
1H FY5/2014 1H FY5/2015
40
FY5/2015 1H Net Sales by Product Category
Non-consolidated net sales were also
a record
Positive growthin all categories
Non-consolidated

34
31
26
16
1 25
810
12
1922
0
5
10
15
20
25
30
5/20045/2005
5/20065/2007
5/20085/2009
5/20105/2011
5/20125/2013
5/2014
11/2014
0
10
20
30
40
50
60
70
80
FY5/04 FY5/05 FY5/06 FY5/07 FY5/08 FY5/09 FY5/10 FY5/11 FY5/12 FY5/13 FY5/14 FY5/15
SOLOEL ARENA Expanding Steadily
4.28.5
14.9
22.4
29.734.5
38.745.1
53.4
61.6
71.0
Sales increased 15.2% on year, exceeding full-year plan of 12.7%41
SOLOELARENA
SOLOELEnterprise
ASKULInternet
Shop
LOHACO
Medium-sized companies
Large-sized companies
Small- to medium-sized
offices
Individuals
(¥billion)
1H FY5/2014 sales ¥33.5 billion
SOLOEL ARENA , etc. Sales Trend
1H FY5/2015 sales ¥38.6 billion; YoY change +15.2%
FY5/2015 plan
¥80.0 billion
Cumulative Total of Registered Companies at SOLOEL ARENA, etc.
(thousand companies)

20
25
30
FY5/2013 FY5/2014 FY5/2015
FY5/2015 1H Trend in Consolidated Gross Profit
42
(¥billion)
Marked a record high
Steadily accumulating profit
reflecting sales increase

Gross profit: ¥28.6 billion YoY change: +¥2.0 billion
Gross profit margin: 21.7% YoY change: -0.6 p.p.; gap with the plan: -0.2 p.p.
Declined temporarily due to increase in cost of sales reflecting the weaker yen and higher raw material price as well as LOHACO’s pricing strategy → The latest figure has improved significantly
SG&A expenses: ¥27.0 billion YoY change: +¥1.8 billion
Ratio of SG&A expenses to net sales: 20.5% YoY change: -0.6 p.p.; gap with the plan: -0.2 p.p.
Normalized and satisfactory due to favorable impact of lower fixed cost ratio thanks to cost reduction and sales increase and improvement in logistics productivity, which had worsened temporarily
(Ref.) Advertising and sales promotion expenses: ¥950 million
《Appendix》 Consolidated Gross Profit, SG&A Expenses, Capital Expenditures
Capital expenditures: ¥1.6 billion (Annual plan: ¥6.3 billion)
(Major investment) ASKUL Logi PARK Fukuoka logistics base enhancement ¥0.5 billion
(Ref.) Depreciation and amortization of software: ¥2.0 billion (Annual plan: ¥4.1 billion) 43

《Appendix》
44
(1) Share of orders placed on the Internet in net sales
1H FY5/2014 1H FY5/2015 YoY change
Orders via the Internet 73.1% 76.1% +3.0 p.p.
Other 26.9% 23.9% -3.0 p.p.
Note 1: The percentages above are based on orders placed.
Notes:
1. The figures above are the results for the month of November each year.
2. Net sales of original products used as the numerators in calculating the shares in net sales do not include net sales of original copier paper.
3. The figures for the number of original products do not include the products listed in Medical & Care Catalogs and Medical Pro Catalogs.
(items)(2) ASKUL original productsNovember 2013(single month)
November 2014(single month)
YoY change
Number of original products 5,113 5,863 +750
Share in net sales 16.3% 18.6% +2.3p.p.

45
《Appendix》
Construction in progress Note 2 252 733 290.6%
Software in progress Note 2 68 276 406.6%
(¥million)
Item1H FY5/2014 1H FY5/2015
Amount Amount YoY change
[Capital expenditures] 20,648 1,652 8.0%
Property, plant and equipment 19,573 977 5.0%
Intangible assets 1,075 674 62.8%
Notes:
1. Capital expenditures are stated on an accrual basis and do not reflect reductions.
2. Construction in progress and software in progress partially include consumption and other taxes.
(3) Capital Expenditures