fy19 budget final version - charlottesville city schools
TRANSCRIPT


TABLE OF CONTENTS INTRODUCTION: Page
Introduction to 2018– 2019 School Board Members and City Councilors ............................................................1-3 Organization Chart .....................................................................................................4 Budget Development Calendar ..................................................................................5 Charter and Code of Laws ………………………………………………………….6 Budget Development Process ....................................................................................7 Summary of Changes ................................................................................................8-9
ALL FUNDS REVENUES:
2018-2019 Total Revenues Chart Detailed Revenue Summary ......................................................................................10-13
ALL FUNDS EXPENDITURES: 2018-2019 Approved Budget Chart
2016-2017 Expenditures by State Reporting Chart Expenditure Summary ..............................................................................................14-22
GENERAL FUND REVENUES: Revenue Comparison Chart Detailed Revenue Summary ......................................................................................23-26 GENERAL FUND EXPENDITURES: Expenditure Comparison Chart Expenditure Summary ............................................................................................... 27-30 EXPENDITURES BY BUDGET CENTER:
Charlottesville High School .......................................................................................31 Buford Middle School................................................................................................32 Walker Upper Elementary School .............................................................................33 Burnley-Moran Elementary School ...........................................................................34 Clark Elementary School ...........................................................................................35 Greenbrier Elementary School ...................................................................................36 Jackson-Via Elementary School ................................................................................37 Johnson Elementary School .......................................................................................38 Venable Elementary School .......................................................................................39 Preschool ....................................................................................................................40 Virtual Education ......................................................................................................41 Office of the Superintendent .....................................................................................41 Division-wide Instruction .........................................................................................42 Student Services and Special Education ....................................................................43 Division-wide Media ................................................................................................44 Vocational Education ................................................................................................44 Fine and Performing Arts...........................................................................................45 English as a Second Language ..................................................................................45

Table of Contents Con’t Page
Gifted Education ........................................................................................................46 AVID/Scholars ..........................................................................................................46 Instructional Technology ..........................................................................................47 Student Achievement and Program Evaluation ........................................................47 Leadership Coordinators ...........................................................................................48 Technical Support ......................................................................................................48 Division-wide Health and PE.....................................................................................49
Teacher Mentor .........................................................................................................49 Administrative Support Services ..............................................................................50 School Board ..............................................................................................................50
Community Relations ...............................................................................................51 Athletic Department ..................................................................................................51 Lugo–McGinness Academy.......................................................................................52
Finance ......................................................................................................................53 Human Resources .....................................................................................................54 Housekeeping ............................................................................................................55 Maintenance and Energy Management ......................................................................55 ENROLLMENT PROJECTIONS AND HISTORICAL DATA: System-wide Enrollment Projections 2018-2019 ......................................................56-57 Comparison of September Enrollment to Projections ...............................................58 Fall Membership by School .......................................................................................59-63 POSITION CONTROL CHART ......................................................................................64-65 POSITION CONTROL SUMMARY ................................................................................66 POSITION CONTROL CHARTS BY BUDGET CENTER ...........................................67-92 OTHER FUNDS - REVENUES ..........................................................................................93-95 EXPENDITURES BY BUDGET CENTER: Text-media .................................................................................................................96 School Nutrition .........................................................................................................96 C.L.A.S.S. ..................................................................................................................97 MLK-Performing Arts Center....................................................................................97 Adult Education ........................................................................................................98 Prevention, Intervention, and Remediation ...............................................................98 Technology Replacement Fund ................................................................................99 Uniform Replacement ...............................................................................................99 Musical Instruments ...................................................................................................99 Boyd Tinsley .............................................................................................................99 Walker AVID Tutors .................................................................................................100 WALK Program – General Fund ...............................................................................100 WALK Program - CHS ..............................................................................................100

Table of Contents Con’t Page WALK Program – General Fund ...............................................................................100 WALK Program - CHS ..............................................................................................100 i3 Grant ......................................................................................................................101 WALK Program – Restricted Donation ....................................................................101 AVID..........................................................................................................................101 Reading & Writing - Venable ....................................................................................102 Dental Grant ...............................................................................................................102 Hospital Education .....................................................................................................102 Blue Ridge Detention Center .....................................................................................103 Virginia Preschool .....................................................................................................103 SOL Algebra Readiness .............................................................................................104 PALS ..........................................................................................................................104 Project Graduation .....................................................................................................104 Governor’s Youth Academy ......................................................................................105 Governor’s School .....................................................................................................105 National Board Incentive ...........................................................................................106 Medicaid ....................................................................................................................106 The One Club .............................................................................................................106 School Equipment Security ........................................................................................106 Title 1 – Improving Basic Programs .........................................................................107 Title 1, Part D – Neglected or Delinquent ................................................................107 Title II, Part A – Teacher Quality .............................................................................108
Title III, Part A – Limited English Proficiency .........................................................108 Title III-A Immigrant and Youth ...............................................................................109 Instructional Program Improvement ..........................................................................109
Title VI-B Flow Through ...........................................................................................109 Title IV-B 21st Century ..............................................................................................110 Title I Workforce Inv. Act – Carl Perkins ................................................................110 Special Education Preschool ......................................................................................110 Homeless Assistance .................................................................................................111 Project Ease ................................................................................................................111 Regional and Miscellaneous Grants...........................................................................111 STANDARDS OF QUALITY COMPARISONS………………………………………112-116 PAY TABLES, HOURLY RATES, SUPPLEMENTS…………………………………117-176 GLOSSARY………………………………………………………………………………177-185
NON-DISCRIMINATION STATEMENT The Charlottesville City School Board is committed to nondiscrimination with regard to sex, gender, race, color, national origin, disability, religion, ancestry, age, marital or veteran’s status, physical or mental genetic information, sexual orientation, gender identity or expression, or any classification protected by applicable law. Personnel decisions shall be based on merit and the ability to perform the essential functions of the job, with or without reasonable accommodation.

Dear community members,
Thank you for your interest in Charlottesville City Schools. We offer neighborhood schools with a global orientation, preparing our students not only for post‐secondary education but for life. Small class sizes promote a collaborative climate, where each child can build a solid academic foundation while developing his or her unique interests and strengths. With extraordinary fine arts, the latest STEM technologies, a computer for every student, and more, we are White House‐certified to be “future‐ready” and a charter member of the League of Innovative Schools.
Behind this success is an exceptional staff. Based on numerous studies, the quality of teaching is widely considered to be the single biggest impact on student growth. Consequently, we want to continue to attract, retain, and support excellent educators. But the reality is that our nation is facing a teacher shortage. We find ourselves competing for top talent not only with other school divisions, but with other industries. In light of this, I am delighted to note that this budget reflects a 4% increase for our teachers’ salaries. This additional support complements a strong array of other staff benefits, including excellent health insurance, three personal days, wellness benefits with subsidized gym memberships, support for continuing education, and more. We want to take care of the people who take care of our students.
One way we take care of our students is by supporting the whole child. We have earned state awards and national attention for our roll‐out of the Virginia Tiered System of Supports and Positive Interventions and Supports. In particular, we’ve received praise for the ways we incorporated mental wellness into our system. Increasingly, we are building social and emotional learning into our curriculum, including an innovative classroom pilot at Greenbrier and Clark. Particularly in the wake of last summer’s events in Charlottesville, we are working to make sure that our staff and teachers understand our community’s history, our cultural diversity, and our students’ individuality.
We have an innovative and dynamic school division that, while offering the best in teaching and learning, strives to continuously improve. I greatly appreciate the guidance of our School Board members, the efforts of our exceptional staff, and feedback from involved community members. I especially want to thank the members of the Charlottesville City Council for their ongoing partnership and support of our schools. They recognize that our schools are an asset, one of many reasons why our City is an attractive and vibrant place to live and raise a family.
Thank you for your continued support.
Rosa S. Atkins, Ed.D.Division Superintendent
- 1 -
Charlottesville City School Board Members (2018)
Mr. Juandiego R. Wade, [email protected]
Dr. Sherry Kraft, Vice [email protected]
Mr. James Bryant (interim)[email protected]
Ms. Lisa [email protected]
Ms. Amy S. [email protected]
Ms. Jennifer [email protected]
Ms. Leah W. [email protected]
- 2 -

Charlottesville Officials (2018)
Mr. Maurice JonesCity Manager
Charlottesville City Council
Ms. Nikuyah WalkerMayor
Ms. Heather HillVice-Mayor
Mr. Wes Bellamy
Ms. Kathy Galvin
Mr. Mike Signer
- 3 -

Organizational Chart - Charlottesville City SchoolsJune 2018
School Board
Superintendent
DirectorHuman
Resources
DirectorStudent
Services and Achievement
Associate Superintendent Curriculum &
Instruction
Principals Director Technology
Community Relations -
Administrative Support Services
-Housekeeping
-Nutrition
-Inventory
-Performing Arts Center
-Facilities
Coordinator Technology Integration/Instructional
Media Services
Instructional TechnologyResource Teachers
Payroll & Accounting
-Budget,
Accounts Payable &
Receivable/ Grants
AssistantPrincipals
-Teachers and
Staff
Instructional Coaches
Curriculum Coordinators:
Fine & Performing ArtsHealth-PE-Preschool
GiftedLEP
CLASSWorld Languages
Science
Programmatic Coordinators:
Transportation
Federal Programs
School Testing
Coordinators
Coordinators:
Personnel
Program Administrator for Virtual
Education/CTE/AlternativeLearning
SupervisorSpecial
Education and Student Services
Coordinators:Special
Education-
Nurses-
Psychologists-
Social Workers-
Counselors-
AttendanceCounselors
DirectorFinance
Assistant Superintendent
Finance & Operations
Supervisor of Management Information
Systems
Network Engineer-
Lead Technology Support Specialist
-Technology
Support Specialists
- 4 -

Charlottesville City SchoolsFiscal Year 2018‐2019 Budget Development CalendarPurpose Date Time Location
Presentation of proposed budget calendar and public comment Thursday9/7/2017 5 p.m. CHS Media Center
Approval of budget calendar Thursday10/5/2017 5 p.m. CHS Media Center
Review Budget Development Process Thursday11/2/2017 5 p.m. CHS Media Center
Principals meeting - budget process Wednesday11/8/2017 8:30 a.m. Burnley-Moran
Distribution of budget materials to principals and budget holders by 11/17/2017 n/a n/a
Budget meetings completed with budget holders by 11/30/2017 n/a n/a
Budget update and public comment Thursday12/7/2017 5 p.m. CHS Media Center
Budget work session – introduction to budget and the budget documents
Thursday12/14/2016 4 p.m. CATEC
Budget update and public comment Thursday1/4/2018 5 p.m. CHS Media Center
PTO-budget update and input Monday1/8/2018 5:30 p.m. Clark
PTO-budget update and input Wednesday1/10/2018 6 p.m. Buford
TACC meeting-budget update Thursday1/11/2018 4 p.m. Division Admin Office
PTO-budget update and input Thursday1/11/2018 6 p.m. CHS
Budget work session Saturday1/13/2018 8:30 a.m. Walker Media Center
City Council - School Board Work Session Thursday1/25/2018 4p.m. CATEC
PTO presidents lunch Wednesday1/31/2018 12:30 p.m. CATEC
Review of Superintendent’s proposed budget and public hearing Thursday2/1/2018 5 p.m. CHS Media Center
Budget work session Tuesday2/6/2018 4 p.m. Buford
School Board Meeting – Approval of Superintendent’s Proposed Budget
Thursday2/15/2018 5 p.m. CHS Media Center
Presentation of approved 2018-2019 budget to City Council Monday3/5/2018 7 p.m. City Hall
City Council adoption of 2018-2019 budget Tuesday4/10/2018 5:30 p.m. City Hall
- 5 -

Charter and Code of Laws
“It shall be the duty of the school board annually, on or before the thirty-first day of March of each year, or oftener if deemed necessary by the city council, to submit to the city council, in writing, a classified report, as prescribed by the city council, of all expenditures and a classified estimate of what funds will be needed for the proper maintenance and growth of the public schools of the city and to request the city council to make provisions by appropriation or levy for the same.”
Charter and Code of Laws, City of Charlottesville, Va., Chapter 27, Article 1, Section 27.1.
- 6 -

Budget Development Process
Virginia school law establishes a fiscal year that begins July 1 and ends June 30.Preliminary preparation of the budget document begins in the fall of the school year. The central administration receives information from school board members, principals, staff members, program leaders, parents, and the community regarding needs for the next school year. Revenues for the next year are estimated based on anticipated local, state and federal dollars. An expenditure plan is created based on these anticipated revenues. A proposed budget is presented to the Charlottesville City School Board for review. The school board evaluates the proposed budget, holds meetings to receive comments from the public, and modifies the budget as it sees fit. The Charlottesville School Board submits a proposed school division budget to the Charlottesville City Council by the first week in of each year. The School Board traditionally approves the budget in February of each year; final revisions/adjustments are made by July 15th.
- 7 -

PAGE FROM EXPENSE
DETAILEXPENSE CHANGES STAFF
STAFF, SALARY AND
BENEFIT CHANGES
OPERATING CHANGES
PRIORITY TOTAL
Maintain competitive position 1,219,385
various 1,190,207various 295,929various (307,945)various Decrease Hybrid Disability rate 0.05 percentage points (846)various 5% increase in health insurance 253,005
various 53,654various Adjust the School's Hourly & FICA 378various Adjustment to Maintain 3 Open Positions (264,997)
Program additions, enhancements, expansions, reductions 1,135,797
Adjust the Athletic Director Pay Table 15,278various Add 6 FTE- IA's to 2nd grade for each elementary 6.00 156,793
Add 1 FTE - CHS - Engineering Teacher 1.00 69,051Add 1 FTE - Restore LMA Admin Tech 1.00 8,528Add 1 FTE World Language Elem Teacher 1.00 69,051Add 1 FTE Art Teacher 1.00 69,051Add to Existing Network Security System 60,000Add for iSTEM Supplies 5 - 12 10,000Add 1 FTE - Teacher to ESL Program 1.00 69,051Add .5 FTE for Social Worker 0.50 34,525Add 1 FTE - Custodial Floater 1.00 41,643Add 1 FTE - Senior Network Engineer 1.00 118,657Add 1 FTE -iSTEM Teacher 1.00 76,464Add .5 FTE - Student Assistance Program Counselor 0.50 34,525"One Grand Teacher" Program (200 teachers @ $600) 120,000Add 1 FTE - Planning Position for Specialty Academy 1.00 120,280Increase Master and Doctorate Degrees Stipends 106,331Add 1 FTE - Technology Support Specialist 1.00 88,613Add 1 FTE - CHS Test Coord/Lead Health PE Moves 1.00 24,912Move 1.7 FTE iSTEM Staff to General Fund due to iSTEM grant ends 6/30/2018 1.30 143,914 (105,870)Reduce 2 FTE - Helpdesk Position -2.00 (81,498)Reduce 1 FTE - Administrative Position -1.00 (113,503)
Implementation of K-12 staffing formula 139,404
Walker Teacher 1.00 69,051Buford Teacher (net with extra section savings) 2.00 70,353
Other: Contracts and miscellaneous services 603,196
49 150,32554 Maintenance and Facility contract - City 130,32249 Use of Fund Balance- Funds for Capital and Growth Needs 358,14542 Piedmont Regional Education Program (56,829)5343 Vocational education contract - CATEC (7,866)
15,825various Increase School Operating Costs for Enrollment 8,172
various Other small contract and all other line item changes 5,102
Total Staff and Expense Changes 19.30 2,530,456 567,326 3,097,782
Move eligible Teachers up one step plus 2.75% - average increase 4%
City School Garden
Move eligible Staff up one step plus .75% - average increase 2%
Charlottesville City Schools2018-2019 APPROVED GENERAL FUND BUDGET
Changes to ExpendituresFrom the 2017-2018 Revised General Fund Budget
July 9, 2018
Decrease Retirement System rate 5.47 percentage points
Transportation contracts - City Standard Contract increase, Other contracts
Employee Wellness and Retiree Payout Benefits (Service Credit, Sick Leave, Health Insurance Coverage)
- 8 -

REVENUE CHANGES TOTAL CHANGE
CITY OF CHARLOTTESVILLE24 City appropriation 2,667,59824 Transfer to Nutrition 0
Transfer to Remediation 024 Transfer to WALK 024 Transfer to Adult Education 8,043
Transfer to Virginia Preschool 0
COMMONWEALTH OF VIRGINIA24,25 SOQ funding (projected FY2017 ADM of 4,047 from projected FY2016 ADM of 4,025) 236,053
Composite Index Reduction from .6590 to .6772 (475,881)NEW funding restricted for additional instructional positions 0
24,25 Change in Categorical funding 323,687
FEDERAL0
TUITION AND OTHER SOURCES25 PVCC Dual Enrollment - Tuition Reimbursement 025 Increase non-resident tuition (19,863)
Total Revenue Change 3,097,782
BALANCE (0)
2018-2019 APPROVED GENERAL FUND BUDGETChanges to Revenues
From the 2017-2018 Revised General Fund BudgetJuly 9, 2018
- 9 -

ALL FUNDSREVENUES
- 10 -

64.2%
25.3%
4.7% 5.8%
TOTAL REVENUES2018 - 2019 Approved Budget
City State Fees/Other Federal
- 11 -

CHARLOTTESVILLE CITY SCHOOLS2018-2019 ALL FUNDS OPERATING BUDGET
REVENUE SUMMARY
REVENUE SOURCE Gen Fund Sp. Revenue Gen Fund Sp. Revenue ChangeBudget Budget Total Budget Budget Budget Total Budget 2017-2018 to %
2017-2018 2017-2018 2017-2018 2018-2019 2018-2019 2018-2019 2018-2019 Change
City FundsCity Appropriation $48,858,135 $2,472,469 $51,330,604 $51,533,776 $2,464,426 $53,998,202 $2,667,598
TOTAL CITY FUNDS $48,858,135 $2,472,469 $51,330,604 $51,533,776 $2,464,426 $53,998,202 $2,667,598 5.20%
State FundsBasic Aid SOQ $6,107,995 $6,107,995 $5,972,252 $5,972,252 -$135,743Sales Tax 5,000,478 5,000,478 5,230,931 5,230,931 230,453Compensation Supplement 63,136 63,136 0 0 -63,136Vocation Education 78,527 78,527 96,328 96,328 17,801Gifted & Talented Education 68,533 68,533 66,480 66,480 -2,053Special Education 741,011 741,011 620,025 620,025 -120,986Retirement - VRS Retirement 900,921 900,921 833,031 833,031 -67,890VRS - Group Life 27,128 27,128 25,778 25,778 -1,350Social Security 392,636 392,636 377,170 377,170 -15,466Remedial Summer School 181,604 181,604 113,765 113,765 -67,839At Risk 302,525 302,525 241,575 241,575 -60,950K-3 Primary Class Size Reduction 537,634 537,634 505,047 505,047 -32,587CATEC Pass Through Funding 131,972 131,972 135,394 135,394 3,422Homebound 9,918 9,918 6,204 6,204 -3,714Regional Tuition 559,559 559,559 516,610 516,610 -42,949English as a 2nd Language 163,357 163,357 171,779 171,779 8,422Foster Care Children 154,886 154,886 132,109 132,109 -22,777Teacher Mentor 2,949 2,949 3,309 3,309 360No Loss Funding in FY19 (Composite Index Hold Harmless) 0 0 407,633 407,633 407,633Supplemental Lottery 391,379 0 391,379 414,587 0 414,587 23,208Text-media 156,740 156,740 136,609 136,609 -20,131School Nutrition 27,920 27,920 34,168 34,168 6,248Adult Education 302,000 302,000 91,117 91,117 -210,883Prevention, Intervention and Remediation 298,403 298,403 291,697 291,697 -6,706Hospital Education 1,929,469 1,929,469 1,944,000 1,944,000 14,531Blue Ridge Detention Center 1,053,088 1,053,088 1,038,062 1,038,062 -15,026Virginia Preschool Initiative 490,000 490,000 532,875 532,875 42,875VPSA Technology 280,000 280,000 280,000 280,000 0School Equipment Security 68,800 68,800 68,800 68,800 0Governor's Youth Academy 67,889 67,889 67,889 67,889 0PALS 59,012 59,012 58,266 58,266 -746SOL Algebra Readiness 25,851 25,851 25,851 25,851 0National Board Incentive 17,484 17,484 17,484 17,484 0Governor's School 14,985 14,985 14,985 14,985 0Project Graduation 8,162 8,162 4,069 4,069 -4,093Medicaid 380,941 357,273 738,214 410,941 367,544 778,485 40,271i-3 Grant 320,447 320,447 0 0 -320,447The One Club 1,900 1,900 1,900 1,900 0
Total State Funds $16,197,089 $5,479,423 $21,676,512 $16,280,948 $4,975,316 $21,256,264 -$420,248 -1.94%
- 12 -

CHARLOTTESVILLE CITY SCHOOLS2018-2019 ALL FUNDS OPERATING BUDGET
REVENUE SUMMARY
REVENUE SOURCE Gen Fund Sp. Revenue Gen Fund Sp. Revenue ChangeBudget Budget Total Budget Budget Budget Total Budget 2017-2018 to %
2017-2018 2017-2018 2017-2018 2018-2019 2018-2019 2018-2019 2018-2019 Change
Federal FundsImpact Aid $18,000 $18,000 $18,000 $0 $18,000 $0Advanced Placement 6,000 6,000 6,000 6,000 0School Nutrition 1,438,422 1,438,422 1,593,416 1,593,416 154,994School Nutrition - In Kind Commodities 95,000 95,000 88,707 88,707 -6,293Adult Education 309,000 309,000 0 0 -309,000Title I - Improving Basic Programs 1,467,743 1,467,743 1,512,367 1,512,367 44,624Title II, Part A - Teacher Quality 248,083 248,083 257,737 257,737 9,654Title III, Part A - Limited English Proficiency 50,407 50,407 50,407 50,407 0Title II-A Immigrant and Youth 16,806 16,806 16,806 16,806 0Title IV-B 21st Century 199,530 199,530 199,530 199,530 0Title VI-B Special Education 951,020 951,020 967,600 967,600 16,580Carl Perkins 84,994 84,994 84,994 84,994 0Special Education - Preschool 35,440 35,440 36,677 36,677 1,237Instructional Program Improvement 30,000 30,000 30,000 30,000 0Homeless Assistance 27,493 27,493 27,493 27,493 0Project Ease 6,464 6,464 6,464 6,464 0
TOTAL FEDERAL FUNDS $24,000 $4,960,402 $4,984,402 $24,000 $4,872,199 $4,896,199 -$88,203 -1.77%
Tuition and Other SourcesBuilding Rent $22,000 $22,000 $22,000 $0 $22,000 $0Tuition 349,863 349,863 330,000 0 330,000 -19,863PREP - Charges for Services 536,686 536,686 536,686 0 536,686 0Sale of Property/Property Damage 1,000 1,000 1,000 0 1,000 0Dual Enrollment 184,361 184,361 184,361 0 184,361 0Indirect Cost Recovery/Rebates 120,000 120,000 120,000 0 120,000 0Text-media - Interest on Investments 12,249 12,249 12,249 12,249 0School Nutrition - Meal Charges 477,905 477,905 455,564 455,564 -22,341CLASS - Tuition Fees 818,335 818,335 818,335 818,335 0MLK Performing Arts Center - Fees 114,653 114,653 116,512 116,512 1,859Adult Education 148,727 148,727 0 0 -148,727Boyd Tinsley 74,959 74,959 74,959 74,959 0Dental Grant 10,034 10,034 10,034 10,034 0Walker AVID Tutors 48,404 48,404 48,404 48,404 0WALK Program 216,423 216,423 219,028 219,028 2,605Regional and Miscellaneous Grants/Other 189,912 189,912 189,912 189,912 0Use of Fund Balance 267,851 60,734 328,585 625,996 146,981 772,977 444,392
TOTAL TUITION & OTHER SOURCES $1,481,761 $2,172,335 $3,654,096 $1,820,043 $2,091,978 $3,912,021 $257,925 7.06%
TOTAL REVENUE $66,560,985 $15,084,629 $81,645,614 $69,658,767 $14,403,919 $84,062,686 $2,417,072 2.96%
- 13 -

ALL FUNDSEXPENDITURES
- 14 -

56.8%
21.3%
21.9%
TOTAL EXPENDITURES2018 - 2019 Approved Budget
Personnel Services Employee Benefits Operating Costs
- 15 -

73.2%
9.7%
5.2%4.4%
3.4% 4.0%
ExpendituresBy State Reporting Category
2016-2017 Annual School Report
Instruction Operation and MaintenanceAdministration, Attendance and Health TechnologyPupil Transportation School Nutrition
- 16 -

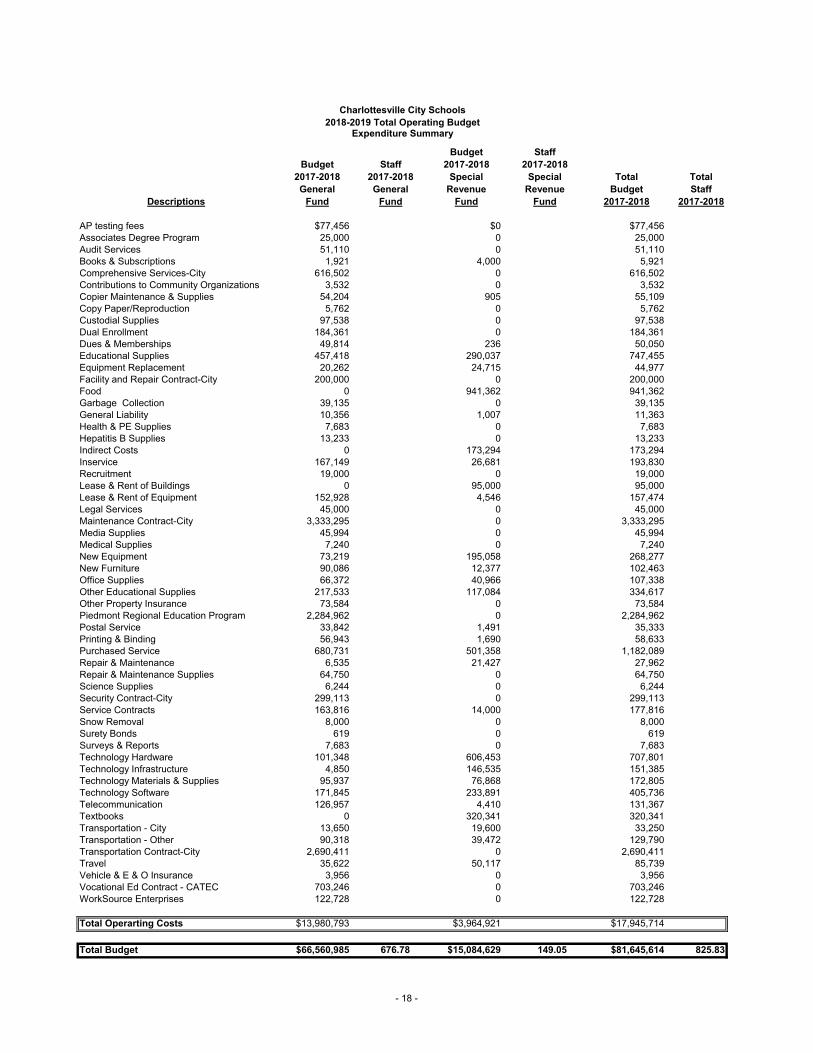
Charlottesville City Schools2018-2019 Total Operating Budget
Expenditure Summary
Budget StaffBudget Staff 2017-2018 2017-2018
2017-2018 2017-2018 Special Special Total TotalGeneral General Revenue Revenue Budget Staff
Descriptions Fund Fund Fund Fund 2017-2018 2017-2018
Board Salary $32,300 0.00 $0 0.00 $32,300 0.00Superintendent 204,087 1.00 0 0.00 204,087 1.00Associate Superintendent 173,164 1.00 0 0.00 173,164 1.00Assistant Superintendent 144,114 1.00 0 0.00 144,114 1.00Director 429,924 3.80 110,148 1.00 540,072 4.80Principal 987,218 9.80 0 0.00 987,218 9.80Assistant Principal 1,141,141 15.00 0 0.00 1,141,141 15.00Supervisor 273,427 3.00 0 0.00 273,427 3.00Athletic Director 69,692 1.00 0 0.00 69,692 1.00Coordinator 705,607 8.25 758,231 9.25 1,463,838 17.50Behavior/Transition Specialist 98,217 1.00 0 0.00 98,217 1.00Site Director 0 0.00 327,913 6.00 327,913 6.00Network Engineer 74,989 1.00 0 0.00 74,989 1.00Teacher - General Education 18,593,251 321.10 3,607,290 56.11 22,200,541 377.21Teacher - Special Education 3,464,213 59.87 567,989 9.86 4,032,202 69.73Teacher - Vocational Education 393,786 6.60 0 0.00 393,786 6.60Teacher - Technology Integration 284,396 5.00 0 0.00 284,396 5.00Teacher - Instructional Coach 341,228 5.00 0 0.00 341,228 5.00Social Worker 278,467 4.20 0 0.00 278,467 4.20Reading Intervention 0 0.00 290,303 5.00 290,303 5.00Librarian 624,774 10.00 0 0.00 624,774 10.00Psychologist 254,875 4.00 0 0.00 254,875 4.00Nurse 412,947 10.00 0 0.00 412,947 10.00Counselor 1,113,758 19.00 0 0.00 1,113,758 19.00Home School Counselor 157,078 3.00 0 0.00 157,078 3.00Athletic Trainer 73,827 1.00 0 0.00 73,827 1.00Instructional Assistant - General Education 1,194,470 56.00 326,821 12.91 1,521,291 68.91Instructional Assistant - Special Education 725,534 34.00 219,625 10.91 945,159 44.91Lead Technology Specialist 70,654 1.00 0 0.00 70,654 1.00Data Systems Technician 573,821 10.00 0 0.00 573,821 10.00Administrative Technician 1,293,153 26.28 284,762 6.00 1,577,915 32.28Reprographics Specialist 34,672 0.75 0 0.00 34,672 0.75Athletic Equip. & Facilities Mgr. 52,238 1.00 0 0.00 52,238 1.00Secretary - Division Wide 41,718 1.00 0 0.00 41,718 1.00Secretary - Guidance 86,435 3.00 0 0.00 86,435 3.00Secretary - Media 47,026 1.00 0 0.00 47,026 1.00Secretary - Principal 171,886 5.00 0 0.00 171,886 5.00Craftsman 126,581 2.00 0 0.00 126,581 2.00Custodian/Foreman 46,850 0.50 0 0.00 46,850 0.50Custodian 1,408,853 40.63 0 0.00 1,408,853 40.63Nutrition Worker 0 0.00 585,762 32.01 585,762 32.01Laborer 37,500 0.00 0 0.00 37,500 0.00Substitute Teacher 585,970 0.00 50,000 0.00 635,970 0.00Substitute Instructional Assistant 29,500 0.00 0 0.00 29,500 0.00Substitute Custodian 60,000 0.00 0 0.00 60,000 0.00Hourly Pay 927,430 0.00 1,451,830 0.00 2,379,260 0.00
Total Personnel Services $37,840,771 676.78 $8,580,674 149.05 $46,421,445 825.83
Social Security $2,780,679 $630,135 $3,410,814Retirement - VRS 6,053,684 1,017,123 7,070,807Disability 61,971 2,929 64,900Employer Contribution to Deferred Compensa 16,019 0 16,019Health - Employer Contribution (FLEXCOMP) 4,781,979 807,811 5,589,790Group Life Insurance 534,250 81,036 615,286Unemployment 96,000 0 96,000Workers Compensation 203,560 0 203,560Sick Leave and Service Credit Benefit 110,000 0 110,000Employee Wellness 91,191 0 91,191Retiree Health Insurance 10,088 0 10,088
Total Employee Benefits $14,739,421 $2,539,034 $17,278,455
- 17 -
Charlottesville City Schools2018-2019 Total Operating Budget
Expenditure Summary
Budget StaffBudget Staff 2017-2018 2017-2018
2017-2018 2017-2018 Special Special Total TotalGeneral General Revenue Revenue Budget Staff
Descriptions Fund Fund Fund Fund 2017-2018 2017-2018
AP testing fees $77,456 $0 $77,456Associates Degree Program 25,000 0 25,000Audit Services 51,110 0 51,110Books & Subscriptions 1,921 4,000 5,921Comprehensive Services-City 616,502 0 616,502Contributions to Community Organizations 3,532 0 3,532Copier Maintenance & Supplies 54,204 905 55,109Copy Paper/Reproduction 5,762 0 5,762Custodial Supplies 97,538 0 97,538Dual Enrollment 184,361 0 184,361Dues & Memberships 49,814 236 50,050Educational Supplies 457,418 290,037 747,455Equipment Replacement 20,262 24,715 44,977Facility and Repair Contract-City 200,000 0 200,000Food 0 941,362 941,362Garbage Collection 39,135 0 39,135General Liability 10,356 1,007 11,363Health & PE Supplies 7,683 0 7,683Hepatitis B Supplies 13,233 0 13,233Indirect Costs 0 173,294 173,294Inservice 167,149 26,681 193,830Recruitment 19,000 0 19,000Lease & Rent of Buildings 0 95,000 95,000Lease & Rent of Equipment 152,928 4,546 157,474Legal Services 45,000 0 45,000Maintenance Contract-City 3,333,295 0 3,333,295Media Supplies 45,994 0 45,994Medical Supplies 7,240 0 7,240New Equipment 73,219 195,058 268,277New Furniture 90,086 12,377 102,463Office Supplies 66,372 40,966 107,338Other Educational Supplies 217,533 117,084 334,617Other Property Insurance 73,584 0 73,584Piedmont Regional Education Program 2,284,962 0 2,284,962Postal Service 33,842 1,491 35,333Printing & Binding 56,943 1,690 58,633Purchased Service 680,731 501,358 1,182,089Repair & Maintenance 6,535 21,427 27,962Repair & Maintenance Supplies 64,750 0 64,750Science Supplies 6,244 0 6,244Security Contract-City 299,113 0 299,113Service Contracts 163,816 14,000 177,816Snow Removal 8,000 0 8,000Surety Bonds 619 0 619Surveys & Reports 7,683 0 7,683Technology Hardware 101,348 606,453 707,801Technology Infrastructure 4,850 146,535 151,385Technology Materials & Supplies 95,937 76,868 172,805Technology Software 171,845 233,891 405,736Telecommunication 126,957 4,410 131,367Textbooks 0 320,341 320,341Transportation - City 13,650 19,600 33,250Transportation - Other 90,318 39,472 129,790Transportation Contract-City 2,690,411 0 2,690,411Travel 35,622 50,117 85,739Vehicle & E & O Insurance 3,956 0 3,956Vocational Ed Contract - CATEC 703,246 0 703,246WorkSource Enterprises 122,728 0 122,728
Total Operarting Costs $13,980,793 $3,964,921 $17,945,714
Total Budget $66,560,985 676.78 $15,084,629 149.05 $81,645,614 825.83
- 18 -

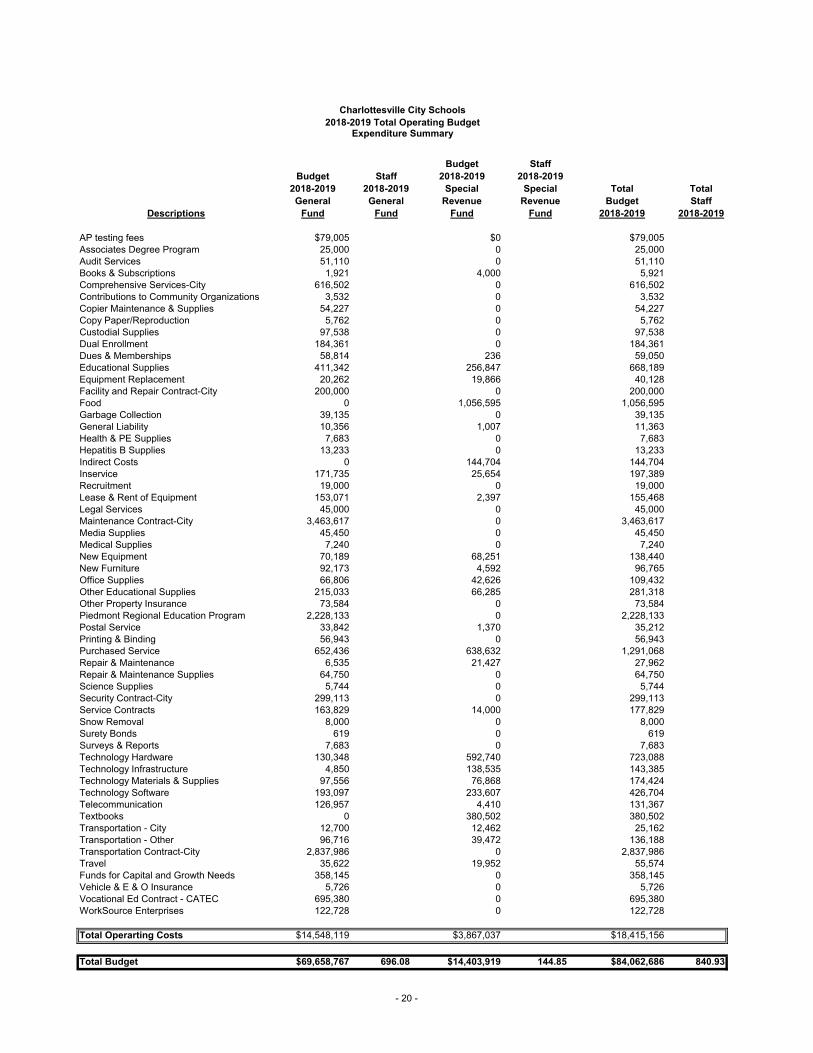
Charlottesville City Schools2018-2019 Total Operating Budget
Expenditure Summary
Budget StaffBudget Staff 2018-2019 2018-2019
2018-2019 2018-2019 Special Special Total TotalGeneral General Revenue Revenue Budget Staff
Descriptions Fund Fund Fund Fund 2018-2019 2018-2019
Board Salary $32,300 0.00 $0 0.00 $32,300 0.00Superintendent 204,087 1.00 0 0.00 204,087 1.00Associate Superintendent 176,627 1.00 0 0.00 176,627 1.00Assistant Superintendent 146,996 1.00 0 0.00 146,996 1.00Director 438,522 3.80 112,351 1.00 550,873 4.80Principal 1,006,962 9.80 0 0.00 1,006,962 9.80Assistant Principal 1,163,964 15.00 0 0.00 1,163,964 15.00Supervisor 278,896 3.00 0 0.00 278,896 3.00Athletic Director 83,281 1.00 0 0.00 83,281 1.00Coordinator 791,903 9.75 625,830 7.75 1,417,733 17.50Behavior/Transition Specialist 100,181 1.00 0 0.00 100,181 1.00Site Director 0 0.00 332,471 6.00 332,471 6.00Network Engineer 235,453 3.00 0 0.00 235,453 3.00Teacher - General Education 19,290,574 327.10 3,540,676 54.41 22,831,250 381.51Teacher - Special Education 3,599,642 59.87 582,923 9.86 4,182,565 69.73Teacher - Vocational Education 409,537 6.60 0 0.00 409,537 6.60Teacher - Technology Integration 390,015 6.80 0 0.00 390,015 6.80Teacher - Instructional Coach 354,877 5.00 0 0.00 354,877 5.00Social Worker 313,561 4.70 0 0.00 313,561 4.70Reading Intervention 0 0.00 290,303 5.00 290,303 5.00Librarian 648,643 10.00 0 0.00 648,643 10.00Psychologist 259,973 4.00 0 0.00 259,973 4.00Nurse 421,206 10.00 0 0.00 421,206 10.00Counselor 1,157,201 19.00 0 0.00 1,157,201 19.00Home School Counselor 187,316 3.50 0 0.00 187,316 3.50Athletic Trainer 75,304 1.00 0 0.00 75,304 1.00Instructional Assistant - General Education 1,327,051 62.00 333,357 12.91 1,660,408 74.91Instructional Assistant - Special Education 730,895 34.00 224,018 10.91 954,913 44.91Lead Technology Specialist 72,067 1.00 0 0.00 72,067 1.00Data Systems Technician 577,460 9.00 0 0.00 577,460 9.00Administrative Technician 1,349,380 27.28 266,382 5.00 1,615,762 32.28Reprographics Specialist 35,365 0.75 0 0.00 35,365 0.75Athletic Equip. & Facilities Mgr. 53,283 1.00 0 0.00 53,283 1.00Secretary - Division Wide 42,552 1.00 0 0.00 42,552 1.00Secretary - Guidance 88,164 3.00 0 0.00 88,164 3.00Secretary - Media 47,967 1.00 0 0.00 47,967 1.00Secretary - Principal 175,324 5.00 0 0.00 175,324 5.00Craftsman 129,113 2.00 0 0.00 129,113 2.00Custodian/Foreman 47,787 0.50 0 0.00 47,787 0.50Custodian 1,465,914 41.63 0 0.00 1,465,914 41.63Nutrition Worker 0 0.00 597,477 32.01 597,477 32.01Laborer 37,500 0.00 0 0.00 37,500 0.00Substitute Teacher 585,970 0.00 42,453 0.00 628,423 0.00Substitute Instructional Assistant 29,500 0.00 0 0.00 29,500 0.00Substitute Custodian 60,000 0.00 0 0.00 60,000 0.00Hourly Pay 1,015,799 0.00 1,123,690 0.00 2,139,489 0.00
Total Personnel Services $39,638,112 696.08 $8,071,931 144.85 $47,710,043 840.93
Social Security $2,933,080 $594,190 $3,527,270Retirement - VRS 6,155,237 973,738 7,128,975Disability 23,625 2,906 26,531Employer Contribution to Deferred Compensa 16,019 0 16,019Health - Employer Contribution (FLEXCOMP) 5,213,319 814,296 6,027,615Group Life Insurance 494,044 79,820 573,864Unemployment 76,364 0 76,364Workers Compensation 96,000 0 96,000Sick Leave and Service Credit Benefit 248,070 0 248,070Employee Wellness 115,000 0 115,000Retiree Health Insurance 91,191 0 91,191Employee Assistance 10,588 0 10,588
Total Employee Benefits $15,472,536 $2,464,951 $17,937,487
- 19 -
Charlottesville City Schools2018-2019 Total Operating Budget
Expenditure Summary
Budget StaffBudget Staff 2018-2019 2018-2019
2018-2019 2018-2019 Special Special Total TotalGeneral General Revenue Revenue Budget Staff
Descriptions Fund Fund Fund Fund 2018-2019 2018-2019
AP testing fees $79,005 $0 $79,005Associates Degree Program 25,000 0 25,000Audit Services 51,110 0 51,110Books & Subscriptions 1,921 4,000 5,921Comprehensive Services-City 616,502 0 616,502Contributions to Community Organizations 3,532 0 3,532Copier Maintenance & Supplies 54,227 0 54,227Copy Paper/Reproduction 5,762 0 5,762Custodial Supplies 97,538 0 97,538Dual Enrollment 184,361 0 184,361Dues & Memberships 58,814 236 59,050Educational Supplies 411,342 256,847 668,189Equipment Replacement 20,262 19,866 40,128Facility and Repair Contract-City 200,000 0 200,000Food 0 1,056,595 1,056,595Garbage Collection 39,135 0 39,135General Liability 10,356 1,007 11,363Health & PE Supplies 7,683 0 7,683Hepatitis B Supplies 13,233 0 13,233Indirect Costs 0 144,704 144,704Inservice 171,735 25,654 197,389Recruitment 19,000 0 19,000Lease & Rent of Equipment 153,071 2,397 155,468Legal Services 45,000 0 45,000Maintenance Contract-City 3,463,617 0 3,463,617Media Supplies 45,450 0 45,450Medical Supplies 7,240 0 7,240New Equipment 70,189 68,251 138,440New Furniture 92,173 4,592 96,765Office Supplies 66,806 42,626 109,432Other Educational Supplies 215,033 66,285 281,318Other Property Insurance 73,584 0 73,584Piedmont Regional Education Program 2,228,133 0 2,228,133Postal Service 33,842 1,370 35,212Printing & Binding 56,943 0 56,943Purchased Service 652,436 638,632 1,291,068Repair & Maintenance 6,535 21,427 27,962Repair & Maintenance Supplies 64,750 0 64,750Science Supplies 5,744 0 5,744Security Contract-City 299,113 0 299,113Service Contracts 163,829 14,000 177,829Snow Removal 8,000 0 8,000Surety Bonds 619 0 619Surveys & Reports 7,683 0 7,683Technology Hardware 130,348 592,740 723,088Technology Infrastructure 4,850 138,535 143,385Technology Materials & Supplies 97,556 76,868 174,424Technology Software 193,097 233,607 426,704Telecommunication 126,957 4,410 131,367Textbooks 0 380,502 380,502Transportation - City 12,700 12,462 25,162Transportation - Other 96,716 39,472 136,188Transportation Contract-City 2,837,986 0 2,837,986Travel 35,622 19,952 55,574Funds for Capital and Growth Needs 358,145 0 358,145Vehicle & E & O Insurance 5,726 0 5,726Vocational Ed Contract - CATEC 695,380 0 695,380WorkSource Enterprises 122,728 0 122,728
Total Operarting Costs $14,548,119 $3,867,037 $18,415,156
Total Budget $69,658,767 696.08 $14,403,919 144.85 $84,062,686 840.93
- 20 -

Charlottesville City Schools2018-2019 Total Operating Budget
Expenditure Summary
Total Total Total TotalBudget Staff Budget Staff Dollar Staff
Descriptions 2017-2018 2017-2018 2018-2019 2018-2019 Change change
Board Salary $32,300 0.00 $32,300 0.00 $0 0.00Superintendent 204,087 1.00 204,087 1.00 0 0.00Associate Superintendent 173,164 1.00 176,627 1.00 3,463 0.00Assistant Superintendent 144,114 1.00 146,996 1.00 2,882 0.00Director 540,072 4.80 550,873 4.80 10,801 0.00Principal 987,218 9.80 1,006,962 9.80 19,744 0.00Assistant Principal 1,141,141 15.00 1,163,964 15.00 22,823 0.00Supervisor 273,427 3.00 278,896 3.00 5,469 0.00Athletic Director 69,692 1.00 83,281 1.00 13,589 0.00Coordinator 1,463,838 17.50 1,417,733 17.50 -46,106 0.00Behavior/Transition Specialist 98,217 1.00 100,181 1.00 1,964 0.00Site Director 327,913 6.00 332,471 6.00 4,558 0.00Network Engineer 74,989 1.00 235,453 3.00 160,464 2.00Teacher - General Education 22,200,541 377.21 22,831,250 381.51 630,709 4.30Teacher - Special Education 4,032,202 69.73 4,182,565 69.73 150,363 0.00Teacher - Vocational Education 393,786 6.60 409,537 6.60 15,751 0.00Teacher - Technology Integration 284,396 5.00 390,015 6.80 105,619 1.80Teacher - Instructional Coach 341,228 5.00 354,877 5.00 13,649 0.00Social Worker 278,467 4.20 313,561 4.70 35,094 0.50Reading Intervention 290,303 5.00 290,303 5.00 0 0.00Librarian 624,774 10.00 648,643 10.00 23,869 0.00Psychologist 254,875 4.00 259,973 4.00 5,098 0.00Nurse 412,947 10.00 421,206 10.00 8,259 0.00Counselor 1,113,758 19.00 1,157,201 19.00 43,443 0.00Home School Counselor 157,078 3.00 187,316 3.50 30,238 0.50Athletic Trainer 73,827 1.00 75,304 1.00 1,477 0.00Instructional Assistant - General Education 1,521,291 68.91 1,660,408 74.91 139,117 6.00Instructional Assistant - Special Education 945,159 44.91 954,913 44.91 9,754 0.00Lead Technology Specialist 70,654 1.00 72,067 1.00 1,413 0.00Data Systems Technician 573,821 10.00 577,460 9.00 3,639 -1.00Administrative Technician 1,577,915 32.28 1,615,762 32.28 37,847 0.00Reprographics Specialist 34,672 0.75 35,365 0.75 693 0.00Athletic Equip. & Facilities Mgr. 52,238 1.00 53,283 1.00 1,045 0.00Secretary - Division Wide 41,718 1.00 42,552 1.00 834 0.00Secretary - Guidance 86,435 3.00 88,164 3.00 1,729 0.00Secretary - Media 47,026 1.00 47,967 1.00 941 0.00Secretary - Principal 171,886 5.00 175,324 5.00 3,438 0.00Craftsman 126,581 2.00 129,113 2.00 2,532 0.00Custodian/Foreman 46,850 0.50 47,787 0.50 937 0.00Custodian 1,408,853 40.63 1,465,914 41.63 57,061 1.00Nutrition Worker 585,762 32.01 597,477 32.01 11,715 0.00Laborer 37,500 0.00 37,500 0.00 0 0.00Substitute Teacher 635,970 0.00 628,423 0.00 -7,547 0.00Substitute Instructional Assistant 29,500 0.00 29,500 0.00 0 0.00Substitute Custodian 60,000 0.00 60,000 0.00 0 0.00Hourly Pay 2,379,260 0.00 2,139,489 0.00 -239,771 0.00
Total Personnel Services $46,421,445 825.83 $47,710,043 840.93 $1,288,598 15.10
Social Security $3,410,814 $3,527,270 $116,456Retirement - VRS 7,070,807 7,128,975 58,168Disability 64,900 26,531 -38,369Employer Contribution to Deferred Compensa 16,019 16,019 0Health - Employer Contribution (FLEXCOMP) 5,589,790 6,027,615 437,825Group Life Insurance 615,286 573,864 -41,422Unemployment 96,000 76,364 -19,636Workers Compensation 203,560 96,000 -107,560Sick Leave and Service Credit Benefit 110,000 248,070 138,070Employee Wellness 91,191 115,000 23,809Retiree Health Insurance 10,088 91,191 81,103Employee Assistance 0 10,588 10,588
Total Employee Benefits $17,278,455 $17,937,487 $659,032
- 21 -

Charlottesville City Schools2018-2019 Total Operating Budget
Expenditure Summary
Total Total Total TotalBudget Staff Budget Staff Dollar Staff
Descriptions 2017-2018 2017-2018 2018-2019 2018-2019 Change change
AP testing fees $77,456 $79,005 $1,549Associates Degree Program 25,000 25,000 0Audit Services 51,110 51,110 0Books & Subscriptions 5,921 5,921 0Comprehensive Services-City 616,502 616,502 0Contributions to Community Organizations 3,532 3,532 0Copier Maintenance & Supplies 55,109 54,227 -882Copy Paper/Reproduction 5,762 5,762 0Custodial Supplies 97,538 97,538 0Dual Enrollment 184,361 184,361 0Dues & Memberships 50,050 59,050 9,000Educational Supplies 747,455 668,189 -79,266Equipment Replacement 44,977 40,128 -4,849Facility and Repair Contract-City 200,000 200,000 0Food 941,362 1,056,595 115,233Garbage Collection 39,135 39,135 0General Liability 11,363 11,363 0Health & PE Supplies 7,683 7,683 0Hepatitis B Supplies 13,233 13,233 0Indirect Costs 173,294 144,704 -28,590Inservice 193,830 197,389 3,559Recruitment 19,000 19,000 0Lease & Rent of Buildings 95,000 0 -95,000Lease & Rent of Equipment 157,474 155,468 -2,006Legal Services 45,000 45,000 0Maintenance Contract-City 3,333,295 3,463,617 130,322Media Supplies 45,994 45,450 -544Medical Supplies 7,240 7,240 0New Equipment 268,277 138,440 -129,837New Furniture 102,463 96,765 -5,698Office Supplies 107,338 109,432 2,094Other Educational Supplies 334,617 281,318 -53,299Other Property Insurance 73,584 73,584 0Piedmont Regional Education Program 2,284,962 2,228,133 -56,829Postal Service 35,333 35,212 -121Printing & Binding 58,633 56,943 -1,690Purchased Service 1,182,089 1,291,068 108,979Repair & Maintenance 27,962 27,962 0Repair & Maintenance Supplies 64,750 64,750 0Science Supplies 6,244 5,744 -500Security Contract-City 299,113 299,113 0Service Contracts 177,816 177,829 13Snow Removal 8,000 8,000 0Surety Bonds 619 619 0Surveys & Reports 7,683 7,683 0Technology Hardware 707,801 723,088 15,287Technology Infrastructure 151,385 143,385 -8,000Technology Materials & Supplies 172,805 174,424 1,619Technology Software 405,736 426,704 20,968Telecommunication 131,367 131,367 0Textbooks 320,341 380,502 60,161Transportation - City 33,250 25,162 -8,088Transportation - Other 129,790 136,188 6,398Transportation Contract-City 2,690,411 2,837,986 147,575Travel 85,739 55,574 -30,165Unallocated 0 358,145 358,145Vehicle & E & O Insurance 3,956 5,726 1,770Vocational Ed Contract - CATEC 703,246 695,380 -7,866WorkSource Enterprises 122,728 122,728 0
Total Operarting Costs $17,945,714 $18,415,156 $469,442
Total Budget $81,645,614 825.83 $84,062,686 840.93 $2,417,072 15.10
- 22 -

GENERAL FUNDREVENUES
- 23 -
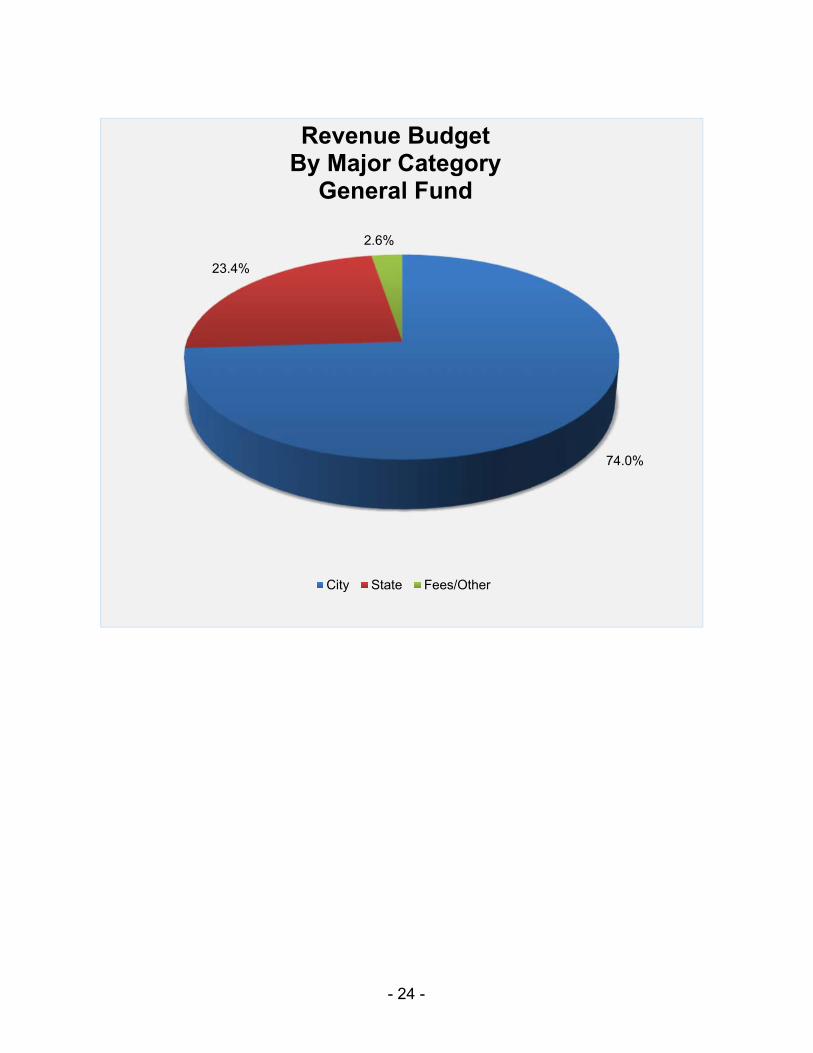
74.0%
23.4%
2.6%
Revenue BudgetBy Major Category
General Fund
City State Fees/Other
- 24 -

CHARLOTTESVILLE CITY SCHOOLS2018-2019 GENERAL FUND OPERATING BUDGET
REVENUE SUMMARYBased on ADM of 4203
Revised $ Change % ChangeBudget Budget 2017-2018 2017-2018
REVENUE SOURCE 2017-2018 2018-2019 2018-2019 2018-2019
City Funds
City Appropriation $51,330,604 $53,998,202 $2,667,598 5.20%
City Funds Transferred Out
Transfer to Text Media -$231,644 -$231,644 $0 0.00%Transfer to Adult Education -276,156 -268,113 8,043 -2.91%Transfer to Walker Academy -15,000 -15,000 0 0.00%Transfer to Musical Instruments -25,000 -25,000 0 0.00%Transfer to Technology Replacement Fund -557,070 -557,070 0 0.00%Transfer to Uniforms -15,000 -15,000 0 0.00%Transfer to Virginia Preschool -610,777 -610,777 0 0.00%Transfer to Scholars -38,000 -38,000 0 0.00%Transfer to Remediation -447,583 -447,583 0 0.00%Transfer to Furniture Replacement -10,000 -10,000 0 0.00%Transfer to School Nutrition -80,000 -80,000 0 0.00%Transfer to WALK -166,239 -166,239 0 0.00%
Total City FundsTransferred Out -$2,472,469 -$2,464,426 $8,043 -0.33%
NET CITY FUNDS - General Fund $48,858,135 $51,533,776 $2,675,641 5.48%
State SOQ Funds
Basic Aid SOQ $6,107,995 $5,972,252 -$135,743 -2.22%Sales Tax 5,000,478 5,230,931 230,453 4.61%Compensation Supplement 63,136 0 -63,136 -100.00%Vocation Education 78,527 96,328 17,801 22.67%Gifted & Talented Education 68,533 66,480 -2,053 -3.00%Special Education 741,011 620,025 -120,986 -16.33%Retirement - VRS Retirement 900,921 833,031 -67,890 -7.54%VRS - Group Life 27,128 25,778 -1,350 -4.98%Social Security 392,636 377,170 -15,466 -3.94%Remedial Summer School 181,604 113,765 -67,839 -37.36%
SOQ Funds That Transfer to Special Revenue Fund:
Remedial Education 298,403 291,697 -6,706 -2.25%Textbooks 156,740 136,609 -20,131 -12.84%
Subtotal State SOQ $14,017,112 $13,764,066 -$253,046 -1.81%
State Categorical and Incentive Based Funds
At Risk $302,525 $241,575 -$60,950 -20.15%K-3 Primary Class Size Reduction 537,634 505,047 -32,587 -6.06%CATEC Pass Through Funding 131,972 135,394 3,422 2.59%Special Education: Homebound 9,918 6,204 -3,714 -37.45% Regional Tuition 559,559 516,610 -42,949 -7.68%English as a 2nd Language 163,357 171,779 8,422 5.16%Foster Care Children 154,886 132,109 -22,777 -14.71%Teacher Mentor 2,949 3,309 360 12.21%No Loss Funding in FY 19 (Composite Index Hold Harmless) 0 407,633 407,633 N/ASupplemental Lottery 391,379 414,587 23,208 5.93%Medicaid 380,941 410,941 30,000 7.88%
- 25 -

CHARLOTTESVILLE CITY SCHOOLS2018-2019 GENERAL FUND OPERATING BUDGET
REVENUE SUMMARYBased on ADM of 4203
Revised $ Change % ChangeBudget Budget 2017-2018 2017-2018
REVENUE SOURCE 2017-2018 2018-2019 2018-2019 2018-2019
Categorical Funds That Transfer to Special Revenue Fund:
At Risk 4 year olds (VA Preschool Initiative) 490,000 532,875 42,875 8.75%Reading Intervention 59,012 58,266 -746 -1.26%SOL Algebra Readiness 27,025 26,240 -785 -2.90%Technology 280,000 280,000 0 0.00%Hospital Education 2,982,557 2,982,063 -494 -0.02%Adult Education 29,386 0 -29,386 -100.00%School Nutrition 27,920 34,168 6,248 22.38%Project Graduation 8,162 4,069 -4,093 -50.15%Governor's School 10,250 10,250 0 0.00%
Subtotal State Categorical and Incentive Based Funds $6,549,432 $6,873,119 $323,687 4.94%
Total State Funds $20,566,544 $20,637,185 $70,641 0.34%
State Funds Transferred Out
Textbooks -$156,740 -$136,609 -$20,131 -12.84%Remedial Education -298,403 -291,697 -6,706 -2.25%At-Risk 4 year olds (VA Preschool Initiative) -490,000 -532,875 42,875 8.75%Reading Intervention -59,012 -58,266 -746 -1.26%SOL Algebra Readiness -27,025 -26,240 -785 -2.90%Technology -280,000 -280,000 0 0.00%Hospital Education -2,982,557 -2,982,063 -494 -0.02%Adult Education -29,386 0 -29,386 -100.00%School Nutrition -27,920 -34,168 6,248 22.38%Project Graduation -8,162 -4,069 -4,093 -50.15%Governor's School -10,250 -10,250 0 0.00%
Total State FundsTransferred Out -$4,369,455 -$4,356,237 -$13,218 -0.30%
NET STATE FUNDS $16,197,089 $16,280,948 $83,859 0.52%State SOQ Funds
Tuition and Other Sources
Building Rent $22,000 $22,000 $0 0.00%Tuition 349,863 330,000 -19,863 -5.68%PREP - Charges for Services 536,686 536,686 0 0.00%Sale of Property/Property Damage 1,000 1,000 0 0.00%Dual Enrollment 184,361 184,361 0 0.00%Use of Fund Balance 267,851 625,996 358,145 133.71%Indirect Cost Recovery/Rebates 120,000 120,000 0 0.00%
TOTAL TUITION & OTHER SOURCES $1,481,761 $1,820,043 $338,282 22.83%
Federal Funds
Impact Aid $18,000 $18,000 $0 0.00%Advanced Placement 6,000 6,000 0 0.00%
TOTAL FEDERAL FUNDS $24,000 $24,000 $0 0.00%
TOTAL GENERAL FUND REVENUE $66,560,985 $69,658,767 $3,097,782 4.65%
- 26 -

GENERAL FUNDEXPENDITURES
- 27 -

56.9%
22.2%
20.9%
Expenditure BudgetBy Major Category
General Fund
Personnel Services Employee Benefits Operating Costs
- 28 -

Charlottesville City Schools2018-2019 General Fund Operating Budget
Expenditure Summary
Revised Revised Actual Actual Budget Staff Budget Staff Dollar Staff
Descriptions 2015-2016 2016-2017 2017-2018 2017-2018 2018-2019 2018-2019 Change Change
September 30th Enrollment 4,010 4,010 4,158 4,322
Board Salary $26,900 $32,300 $32,300 0.00 $32,300 0.00 $0 0.00Superintendent 217,751 225,850 204,087 1.00 204,087 1.00 0 0.00Associate Superintendent 152,215 161,159 173,164 1.00 176,627 1.00 3,463 0.00Assistant Superintendent 141,633 144,658 144,114 1.00 146,996 1.00 2,882 0.00Director 464,356 460,890 429,924 3.80 438,522 3.80 8,598 0.00Principal 1,054,559 968,109 987,218 9.80 1,006,962 9.80 19,744 0.00Assistant Principal 990,383 1,015,007 1,141,141 15.00 1,163,964 15.00 22,823 0.00Supervisor 208,165 258,721 273,427 3.00 278,896 3.00 5,469 0.00Athletic Director 75,891 70,199 69,692 1.00 83,281 1.00 13,589 0.00Coordinator 778,661 894,044 705,607 8.25 791,903 9.75 86,295 1.50Network Engineer 71,710 73,331 74,989 1.00 235,453 3.00 160,464 2.00Teacher - General Education 16,303,155 17,761,265 18,593,251 321.10 19,290,574 327.10 697,323 6.00Teacher - Special Education 3,478,667 3,402,935 3,464,213 59.87 3,599,642 59.87 135,429 0.00Teacher - Vocational Education 389,251 339,158 393,786 6.60 409,537 6.60 15,751 0.00Teacher - Technology Integration 210,465 286,857 284,396 5.00 390,015 6.80 105,619 1.80Teacher - Instructional Coach 828,008 65,064 341,228 5.00 354,877 5.00 13,649 0.00Extended Learning Staffing 0 3,528 0 0.00 0 0.00 0 0.00Social Worker 239,942 245,003 278,467 4.20 313,561 4.70 35,094 0.50Librarian 619,261 612,893 624,774 10.00 648,643 10.00 23,869 0.00Psychologist 262,717 178,688 254,875 4.00 259,973 4.00 5,098 0.00Behavior/Transition Specialist 0 0 98,217 1.00 100,181 1.00 1,964 0.00Nurse 404,889 429,242 412,947 10.00 421,206 10.00 8,259 0.00Counselor 1,033,149 1,059,157 1,113,758 19.00 1,157,201 19.00 43,443 0.00Home School Counselor 151,595 156,804 157,078 3.00 187,316 3.50 30,238 0.50Athletic Trainer 61,578 64,495 73,827 1.00 75,304 1.00 1,477 0.00Instructional Assistant - General Education 915,158 973,222 1,194,470 56.00 1,327,051 62.00 132,581 6.00Instructional Assistant - Special Education 652,750 653,361 725,534 34.00 730,895 34.00 5,361 0.00Lead Technology Specialist 67,564 69,092 70,654 1.00 72,067 1.00 1,413 0.00Data Systems Technician 567,868 531,316 573,821 10.00 577,460 9.00 3,639 -1.00Administrative Technician 1,104,905 1,142,227 1,293,153 26.28 1,349,380 27.28 56,227 1.00Reprographics Specialist 32,961 33,632 34,672 0.75 35,365 0.75 693 0.00Athletic Equip. & Facilities Mgr. 48,543 50,799 52,238 1.00 53,283 1.00 1,045 0.00Secretary - Division Wide 39,721 40,595 41,718 1.00 42,552 1.00 834 0.00Secretary - Guidance 83,593 84,548 86,435 3.00 88,164 3.00 1,729 0.00Secretary - Media 41,921 43,080 47,026 1.00 47,967 1.00 941 0.00Secretary - Principal 184,244 183,456 171,886 5.00 175,324 5.00 3,438 0.00Craftsman 171,160 125,465 126,581 2.00 129,113 2.00 2,532 0.00Custodian/Foreman 45,980 46,415 46,850 0.50 47,787 0.50 937 0.00Custodian 1,424,480 1,446,461 1,408,853 40.63 1,465,914 41.63 57,061 1.00Laborer 15,934 14,421 37,500 0.00 37,500 0.00 0 0.00Substitute Teacher 437,667 595,632 585,970 0.00 585,970 0.00 0 0.00Substitute Instructional Assistant 16,850 59 29,500 0.00 29,500 0.00 0 0.00Substitute Custodian 47,591 58,839 60,000 0.00 60,000 0.00 0 0.00Hourly Pay 872,233 915,842 927,430 0.00 1,015,799 0.00 88,369 0.00
Total Personnel Services $34,936,024 $35,917,818 $37,840,771 676.78 $39,638,112 696.08 $1,797,341 19.30
Social Security $2,562,648 $2,634,008 $2,780,679 $2,933,080 $152,401Retirement - VRS 4,859,170 5,165,867 6,053,684 6,155,237 101,553Disability 8,864 50,324 61,971 23,625 -38,346Employer Contribution to Deferred Compensation 0 0 16,019 16,019 0Health - Employer Contribution (FLEXCOMP) 3,845,568 4,150,133 4,781,979 5,213,319 431,340Group Life Insurance 390,738 443,118 534,250 494,044 -40,206Unemployment 11,072 3,876 96,000 76,364 -19,636Workers Compensation 88,441 136,074 203,560 96,000 -107,560
Sick Leave and Service Credit Benefit 352,151 347,826 110,000 248,070 138,070Employee Wellness 119,912 123,627 91,191 115,000 23,809Retiree Health Insurance 91,191 91,191 10,088 91,191 81,103Employee Assistance 10,422 10,507 0 10,588 10,588
Total Employee Benefits $12,340,177 $13,156,552 $14,739,421 $15,472,536 $733,115
- 29 -

Charlottesville City Schools2018-2019 General Fund Operating Budget
Expenditure Summary
Revised Revised Actual Actual Budget Staff Budget Staff Dollar Staff
Descriptions 2015-2016 2016-2017 2017-2018 2017-2018 2018-2019 2018-2019 Change Change
September 30th Enrollment 4,010 4,010 4,158 4,322
School CIP - City $0 $0 $0 $0 $0Facility and Repair Contract-City 200,000 200,000 200,000 200,000 0Maintenance Contract-City 3,302,044 3,456,726 3,333,295 3,463,617 130,322Transportation Contract-City 2,437,630 2,462,915 2,690,411 2,837,986 147,575Security Contract-City 259,523 271,651 299,113 299,113 0Comprehensive Services-City 577,735 570,593 616,502 616,502 0Vocational Ed Contract - CATEC 569,451 640,138 703,246 695,380 -7,866WorkSource Enterprises 115,000 115,000 122,728 122,728 0Piedmont Regional Education Program 2,094,326 2,190,759 2,284,962 2,228,133 -56,829Post High School Services-Special Education 0 0 0 0 0Legal Services 86,336 20,363 45,000 45,000 0Audit Services 53,560 51,110 51,110 51,110 0
Operating - Contractual Obligations Total $9,695,605 $9,979,255 $10,346,367 10,559,569 $213,202
Purchased Service $927,693 $919,317 $680,731 $652,436 -$28,295Dual enrollment 185,546 211,890 184,361 184,361 0Associates Degree Program 5,387 3,053 25,000 25,000 0AP testing fees 78,097 82,015 77,456 79,005 1,549Inservice 163,589 178,684 167,149 171,735 4,586Recruitment 10,890 17,243 19,000 19,000 0Repair & Maintenance Supplies 43,062 21,695 64,750 64,750 0Service Contracts 133,897 179,214 163,816 163,829 13Snow Removal 5,975 2,625 8,000 8,000 0Copier Maintenance & Supplies 26,553 25,793 54,204 54,227 23Transportation - City 11,800 8,063 13,650 12,700 -950Transportation - Other 43,905 79,462 90,318 96,716 6,398Printing & Binding 42,352 28,414 56,943 56,943 0Garbage Collection 0 0 39,135 39,135 0Postal Service 24,562 26,400 33,842 33,842 0Telecommunication 163,185 186,877 126,957 126,957 0Vehicle & E & O Insurance 3,380 84,270 3,956 5,726 1,770Other Property Insurance 73,392 0 73,584 73,584 0Surety Bonds 499 0 619 619 0General Liability 8,045 0 10,356 10,356 0Lease & Rent of Equipment 139,381 145,084 152,928 153,071 143Lease & Rent of Buildings 124 0 0 0 0Travel 36,515 50,277 35,622 35,622 0Contributions to Community Organizations 1,000 0 3,532 3,532 0Dues & Memberships 49,540 48,563 49,814 58,814 9,000Office Supplies 72,251 52,712 66,372 66,806 434Medical Supplies 8,205 9,385 7,240 7,240 0Custodial Supplies 108,732 122,396 97,538 97,538 0Hepatitis B Supplies 1,213 6,285 13,233 13,233 0Repair & Maintenance 2,882 15,053 6,535 6,535 0Books & Subscriptions 64 114 1,921 1,921 0Educational Supplies 355,120 379,375 457,418 411,342 -46,076Health & PE Supplies 4,752 7,904 7,683 7,683 0Science Supplies 2,940 3,481 6,244 5,744 -500Technology Materials & Supplies 205,113 374,189 95,937 97,556 1,619Technology Software 224,070 186,783 171,845 193,097 21,252Technology Hardware 0 25,137 101,348 130,348 29,000Technology Infrastructure 7,040 2,903 4,850 4,850 0Surveys & Reports 0 0 7,683 7,683 0Media Supplies 37,617 40,355 45,994 45,450 -544Other Educational Supplies 154,271 147,206 217,533 215,033 -2,500Copy Paper/Reproduction 2,531 1,307 5,762 5,762 0Equipment Replacement 5,159 0 20,262 20,262 0New Equipment 101,216 90 73,219 70,189 -3,030New Furniture 152,610 140,412 90,086 92,173 2,087Funds for Capital and Growth Needs 0 0 0 358,145 358,145Gainshare to City 100,000 100,000 0 0 0
Operating - General Operating Total $3,724,155 $3,914,025 $3,634,426 $3,988,550 $354,124
Total Operating Costs $13,419,760 $13,893,280 $13,980,793 $14,548,119 $567,326
Total General Fund $60,695,961 $62,967,650 $66,560,985 676.78 $69,658,767 696.08 $3,097,782 19.30
- 30 -

Charlottesville City Schools2018-2019 General Fund Operating Budget
Budget Centers
Revised Revised Actual Budget Staff Budget Staff Dollar Staff
Charlottesville High School 2016-2017 2017-2018 2017-2018 2018-2019 2018-2019 Change Change
September 30th Enrollment 1,147 1,191 1,165
Principal $100,880 $103,275 1.00 $105,341 1.00 $2,066 0.00Assistant Principal 299,028 324,426 4.00 330,915 4.00 6,489 0.00Coordinator of Testing 46,857 47,771 0.50 68,841 1.50 21,070 1.00Teacher - General Education 4,180,664 4,389,075 73.60 4,535,069 74.60 145,994 1.00Teacher - Special Education 969,614 886,056 15.57 921,498 15.57 35,442 0.00Teacher - Vocational Education 241,744 295,001 5.00 306,801 5.00 11,800 0.00Librarian 114,029 116,254 2.00 120,904 2.00 4,650 0.00Nurse 85,182 86,452 2.00 88,181 2.00 1,729 0.00Counselor 374,408 381,449 6.00 396,707 6.00 15,258 0.00Home School Counselor 57,370 58,841 1.00 61,195 1.00 2,354 0.00Instructional Assistant - General Education 0 0 0.00 0 0.00 0 0.00Instructional Assistant - Special Education 100,645 113,900 6.00 116,178 6.00 2,278 0.00Secretary - Guidance 23,411 24,175 1.00 24,659 1.00 484 0.00Secretary - Media 43,080 47,026 1.00 47,967 1.00 941 0.00Secretary - Principal 183,456 171,886 5.00 175,324 5.00 3,438 0.00Custodian 369,581 371,331 10.63 378,758 10.63 7,427 0.00Substitute Teacher 61,659 0 0 0Hourly Pay - Coaching 145,070 152,117 152,117 0Hourly Pay - Driver Education and Classroom 22,829 12,520 12,520 0Hourly Pay - Testing, Attendance, After School 51,912 50,000 50,000 0Hourly Pay - Summer School 0 2,292 2,292 0
Personnel Services $7,471,417 $7,633,847 134.30 $7,895,264 136.30 $261,417 2.00
Social Security $549,755 $552,458 $577,186 $24,728Retirement - VRS 1,074,378 1,225,955 1,210,848 -15,107Disability 10,869 5,598 5,729 131Health - Employer Contribution (FLEXCOMP) 876,675 977,418 1,041,155 63,737Group Life Insurance 92,269 93,616 97,712 4,096
Employee Benefits $2,603,946 $2,855,045 $2,932,630 $77,585
Inservice $9,925 $7,400 $9,600 $2,200Repair & Maintenance Supplies 4,829 7,000 7,000 0Transportation - City 1,488 1,500 1,500 0Printing & Binding 14,282 17,000 17,000 0Lease & Rent of Equipment 9,797 3,157 3,300 143Purchased Service 9,700 9,150 9,700 550Office Supplies 3,615 15,516 14,000 -1,516Educational Supplies 54,372 57,000 54,240 -2,760Science Supplies 1,716 2,500 2,000 -500Technology Materials & Supplies 6,523 6,173 7,000 827Media Supplies 7,419 7,500 7,500 0Other Educational Supplies 1,216 15,000 15,000 0New Equipment 0 0 0 0New Furniture 4,812 5,100 5,100 0
Operating Costs $129,695 $153,996 $152,940 -$1,056
Total Charlottesville High School $10,205,059 $10,642,888 134.3 $10,980,834 136.3 $337,946 2.00
- 31 -

Charlottesville City Schools2018-2019 General Fund Operating Budget
Budget Centers
Revised Revised Actual Budget Staff Budget Staff Dollar Staff
Buford Middle School 2016-2017 2017-2018 2017-2018 2018-2019 2018-2019 Change Change
September 30th Enrollment 505 504 529
Principal $114,335 $115,172 1.00 $117,475 1.00 $2,303 0.00Assistant Principal 153,225 157,472 2.00 160,621 2.00 3,149 0.00Teacher - General Education 1,987,143 2,257,860 36.80 2,318,605 38.80 60,745 2.00Teacher - Special Education 493,340 426,811 7.00 443,883 7.00 17,072 0.00Teacher - Vocational Education 97,414 98,785 1.60 102,736 1.60 3,951 0.00Librarian 58,432 59,043 1.00 61,405 1.00 2,362 0.00Nurse 51,144 49,403 1.00 50,391 1.00 988 0.00Counselor 120,508 123,143 2.00 128,069 2.00 4,926 0.00Home School Counselor 23,008 21,724 0.50 22,593 0.50 869 0.00Instructional Assistant - General Education 17,939 18,288 1.00 18,654 1.00 366 0.00Instructional Assistant - Special Education 82,205 57,781 3.00 58,937 3.00 1,156 0.00
Administrative Technician 54,151 76,195 1.95 77,719 1.95 1,524 0.00Secretary - Guidance 26,223 26,644 1.00 27,177 1.00 533 0.00Custodian 167,648 171,211 5.00 174,635 5.00 3,424 0.00Substitute Teacher 38,839 0 0 0Hourly Pay 14,827 12,500 12,500 0
Personnel Services $3,500,381 $3,672,032 64.85 $3,775,401 66.85 $103,369 2.00
Social Security $258,219 $261,079 $274,172 $13,093Retirement - VRS 520,130 600,625 592,223 -8,402Disability 5,295 2,029 2,132 103Health - Employer Contribution (FLEXCOMP) 422,121 442,837 471,419 28,582Group Life Insurance 44,765 45,853 47,764 1,911
Employee Benefits $1,250,530 $1,352,423 $1,387,710 $35,287
Inservice $4,584 $2,500 $2,000 -$500Service Contracts 1,829 0 0 0Transportation - City 0 0 250 250Transportation - Other 4,213 0 1,500 1,500Printing & Binding 0 0 0 0Lease & Rent of Equipment 0 1,500 1,500 0Office Supplies 1,752 1,500 1,750 250Repair & Maintenance Supplies 1,024 1,500 1,500 0Copier Maintenance & Supplies 6,961 7,500 7,500 0Educational Supplies 30,239 27,200 27,200 0Technology Materials & Supplies 0 0 0 0Science Supplies 643 1,500 1,500 0Media Supplies 2,781 5,044 5,500 456New Equipment 0 2,500 3,000 500New Furniture 5,098 5,000 3,036 -1,964
Operating Costs $59,125 $55,744 $56,236 $492
Total Buford Middle $4,810,036 $5,080,199 64.85 $5,219,347 66.85 $139,148 2.00
- 32 -
Charlottesville City Schools2018-2019 General Fund Operating Budget
Budget Centers
Revised Revised Actual Budget Staff Budget Staff Dollar Staff
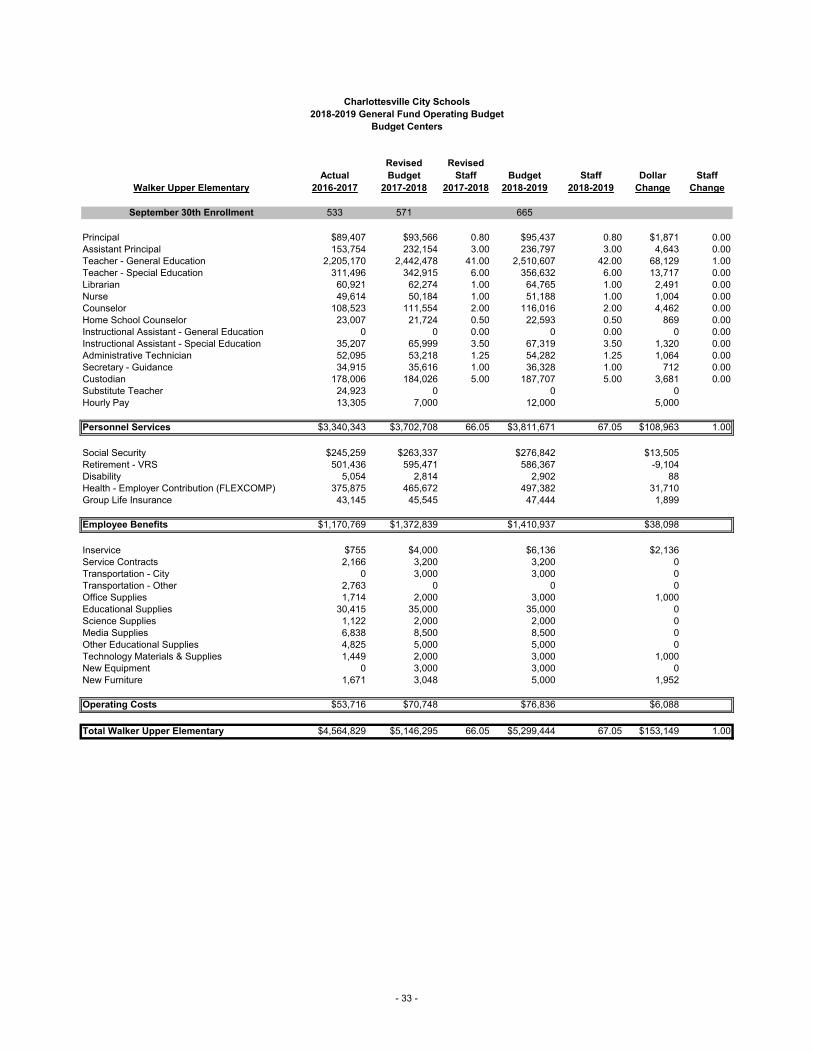
Walker Upper Elementary 2016-2017 2017-2018 2017-2018 2018-2019 2018-2019 Change Change
September 30th Enrollment 533 571 665
Principal $89,407 $93,566 0.80 $95,437 0.80 $1,871 0.00Assistant Principal 153,754 232,154 3.00 236,797 3.00 4,643 0.00Teacher - General Education 2,205,170 2,442,478 41.00 2,510,607 42.00 68,129 1.00Teacher - Special Education 311,496 342,915 6.00 356,632 6.00 13,717 0.00Librarian 60,921 62,274 1.00 64,765 1.00 2,491 0.00Nurse 49,614 50,184 1.00 51,188 1.00 1,004 0.00Counselor 108,523 111,554 2.00 116,016 2.00 4,462 0.00Home School Counselor 23,007 21,724 0.50 22,593 0.50 869 0.00Instructional Assistant - General Education 0 0 0.00 0 0.00 0 0.00Instructional Assistant - Special Education 35,207 65,999 3.50 67,319 3.50 1,320 0.00Administrative Technician 52,095 53,218 1.25 54,282 1.25 1,064 0.00Secretary - Guidance 34,915 35,616 1.00 36,328 1.00 712 0.00Custodian 178,006 184,026 5.00 187,707 5.00 3,681 0.00Substitute Teacher 24,923 0 0 0Hourly Pay 13,305 7,000 12,000 5,000
Personnel Services $3,340,343 $3,702,708 66.05 $3,811,671 67.05 $108,963 1.00
Social Security $245,259 $263,337 $276,842 $13,505Retirement - VRS 501,436 595,471 586,367 -9,104Disability 5,054 2,814 2,902 88Health - Employer Contribution (FLEXCOMP) 375,875 465,672 497,382 31,710Group Life Insurance 43,145 45,545 47,444 1,899
Employee Benefits $1,170,769 $1,372,839 $1,410,937 $38,098
Inservice $755 $4,000 $6,136 $2,136Service Contracts 2,166 3,200 3,200 0Transportation - City 0 3,000 3,000 0Transportation - Other 2,763 0 0 0Office Supplies 1,714 2,000 3,000 1,000Educational Supplies 30,415 35,000 35,000 0Science Supplies 1,122 2,000 2,000 0Media Supplies 6,838 8,500 8,500 0Other Educational Supplies 4,825 5,000 5,000 0Technology Materials & Supplies 1,449 2,000 3,000 1,000New Equipment 0 3,000 3,000 0New Furniture 1,671 3,048 5,000 1,952
Operating Costs $53,716 $70,748 $76,836 $6,088
Total Walker Upper Elementary $4,564,829 $5,146,295 66.05 $5,299,444 67.05 $153,149 1.00
- 33 -

Charlottesville City Schools2018-2019 General Fund Operating Budget
Budget Centers
Revised Revised Actual Budget Staff Budget Staff Dollar Staff
Burnley-Moran Elementary 2016-2017 2017-2018 2017-2018 2018-2019 2018-2019 Change Change
September 30th Enrollment 345 383 369Preschool Enrollment 24 20 20
Principal $96,114 $98,163 1.00 $100,126 1.00 $1,963 0.00Assistant Principal 66,318 67,840 1.00 69,197 1.00 1,357 0.00Teacher - General Education 1,179,962 1,216,841 23.80 1,265,515 23.80 48,674 0.00Teacher - Special Education 225,070 249,329 4.00 259,302 4.00 9,973 0.00Librarian 55,944 57,240 1.00 59,530 1.00 2,290 0.00Nurse 38,793 32,700 1.00 33,354 1.00 654 0.00Counselor 52,498 53,664 1.00 55,811 1.00 2,147 0.00Instructional Assistant - General Education 159,987 193,857 9.00 215,849 10.00 21,992 1.00Instructional Assistant - Special Education 17,786 18,288 1.00 18,654 1.00 366 0.00Administrative Technician 52,387 52,767 1.00 53,822 1.00 1,055 0.00Custodian 98,983 100,906 3.00 102,924 3.00 2,018 0.00Substitute Teacher 22,639 0 0 0Hourly Pay 8,940 12,000 12,000 0
Personnel Services $2,075,421 $2,153,595 46.80 $2,246,084 47.80 $92,489 1.00
Social Security $150,550 $158,530 $165,339 $6,809Retirement - VRS 304,620 367,793 366,251 -1,542Disability 3,197 1,636 1,685 49Health - Employer Contribution (FLEXCOMP) 262,232 341,133 365,627 24,494Group Life Insurance 26,226 28,055 29,503 1,448
Employee Benefits $746,826 $897,147 $928,406 $31,259
Inservice $0 $0 $1,500 $1,500Copier Maintenance & Supplies 3,910 4,000 4,000 0Transportation - City 0 1,000 1,000 0Transportation - Other 2,125 2,000 2,000 0Office Supplies 1,590 1,500 1,500 0Educational Supplies 15,544 16,184 14,624 -1,560Media Supplies 4,300 4,000 4,000 0Technology Hardware 0 2,000 1,000 -1,000New Equipment 0 3,530 0 -3,530New Furniture 0 0 3,387 3,387
Operating Costs $27,469 $34,214 $33,011 -$1,203
Total Burnley Moran Elementary $2,849,715 $3,084,956 46.80 $3,207,500 47.80 $122,544 1.00
- 34 -

Charlottesville City Schools2018-2019 General Fund Operating Budget
Budget Centers
Revised Revised Actual Budget Staff Budget Staff Dollar Staff
Clark Elementary 2016-2017 2017-2018 2017-2018 2018-2019 2018-2019 Change Change
September 30th Enrollment 271 286 283Preschool Enrollment 58 54 57
Principal $85,357 $86,989 1.00 $88,729 1.00 $1,740 0.00Assistant Principal 64,318 65,783 1.00 67,099 1.00 1,316 0.00Teacher - General Education 1,143,590 1,129,704 21.00 1,174,892 21.00 45,188 0.00Teacher - Special Education 227,154 244,474 4.36 254,253 4.36 9,779 0.00Librarian 70,584 71,907 1.00 74,783 1.00 2,876 0.00Nurse 34,807 35,700 1.00 36,414 1.00 714 0.00Counselor 48,303 49,278 1.00 51,249 1.00 1,971 0.00Instructional Assistant - General Education 145,619 184,781 9.00 206,592 10.00 21,811 1.00Instructional Assistant - Special Education 165,110 162,301 6.00 165,547 6.00 3,246 0.00Administrative Technician 32,694 33,531 1.00 34,202 1.00 671 0.00Custodian 92,236 88,324 3.00 90,090 3.00 1,766 0.00Substitute Teacher 29,944 0 0 0Hourly Pay 2,927 6,381 4,232 -2,149
Personnel Services $2,142,643 $2,159,153 49.36 $2,248,082 50.36 $88,929 1.00
Social Security $154,032 $158,940 $165,486 $6,546Retirement - VRS 319,406 370,756 369,680 -1,076Disability 3,450 1,971 2,023 52Health - Employer Contribution (FLEXCOMP) 304,240 345,926 369,667 23,741Group Life Insurance 27,388 28,201 29,633 1,432
Employee Benefits $808,516 $905,794 $936,489 $30,695
Inservice $0 $250 $250 $0Transportation - City $275 $1,000 $300 -$700Transportation - Other 1,519 500 1,000 500Office Supplies 1,482 1,500 1,500 0Educational Supplies 24,724 25,824 24,888 -936Media Supplies 2,330 2,500 2,500 0Technology Materials & Supplies 1,410 1,200 1,300 100Lease & Rent of Equipment 1,866 2,000 2,000 0New Furniture 0 250 0 -250
Operating Costs $33,606 $35,024 $33,738 -$1,286
Total Clark Elementary $2,984,765 $3,099,971 49.36 $3,218,309 50.36 $118,338 1.00
- 35 -

Charlottesville City Schools2018-2019 General Fund Operating Budget
Budget Centers
Revised Revised Actual Budget Staff Budget Staff Dollar Staff
Greenbrier Elementary 2016-2017 2017-2018 2017-2018 2018-2019 2018-2019 Change Change
September 30th Enrollment 347 348 369Preschool Enrollment 28 28 26
Principal $84,997 $86,650 1.00 $88,383 1.00 $1,733 0.00Assistant Principal 63,176 63,624 1.00 64,896 1.00 1,272 0.00Teacher - General Education 1,183,814 1,302,833 23.00 1,354,946 23.00 52,113 0.00Teacher - Special Education 202,222 207,867 3.00 216,182 3.00 8,315 0.00Librarian 62,711 64,046 1.00 66,608 1.00 2,562 0.00Nurse 41,034 41,693 1.00 42,527 1.00 834 0.00Counselor 61,840 63,040 1.00 65,562 1.00 2,522 0.00Instructional Assistant - General Education 144,633 191,381 9.00 213,324 10.00 21,943 1.00Instructional Assistant - Special Education 23,075 27,436 1.00 27,985 1.00 549 0.00Administrative Technician 46,709 47,765 1.00 48,720 1.00 955 0.00Custodian 102,866 105,193 3.00 107,297 3.00 2,104 0.00Substitute Teacher 17,988 0 0 0Hourly Pay 2,783 3,000 1,500 -1,500
Personnel Services $2,037,847 $2,204,528 45.00 $2,297,929 46.00 $93,401 1.00
Social Security $151,783 $162,280 $169,155 $6,875Retirement - VRS 295,235 365,639 363,883 -1,756Disability 2,777 1,340 1,388 48Health - Employer Contribution (FLEXCOMP) 234,091 281,915 302,458 20,543Group Life Insurance 25,482 27,918 29,363 1,445
Employee Benefits $709,367 $839,092 $866,247 $27,155
Inservice $985 $3,000 $3,000 $0Repair & Maintenance Supplies 0 0 0 0Purchased Service 0 0 0 0Transportation - City 2,100 2,250 2,250 0Transportation - Other 0 0 0 0Office Supplies 360 600 1,000 400Educational Supplies 21,870 24,412 30,050 5,638Technology Materials & Supplies 0 0 0 0Media Supplies 4,784 4,800 4,800 0Other Educational Supplies 69 2,500 0 -2,500New Furniture 3,990 4,000 4,000 0
Operating Costs $34,158 $41,562 $45,100 $3,538
Total Greenbrier Elementary $2,781,373 $3,085,182 45.00 $3,209,277 46.00 $124,095 1.00
- 36 -

Charlottesville City Schools2018-2019 General Fund Operating Budget
Budget Centers
Revised Revised Actual Budget Staff Budget Staff Dollar Staff
Jackson-Via Elementary 2016-2017 2017-2018 2017-2018 2018-2019 2018-2019 Change Change
September 30th Enrollment 287 285 340Preschool Enrollment 43 42 42
Principal $99,913 $96,794 1.00 $98,730 1.00 $1,936 0.00Assistant Principal 63,176 75,403 1.00 76,911 1.00 1,508 0.00Teacher - General Education 1,001,024 1,016,188 19.60 1,056,836 19.60 40,648 0.00Teacher - Special Education 264,473 326,889 6.00 339,965 6.00 13,076 0.00Librarian 67,908 69,201 1.00 71,969 1.00 2,768 0.00Nurse 49,874 53,663 1.00 54,736 1.00 1,073 0.00Counselor 55,828 57,096 1.00 59,380 1.00 2,284 0.00Instructional Assistant - General Education 132,561 172,430 8.00 193,994 9.00 21,564 1.00Instructional Assistant - Special Education 78,115 107,685 5.50 100,689 5.50 -6,996 0.00Administrative Technician 35,743 36,660 1.00 37,393 1.00 733 0.00Custodian 102,208 97,191 3.00 99,135 3.00 1,944 0.00Substitute Teacher 18,497 0 0 0Hourly Pay 2,308 2,500 2,500 0
Personnel Services $1,971,627 $2,111,700 48.10 $2,192,237 49.10 $80,537 1.00
Social Security $145,482 $155,446 $161,375 $5,929Retirement - VRS 295,329 362,398 357,825 -4,573Disability 3,128 1,578 1,596 18Health - Employer Contribution (FLEXCOMP) 245,210 299,247 320,645 21,398Group Life Insurance 25,442 27,629 28,802 1,173
Employee Benefits $714,591 $846,298 $870,242 $23,944
Inservice $661 $2,750 $2,000 -$750Transportation - City 988 0 0 0Transportation - Other 0 2,200 3,848 1,648Service Contracts 0 300 0 -300Office Supplies 3,811 3,000 3,500 500Copier Maintenance & Supplies 0 3,500 3,500 0Educational Supplies 17,649 21,198 20,500 -698Media Supplies 3,522 4,200 3,500 -700Technology Software 0 0 3,008 3,008New Furniture 0 1,000 1,000 0New Equipment 0 0 0 0
Operating Costs $26,630 $38,148 $40,856 $2,708
Total Jackson-Via Elementary $2,712,847 $2,996,146 48.10 $3,103,336 49.10 $107,190 1.00
- 37 -

Charlottesville City Schools2018-2019 General Fund Operating Budget
Budget Centers
Revised Revised Actual Budget Staff Budget Staff Dollar Staff
Johnson Elementary 2016-2017 2017-2018 2017-2018 2018-2019 2018-2019 Change Change
September 30th Enrollment 270 287 308Preschool Enrollment 48 52 51
Principal $86,372 $88,025 1.00 $89,786 1.00 $1,761 0.00Assistant Principal 69,098 70,944 1.00 72,363 1.00 1,419 0.00Teacher - General Education 1,018,670 920,216 17.80 938,620 17.80 18,404 0.00Teacher - Special Education 107,324 156,962 3.00 160,101 3.00 3,139 0.00Librarian 54,921 56,106 1.00 57,228 1.00 1,122 0.00Nurse 50,162 33,801 1.00 34,477 1.00 676 0.00Counselor 54,124 55,380 1.00 56,488 1.00 1,108 0.00Instructional Assistant - General Education 140,280 164,800 8.00 186,211 9.00 21,411 1.00Instructional Assistant - Special Education 45,577 46,695 2.00 47,629 2.00 934 0.00Administrative Technician 46,709 47,765 1.00 48,720 1.00 955 0.00Custodian 116,445 118,115 3.00 120,477 3.00 2,362 0.00Substitute Teacher 22,370 0 0 0Hourly Pay 3,896 4,500 4,000 -500
Personnel Services $1,815,947 $1,763,309 39.80 $1,816,100 40.80 $52,791 1.00
Social Security $131,838 $129,801 $133,687 $3,886Retirement - VRS 269,012 299,234 292,873 -6,361Disability 2,683 991 1,030 39Health - Employer Contribution (FLEXCOMP) 234,352 300,199 322,645 22,446Group Life Insurance 23,428 23,040 23,976 936
Employee Benefits $661,313 $753,265 $774,211 $20,946
Purchase Service $165 $2,000 $2,000 $0Inservice 0 $500 $500 $0Transportation - Other 1,425 0 0 0Transportation - City 2,663 4,700 4,200 -500Office Supplies 944 2,000 1,500 -500Educational Supplies 23,633 24,312 24,356 44Media Supplies 4,109 4,500 4,500 0New Furniture 933 1,080 842 -238
Operating Costs $33,873 $39,092 $37,898 -$1,194
Total Johnson Elementary $2,511,133 $2,555,666 39.80 $2,628,210 40.80 $72,544 1.00
- 38 -

Charlottesville City Schools2018-2019 General Fund Operating Budget
Budget Centers
Revised Revised Actual Budget Staff Budget Staff Dollar Staff
Venable Elementary 2016-2017 2017-2018 2017-2018 2018-2019 2018-2019 Change Change
September 30th Enrollment 305 303 294Preschool Enrollment 37 31 29
Principal $107,087 $109,245 1.00 $111,430 1.00 $2,185 0.00Assistant Principal 82,914 83,495 1.00 85,165 1.00 1,670 0.00Teacher - General Education 1,172,418 1,208,812 20.80 1,257,164 20.80 48,352 0.00Teacher - Special Education 147,278 147,747 2.95 153,657 2.95 5,910 0.00Librarian 67,443 68,703 1.00 71,451 1.00 2,748 0.00Nurse 28,633 29,351 1.00 29,938 1.00 587 0.00Counselor 60,962 62,288 1.00 64,780 1.00 2,492 0.00Instructional Assistant - General Education 121,894 156,163 7.00 177,401 8.00 21,238 1.00Instructional Assistant - Special Education 20,606 38,503 2.00 39,273 2.00 770 0.00Administrative Technician 42,726 43,819 1.00 44,695 1.00 876 0.00Custodian 93,528 95,343 3.00 97,250 3.00 1,907 0.00Substitute Teacher 13,870 0 0 0Hourly Pay 869 3,000 2,500 -500
Personnel Services $1,960,227 $2,046,469 41.75 $2,134,705 42.75 $88,236 1.00
Social Security $142,508 $150,645 $157,140 $6,495Retirement - VRS 297,218 347,012 345,868 -1,144Disability 2,661 1,015 1,067 52Health - Employer Contribution (FLEXCOMP) 258,698 324,509 347,181 22,672Group Life Insurance 25,560 26,471 27,862 1,391
Employee Benefits $726,644 $849,652 $879,118 $29,466
Inservice $1,270 $1,000 $1,000 $0Purchased Service 0 3,400 300 -3,100Transportation - City 550 200 200 0Transportation - Other 0 0 0 0Office Supplies 1,734 1,200 1,500 300Copier Maintenance & Supplies 2,844 3,000 3,023 23Educational Supplies 24,206 19,230 23,500 4,270Technology Materials & Supplies 2,034 2,000 1,692 -308Technology Hardware 0 0 0 0Media Supplies 4,270 4,300 4,000 -300Other Educational Supplies 0 900 900 0New Furniture 4,730 2,300 1,500 -800New Equipment 0 0 0 0
Operating Costs $41,637 $37,530 $37,615 $85
Total Venable Elementary $2,728,508 $2,933,651 41.75 $3,051,438 42.75 $117,787 1.00
- 39 -

Charlottesville City Schools2018-2019 General Fund Operating Budget
Budget Centers
Revised Revised Actual Budget Staff Budget Staff Dollar Staff
Preschool 2016-2017 2017-2018 2017-2018 2018-2019 2018-2019 Change ChangeTotal Preschool Enrollment 238 227 225
Early Childhood Coordinator $97,553 $99,043 1.00 $101,024 1.00 $1,981 0.00Teacher - General Education 337,309 346,448 6.00 360,306 6.00 13,858 0.00Early Connections Counselor 0 13,307 0.20 13,839 0.20 532 0.00Instructional Assistant - General Education 110,311 112,770 5.00 115,025 5.00 2,255 0.00Teacher - Special Education 401,684 420,649 6.99 437,475 6.99 16,826 0.00Instructional Assistant - Special Education 85,036 86,946 4.00 88,685 4.00 1,739 0.00Hourly Pay - General Education 6,098 3,900 3,900 0Hourly Pay - Special Education 0 270 270 0
Personnel Services $1,037,992 $1,083,333 23.19 $1,120,524 23.19 $37,191 0.00
Social Security $75,862 $79,746 $82,484 $2,738Retirement - VRS 157,640 185,253 184,297 -956Disability 1,375 230 229 -1Health - Employer Contribution (FLEXCOMP) 120,253 136,282 144,085 7,803Group Life Insurance 13,095 13,826 14,301 475
Employee Benefits $368,225 $415,337 $425,395 $10,058
Purchased Service $0 $556 $556 $0Inservice 0 1,142 1,142 0Office Supplies 689 98 98 0Educational Supplies 0 3,066 3,066 0Other Educational Supplies 6,108 10,153 10,153 0Technology Materials & Supplies 0 975 975 0Technology Software 0 975 975 0
Operating Costs $6,797 $16,965 $16,965 $0
Total Preschool $1,413,014 $1,515,635 23.19 $1,562,885 23.19 $47,250 0.00
- 40 -

Charlottesville City Schools2018-2019 General Fund Operating Budget
Budget Centers
Revised Revised Actual Budget Staff Budget Staff Dollar Staff
Virtual Education 2016-2017 2017-2018 2017-2018 2018-2019 2018-2019 Change Change
Program Administrator for Virtual Education $103,647 $109,339 1.00 $111,526 1.00 $2,187 0.00Hourly Pay 7,490 19,287 19,287 0
Personnel Services $111,137 $128,626 1.00 $130,813 1.00 $2,187 0.00
Social Security $8,347 $9,468 $9,629 $161Retirement - VRS 16,935 19,189 18,770 -419Disability 107 0 0 0Health - Employer Contribution (FLEXCOMP) 7,600 6,142 6,449 307Group Life Insurance 1,407 1,432 1,456 24
Employee Benefits $34,397 $36,231 $36,304 $73
Purchased Service $9,200 $7,800 $7,800 $0Technology Software 39,361 25,214 25,718 504Inservice 12,973 29,250 29,250 0Educational Supplies 0 975 975 0Dues & Memberships 0 1,950 1,950 0
Operating Costs $61,534 $65,189 $65,693 $504
Total Virtual Education $207,067 $230,046 1.00 $232,810 1.00 $2,764 0.00
Revised Revised Actual Budget Staff Budget Staff Dollar Staff
Office Of The Superintendent 2016-2017 2017-2018 2017-2018 2018-2019 2018-2019 Change Change
Superintendent $225,850 $204,087 1.00 $204,087 1.00 $0 0.00Administrative Technician 54,694 55,074 1.00 56,175 1.00 1,101 0.00Hourly Pay 325 0 0 0
Personnel Services $280,869 $259,161 2.00 $260,262 2.00 $1,101 0.00
Social Security $14,988 $19,077 $19,158 $81Retirement - VRS 44,005 44,166 42,661 -1,505Disability 254 0 0 0Health - Employer Contribution (FLEXCOMP) 24,627 30,587 32,116 1,529Employer Contribution to Deferred Compensation 0 16,019 16,019 0Group Life Insurance 3,656 4,796 4,810 14
Employee Benefits $87,530 $114,645 $114,764 $119
Purchased Service $26,252 $9,604 $9,604 $0Inservice 4,120 1,950 1,950 0Legal Services 20,363 45,000 45,000 0Travel 4,831 5,485 5,485 0Dues & Memberships 18,651 16,235 17,235 1,000Office Supplies 1,185 2,881 2,881 0Books & Subscriptions 114 1,921 1,921 0Educational Supplies 0 1,921 1,921 0Other Educational Supplies 110 960 960 0
Operating Costs $75,625 $85,957 $86,957 $1,000
Total Office of the Superintendent $444,025 $459,763 2.00 $461,983 2.00 $2,220 0.00
- 41 -

Charlottesville City Schools2018-2019 General Fund Operating Budget
Budget Centers
Revised Revised Actual Budget Staff Budget Staff Dollar Staff
Division Wide Instruction 2016-2017 2017-2018 2017-2018 2018-2019 2018-2019 Change Change
Associate Superintendent $161,159 $173,164 1.00 $176,627 1.00 $3,463 0.00Science Coordinator 50,661 51,048 0.50 104,138 1.00 53,090 0.50Social Studies Coordinator 0 0 0.00 0 0.00 0 0.00Literacy/Math Lead Teacher 215,611 221,804 2.50 230,676 2.50 8,872 0.00Teacher - General Education 1,064,707 986,341 14.60 1,039,541 15.60 53,200 1.00Teacher - Instructional Coach 65,064 341,228 5.00 354,877 5.00 13,649 0.00Extended Learning Staffing 3,528 0 0.00 0 0.00 0 0.00Administrative Technician 74,134 75,927 1.60 77,446 1.60 1,519 0.00Laborer 14,421 20,000 20,000 0 0.00Hourly Pay - Summer School 245,331 243,333 243,333 0Hourly Pay - Professional Development Secondary 8,698 28,961 28,961 0Hourly Pay - Professional Development Elementary 9,722 32,368 32,368 0
Personnel Services $1,913,036 $2,174,174 25.20 $2,307,967 26.70 $133,793 1.50
Social Security $143,091 $160,045 $169,894 $9,849Retirement - VRS 262,671 311,035 344,539 33,504Disability 2,021 139 635 496Health - Employer Contribution (FLEXCOMP) 177,482 172,805 203,082 30,277Group Life Insurance 21,820 23,220 26,741 3,521
Employee Benefits $607,085 $667,244 $744,891 $77,647
Purchased Service $200,038 $129,180 $99,594 -$29,586Dual enrollment 211,890 184,361 184,361 0Associates Degree Program 3,053 25,000 25,000 0AP testing fees 82,015 77,456 79,005 1,549Printing & Binding 1,400 6,581 6,581 0Inservice 52,745 18,068 18,068 0Travel 2,296 12,900 12,900 0Transportation - Other 1,349 20,280 20,280 0Contributions to Community Organizations 0 3,532 3,532 0Dues & Memberships 4,636 9,594 9,594 0Office Supplies 4,757 3,900 3,900 0Educational Supplies 41,154 92,653 42,579 -50,074Technology Software 11,036 25,328 26,028 700New Equipment 0 1,950 1,950 0New Furniture 24,956 2,925 2,925 0
Operating Costs $641,326 $613,708 $536,297 -$77,411
Total Division Wide Instruction $3,161,446 $3,455,126 25.20 $3,589,155 26.70 $134,029 1.50
- 42 -

Charlottesville City Schools2018-2019 General Fund Operating Budget
Budget Centers
Revised Revised Student Services Actual Budget Staff Budget Staff Dollar Staff
and Special Education 2016-2017 2017-2018 2017-2018 2018-2019 2018-2019 Change Change
Supervisor $86,725 $90,448 1.00 $92,257 1.00 $1,809 0.00Coordinators & Specialists 153,222 73,817 1.00 75,293 1.00 1,476 0.00Behavior/Transition Specialist 0 98,217 1.00 100,181 1.00 1,964 0.00Social Worker 245,003 265,160 4.00 299,722 4.50 34,562 0.50Psychologist 178,688 254,875 4.00 259,973 4.00 5,098 0.00Home School Counselor 53,419 54,789 1.00 80,936 1.50 26,147 0.50Administrative Technician 107,736 108,496 2.00 110,666 2.00 2,170 0.00Hourly Pay - Homebound 19,554 44,277 44,277 0Hourly Pay - Summer School 7,078 15,000 15,000 0Hourly Pay - Special Education 22,589 21,000 21,000 0
Personnel Services $874,015 $1,026,079 14.00 $1,099,305 15.00 $73,226 1.00
Social Security $65,553 $75,532 $80,922 $5,390Retirement - VRS 131,562 165,990 179,375 13,385Disability 1,003 281 419 138Health - Employer Contribution (FLEXCOMP) 79,249 89,553 100,480 10,927Group Life Insurance 10,929 12,392 13,923 1,531
Employee Benefits $288,296 $343,748 $375,120 $31,372
WorkSource Enterprises $115,000 $122,728 $122,728 $0Purchased Service 162,436 203,404 206,465 3,061Comprehensive Services-City 570,593 616,502 616,502 0Inservice 10,461 21,804 21,804 0Transportation - Other 62,331 59,802 62,552 2,750Service Contracts 8,682 8,667 8,754 87Postal Service 3,434 3,842 3,842 0Medical Supplies 6,720 4,802 4,802 0Educational Supplies 36,372 33,720 33,720 0Office Supplies 0 2,859 2,859 0Technology Materials & Supplies 9,236 21,433 21,433 0Technology Software 1,420 1,433 1,433 0Technology Hardware 0 2,881 2,881 0Copy Paper/Reproduction 1,307 5,762 5,762 0Piedmont Regional Education Program 2,190,759 2,284,962 2,228,133 -56,829New Equipment 0 3,842 3,842 0New Furniture 4,994 960 960 0
Operating Costs $3,183,747 $3,399,403 $3,348,472 -$50,931
Total Student Services and Special Education $4,346,058 $4,769,230 14.00 $4,822,896 15.00 $53,666 1.00
- 43 -

Charlottesville City Schools2018-2019 General Fund Operating Budget
Budget Centers
Revised Revised Actual Budget Staff Budget Staff Dollar Staff
Division Wide Media 2016-2017 2017-2018 2017-2018 2018-2019 2018-2019 Change Change
Administrative Technician $15,716 $15,894 0.30 $16,212 0.30 $318 0.00Hourly Pay 1,127 2,000 2,000 0
Personnel Services $16,843 $17,894 0.30 $18,212 0.30 $318 0.00
Social Security $1,278 $1,317 $1,341 $24Retirement - VRS 2,478 2,789 2,731 -58Disability 22 0 0 0Health - Employer Contribution (FLEXCOMP) 1,820 1,928 2,024 96Group Life Insurance 206 208 212 4
Employee Benefits $5,803 $6,242 $6,307 $65
Purchased Service $3,880 $11,700 $11,700 $0Service Contracts 15,870 8,844 8,844 0Inservice 6,620 4,000 4,000 0Repair & Maintenance Supplies 1,621 11,408 11,408 0Technology Materials & Supplies 58,958 32,500 32,500 0Technology Software 18,064 28,911 15,951 -12,960Technology Hardware 0 26,325 26,325 0New Furniture 18,510 0 0 0
Operating Costs $123,522 $123,688 $110,728 -$12,960
Total Division Wide Media $146,169 $147,824 0.30 $135,247 0.30 -$12,577 0.00
Revised Revised Actual Budget Staff Budget Staff Dollar Staff
Vocational Education 2016-2017 2017-2018 2017-2018 2018-2019 2018-2019 Change Change
Hourly Pay $672 $0 $0 $0
Personnel Services $0 $0 0.00 $0 0.00 $0 0.00
Social Security $51 $0 $0 $0
Employee Benefits $51 $0 $0 $0
Purchased Service $297 $0 $0 $0Travel 68 0 0 0Repair & Maintenance Supplies 974 2,438 2,438 0Educational Supplies 32,172 25,264 25,264 0Technology Materials & Supplies 892 1,950 1,950 0Technology Software 270 731 731 0Technology Hardware 0 3,900 3,900 0Vocational Ed Contract - CATEC 640,138 703,246 695,380 -7,866New Equipment 0 1,950 1,950 0
Operating Costs $674,811 $739,479 $731,613 -$7,866
Total Vocational Education $675,535 $739,479 0.00 $731,613 0.00 -$7,866 0.00
- 44 -

Charlottesville City Schools2018-2019 General Fund Operating Budget
Budget Centers
Revised Revised Actual Budget Staff Budget Staff Dollar Staff
Fine and Performing Arts 2016-2017 2017-2018 2017-2018 2018-2019 2018-2019 Change Change
Coordinator $74,208 $75,645 1.00 $77,158 1.00 $1,513 0.00Hourly Pay 17,859 4,000 4,000 0
Personnel Services $92,067 $79,645 1.00 $81,158 1.00 $1,513 0.00
Social Security $7,396 $5,863 $5,974 $111Retirement - VRS 11,703 13,276 13,012 -264Disability 86 0 0 0Health - Employer Contribution (FLEXCOMP) 5,716 6,142 6,449 307Group Life Insurance 972 991 1,010 19
Employee Benefits $25,873 $26,272 $26,444 $172
Purchased Service $76,909 $83,675 $83,675 $0Inservice 6,039 960 960 0Repair & Maintenance Supplies 4,730 6,728 6,728 0Educational Supplies 0 4,802 4,802 0Other Educational Supplies 36,170 36,775 36,775 0Technology Materials & Supplies 0 488 488 0Technology Software 0 960 960 0Technology Hardware 0 2,881 2,881 0Equipment Replacement 0 9,604 9,604 0New Equipment 0 9,604 9,604 0New Furniture 1,800 488 488 0
Operating Costs $125,647 $156,965 $156,965 $0
Total Fine and Performing Arts $243,586 $262,882 1.00 $264,567 1.00 $1,685 0.00
Revised Revised Actual Budget Staff Budget Staff Dollar Staff
English as a Second Language 2016-2017 2017-2018 2017-2018 2018-2019 2018-2019 Change Change
Coordinator $34,841 $35,049 0.33 $35,750 0.33 $701 0.00Teacher - Elementary 421,419 477,096 8.50 544,091 9.50 66,995 1.00Teacher - Secondary 216,032 244,574 4.50 254,357 4.50 9,783 0.00Counselor 50,632 51,932 1.00 54,009 1.00 2,077 0.00Hourly Pay 6,917 0 0 0
Personnel Services $729,842 $808,651 14.33 $888,207 15.33 $79,556 1.00
Social Security $52,507 $59,526 $65,383 $5,857Retirement - VRS 110,254 138,057 154,394 16,337Disability 887 525 685 160Health - Employer Contribution (FLEXCOMP) 92,461 113,087 126,180 13,093Group Life Insurance 9,159 10,306 11,982 1,676
Employee Benefits $0 $321,501 $358,625 $37,124
Inservice $47 $0 $0 $0Purchased Service $7,716 $0 $0 $0Educational Supplies 6,785 23,888 23,888 0
Operating Costs $14,548 $23,888 $23,888 $0
Total English as a Second Language $1,009,656 $1,154,040 14.33 $1,270,719 15.33 $116,679 1.00
- 45 -

Charlottesville City Schools2018-2019 General Fund Operating Budget
Budget Centers
Revised Revised Actual Budget Staff Budget Staff Dollar Staff
Gifted Education 2016-2017 2017-2018 2017-2018 2018-2019 2018-2019 Change Change
Coordinator $26,395 $26,552 0.25 $27,083 0.25 $531 0.00Hourly Pay 809 2,000 2,000 0
Personnel Services $27,203 $28,552 0.25 $29,083 0.25 $531 0.00
Social Security $2,100 $2,102 $2,141 $39Retirement - VRS 4,162 4,660 4,565 -95Disability 26 0 0 0Health - Employer Contribution (FLEXCOMP) 1,516 1,606 1,686 80Group Life Insurance 346 348 354 6
Employee Benefits $8,151 $8,716 $8,747 $31
Purchased Service $247 $478 $478 $0Inservice 549 3,374 3,374 0Educational Supplies 2,001 3,842 3,842 0Other Educational Supplies 10,438 14,806 14,806 0Technology Materials & Supplies 0 293 293 0Technology Hardware 0 2,881 2,881 0New Equipment 0 195 195 0New Furniture 0 195 195 0
Operating Costs $13,235 $26,064 $26,064 $0
Total Gifted Education $48,589 $63,332 0.25 $63,894 0.25 $562 0.00
Revised Revised Actual Budget Staff Budget Staff Dollar Staff
AVID/Scholars 2016-2017 2017-2018 2017-2018 2018-2019 2018-2019 Change Change
Coordinator $17,948 $18,055 0.17 $18,416 0.17 $361 0.00Teacher - General Education 223,422 230,448 4.00 239,666 4.00 9,218 0.00
Personnel Services $241,370 $248,503 4.17 $258,082 4.17 $9,579 0.00
Social Security $18,026 $18,293 $18,998 $705Retirement - VRS 38,031 43,612 43,564 -48Disability 289 0 0 0Health - Employer Contribution (FLEXCOMP) 26,677 29,596 31,076 1,480Group Life Insurance 3,159 3,256 3,382 126
Employee Benefits $86,182 $94,757 $97,019 $2,262
Total AVID/Scholars $327,552 $343,260 4.17 $355,101 4.17 $11,841 0.00
- 46 -
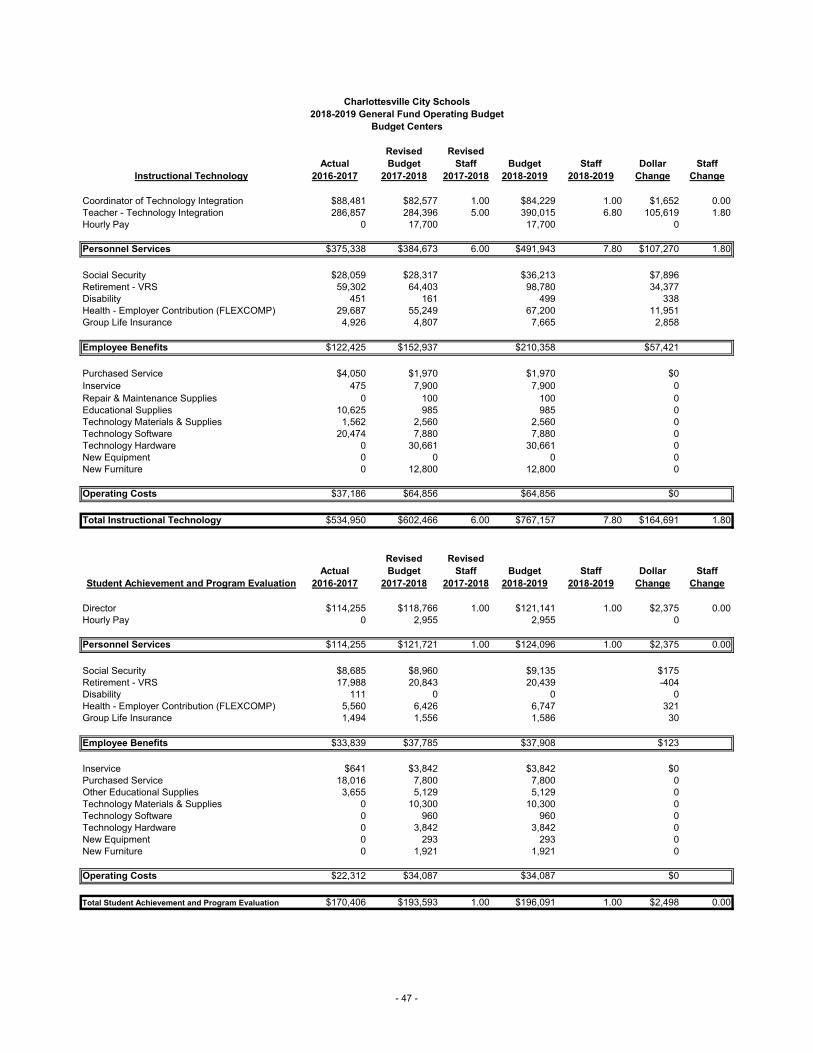
Charlottesville City Schools2018-2019 General Fund Operating Budget
Budget Centers
Revised Revised Actual Budget Staff Budget Staff Dollar Staff
Instructional Technology 2016-2017 2017-2018 2017-2018 2018-2019 2018-2019 Change Change
Coordinator of Technology Integration $88,481 $82,577 1.00 $84,229 1.00 $1,652 0.00Teacher - Technology Integration 286,857 284,396 5.00 390,015 6.80 105,619 1.80Hourly Pay 0 17,700 17,700 0
Personnel Services $375,338 $384,673 6.00 $491,943 7.80 $107,270 1.80
Social Security $28,059 $28,317 $36,213 $7,896Retirement - VRS 59,302 64,403 98,780 34,377Disability 451 161 499 338Health - Employer Contribution (FLEXCOMP) 29,687 55,249 67,200 11,951Group Life Insurance 4,926 4,807 7,665 2,858
Employee Benefits $122,425 $152,937 $210,358 $57,421
Purchased Service $4,050 $1,970 $1,970 $0Inservice 475 7,900 7,900 0Repair & Maintenance Supplies 0 100 100 0Educational Supplies 10,625 985 985 0Technology Materials & Supplies 1,562 2,560 2,560 0Technology Software 20,474 7,880 7,880 0Technology Hardware 0 30,661 30,661 0New Equipment 0 0 0 0New Furniture 0 12,800 12,800 0
Operating Costs $37,186 $64,856 $64,856 $0
Total Instructional Technology $534,950 $602,466 6.00 $767,157 7.80 $164,691 1.80
Revised Revised Actual Budget Staff Budget Staff Dollar Staff
Student Achievement and Program Evaluation 2016-2017 2017-2018 2017-2018 2018-2019 2018-2019 Change Change
Director $114,255 $118,766 1.00 $121,141 1.00 $2,375 0.00Hourly Pay 0 2,955 2,955 0
Personnel Services $114,255 $121,721 1.00 $124,096 1.00 $2,375 0.00
Social Security $8,685 $8,960 $9,135 $175Retirement - VRS 17,988 20,843 20,439 -404Disability 111 0 0 0Health - Employer Contribution (FLEXCOMP) 5,560 6,426 6,747 321Group Life Insurance 1,494 1,556 1,586 30
Employee Benefits $33,839 $37,785 $37,908 $123
Inservice $641 $3,842 $3,842 $0Purchased Service 18,016 7,800 7,800 0Other Educational Supplies 3,655 5,129 5,129 0Technology Materials & Supplies 0 10,300 10,300 0Technology Software 0 960 960 0Technology Hardware 0 3,842 3,842 0New Equipment 0 293 293 0New Furniture 0 1,921 1,921 0 Operating Costs $22,312 $34,087 $34,087 $0
Total Student Achievement and Program Evaluation $170,406 $193,593 1.00 $196,091 1.00 $2,498 0.00
- 47 -

Charlottesville City Schools2018-2019 General Fund Operating Budget
Budget Centers
Revised Revised Actual Budget Staff Budget Staff Dollar Staff
Leadership Coordinators 2016-2017 2017-2018 2017-2018 2018-2019 2018-2019 Change Change
Inservice $7,721 $0 $0 $0Educational Supplies 3,180 9,604 9,604 0Other Educational Supplies 2,804 3,842 3,842 0Copier Maintenance & Supplies 1,330 9,604 9,604 0
Total Leadership Coordinators $15,035 $23,050 0.00 $23,050 0.00 $0 0.00
Revised Revised Actual Budget Staff Budget Staff Dollar Staff
Technical Support 2016-2017 2017-2018 2017-2018 2018-2019 2018-2019 Change Change
Assistant Superintendent $28,932 $28,823 0.20 $29,399 0.20 $576 0.00Director 115,543 114,148 1.00 116,431 1.00 2,283 0.00Supervisor 171,995 182,979 2.00 186,639 2.00 3,660 0.00Network Engineer 73,331 74,989 1.00 235,453 3.00 160,464 2.00Lead Technology Specialist 69,092 70,654 1.00 72,067 1.00 1,413 0.00Data Systems Technician 531,316 573,821 10.00 577,460 9.00 3,639 -1.00Administrative Technician 36,671 37,085 0.70 37,827 0.70 742 0.00Hourly Pay 16,236 0 0 0
Personnel Services $1,043,115 $1,082,499 15.90 $1,255,275 16.90 $172,776 1.00
Social Security $76,632 $79,685 $92,403 $12,718Retirement - VRS 160,639 189,885 223,907 34,022Disability 1,330 252 661 409Health - Employer Contribution (FLEXCOMP) 104,891 126,071 158,145 32,074Group Life Insurance 13,344 14,171 17,374 3,203
Employee Benefits $356,835 $410,064 $492,490 $82,426
Inservice $19,745 $0 $0 $0Purchased Service -844 1,970 1,970 0Repair & Maintenance Supplies 1,209 21,700 21,700 0Telecommunication 320,620 3,940 3,940 0Technology Materials & Supplies 14,547 3,940 3,940 0Technology Software 30,582 8,380 38,380 30,000Technology Hardware 0 10,840 40,840 30,000Technology Infrastructure 2,903 4,850 4,850 0Equipment Replacement 0 2,955 2,955 0
Operating Costs $388,762 $58,575 $118,575 $60,000
Total Technical Support $1,788,712 $1,551,138 15.90 $1,866,340 16.90 $315,202 1.00
- 48 -

Charlottesville City Schools2018-2019 General Fund Operating Budget
Budget Centers
Revised Revised Actual Budget Staff Budget Staff Dollar Staff
Division Wide Health & PE 2016-2017 2017-2018 2017-2018 2018-2019 2018-2019 Change Change
PE/Health Lead Teacher $46,312 $47,550 0.60 $48,501 0.60 $951 0.00Hourly Pay 0 0 0 0
Personnel Services $46,312 $47,550 0.60 $48,501 0.60 $951 0.00
Social Security $3,553 $3,500 $3,570 $70Retirement - VRS 0 0 0 0Disability 0 0 0 0Health - Employer Contribution (FLEXCOMP) 0 0 0 0Group Life Insurance 0 0 0 0
Employee Benefits $3,553 $3,500 $3,570 $70
Purchased Service $1,679 $1,921 $1,921 $0Health & PE Supplies 7,904 7,683 7,683 0
Operating Costs $9,583 $9,604 $9,604 $0
Total Division Wide Health & PE $59,448 $60,654 0.60 $61,675 0.60 $1,021 0.00
Revised Revised Teacher Mentor Actual Budget Staff Budget Staff Dollar Staff
2016-2017 2017-2018 2017-2018 2018-2019 2018-2019 Change Change
Coordinator $0 $0 $0 $0 0.00Teacher - General Education 0 0 0 0 0.00Hourly Pay 0 0 0 0
Personnel Services $0 $0 0.00 $0 0.00 $0 0.00
Social Security $0 $0 $0 $0Retirement - VRS 0 0 0 0Disability 0 0 0 0Health - Employer Contribution (FLEXCOMP) 0 0 0 0Group Life Insurance 0 0 0 0
Employee Benefits $0 $0 $0 $0
Educational Supplies $3,051 $5,363 $5,363 $0Inservice 0 0 0 0Purchased Service 3,932 10,937 10,937 0
Operating Costs $6,982 $16,300 $16,300 $0
Total Teacher Mentor $6,982 $16,300 0.00 $16,300 0.00 $0 0.00
- 49 -
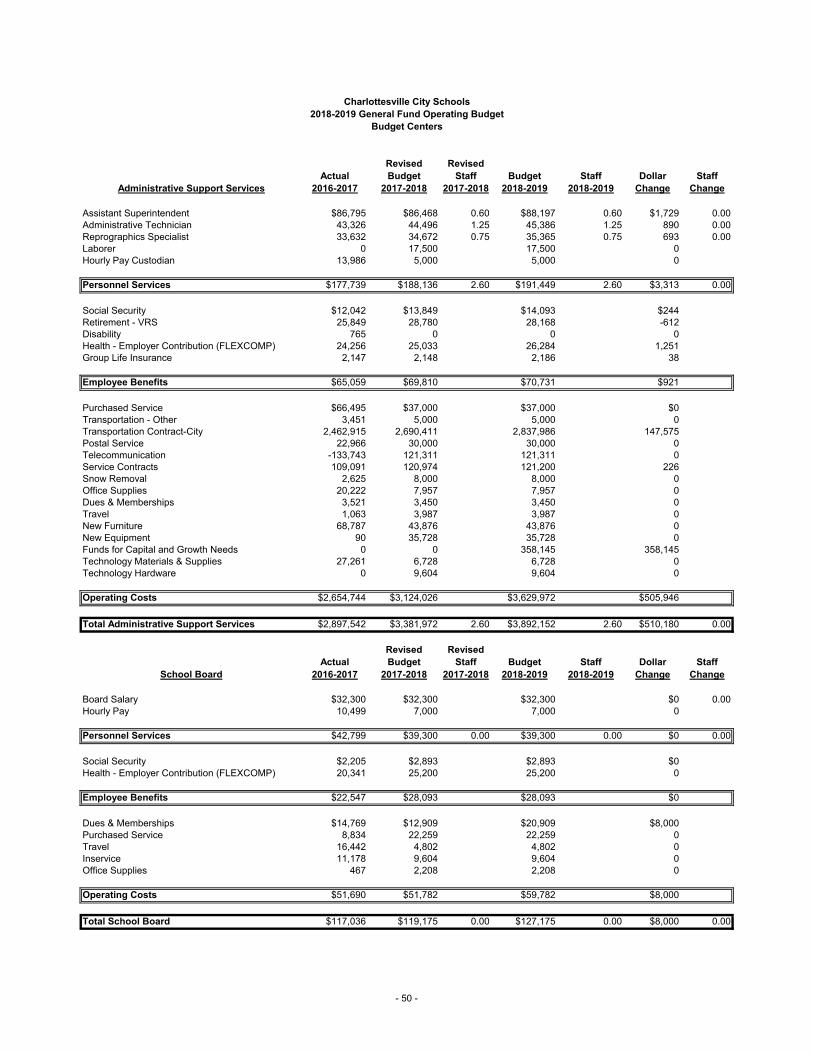
Charlottesville City Schools2018-2019 General Fund Operating Budget
Budget Centers
Revised Revised Actual Budget Staff Budget Staff Dollar Staff
Administrative Support Services 2016-2017 2017-2018 2017-2018 2018-2019 2018-2019 Change Change
Assistant Superintendent $86,795 $86,468 0.60 $88,197 0.60 $1,729 0.00Administrative Technician 43,326 44,496 1.25 45,386 1.25 890 0.00Reprographics Specialist 33,632 34,672 0.75 35,365 0.75 693 0.00Laborer 0 17,500 17,500 0Hourly Pay Custodian 13,986 5,000 5,000 0
Personnel Services $177,739 $188,136 2.60 $191,449 2.60 $3,313 0.00
Social Security $12,042 $13,849 $14,093 $244Retirement - VRS 25,849 28,780 28,168 -612Disability 765 0 0 0Health - Employer Contribution (FLEXCOMP) 24,256 25,033 26,284 1,251Group Life Insurance 2,147 2,148 2,186 38
Employee Benefits $65,059 $69,810 $70,731 $921
Purchased Service $66,495 $37,000 $37,000 $0Transportation - Other 3,451 5,000 5,000 0Transportation Contract-City 2,462,915 2,690,411 2,837,986 147,575Postal Service 22,966 30,000 30,000 0Telecommunication -133,743 121,311 121,311 0Service Contracts 109,091 120,974 121,200 226Snow Removal 2,625 8,000 8,000 0Office Supplies 20,222 7,957 7,957 0Dues & Memberships 3,521 3,450 3,450 0Travel 1,063 3,987 3,987 0New Furniture 68,787 43,876 43,876 0New Equipment 90 35,728 35,728 0Funds for Capital and Growth Needs 0 0 358,145 358,145Technology Materials & Supplies 27,261 6,728 6,728 0Technology Hardware 0 9,604 9,604 0
Operating Costs $2,654,744 $3,124,026 $3,629,972 $505,946
Total Administrative Support Services $2,897,542 $3,381,972 2.60 $3,892,152 2.60 $510,180 0.00
Revised Revised Actual Budget Staff Budget Staff Dollar Staff
School Board 2016-2017 2017-2018 2017-2018 2018-2019 2018-2019 Change Change
Board Salary $32,300 $32,300 $32,300 $0 0.00Hourly Pay 10,499 7,000 7,000 0
Personnel Services $42,799 $39,300 0.00 $39,300 0.00 $0 0.00
Social Security $2,205 $2,893 $2,893 $0Health - Employer Contribution (FLEXCOMP) 20,341 25,200 25,200 0
Employee Benefits $22,547 $28,093 $28,093 $0
Dues & Memberships $14,769 $12,909 $20,909 $8,000Purchased Service 8,834 22,259 22,259 0Travel 16,442 4,802 4,802 0Inservice 11,178 9,604 9,604 0Office Supplies 467 2,208 2,208 0
Operating Costs $51,690 $51,782 $59,782 $8,000
Total School Board $117,036 $119,175 0.00 $127,175 0.00 $8,000 0.00
- 50 -

Charlottesville City Schools2018-2019 General Fund Operating Budget
Budget Centers
Revised Revised Actual Budget Staff Budget Staff Dollar Staff
Community Relations 2016-2017 2017-2018 2017-2018 2018-2019 2018-2019 Change Change
Administrative Technician $70,417 $128,119 2.00 $130,681 2.00 $2,562 0.00Hourly Pay - Web Support at Schools 5,723 9,000 9,000 0
Personnel Services $76,140 $137,119 2.00 $139,681 2.00 $2,562 0.00
Social Security $5,402 $10,094 $10,282 $188Retirement - VRS 9,843 22,485 22,031 -454Disability 78 150 147 -3Health - Employer Contribution (FLEXCOMP) 11,876 13,105 13,760 655Group Life Insurance 818 1,679 1,710 31
Employee Benefits $28,018 $47,513 $47,930 $417
Inservice $226 $3,744 $3,744 $0Printing & Binding 8,609 22,537 22,537 0Office Supplies 100 2,784 2,784 0Dues & Memberships 350 293 293 0Purchased Service 29,979 20,904 20,904 0
Operating Costs $39,264 $50,262 $50,262 $0
Total Community Relations $143,422 $234,894 2.00 $237,874 2.00 $2,980 0.00
Revised Revised Actual Budget Staff Budget Staff Dollar Staff
Athletic Department 2016-2017 2017-2018 2017-2018 2018-2019 2018-2019 Change Change
Athletic Director $70,199 $69,692 1.00 $83,281 1.00 $13,589 0.00Athletic Equip. & Facilities Mgr. 50,799 52,238 1.00 53,283 1.00 1,045 0.00Athletic Trainer 64,495 73,827 1.00 75,304 1.00 1,477 0.00Administrative Technician 32,446 31,220 1.00 31,844 1.00 624 0.00Hourly Pay 10,815 12,000 12,000 0
Personnel Services $228,753 $238,977 4.00 $255,712 4.00 $16,735 0.00
Social Security $15,926 $17,592 $18,823 $1,231Retirement - VRS 27,732 39,835 43,156 3,321Disability 304 84 87 3Health - Employer Contribution (FLEXCOMP) 32,123 35,531 37,308 1,777Group Life Insurance 2,756 2,973 3,349 376
Employee Benefits $78,840 $96,015 $102,723 $6,708
Purchased Service $77,461 $0 $0 $0Inservice 1,899 3,900 3,900 0Repair & Maintenance Supplies 0 9,750 9,750 0Travel 2,333 0 0 0Dues & Memberships 5,215 3,413 3,413 0Office Supplies 0 975 975 0Medical Supplies 2,665 2,438 2,438 0Telecommunication 0 1,706 1,706 0Other Educational Supplies 71,553 108,037 108,037 0New Equipment 0 3,705 3,705 0
Operating Costs $161,126 $133,924 $133,924 $0
Total Athletic Department $468,720 $468,916 4.00 $492,359 4.00 $23,443 0.00
- 51 -

Charlottesville City Schools2018-2019 General Fund Operating Budget
Budget Centers
Revised Revised Actual Budget Staff Budget Staff Dollar Staff
Lugo-McGinness Academy 2016-2017 2017-2018 2017-2018 2018-2019 2018-2019 Change Change
Coordinator $30,979 $0 0.00 $0 0.00 $0 0.00Teacher - General Education 163,998 154,983 3.00 161,182 3.00 6,199 0.00Teacher - Special Education 53,280 54,514 1.00 56,695 1.00 2,181 0.00Counselor 71,530 104,934 2.00 109,131 2.00 4,197 0.00Administrative Technician 0 0 0.00 30,364 1.00 30,364 1.00Hourly Pay 50,289 50,368 15,368 -35,000
Personnel Services $370,076 $364,799 6.00 $372,741 7.00 $7,942 1.00
Social Security $27,321 $26,854 $27,438 $584Retirement - VRS 50,430 55,183 64,939 9,756Disability 537 278 386 108Health - Employer Contribution (FLEXCOMP) 38,280 38,832 47,222 8,390Group Life Insurance 4,189 4,118 5,039 921
Employee Benefits $120,758 $125,265 $145,023 $19,758
Inservice $80 $975 $975 $0Purchased Service 1,021 2,925 2,925 0Repair & Maintenance Supplies 150 195 195 0Transportation - Other 288 536 536 0Lease & Rent of Buildings 0 0 0 0Travel 0 195 195 0Office Supplies 72 390 390 0Technology Materials & Supplies 540 975 975 0Technology Software 0 750 750 0Technology Hardware 0 731 731 0Science Supplies 0 244 244 0Educational Supplies 1,383 975 975 0Other Educational Supplies 1,751 781 781 0New Equipment 0 341 341 0New Furniture 130 341 341 0
Operating Costs $5,415 $10,354 $10,354 $0
Total Lugo-McGiness Academy $496,249 $500,418 6.00 $528,118 7.00 $27,700 1.00
- 52 -

Charlottesville City Schools2018-2019 General Fund Operating Budget
Budget Centers
Revised Revised Actual Budget Staff Budget Staff Dollar Staff
Finance 2016-2017 2017-2018 2017-2018 2018-2019 2018-2019 Change Change
Assistant Superintendent $28,932 $28,823 0.20 $29,399 0.20 $576 0.00Director 115,546 98,228 1.00 100,193 1.00 1,965 0.00Coordinator of Accounting/Payroll 0 0 0.00 0 0.00 0 0.00Coordinator of Budgets/Benefits 158,413 79,590 1.00 81,182 1.00 1,592 0.00Administrative Technician 207,905 230,143 4.23 234,746 4.23 4,603 0.00Hourly Pay - Building Use 75,414 35,000 35,000 0
Personnel Services $586,209 $471,784 6.43 $480,520 6.43 $8,736 0.00
Social Security $42,759 $34,729 $35,372 $643Retirement - VRS 77,406 73,071 71,581 -1,490Disability 580 0 0 0Health - Employer Contribution (FLEXCOMP) 54,476 46,759 49,096 2,337Group Life Insurance 6,430 5,453 5,554 101
Employee Benefits $181,652 $160,012 $161,603 $1,591
Audit Services $51,110 $51,110 $51,110 $0Purchased Service 160,774 112,098 112,878 780Inservice 314 1,926 1,926 0Service Contracts 0 6,826 6,826 0Copier Maintenance & Supplies 10,749 26,600 26,600 0Printing & Binding 4,122 9,850 9,850 0Vehicle & E & O Insurance 84,270 3,956 5,726 1,770Other Property Insurance 0 73,584 73,584 0Surety Bonds 0 619 619 0General Liability 0 10,356 10,356 0Lease & Rent of Equipment 133,421 146,271 146,271 0Travel 9,195 2,403 2,403 0Dues & Memberships 1,420 1,970 1,970 0Office Supplies 5,964 9,604 9,604 0Repair & Maintenance 14,029 5,035 5,035 0Surveys & Reports 0 7,683 7,683 0Technology Materials & Supplies 249,777 2,422 2,422 0Technology Hardware 25,137 4,802 4,802 0Technology Software 0 4,802 4,802 0Equipment Replacement 0 7,703 7,703 0New Furniture 0 4,802 4,802 0Gainshare to City 100,000 0 0 0
Operating Costs $850,282 $494,422 $496,972 $2,550
Total Finance $1,618,144 $1,126,218 6.43 $1,139,095 6.43 $12,877 0.00
- 53 -

Charlottesville City Schools2018-2019 General Fund Operating Budget
Budget Centers
Revised Revised Actual Budget Staff Budget Staff Dollar Staff
Human Resources 2016-2017 2017-2018 2017-2018 2018-2019 2018-2019 Change Change
Director $115,546 $98,782 0.80 $100,758 0.80 $1,976 0.00Coordinator 114,486 116,460 1.50 118,789 1.50 2,329 0.00Administrative Technician 91,691 129,565 2.00 132,156 2.00 2,591 0.00Secretary - Division Wide 40,595 41,718 1.00 42,552 1.00 834 0.00Substitute Teacher 344,906 585,970 585,970 0Substitute Instructional Assistant 59 29,500 29,500 0Hourly Pay - Division Wide Instructional 105,290 72,127 195,145 123,018
Personnel Services $812,572 $1,074,122 5.30 $1,204,871 5.30 $130,749 0.00
Social Security $62,699 $102,150 $115,419 $13,269Retirement - VRS 56,986 50,500 60,821 10,321Disability 442 40,680 0 -40,680Health - Employer Contribution (FLEXCOMP) 41,532 3,771 42,713 38,942Group Life Insurance 4,734 76,364 4,722 -71,642Unemployment 3,876 96,000 76,364 -19,636Workers Compensation 136,074 203,560 96,000 -107,560Sick Leave and Service Credit Benefit 347,826 110,000 248,070 138,070Employee Wellness 123,627 91,191 115,000 23,809Retiree Health Insurance 91,191 10,088 91,191 81,103Employee Assistance 10,507 0 10,588 10,588
Employee Benefits $879,494 $784,304 $860,887 $76,583
Purchased Service $51,080 $0 $0 $0Security Contract-City 271,651 299,113 299,113 0Inservice 24,673 33,310 33,310 0Recruitment 17,243 19,000 19,000 0Printing & Binding 0 975 975 0Travel 14,049 5,850 5,850 0Office Supplies 2,254 3,900 3,900 0Hepatitis B Supplies 6,285 13,233 13,233 0Media Supplies 0 650 650 0Technology Software 65,575 65,521 65,521 0Other Educational Supplies 8,507 13,650 13,650 0
Operating Costs $461,316 $455,202 $455,202 $0
Total Human Resources $2,153,382 $2,313,628 5.30 $2,520,960 5.30 $207,332 0.00
- 54 -
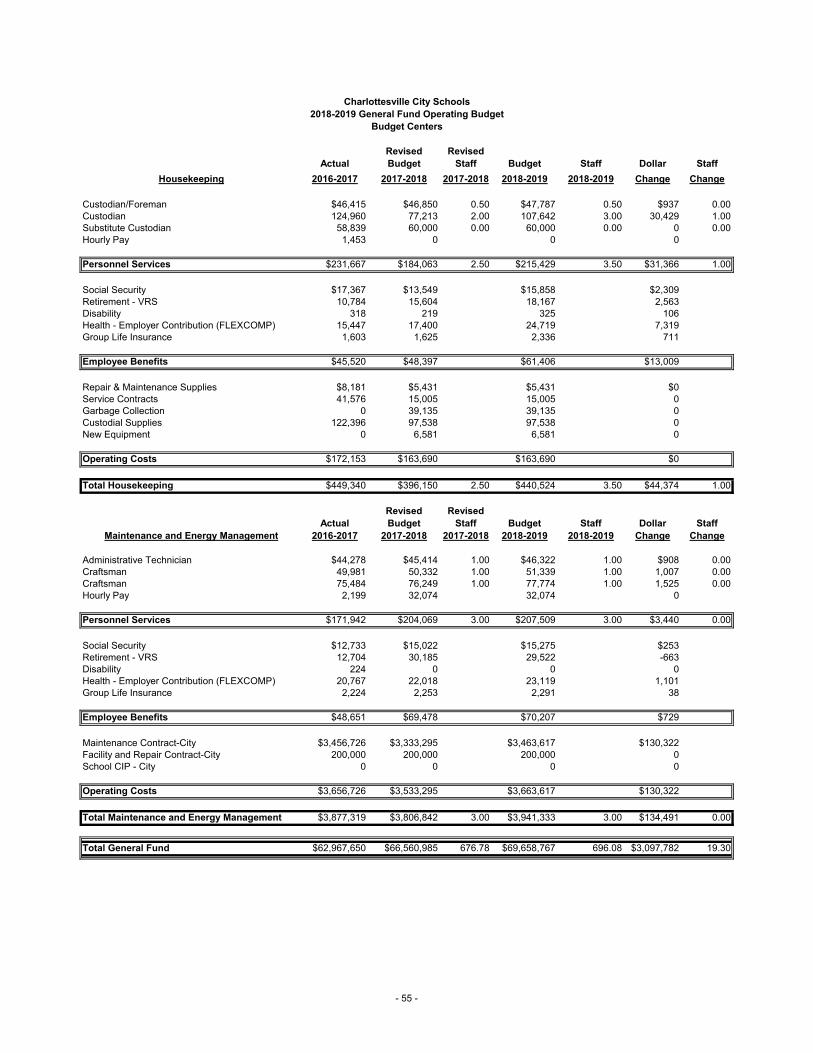
Charlottesville City Schools2018-2019 General Fund Operating Budget
Budget Centers
Revised Revised Actual Budget Staff Budget Staff Dollar Staff
Housekeeping 2016-2017 2017-2018 2017-2018 2018-2019 2018-2019 Change Change
Custodian/Foreman $46,415 $46,850 0.50 $47,787 0.50 $937 0.00Custodian 124,960 77,213 2.00 107,642 3.00 30,429 1.00Substitute Custodian 58,839 60,000 0.00 60,000 0.00 0 0.00Hourly Pay 1,453 0 0 0
Personnel Services $231,667 $184,063 2.50 $215,429 3.50 $31,366 1.00
Social Security $17,367 $13,549 $15,858 $2,309Retirement - VRS 10,784 15,604 18,167 2,563Disability 318 219 325 106Health - Employer Contribution (FLEXCOMP) 15,447 17,400 24,719 7,319Group Life Insurance 1,603 1,625 2,336 711
Employee Benefits $45,520 $48,397 $61,406 $13,009
Repair & Maintenance Supplies $8,181 $5,431 $5,431 $0Service Contracts 41,576 15,005 15,005 0Garbage Collection 0 39,135 39,135 0Custodial Supplies 122,396 97,538 97,538 0New Equipment 0 6,581 6,581 0
Operating Costs $172,153 $163,690 $163,690 $0
Total Housekeeping $449,340 $396,150 2.50 $440,524 3.50 $44,374 1.00
Revised Revised Actual Budget Staff Budget Staff Dollar Staff
Maintenance and Energy Management 2016-2017 2017-2018 2017-2018 2018-2019 2018-2019 Change Change
Administrative Technician $44,278 $45,414 1.00 $46,322 1.00 $908 0.00Craftsman 49,981 50,332 1.00 51,339 1.00 1,007 0.00Craftsman 75,484 76,249 1.00 77,774 1.00 1,525 0.00Hourly Pay 2,199 32,074 32,074 0
Personnel Services $171,942 $204,069 3.00 $207,509 3.00 $3,440 0.00
Social Security $12,733 $15,022 $15,275 $253Retirement - VRS 12,704 30,185 29,522 -663Disability 224 0 0 0Health - Employer Contribution (FLEXCOMP) 20,767 22,018 23,119 1,101Group Life Insurance 2,224 2,253 2,291 38
Employee Benefits $48,651 $69,478 $70,207 $729
Maintenance Contract-City $3,456,726 $3,333,295 $3,463,617 $130,322Facility and Repair Contract-City 200,000 200,000 200,000 0School CIP - City 0 0 0 0
Operating Costs $3,656,726 $3,533,295 $3,663,617 $130,322
Total Maintenance and Energy Management $3,877,319 $3,806,842 3.00 $3,941,333 3.00 $134,491 0.00
Total General Fund $62,967,650 $66,560,985 676.78 $69,658,767 696.08 $3,097,782 19.30
- 55 -

ENROLLMENT
- 56 -

System Wide Enrollment Projections 2018-2019
K - 12 Grand
Schools 3 Yr P K 1 2 3 4 5 6 7 8 9 10 11 12 Sp.Ed Total Total
Burnley-Moran Elementary 2 18 70 66 81 70 75 7 369 389
Clark Elementary 27 30 57 57 60 53 48 8 283 340
Greenbrier Elementary 11 15 70 70 78 80 70 1 369 395
Jackson-Via Elementary 12 30 65 78 60 60 59 18 340 382
Johnson Elementary 15 36 64 63 62 57 57 5 308 359
Venable Elementary 2 27 60 58 57 59 57 3 294 323
Walker Upper Elementary 367 279 19 665 665
Buford Middle 248 244 37 529 529
Charlottesville High 328 282 243 251 61 1165 1165
Total 69 156 386 392 398 379 366 367 279 248 244 328 282 243 251 159 4322 4547
K 1 2 3 4 5 6 7 8 9 10 11 12 TotalSp.Ed by Grade level 12 12 7 7 4 4 15 23 14 5 19 23 14 159
2019 Projection 398 404 405 386 370 371 294 271 258 333 301 266 265 4322Actual Sept 30, 2017 enrollment 409 402 405 371 402 319 280 263 255 338 301 257 255 4257
Projection minus Sept 30, 2016 Actual -11 2 0 15 -32 52 14 8 3 -5 0 9 10 65-26 Elementary difference 77 Middle difference 14 CHS difference
2019 Projection 398 404 405 386 370 371 294 271 258 333 301 266 265 43222018 Projection 407 395 401 372 398 307 282 270 247 336 328 253 267 4263
2018 Projection minus 2017 Projection -9 9 4 14 -28 64 12 1 11 -3 -27 13 -2 59-10 Elementary difference 88 Middle difference -19 CHS difference
Actual Sept 30, 2017 enrollment 409 402 405 371 402 319 280 263 255 338 301 257 255 42572018 Projection 407 395 401 372 398 307 282 270 247 336 328 253 267 4263
Sept 20, 2016 Actual minus 2017 Projection 2 7 4 -1 4 12 -2 -7 8 2 -27 4 -12 -616 Elementary difference 11 Middle difference -33 CHS difference
Actual Sept 30, 2017 enrollment 409 402 405 371 402 319 280 263 255 338 301 257 255 4257Actual Sept 30, 2016 enrollment 396 410 398 410 340 296 275 252 252 351 296 252 292 42202017 Actual minus 2016 Actual 13 -8 7 -39 62 23 5 11 3 -13 5 5 -37 37
35 Elementary difference 42 Middle difference -40 CHS difference
- 57 -

Comparison of September Enrollment to 2018-2019 ProjectionK - 12 Grand
Schools P +3 Yr K 1 2 3 4 5 6 7 8 9 10 11 12 Total TotalBurnley-Moran Projected Fall FY19 20 72 68 84 70 75 369 389
September 2017 Enrollment 20 68 84 67 71 83 373 393FY19 Projected minus Sept 2017 0 4 -16 17 -1 -8 -4 -4
Clark Projected Fall FY19 57 60 60 60 53 50 283 340
September 2017 Enrollment 54 54 64 56 48 58 280 334FY19 Projected minus Sept 2017 3 6 -4 4 5 -8 3 6
Greenbrier Projected Fall FY19 26 70 70 78 80 71 369 395
September 2017 Enrollment 28 66 76 87 74 68 371 399FY19 Projected minus Sept 2017 -2 4 -6 -9 6 3 -2 -4
Jackson-Via Projected Fall FY19 42 71 84 62 64 59 340 382
September 2017 Enrollment 42 83 60 65 61 63 332 374FY19 Projected minus Sept 2017 0 -12 24 -3 3 -4 8 8
Johnson Projected Fall FY19 51 65 64 63 59 57 308 359
September 2017 Enrollment 52 63 65 63 58 67 316 368FY19 Projected minus Sept 2017 -1 2 -1 0 1 -10 -8 -9
Venable Projected Fall FY19 29 60 58 58 60 58 294 323
September 2017 Enrollment 31 75 53 67 59 63 317 348FY19 Projected minus Sept 2017 -2 -15 5 -9 1 -5 -23 -25
Walker 2018 371 294 665 665
September 2017 Enrollment 319 280 599 599FY19 Projected minus Sept 2017 52 14 66 66
Buford 2018 271 258 529 529
September 2017 Enrollment 263 255 518 518FY19 Projected minus Sept 2017 8 3 11 11
Charlottesville High 2018 333 301 266 265 1165 1165
September 2017 Enrollment 338 301 257 255 1151 1151FY19 Projected minus Sept 2017 -5 0 9 10 14 14
Total FY19 Projection 225 398 404 405 386 370 371 294 271 258 333 301 266 265 4322 4547
Total Sept 2017 227 409 402 405 371 402 319 280 263 255 338 301 257 255 4257 4484FY19 Projected minus Sept 2017 -2 -11 2 0 15 -32 52 14 8 3 -5 0 9 10 65 63
Change In Cohort -5 3 -19 -1 -31 -25 -9 -5 78 -37 -35 8
AVERAGE HISTORICAL CHANGE IN COHORT (K to 1, 1 to 2, etc.)
K to 1 2 3 4 5 6 7 8 9 10 11 12
Last 16 years 3 -11 -21 -11 -24 -7 -10 -11 90 -39 -57 16Last 8 years 7 -10 -23 -8 -27 -9 -13 -4 82 -25 -42 12Last 4 years 6 -11 -28 -11 -28 -15 -6 -4 84 -31 -45 12
- 58 -

1998-1999 Through 2018-2019
Charlottesville City Schools fall membership by school from 1998-1999 to the 2018-2019 projected membership*Note: "UG" contains special education students in self contained classrooms. Some years show these students in grade level
Burnley-Moran K 1 2 3 4 5 6 7 8 9 10 11 12 UG Total
1998-99 79 91 49 64 80 15 3781999-00 75 85 81 59 62 3622000-01 74 88 89 75 65 3912001-02 57 78 79 84 78 3762002-03 59 63 83 76 77 3582003-04 72 59 61 80 75 3472004-05 60 68 60 50 65 3032005-06 55 66 70 56 45 2922006-07 50 60 60 63 57 2902007-08 66 53 53 65 57 2942008-09 61 73 55 53 59 3012009-10 55 64 74 55 50 2982010-11 69 62 70 71 51 3232011-12 64 71 59 65 67 3262012-13 90 72 65 54 58 3392013-14 91 85 75 66 53 3702014-15 80 86 76 65 60 3672015-16 58 77 84 69 57 3452016-17 81 74 75 86 67 3832017-18 68 84 67 71 83 3732018-19 Projection 72 68 84 70 75 369
Clark K 1 2 3 4 5 6 7 8 9 10 11 12 UG Total
1998-99 54 68 64 57 58 18 3191999-00 61 62 60 48 46 2772000-01 55 60 55 44 45 2592001-02 63 53 55 51 41 2632002-03 66 70 46 60 52 2942003-04 60 66 58 36 61 2812004-05 59 43 51 44 34 2312005-06 55 50 35 41 37 2182006-07 44 52 50 35 39 2202007-08 57 39 48 38 30 2122008-09 43 46 35 43 37 2042009-10 47 43 39 35 38 2022010-11 45 52 43 40 28 2082011-12 59 51 49 42 37 2382012-13 55 56 46 41 35 2332013-14 69 57 60 42 43 2712014-15 83 60 58 48 46 2952015-16 66 69 49 53 49 2862016-17 64 62 63 54 51 2942017-18 54 64 56 48 58 2802018-19 Projection 60 60 60 53 50 283
- 59 -

1998-1999 Through 2018-2019
Charlottesville City Schools fall membership by school from 1998-1999 to the 2018-2019 projected membership*Note: "UG" contains special education students in self contained classrooms. Some years show these students in grade level
Greenbrier K 1 2 3 4 5 6 7 8 9 10 11 12 UG Total
1998-99 47 60 50 50 61 12 2801999-00 53 51 51 48 55 2582000-01 50 47 64 46 47 2542001-02 57 56 51 59 39 2622002-03 62 45 51 50 53 2612003-04 65 54 49 40 49 2572004-05 58 62 64 47 46 2772005-06 64 60 59 63 51 2972006-07 53 56 62 57 58 2862007-08 53 52 57 58 52 2722008-09 62 45 53 56 53 2692009-10 73 58 51 51 49 2822010-11 54 76 58 47 56 2912011-12 62 54 74 54 52 2962012-13 73 69 63 66 49 3202013-14 84 70 67 60 66 3472014-15 67 87 74 64 56 3482015-16 71 79 87 61 61 3592016-17 64 82 76 75 59 3562017-18 66 76 87 74 68 3712018-19 Projection 70 70 78 80 71 369
Jackson-Via K 1 2 3 4 5 6 7 8 9 10 11 12 UG Total
1998-99 64 77 52 67 58 20 3381999-00 60 76 66 68 74 3442000-01 57 62 65 76 62 3222001-02 64 68 54 59 63 3082002-03 46 50 60 57 59 2722003-04 48 49 53 58 51 2592004-05 66 50 44 52 42 2542005-06 51 60 51 41 54 2572006-07 53 55 57 43 41 2492007-08 60 56 51 58 36 2612008-09 75 56 50 54 47 2822009-10 55 55 53 48 56 2672010-11 48 51 52 53 44 2482011-12 70 42 47 50 59 2682012-13 70 69 46 43 48 2762013-14 67 69 63 45 43 2872014-15 64 63 58 57 43 2852015-16 68 58 61 55 55 2972016-17 66 61 58 63 58 3062017-18 83 60 65 61 63 3322018-19 Projection 71 84 62 64 59 340
- 60 -

1998-1999 Through 2018-2019
Charlottesville City Schools fall membership by school from 1998-1999 to the 2018-2019 projected membership*Note: "UG" contains special education students in self contained classrooms. Some years show these students in grade level
Johnson K 1 2 3 4 5 6 7 8 9 10 11 12 UG Total
1998-99 69 64 62 52 52 16 3151999-00 62 75 75 64 62 3382000-01 61 63 68 70 55 3172001-02 65 54 58 64 60 3012002-03 55 67 55 45 65 2872003-04 55 66 66 61 47 2952004-05 53 56 58 70 63 3002005-06 50 44 55 58 65 2722006-07 50 47 41 45 55 2382007-08 45 52 36 41 45 2192008-09 49 50 41 39 42 2212009-10 48 57 50 37 38 2302010-11 62 55 49 50 41 2572011-12 58 63 53 43 52 2692012-13 60 51 55 43 43 2522013-14 73 55 47 55 40 2702014-15 66 77 55 40 49 2872015-16 67 64 73 55 44 3032016-17 65 64 59 68 49 3052017-18 63 65 63 58 67 3162018-19 Projection 65 64 63 59 57 308
Venable K 1 2 3 4 5 6 7 8 9 10 11 12 UG Total
1998-99 51 59 51 58 44 15 2781999-00 56 58 55 53 56 2782000-01 49 55 50 54 51 2592001-02 49 63 54 44 59 2692002-03 40 68 70 54 49 2812003-04 44 50 66 63 50 2732004-05 56 59 54 60 72 3012005-06 48 61 53 52 49 2632006-07 63 61 68 49 51 2922007-08 53 62 63 66 51 2952008-09 59 56 63 52 68 2982009-10 53 58 49 58 59 2772010-11 56 59 54 49 57 2752011-12 55 69 63 56 52 2952012-13 74 66 68 62 59 3292013-14 61 65 59 63 57 3052014-15 60 62 61 59 61 3032015-16 62 62 71 57 58 3102016-17 56 67 67 64 56 3102017-18 75 53 67 59 63 3172018-19 Projection 60 58 58 60 58 294
- 61 -

1998-1999 Through 2018-2019
Charlottesville City Schools fall membership by school from 1998-1999 to the 2018-2019 projected membership*Note: "UG" contains special education students in self contained classrooms. Some years show these students in grade level
Walker K 1 2 3 4 5 6 7 8 9 10 11 12 UG Total
1998-99 330 284 51 6651999-00 366 363 7292000-01 326 360 6862001-02 302 314 6162002-03 325 309 6342003-04 345 326 6712004-05 302 328 6302005-06 294 302 5962006-07 284 282 5662007-08 276 278 5542008-09 254 264 5182009-10 289 260 5492010-11 267 287 5542011-12 264 264 5282012-13 281 257 5382013-14 263 280 5432014-15 273 255 5282015-16 285 248 5332016-17 296 275 5712017-18 319 280 5992018-19 Projection 371 294 665
Buford K 1 2 3 4 5 6 7 8 9 10 11 12 UG Total
1998-99 310 308 47 6651999-00 299 314 6132000-01 338 269 6072001-02 354 312 6662002-03 317 332 6492003-04 298 296 5942004-05 337 262 5992005-06 309 320 6292006-07 295 294 5892007-08 269 280 5492008-09 273 268 5412009-10 244 251 4952010-11 230 237 4672011-12 273 232 5052012-13 241 263 5042013-14 247 242 4892014-15 270 239 5092015-16 248 257 5052016-17 252 252 5042017-18 263 255 5182018-19 Projection 271 258 529
- 62 -

1998-1999 Through 2018-2019
Charlottesville City Schools fall membership by school from 1998-1999 to the 2018-2019 projected membership*Note: "UG" contains special education students in self contained classrooms. Some years show these students in grade level
Charlottesville High K 1 2 3 4 5 6 7 8 9 10 11 12 UG Total
1998-99 293 275 262 203 125 11581999-00 318 288 258 245 103 12122000-01 301 289 234 252 134 12102001-02 357 250 248 221 119 11952002-03 399 288 199 254 88 12282003-04 451 343 241 255 6 12962004-05 417 369 285 255 3 13292005-06 378 364 309 291 0 13422006-07 409 332 264 328 0 13332007-08 359 380 236 283 3 12612008-09 368 323 284 270 1 12462009-10 356 315 260 290 5 12262010-11 319 321 263 266 0 11692011-12 316 311 289 287 0 12032012-13 317 303 277 299 0 11962013-14 355 296 268 284 0 12032014-15 312 343 240 284 11792015-16 324 278 284 261 11472016-17 351 296 252 292 11912017-18 338 301 257 255 11512018-19 Projection 333 301 266 265 1165
Systemwide K 1 2 3 4 5 6 7 8 9 10 11 12 UG Total
1998-99 364 419 328 348 353 330 284 310 308 293 275 262 203 319 43961999-00 367 407 388 340 355 366 363 299 314 318 288 258 245 103 44112000-01 346 375 391 365 325 326 360 338 269 301 289 234 252 134 43052001-02 355 372 351 361 340 302 314 354 312 357 250 248 221 119 42562002-03 328 363 365 342 355 325 309 317 332 399 288 199 254 88 42642003-04 344 344 353 338 333 345 326 298 296 451 343 241 255 6 42732004-05 352 338 331 323 322 302 328 337 262 417 369 285 255 3 42242005-06 323 341 323 311 301 294 302 309 320 378 364 309 291 0 41662006-07 313 331 338 292 301 284 282 295 294 409 332 264 328 0 40632007-08 334 314 308 326 271 276 278 269 280 359 380 236 283 3 39172008-09 349 326 297 297 306 254 264 273 268 368 323 284 270 1 38802009-10 331 335 316 284 290 289 260 244 251 356 315 260 290 5 38262010-11 334 355 326 310 277 267 287 230 237 319 321 263 266 0 37922011-12 368 350 345 310 319 264 264 273 232 316 311 289 287 0 39282012-13 422 383 343 309 292 281 257 241 263 317 303 277 299 0 39872013-14 445 401 371 331 302 263 280 247 242 355 296 268 284 0 40852014-15 403 444 373 338 318 273 255 270 239 312 343 240 284 0 40922015-16 390 402 439 351 326 285 248 248 257 324 278 284 261 0 40932016-17 396 410 398 410 340 296 275 252 252 351 296 252 292 0 42202017-18 409 402 405 371 402 319 280 263 255 338 301 257 255 0 42572018-19 Projection 398 404 405 386 370 371 294 271 258 333 301 266 265 0 4322
- 63 -

POSITION CONTROL
- 64 -

696.08, 82.8%
144.85, 17.2%
Position Control2018 - 2019
General Fund Restricted Fund
- 65 -

POSITION CONTROL SUMMARY
CHARLOTTESVILLE CITY SCHOOLS CHARLOTTESVILLE CITY SCHOOLS CHARLOTTESVILLE CITY SCHOOLSGENERAL FUND POSITIONS RESTRICTED FUND POSITIONS TOTAL POSITIONS
2017-2018 2017-2018 2017-2018 BUDGET BUDGET BUDGET
ACTUAL BUDGET BUDGET TO 2018-2019 ACTUAL BUDGET BUDGET TO 2018-2019 ACTUAL BUDGET BUDGET TO 2018-2019POSITION 2016-2017 2017-2018 2018-2019 BUDGET 2016-2017 2017-2018 2018-2019 BUDGET 2016-2017 2017-2018 2018-2019 BUDGET
Superintendent 1.00 1.00 1.00 0.00 0.00 0.00 0.00 0.00 1.00 1.00 1.00 0.00Associate Superintendent 1.00 2.00 2.00 0.00 0.00 0.00 0.00 0.00 1.00 2.00 2.00 0.00Assistant Superintendent 1.00 1.00 1.00 0.00 0.00 0.00 0.00 0.00 1.00 1.00 1.00 0.00Director 4.00 3.80 3.80 0.00 1.00 0.00 1.00 1.00 5.00 3.80 4.80 1.00Principal 10.00 10.00 9.80 -0.20 0.00 0.00 0.00 0.00 10.00 10.00 9.80 -0.20Assistant Principal 14.00 15.00 15.00 0.00 0.00 0.00 0.00 0.00 14.00 15.00 15.00 0.00Program Administrator 0.00 0.00 0.00 0.00 0.00 0.00 0.00 0.00 0.00 0.00 0.00 0.00Coordinator 12.55 13.35 14.85 1.50 10.25 15.47 8.75 -6.72 22.80 28.82 23.60 -5.22Supervisor 1.00 1.00 1.00 0.00 0.00 0.00 0.00 0.00 1.00 1.00 1.00 0.00Network Engineer 1.00 1.00 3.00 2.00 0.00 0.00 0.00 0.00 1.00 1.00 3.00 2.00Administrative Technician 23.75 25.45 27.28 1.83 4.00 0.00 3.00 3.00 27.75 25.45 30.28 4.83
Teacher:General Education 292.44 318.76 324.00 5.24 57.03 35.61 54.41 18.80 349.47 354.37 378.41 24.04Special Education 59.16 61.24 59.87 -1.37 10.06 10.86 10.86 0.00 69.22 72.10 70.73 -1.37Vocational Education 6.60 6.60 6.60 0.00 0.00 0.00 0.00 0.00 6.60 6.60 6.60 0.00Technology Integration 4.00 5.00 6.80 1.80 0.00 0.00 0.00 0.00 4.00 5.00 6.80 1.80Instructional Coach 11.60 5.00 5.00 0.00 0.00 0.00 0.00 0.00 11.60 5.00 5.00 0.00Extended Learning Staffing 0.00 0.00 0.00 0.00 0.00 0.00 0.00 0.00 0.00 0.00 0.00 0.00
Librarian 10.00 10.00 10.00 0.00 0.00 0.00 0.00 0.00 10.00 10.00 10.00 0.00Counselor 19.00 19.00 19.00 0.00 0.00 0.00 0.00 0.00 19.00 19.00 19.00 0.00Psychologist 4.00 4.00 4.00 0.00 0.00 0.00 0.00 0.00 4.00 4.00 4.00 0.00Behavior/Transition Specialist 0.00 1.00 1.00 0.00 0.00 0.00 0.00 0.00 0.00 1.00 1.00 0.00Athletic Trainer 1.00 1.00 1.00 0.00 0.00 0.00 0.00 0.00 1.00 1.00 1.00 0.00Social Worker 4.50 4.20 4.70 0.50 0.00 0.00 0.00 0.00 4.50 4.20 4.70 0.50Reading Intervention 0.00 0.00 0.00 0.00 5.00 5.00 5.00 0.00 5.00 5.00 5.00 0.00Athletic Director 1.00 1.00 1.00 0.00 0.00 0.00 0.00 0.00 1.00 1.00 1.00 0.00Home School Counselor 3.00 3.00 3.50 0.50 0.00 0.00 0.00 0.00 3.00 3.00 3.50 0.50Nurse 10.00 10.00 10.00 0.00 0.00 0.00 0.00 0.00 10.00 10.00 10.00 0.00
Instructional Assistant:General Education 45.50 54.00 61.00 7.00 12.00 9.91 12.91 3.00 57.50 63.91 73.91 10.00Special Education 35.50 37.00 34.00 -3.00 7.71 9.91 9.91 0.00 43.21 46.91 43.91 -3.00
Secretary:Office of Principal 5.00 5.00 5.00 0.00 0.00 0.00 0.00 0.00 5.00 5.00 5.00 0.00Guidance 3.00 3.00 3.00 0.00 0.00 0.00 0.00 0.00 3.00 3.00 3.00 0.00Media 1.00 1.00 1.00 0.00 0.00 0.00 0.00 0.00 1.00 1.00 1.00 0.00Division Wide 1.00 1.00 1.00 0.00 1.00 0.00 1.00 1.00 2.00 1.00 2.00 1.00
Reprographics Specialist 0.75 0.75 0.75 0.00 0.00 0.00 0.00 0.00 0.75 0.75 0.75 0.00
Site Directors 0.00 0.00 0.00 0.00 4.15 6.00 6.00 0.00 4.15 6.00 6.00 0.00
Athletic Equip. & Fac. Mgr. 1.00 1.00 1.00 0.00 0.00 0.00 0.00 0.00 1.00 1.00 1.00 0.00Lead Technology Specialist 1.00 1.00 1.00 0.00 0.00 0.00 0.00 0.00 1.00 1.00 1.00 0.00Data Systems Technician 10.00 10.00 9.00 -1.00 0.00 0.00 0.00 0.00 10.00 10.00 9.00 -1.00Foreman 0.50 0.50 0.50 0.00 0.00 0.00 0.00 0.00 0.50 0.50 0.50 0.00Custodian 41.13 39.13 41.63 2.50 0.00 0.00 0.00 0.00 41.13 39.13 41.63 2.50Craftsman 3.00 0.00 2.00 2.00 0.00 0.00 0.00 0.00 3.00 0.00 2.00 2.00Child Nutrition Staff 0.00 0.00 0.00 0.00 35.02 32.01 32.01 0.00 35.02 32.01 32.01 0.00
643.98 676.78 696.08 19.30 147.22 124.77 144.85 20.08 791.20 801.55 840.93 39.38
- 66 -

CHARLOTTESVILLE HIGH SCHOOL CHARLOTTESVILLE HIGH SCHOOL CHARLOTTESVILLE HIGH SCHOOL
GENERAL FUND POSITIONS
RESTRICTED FUND POSITIONS
ALL FUND POSITIONS
2017-2018 2017-2018 2017-2018Revised BUDGET Revised BUDGET Revised BUDGET
ACTUAL BUDGET BUDGET TO 2018-2019 ACTUAL BUDGET BUDGET TO 2018-2019 ACTUAL BUDGET BUDGET TO 2018-2019POSITION 2016-2017 2017-2018 2018-2019 BUDGET 2016-2017 2017-2018 2018-2019 BUDGET 2016-2017 2017-2018 2018-2019 BUDGET
Teacher: `General Education 70.44 73.80 74.60 0.80 2.00 2.00 2.00 0.00 72.44 75.80 76.60 0.80Special Education 16.50 16.00 15.57 -0.43 1.00 1.00 1.00 0.00 17.50 17.00 16.57 -0.43Vocational Education 5.00 5.00 5.00 0.00 0.00 0.00 0.00 0.00 5.00 5.00 5.00 0.00
Principal 1.00 1.00 1.00 0.00 0.00 0.00 0.00 0.00 1.00 1.00 1.00 0.00Assistant Principal 4.00 4.00 4.00 0.00 0.00 0.00 0.00 0.00 4.00 4.00 4.00 0.00Coordinator of Testing 0.50 0.50 1.50 1.00 0.00 0.00 0.00 0.00 0.50 0.50 1.50 1.00Librarian 2.00 2.00 2.00 0.00 0.00 0.00 0.00 0.00 2.00 2.00 2.00 0.00Nurse 2.00 2.00 2.00 0.00 0.00 0.00 0.00 0.00 2.00 2.00 2.00 0.00Counselor 6.00 6.00 6.00 0.00 0.00 0.00 0.00 0.00 6.00 6.00 6.00 0.00Home School Counselor 1.00 1.00 1.00 0.00 0.00 0.00 0.00 0.00 1.00 1.00 1.00 0.00
Instructional Assistant:General Education 0.00 0.00 0.00 0.00 0.00 0.00 0.00 0.00 0.00 0.00 0.00 0.00Special Education 6.00 6.00 6.00 0.00 0.00 0.00 0.00 0.00 6.00 6.00 6.00 0.00
Secretary:Guidance 1.00 1.00 1.00 0.00 0.00 0.00 0.00 0.00 1.00 1.00 1.00 0.00Media 1.00 1.00 1.00 0.00 0.00 0.00 0.00 0.00 1.00 1.00 1.00 0.00Office of Principal 5.00 5.00 5.00 0.00 0.00 0.00 0.00 0.00 5.00 5.00 5.00 0.00
Custodian 11.13 11.13 10.63 -0.50 0.00 0.00 0.00 0.00 11.13 11.13 10.63 -0.50Performing Arts Center - Coordinator 0.00 0.00 0.00 0.00 1.50 1.50 1.50 0.00 1.50 1.50 1.50 0.00Child Nutrition Staff 0.00 0.00 0.00 0.00 6.34 4.67 4.67 0.00 6.34 4.67 4.67 0.00
Total 132.57 135.43 136.30 0.87 10.84 9.17 9.17 0.00 143.41 144.60 145.47 0.87
Funding Sources for Restricted Positions
Federal - Title VI - Flow Thru1.00Teacher
WALK Program2.00 Teacher
Local - Child Nutrition Program4.67 Child Nutrition StaffLocal - Performing Arts
1.50 Manager
- 67 -

BUFORD MIDDLE SCHOOL BUFORD MIDDLE SCHOOL BUFORD MIDDLE SCHOOL
GENERAL FUND POSITIONS
RESTRICTED FUND POSITIONS
ALL FUND POSITIONS
2017-2018 2017-2018 2017-2018Revised BUDGET Revised BUDGET Revised BUDGET
ACTUAL BUDGET BUDGET TO 2018-2019 ACTUAL BUDGET BUDGET TO 2018-2019 ACTUAL BUDGET BUDGET TO 2018-2019POSITION 2016-2017 2017-2018 2018-2019 BUDGET 2016-2017 2017-2018 2018-2019 BUDGET 2016-2017 2017-2018 2018-2019 BUDGET
Teacher:General Education 34.70 36.80 38.80 2.00 0.00 0.00 0.00 0.00 34.70 36.80 38.80 2.00Special Education 8.50 8.30 7.00 -1.30 0.00 0.00 0.00 0.00 8.50 8.30 7.00 -1.30Vocational Education 1.60 1.60 1.60 0.00 0.00 0.00 0.00 0.00 1.60 1.60 1.60 0.00i3 Grant Teachers 0.00 0.00 0.00 0.00 1.20 1.20 0.00 -1.20 1.20 1.20 0.00 -1.20
Principal 1.00 1.00 1.00 0.00 0.00 0.00 0.00 0.00 1.00 1.00 1.00 0.00Assistant Principal 2.00 2.00 2.00 0.00 0.00 0.00 0.00 0.00 2.00 2.00 2.00 0.00Librarian 1.00 1.00 1.00 0.00 0.00 0.00 0.00 0.00 1.00 1.00 1.00 0.00Nurse 1.00 1.00 1.00 0.00 0.00 0.00 0.00 0.00 1.00 1.00 1.00 0.00Counselor 2.00 2.00 2.00 0.00 0.00 0.00 0.00 0.00 2.00 2.00 2.00 0.00Home School Counselor 0.50 0.50 0.50 0.00 0.00 0.00 0.00 0.00 0.50 0.50 0.50 0.00
Instructional Assistant:Special Education 4.00 4.00 3.00 -1.00 1.00 1.00 1.00 0.00 5.00 5.00 4.00 -1.00
Administrative Technician 1.00 1.82 1.95 0.13 0.00 0.00 0.00 0.00 1.00 1.82 1.95 0.13
Secretary:Guidance 1.00 1.00 1.00 0.00 0.00 0.00 0.00 0.00 1.00 1.00 1.00 0.00
Custodian 5.00 5.00 5.00 0.00 0.00 0.00 0.00 0.00 5.00 5.00 5.00 0.00Child Nutrition Staff 0.00 0.00 0.00 0.00 7.66 5.00 5.00 0.00 7.66 5.00 5.00 0.00
Total 63.30 67.02 66.85 -0.17 9.86 7.20 6.00 -1.20 73.16 74.22 72.85 -1.37
Funding Sources for Restricted Positions
Federal Title IV-Flow Thru1.00 Special Education Instructional Assistant
Local - Child Nutritiion Program5.00 Child Nutrition Staff
- 68 -

WALKER SCHOOL WALKER SCHOOL WALKER SCHOOL
GENERAL FUND POSITIONS
RESTRICTED FUND POSITIONS
ALL FUND POSITIONS
2017-2018 2017-2018 2017-2018Revised BUDGET Revised BUDGET Revised BUDGET
ACTUAL BUDGET BUDGET TO 2018-2019 ACTUAL BUDGET BUDGET TO 2018-2019 ACTUAL BUDGET BUDGET TO 2018-2019POSITION 2016-2017 2017-2018 2018-2019 BUDGET 2016-2017 2017-2018 2018-2019 BUDGET 2016-2017 2017-2018 2018-2019 BUDGET
Teacher:General Education 39.50 39.00 42.00 3.00 0.00 0.00 0.00 0.00 39.50 39.00 42.00 3.00Special Education 6.00 6.00 6.00 0.00 4.00 4.00 4.00 0.00 10.00 10.00 10.00 0.00
Principal 1.00 1.00 0.80 -0.20 0.00 0.00 0.00 0.00 1.00 1.00 0.80 -0.20Assistant Principal 2.00 3.00 3.00 0.00 0.00 0.00 0.00 0.00 2.00 3.00 3.00 0.00Librarian 1.00 1.00 1.00 0.00 0.00 0.00 0.00 0.00 1.00 1.00 1.00 0.00Nurse 1.00 1.00 1.00 0.00 0.00 0.00 0.00 0.00 1.00 1.00 1.00 0.00Counselor 2.00 2.00 2.00 0.00 0.00 0.00 0.00 0.00 2.00 2.00 2.00 0.00Home School Counselor 0.50 0.50 0.50 0.00 0.00 0.00 0.00 0.00 0.50 0.50 0.50 0.00
Instructional Assistant:General Education 0.00 0.00 0.00 0.00 0.00 0.00 0.00 0.00 0.00 0.00 0.00 0.00Special Education 3.50 3.50 3.50 0.00 1.00 1.00 1.00 0.00 4.50 4.50 4.50 0.00
Administrative Technician 1.00 1.25 1.25 0.00 0.00 0.00 0.00 0.00 1.00 1.25 1.25 0.00
Secretary:Guidance 1.00 1.00 1.00 0.00 0.00 0.00 0.00 0.00 1.00 1.00 1.00 0.00
Custodian 5.00 5.00 5.00 0.00 0.00 0.00 0.00 0.00 5.00 5.00 5.00 0.00Child Nutrition Staff 0.00 0.00 0.00 0.00 5.00 4.34 4.34 0.00 5.00 4.34 4.34 0.00
Total 63.50 64.25 67.05 2.80 10.00 9.34 9.34 0.00 73.50 73.59 76.39 2.80
Funding Sources for Restricted Positions
Federal - Title VI - Flow Thru4.00 Special Education Teachers
1.00 Special Education Instructional Assistant
Local - Child Nutrition Program4.34 Child Nutrition Staff
- 69 -

BURNLEY-MORAN SCHOOL BURNLEY-MORAN SCHOOL BURNLEY-MORAN SCHOOL
GENERAL FUND POSITIONS
RESTRICTED FUND POSITIONS
ALL FUND POSITIONS
2017-2018 2017-2018 2017-2018Revised BUDGET Revised BUDGET Revised BUDGET
ACTUAL BUDGET BUDGET TO 2018-2019 ACTUAL BUDGET BUDGET TO 2018-2019 ACTUAL BUDGET BUDGET TO 2018-2019POSITION 2016-2017 2017-2018 2018-2019 BUDGET 2016-2017 2017-2018 2018-2019 BUDGET 2016-2017 2017-2018 2018-2019 BUDGET
Teacher:General Education 19.80 23.80 23.80 0.00 3.50 4.00 4.00 0.00 23.30 27.80 27.80 0.00Special Education 3.72 4.00 4.00 0.00 0.00 0.00 0.00 0.00 3.72 4.00 4.00 0.00
Principal 1.00 1.00 1.00 0.00 0.00 0.00 0.00 0.00 1.00 1.00 1.00 0.00Assistant Principal 1.00 1.00 1.00 0.00 0.00 0.00 0.00 0.00 1.00 1.00 1.00 0.00Reading Intervention 0.00 0.00 0.00 0.00 0.50 0.50 0.50 0.00 0.50 0.50 0.50 0.00Librarian 1.00 1.00 1.00 0.00 0.00 0.00 0.00 0.00 1.00 1.00 1.00 0.00Nurse 1.00 1.00 1.00 0.00 0.00 0.00 0.00 0.00 1.00 1.00 1.00 0.00Counselor 1.00 1.00 1.00 0.00 0.00 0.00 0.00 0.00 1.00 1.00 1.00 0.00
Instructional Assistant:General Education 7.00 9.00 10.00 1.00 0.00 0.00 0.00 0.00 7.00 9.00 10.00 1.00Special Education 1.00 1.00 1.00 0.00 0.00 0.00 0.00 0.00 1.00 1.00 1.00 0.00
Administrative Technician 1.00 1.00 1.00 0.00 0.00 0.00 0.00 0.00 1.00 1.00 1.00 0.00
Custodian 3.00 3.00 3.00 0.00 0.00 0.00 0.00 0.00 3.00 3.00 3.00 0.00Site Directors 0.00 0.00 0.00 0.00 1.00 1.00 1.00 0.00 1.00 1.00 1.00 0.00Child Nutrition Staff 0.00 0.00 0.00 0.00 4.67 3.00 3.00 0.00 4.67 3.00 3.00 0.00
Total 40.52 46.80 47.80 1.00 9.67 8.50 8.50 0.00 50.19 55.30 56.30 1.00
Funding Sources for Restricted Positions
Federal - Title I3.00 Teachers
Federal - Title II, Part A-Class Size Reduction1.00 Teacher
Prevention, Intervention, Remediation.50 Teacher
Local - CLASS Program 1.00 Site Director
Local - Child Nutrition Program3.00 Child Nutrition Staff - 70 -

CLARK SCHOOL CLARK SCHOOL CLARK SCHOOL
GENERAL FUND POSITIONS
RESTRICTED FUND POSITIONS
ALL FUND POSITIONS
2017-2018 2017-2018 2017-2018Revised BUDGET Revised BUDGET Revised BUDGET
ACTUAL BUDGET BUDGET TO 2018-2019 ACTUAL BUDGET BUDGET TO 2018-2019 ACTUAL BUDGET BUDGET TO 2018-2019POSITION 2016-2017 2017-2018 2018-2019 BUDGET 2016-2017 2017-2018 2018-2019 BUDGET 2016-2017 2017-2018 2018-2019 BUDGET
Teacher:General Education 19.95 22.00 21.00 -1.00 5.00 5.00 5.00 0.00 24.95 27.00 26.00 -1.00Special Education 4.00 4.00 4.36 0.36 0.50 0.50 0.50 0.00 4.50 4.50 4.86 0.36
Principal 1.00 1.00 1.00 0.00 0.00 0.00 0.00 0.00 1.00 1.00 1.00 0.00Assistant Principal 1.00 1.00 1.00 0.00 0.00 0.00 0.00 0.00 1.00 1.00 1.00 0.00Librarian 1.00 1.00 1.00 0.00 0.00 0.00 0.00 0.00 1.00 1.00 1.00 0.00Reading Intervention 0.00 0.00 0.00 0.00 0.50 0.50 0.50 0.00 0.50 0.50 0.50 0.00Nurse 1.00 1.00 1.00 0.00 0.00 0.00 0.00 0.00 1.00 1.00 1.00 0.00Counselor 1.00 1.00 1.00 0.00 0.00 0.00 0.00 0.00 1.00 1.00 1.00 0.00
Instructional Assistant:General Education 8.00 9.00 10.00 1.00 0.00 0.00 0.00 0.00 8.00 9.00 10.00 1.00Special Education 7.00 6.00 6.00 0.00 0.00 0.00 0.00 0.00 7.00 6.00 6.00 0.00
Administrative Technician 1.00 1.00 1.00 0.00 0.00 0.00 0.00 0.00 1.00 1.00 1.00 0.00
Custodian 3.00 3.00 3.00 0.00 0.00 0.00 0.00 0.00 3.00 3.00 3.00 0.00Site Directors 0.00 0.00 0.00 0.00 0.71 1.00 1.00 0.00 0.71 1.00 1.00 0.00Child Nutrition Staff 0.00 0.00 0.00 0.00 2.00 3.00 3.00 0.00 2.00 3.00 3.00 0.00
Total 47.95 50.00 50.36 0.36 8.71 10.00 10.00 0.00 56.66 60.00 60.36 0.36
Funding Sources for Restricted Positions
Federal - Title I5.00 Teachers
Prevention, Intervention, Remediation.50 Teacher
Local - Medicaid.50 Teacher
Local - CLASS Program 1.00 Site Director
Local - Child Nutrition Program3.00 Child Nutrition Staff
- 71 -

GREENBRIER SCHOOL GREENBRIER SCHOOL GREENBRIER SCHOOL
GENERAL FUND POSITIONS
RESTRICTED FUND POSITIONS
ALL FUND POSITIONS
2017-2018 2017-2018 2017-2018Revised BUDGET Revised BUDGET Revised BUDGET
ACTUAL BUDGET BUDGET TO 2018-2019 ACTUAL BUDGET BUDGET TO 2018-2019 ACTUAL BUDGET BUDGET TO 2018-2019POSITION 2016-2017 2017-2018 2018-2019 BUDGET 2016-2017 2017-2018 2018-2019 BUDGET 2016-2017 2017-2018 2018-2019 BUDGET
Teacher:General Education 20.60 23.00 23.00 0.00 3.00 3.00 3.00 0.00 23.60 26.00 26.00 0.00Special Education 3.00 3.00 3.00 0.00 0.00 0.00 0.00 0.00 3.00 3.00 3.00 0.00
Principal 1.00 1.00 1.00 0.00 0.00 0.00 0.00 0.00 1.00 1.00 1.00 0.00Assistant Principal 1.00 1.00 1.00 0.00 0.00 0.00 0.00 0.00 1.00 1.00 1.00 0.00Reading Intervention 0.00 0.00 0.00 0.00 1.00 1.00 1.00 0.00 1.00 1.00 1.00 0.00Librarian 1.00 1.00 1.00 0.00 0.00 0.00 0.00 0.00 1.00 1.00 1.00 0.00Nurse 1.00 1.00 1.00 0.00 0.00 0.00 0.00 0.00 1.00 1.00 1.00 0.00Counselor 1.00 1.00 1.00 0.00 0.00 0.00 0.00 0.00 1.00 1.00 1.00 0.00
Instructional Assistant:General Education 7.00 9.00 10.00 1.00 0.00 0.00 0.00 0.00 7.00 9.00 10.00 1.00Special Education 2.00 1.00 1.00 0.00 1.00 0.91 0.91 0.00 3.00 1.91 1.91 0.00
Administrative Technician 1.00 1.00 1.00 0.00 0.00 0.00 0.00 0.00 1.00 1.00 1.00 0.00
Custodian 3.00 3.00 3.00 0.00 0.00 0.00 0.00 0.00 3.00 3.00 3.00 0.00Site Directors 0.00 0.00 0.00 0.00 1.09 2.00 2.00 0.00 1.09 2.00 2.00 0.00Child Nutrition Staff 0.00 0.00 0.00 0.00 2.34 3.00 3.00 0.00 2.34 3.00 3.00 0.00
Total 41.60 45.00 46.00 1.00 8.43 9.91 9.91 0.00 50.03 54.91 55.91 1.00
Funding Sources for Restricted Positions
Federal - Title I2.00 Teacher
Federal - Title II-A1.00 Teacher
Federal - Title VI - Flow Thru1.00 Instructional Assistant
Prevention, Intervention, Remediation1.00 Reading Intervention
Local - CLASS Program 1.09 Site Director
Local - Child Nutrition Program- 72 -

JACKSON-VIA SCHOOL JACKSON-VIA SCHOOL JACKSON-VIA SCHOOL
GENERAL FUND POSITIONS
RESTRICTED FUND POSITIONS
ALL FUND POSITIONS
2017-2018 2017-2018 2017-2018Revised BUDGET Revised BUDGET Revised BUDGET
ACTUAL BUDGET BUDGET TO 2018-2019 ACTUAL BUDGET BUDGET TO 2018-2019 ACTUAL BUDGET BUDGET TO 2018-2019POSITION 2016-2017 2017-2018 2018-2019 BUDGET 2016-2017 2017-2018 2018-2019 BUDGET 2016-2017 2017-2018 2018-2019 BUDGET
Teacher:General Education 18.85 19.60 19.60 0.00 2.50 2.50 2.50 0.00 21.35 22.10 22.10 0.00Special Education 5.00 6.00 6.00 0.00 1.50 2.30 2.30 0.00 6.50 8.30 8.30 0.00
Principal 1.00 1.00 1.00 0.00 0.00 0.00 0.00 0.00 1.00 1.00 1.00 0.00Assistant Principal 1.00 1.00 1.00 0.00 0.00 0.00 0.00 0.00 1.00 1.00 1.00 0.00Reading Intervention 0.00 0.00 0.00 0.00 1.00 1.00 1.00 0.00 1.00 1.00 1.00 0.00Librarian 1.00 1.00 1.00 0.00 0.00 0.00 0.00 0.00 1.00 1.00 1.00 0.00Nurse 1.00 1.00 1.00 0.00 0.00 0.00 0.00 0.00 1.00 1.00 1.00 0.00Counselor 1.00 1.00 1.00 0.00 0.00 0.00 0.00 0.00 1.00 1.00 1.00 0.00
Instructional Assistant:General Education 6.00 7.00 9.00 2.00 0.00 0.00 0.00 0.00 6.00 7.00 9.00 2.00Special Education 4.00 6.50 5.50 -1.00 1.50 2.50 2.50 0.00 5.50 9.00 8.00 -1.00
Administrative Technician 1.00 1.00 1.00 0.00 0.00 0.00 0.00 0.00 1.00 1.00 1.00 0.00
Custodian 3.00 3.00 3.00 0.00 0.00 0.00 0.00 0.00 3.00 3.00 3.00 0.00Site Directors 0.00 0.00 0.00 0.00 0.85 1.00 1.00 0.00 0.85 1.00 1.00 0.00Child Nutrition Staff 0.00 0.00 0.00 0.00 2.67 3.00 3.00 0.00 2.67 3.00 3.00 0.00
Total 42.85 48.10 49.10 1.00 10.02 12.30 12.30 0.00 52.87 60.40 61.40 1.00
Funding Sources for Restricted Positions
Federal Title IV-Flow Thru2.30 Special Education Teachers
Federal - Title I2.50 Teachers
Prevention, Intervention, Remediation1.00 Reading Intervention
Medicaid1.00 Teacher
1.50 Instructional Assistant
Local - CLASS Program 1.00 Site Director
Local - Child Nutrition Program3.00 Child Nutrition Staff
- 73 -

JOHNSON SCHOOL JOHNSON SCHOOL JOHNSON SCHOOL
GENERAL FUND POSITIONS
RESTRICTED FUND POSITIONS
ALL FUND POSITIONS
2017-2018 2017-2018 2017-2018Revised BUDGET Revised BUDGET Revised BUDGET
ACTUAL BUDGET BUDGET TO 2018-2019 ACTUAL BUDGET BUDGET TO 2018-2019 ACTUAL BUDGET BUDGET TO 2018-2019POSITION 2016-2017 2017-2018 2018-2019 BUDGET 2016-2017 2017-2018 2018-2019 BUDGET 2016-2017 2017-2018 2018-2019 BUDGET
Teacher:General Education 18.50 17.80 17.80 0.00 4.00 4.00 4.00 0.00 22.50 21.80 21.80 0.00Special Education 2.00 3.00 3.00 0.00 2.00 2.00 2.00 0.00 4.00 5.00 5.00 0.00
Principal 1.00 1.00 1.00 0.00 0.00 0.00 0.00 0.00 1.00 1.00 1.00 0.00Assistant Principal 1.00 1.00 1.00 0.00 0.00 0.00 0.00 0.00 1.00 1.00 1.00 0.00Reading Intervention 0.00 0.00 0.00 0.00 0.50 0.50 0.50 0.00 0.50 0.50 0.50 0.00Librarian 1.00 1.00 1.00 0.00 0.00 0.00 0.00 0.00 1.00 1.00 1.00 0.00Nurse 1.00 1.00 1.00 0.00 0.00 0.00 0.00 0.00 1.00 1.00 1.00 0.00Counselor 1.00 1.00 1.00 0.00 0.00 0.00 0.00 0.00 1.00 1.00 1.00 0.00
Instructional Assistant:General Education 7.50 8.00 9.00 1.00 0.00 0.00 0.00 0.00 7.50 8.00 9.00 1.00Special Education 2.00 2.00 2.00 0.00 1.50 2.50 2.50 0.00 3.50 4.50 4.50 0.00
Administrative Technician 1.00 1.00 1.00 0.00 0.00 0.00 0.00 0.00 1.00 1.00 1.00 0.00
Custodian 3.00 3.00 3.00 0.00 0.00 0.00 0.00 0.00 3.00 3.00 3.00 0.00Child Nutrition Staff 0.00 0.00 0.00 0.00 2.34 3.00 3.00 0.00 2.34 3.00 3.00 0.00
Total 39.00 39.80 40.80 1.00 10.34 12.00 12.00 0.00 49.34 51.80 52.80 1.00
Funding Sources for Restricted Positions
Federal - Title VI - Flow Thru1.00 Special Education Teacher
Federal - Title I3.00 Teacher
Prevention, Intervention, Remediation.50 Teacher
Federal - Title II-A1.00 Teacher
Local - Medicaid1.00 Teacher
2.50 Special Education Instructional Assistant
Local - Child Nutrition Program3.00 Child Nutrition Staff
- 74 -

VENABLE SCHOOL VENABLE SCHOOL VENABLE SCHOOL
GENERAL FUND POSITIONS
RESTRICTED FUND POSITIONS
ALL FUND POSITIONS
2017-2018 2017-2018 2017-2018Revised BUDGET Revised BUDGET Revised BUDGET
ACTUAL BUDGET BUDGET TO 2018-2019 ACTUAL BUDGET BUDGET TO 2018-2019 ACTUAL BUDGET BUDGET TO 2018-2019POSITION 2016-2017 2017-2018 2018-2019 BUDGET 2016-2017 2017-2018 2018-2019 BUDGET 2016-2017 2017-2018 2018-2019 BUDGET
Teacher:General Education 19.60 20.80 20.80 0.00 0.00 0.00 0.00 0.00 19.60 20.80 20.80 0.00Special Education 2.45 2.95 2.95 0.00 0.55 0.55 0.55 0.00 3.00 3.50 3.50 0.00
Principal 1.00 1.00 1.00 0.00 0.00 0.00 0.00 0.00 1.00 1.00 1.00 0.00Assistant Principal 1.00 1.00 1.00 0.00 0.00 0.00 0.00 0.00 1.00 1.00 1.00 0.00Reading Intervention 0.00 0.00 0.00 0.00 1.50 1.50 1.50 0.00 1.50 1.50 1.50 0.00Librarian 1.00 1.00 1.00 0.00 0.00 0.00 0.00 0.00 1.00 1.00 1.00 0.00Nurse 1.00 1.00 1.00 0.00 0.00 0.00 0.00 0.00 1.00 1.00 1.00 0.00Counselor 1.00 1.00 1.00 0.00 0.00 0.00 0.00 0.00 1.00 1.00 1.00 0.00
Instructional Assistant:General Education 5.00 7.00 8.00 1.00 0.00 0.00 0.00 0.00 5.00 7.00 8.00 1.00Special Education 1.00 2.00 2.00 0.00 1.71 2.00 2.00 0.00 2.71 4.00 4.00 0.00
Administrative Technician 1.00 1.00 1.00 0.00 0.00 0.00 0.00 0.00 1.00 1.00 1.00 0.00
Custodian 3.00 3.00 3.00 0.00 0.00 0.00 0.00 0.00 3.00 3.00 3.00 0.00Site Directors 0.00 0.00 0.00 0.00 0.50 1.00 1.00 0.00 0.50 1.00 1.00 0.00Child Nutrition Staff 0.00 0.00 0.00 0.00 2.00 3.00 3.00 0.00 2.00 3.00 3.00 0.00
Total 37.05 41.75 42.75 1.00 6.26 8.05 8.05 0.00 43.31 49.80 50.80 1.00
Funding Sources for Restricted Positions
Federal - Title VI - Flow Thru.55 Teacher
1.00 Special Education Instructional Assistant
Medicaid1.00 Special Education Instructional Assistant
Prevention, Intervention, Rremediation1.50 Teacher
Local - CLASS Program 1.00 Site Director
Local - Child Nutrition Program3.00 Child Nutrition Staff
- 75 -

PRESCHOOL PRESCHOOL PRESCHOOL
GENERAL FUND POSITIONS
RESTRICTED FUND POSITIONS
ALL FUND POSITIONS
2017-2018 2017-2018 2017-2018Revised BUDGET Revised BUDGET Revised BUDGET
ACTUAL BUDGET BUDGET TO 2018-2019 ACTUAL BUDGET BUDGET TO 2018-2019 ACTUAL BUDGET BUDGET TO 2018-2019POSITION 2016-2017 2017-2018 2018-2019 BUDGET 2016-2017 2017-2018 2018-2019 BUDGET 2016-2017 2017-2018 2018-2019 BUDGET
Teacher:General Education 6.00 6.00 6.00 0.00 10.00 9.91 9.91 0.00 16.00 15.91 15.91 0.00Special Education 6.99 6.99 6.99 0.00 0.51 0.51 0.51 0.00 7.50 7.50 7.50 0.00
Early Childhood Coordinator 0.50 1.00 1.00 0.00 0.00 0.00 0.00 0.00 0.50 1.00 1.00 0.00Early Connections Counselor 0.50 0.20 0.20 0.00 0.00 0.00 0.00 0.00 0.50 0.20 0.20 0.00Social Worker 0.00 0.00 0.00 0.00
Instructional Assistant:General Education 5.00 5.00 5.00 0.00 10.00 9.91 9.91 0.00 15.00 14.91 14.91 0.00Special Education 4.00 5.00 4.00 -1.00 0.00 0.00 0.00 0.00 4.00 5.00 4.00 -1.00
Total 22.99 24.19 23.19 -1.00 20.51 20.33 20.33 0.00 43.50 44.52 43.52 -1.00
Funding Sources for Restricted Positions
State - Special Education Preschool Grant.51 Special Education Teachers
State/local - Virginia Preschool Grant9.91 Teachers
9.91 Instructional Assistants
- 76 -

VIRTUAL EDUCATION VIRTUAL EDUCATION VIRTUAL EDUCATION
GENERAL FUND POSITIONS
RESTRICTED FUND POSITIONS
ALL FUND POSITIONS
2017-2018 2017-2018 2017-2018Revised BUDGET Revised BUDGET Revised BUDGET
ACTUAL BUDGET BUDGET TO 2018-2019 ACTUAL BUDGET BUDGET TO 2018-2019 ACTUAL BUDGET BUDGET TO 2018-2019POSITION 2016-2017 2017-2018 2018-2019 BUDGET 2016-2017 2017-2018 2018-2019 BUDGET 2016-2017 2017-2018 2018-2019 BUDGET
Program Administrator for Virtual Education 1.00 1.00 1.00 0.00 0.00 0.00 0.00 0.00 1.00 1.00 1.00 0.00
Total 1.00 1.00 1.00 0.00 0.00 0.00 0.00 0.00 1.00 1.00 1.00 0.00
OFFICE OF SUPERINTENDENT OFFICE OF SUPERINTENDENT OFFICE OF SUPERINTENDENT
GENERAL FUND POSITIONS
RESTRICTED FUND POSITIONS
ALL FUND POSITIONS
2017-2018 2017-2018 2017-2018Revised BUDGET Revised BUDGET Revised BUDGET
ACTUAL BUDGET BUDGET TO 2018-2019 ACTUAL BUDGET BUDGET TO 2018-2019 ACTUAL BUDGET BUDGET TO 2018-2019POSITION 2016-2017 2017-2018 2018-2019 BUDGET 2016-2017 2017-2018 2018-2019 BUDGET 2016-2017 2017-2018 2018-2019 BUDGET
Superintendent 1.00 1.00 1.00 0.00 0.00 0.00 0.00 0.00 1.00 1.00 1.00 0.00Administrative Technician 1.00 1.00 1.00 0.00 0.00 0.00 0.00 0.00 1.00 1.00 1.00 0.00
Total 2.00 2.00 2.00 0.00 0.00 0.00 0.00 0.00 2.00 2.00 2.00 0.00
- 77 -

DIVISION WIDE INSTRUCTION DIVISION WIDE INSTRUCTION DIVISION WIDE INSTRUCTION
GENERAL FUND POSITIONS
RESTRICTED FUND POSITIONS
ALL FUND POSITIONS
2017-2018 2017-2018 2017-2018Revised BUDGET Revised BUDGET Revised BUDGET
ACTUAL BUDGET BUDGET TO 2018-2019 ACTUAL BUDGET BUDGET TO 2018-2019 ACTUAL BUDGET BUDGET TO 2018-2019POSITION 2016-2017 2017-2018 2018-2019 BUDGET 2016-2017 2017-2018 2018-2019 BUDGET 2016-2017 2017-2018 2018-2019 BUDGET
Associate Superintendent 1.00 1.00 1.00 0.00 0.00 0.00 0.00 0.00 1.00 1.00 1.00 0.00
Teacher:General Education 6.00 16.16 15.60 -0.56 1.00 1.00 1.00 0.00 7.00 17.16 16.60 -0.56Instructional Coach 11.60 5.00 5.00 0.00 0.00 0.00 0.00 0.00 11.60 5.00 5.00 0.00Extended Learning Staffing 0.00 0.00 0.00 0.00 0.00 0.00 0.00 0.00 0.00 0.00 0.00 0.00
Literacy Coordinator 1.00 2.50 2.50 0.00 0.00 0.00 0.00 0.00 1.00 2.50 2.50 0.00Science Coordinator 0.50 0.50 1.00 0.50 0.00 0.00 0.00 0.00 0.50 0.50 1.00 0.50Social Studies Coordinator 0.00 0.00 0.00 0.00 0.00 0.00 0.00 0.00 0.00 0.00 0.00 0.00Title I, Part D Coordinator 0.00 0.00 0.00 0.00 1.00 1.00 1.00 0.00 1.00 1.00 1.00 0.00i3 Coordinator 0.00 0.00 0.00 0.00 0.50 0.50 0.00 -0.50 0.50 0.50 0.00 -0.50Title I, Part D Teacher 0.00 0.00 0.00 0.00 0.00 0.00 0.00 0.00 0.00 0.00 0.00 0.00Administrative Technician 1.50 1.60 1.60 0.00 0.00 0.00 0.00 0.00 1.50 1.60 1.60 0.00
Total 21.60 26.76 26.70 -0.06 2.50 2.50 2.00 -0.50 24.10 29.26 28.70 -0.56
Funding Sources for Restricted Positions
Federal - Title 1-D/Local Funding1.00 Coordinator-WALK
1.00 Teacher
- 78 -

STUDENT SERVICES AND SPECIAL EDUCATION STUDENT SERVICES AND SPECIAL EDUCATION STUDENT SERVICES AND SPECIAL EDUCATION
GENERAL FUND POSITIONS
RESTRICTED FUND POSITIONS
ALL FUND POSITIONS
2017-2018 2017-2018 2017-2018Revised BUDGET Revised BUDGET Revised BUDGET
ACTUAL BUDGET BUDGET TO 2018-2019 ACTUAL BUDGET BUDGET TO 2018-2019 ACTUAL BUDGET BUDGET TO 2018-2019POSITION 2016-2017 2017-2018 2018-2019 BUDGET 2016-2017 2017-2018 2018-2019 BUDGET 2016-2017 2017-2018 2018-2019 BUDGET
Coordinator 1.00 1.00 1.00 0.00 2.00 2.00 2.00 0.00 3.00 3.00 3.00 0.00Supervisor 1.00 1.00 1.00 0.00 0.00 0.00 0.00 0.00 1.00 1.00 1.00 0.00Social Worker 4.00 4.00 4.50 0.50 0.00 0.00 0.00 0.00 4.00 4.00 4.50 0.50Psychologist 4.00 4.00 4.00 0.00 0.00 0.00 0.00 0.00 4.00 4.00 4.00 0.00Behavior/Transition Specialist 0.00 1.00 1.00 0.00 0.00 0.00 0.00 0.00 0.00 1.00 1.00 0.00Home School Counselor 1.00 1.00 1.50 0.50 0.00 0.00 0.00 0.00 1.00 1.00 1.50 0.50Administrative Technician 2.00 2.00 2.00 0.00 0.00 0.00 0.00 0.00 2.00 2.00 2.00 0.00
Total 13.00 14.00 15.00 1.00 2.00 2.00 2.00 0.00 15.00 16.00 17.00 1.00
DIVISION WIDE MEDIA DIVISION WIDE MEDIA DIVISION WIDE MEDIA
GENERAL FUND POSITIONS
RESTRICTED FUND POSITIONS
ALL FUND POSITIONS
2017-2018 2017-2018 2017-2018Revised BUDGET Revised BUDGET Revised BUDGET
ACTUAL BUDGET BUDGET TO 2018-2019 ACTUAL BUDGET BUDGET TO 2018-2019 ACTUAL BUDGET BUDGET TO 2018-2019POSITION 2016-2017 2017-2018 2018-2019 BUDGET 2016-2017 2017-2018 2018-2019 BUDGET 2016-2017 2017-2018 2018-2019 BUDGET
Administrative Technician 0.30 0.30 0.30 0.00 0.00 0.00 0.00 0.00 0.30 0.30 0.30 0.00
Total 0.30 0.30 0.30 0.00 0.00 0.00 0.00 0.00 0.30 0.30 0.30 0.00
Funding Sources for Restricted Positions
Federal - Title VI - Flow Thru2.00 Coordinator
- 79 -

FINE ARTS FINE ARTS FINE ARTS
GENERAL FUND POSITIONS
RESTRICTED FUND POSITIONS
ALL FUND POSITIONS
2017-2018 2017-2018 2017-2018Revised BUDGET Revised BUDGET Revised BUDGET
ACTUAL BUDGET BUDGET TO 2018-2019 ACTUAL BUDGET BUDGET TO 2018-2019 ACTUAL BUDGET BUDGET TO 2018-2019POSITION 2016-2017 2017-2018 2018-2019 BUDGET 2016-2017 2017-2018 2018-2019 BUDGET 2016-2017 2017-2018 2018-2019 BUDGET
Coordinator 1.00 1.00 1.00 0.00 0.00 0.00 0.00 0.00 1.00 1.00 1.00 0.00
Total 1.00 1.00 1.00 0.00 0.00 0.00 0.00 0.00 1.00 1.00 1.00 0.00
ENGLISH AS A SECOND LANGUAGE ENGLISH AS A SECOND LANGUAGE ENGLISH AS A SECOND LANGUAGE
GENERAL FUND POSITIONS
RESTRICTED FUND POSITIONS
ALL FUND POSITIONS
2017-2018 2017-2018 2017-2018Revised BUDGET Revised BUDGET Revised BUDGET
ACTUAL BUDGET BUDGET TO 2018-2019 ACTUAL BUDGET BUDGET TO 2018-2019 ACTUAL BUDGET BUDGET TO 2018-2019POSITION 2016-2017 2017-2018 2018-2019 BUDGET 2016-2017 2017-2018 2018-2019 BUDGET 2016-2017 2017-2018 2018-2019 BUDGET
Coordinator 0.33 0.33 0.33 0.00 0.00 0.00 0.00 0.00 0.33 0.33 0.33 0.00
Teacher:General Education 12.50 13.00 14.00 1.00 1.00 1.00 1.00 0.00 13.50 14.00 15.00 1.00
Counselor 1.00 1.00 1.00 0.00 0.00 0.00 0.00 0.00 1.00 1.00 1.00 0.00
Total 13.83 14.33 15.33 1.00 1.00 1.00 1.00 0.00 14.83 15.33 16.33 1.00
- 80 -

GIFTED EDUCATION GIFTED EDUCATION GIFTED EDUCATION
GENERAL FUND POSITIONS
RESTRICTED FUND POSITIONS
ALL FUND POSITIONS
2017-2018 2017-2018 2017-2018Revised BUDGET Revised BUDGET Revised BUDGET
ACTUAL BUDGET BUDGET TO 2018-2019 ACTUAL BUDGET BUDGET TO 2018-2019 ACTUAL BUDGET BUDGET TO 2018-2019POSITION 2016-2017 2017-2018 2018-2019 BUDGET 2016-2017 2017-2018 2018-2019 BUDGET 2016-2017 2017-2018 2018-2019 BUDGET
Coordinator 0.25 0.25 0.25 0.00 0.00 0.00 0.00 0.00 0.25 0.25 0.25 0.00
Total 0.25 0.25 0.25 0.00 0.00 0.00 0.00 0.00 0.25 0.25 0.25 0.00
AVID/SCHOLARS AVID/SCHOLARS AVID/SCHOLARS
GENERAL FUND POSITIONS
RESTRICTED FUND POSITIONS
ALL FUND POSITIONS
2017-2018 2017-2018 2017-2018Revised BUDGET Revised BUDGET Revised BUDGET
ACTUAL BUDGET BUDGET TO 2018-2019 ACTUAL BUDGET BUDGET TO 2018-2019 ACTUAL BUDGET BUDGET TO 2018-2019POSITION 2016-2017 2017-2018 2018-2019 BUDGET 2016-2017 2017-2018 2018-2019 BUDGET 2016-2017 2017-2018 2018-2019 BUDGET
Coordinator 0.17 0.17 0.17 0.00 0.00 0.00 0.00 0.00 0.17 0.17 0.17 0.00
Teacher:General Education 4.00 4.00 4.00 0.00 0.00 0.00 0.00 0.00 4.00 4.00 4.00 0.00
Total 4.17 4.17 4.17 0.00 0.00 0.00 0.00 0.00 4.17 4.17 4.17 0.00
- 81 -

INSTRUCTIONAL TECHNOLOGY INSTRUCTIONAL TECHNOLOGY INSTRUCTIONAL TECHNOLOGY
GENERAL FUND POSITIONS
RESTRICTED FUND POSITIONS
ALL FUND POSITIONS
2017-2018 2017-2018 2017-2018Revised BUDGET Revised BUDGET Revised BUDGET
ACTUAL BUDGET BUDGET TO 2018-2019 ACTUAL BUDGET BUDGET TO 2018-2019 ACTUAL BUDGET BUDGET TO 2018-2019POSITION 2016-2017 2017-2018 2018-2019 BUDGET 2016-2017 2017-2018 2018-2019 BUDGET 2016-2017 2017-2018 2018-2019 BUDGET
Coordinator of Technology Integration 1.00 1.00 1.00 0.00 0.00 0.00 0.00 0.00 1.00 1.00 1.00 0.00
Teacher:Technology Integration 4.00 5.00 6.80 1.80 0.00 0.00 0.00 0.00 4.00 5.00 6.80 1.80
Total 5.00 6.00 7.80 1.80 0.00 0.00 0.00 0.00 5.00 6.00 7.80 1.80
STUDENT ACHIEVEMENT AND PROGRAM EVALUATION STUDENT ACHIEVEMENT AND PROGRAM EVALUATION STUDENT ACHIEVEMENT AND PROGRAM EVALUATION
GENERAL FUND POSITIONS
RESTRICTED FUND POSITIONS
ALL FUND POSITIONS
2017-2018 2017-2018 2017-2018Revised BUDGET Revised BUDGET Revised BUDGET
ACTUAL BUDGET BUDGET TO 2018-2019 ACTUAL BUDGET BUDGET TO 2018-2019 ACTUAL BUDGET BUDGET TO 2018-2019POSITION 2016-2017 2017-2018 2018-2019 BUDGET 2016-2017 2017-2018 2018-2019 BUDGET 2016-2017 2017-2018 2018-2019 BUDGET
Director 1.00 1.00 1.00 0.00 0.00 0.00 0.00 0.00 1.00 1.00 1.00 0.00
Total 1.00 1.00 1.00 0.00 0.00 0.00 0.00 0.00 1.00 1.00 1.00 0.00
- 82 -

TECHNICAL SUPPORT TECHNICAL SUPPORT TECHNICAL SUPPORT
GENERAL FUND POSITIONS
RESTRICTED FUND POSITIONS
ALL FUND POSITIONS
2017-2018 2017-2018 2017-2018Revised BUDGET Revised BUDGET Revised BUDGET
ACTUAL BUDGET BUDGET TO 2018-2019 ACTUAL BUDGET BUDGET TO 2018-2019 ACTUAL BUDGET BUDGET TO 2018-2019POSITION 2016-2017 2017-2018 2018-2019 BUDGET 2016-2017 2017-2018 2018-2019 BUDGET 2016-2017 2017-2018 2018-2019 BUDGET
Assistant Superintendent 0.20 0.20 0.20 0.00 0.00 0.00 0.00 0.00 0.20 0.20 0.20 0.00Director 1.00 1.00 1.00 0.00 0.00 0.00 0.00 0.00 1.00 1.00 1.00 0.00Coordinator of Data Systems 2.00 2.00 2.00 0.00 0.00 0.00 0.00 0.00 2.00 2.00 2.00 0.00Network Engineer 1.00 1.00 3.00 2.00 0.00 0.00 0.00 0.00 1.00 1.00 3.00 2.00Lead Technology Specialist 1.00 1.00 1.00 0.00 0.00 0.00 0.00 0.00 1.00 1.00 1.00 0.00Data Systems Technician 10.00 10.00 9.00 -1.00 0.00 0.00 0.00 0.00 10.00 10.00 9.00 -1.00Administrative Technician 0.70 0.00 0.70 0.70 0.00 0.00 0.00 0.00 0.70 0.00 0.70 0.70
Total 15.90 15.20 16.90 1.70 0.00 0.00 0.00 0.00 15.90 15.20 16.90 1.70
- 83 -

DIVISION WIDE HEALTH & PE DIVISION WIDE HEALTH & PE DIVISION WIDE HEALTH & PE
GENERAL FUND POSITIONS
RESTRICTED FUND POSITIONS
ALL FUND POSITIONS
2017-2018 2017-2018 2017-2018Revised BUDGET Revised BUDGET Revised BUDGET
ACTUAL BUDGET BUDGET TO 2018-2019 ACTUAL BUDGET BUDGET TO 2018-2019 ACTUAL BUDGET BUDGET TO 2018-2019POSITION 2016-2017 2017-2018 2018-2019 BUDGET 2016-2017 2017-2018 2018-2019 BUDGET 2016-2017 2017-2018 2018-2019 BUDGET
PE/Health Coordinator 0.80 0.60 0.60 0.00 0.00 0.00 0.00 0.00 0.80 0.60 0.60 0.00
Total 0.80 0.60 0.60 0.00 0.00 0.00 0.00 0.00 0.80 0.60 0.60 0.00
TEACHER MENTOR TEACHER MENTOR TEACHER MENTOR
GENERAL FUND POSITIONS
RESTRICTED FUND POSITIONS
ALL FUND POSITIONS
2017-2018 2017-2018 2017-2018Revised BUDGET Revised BUDGET Revised BUDGET
ACTUAL BUDGET BUDGET TO 2018-2019 ACTUAL BUDGET BUDGET TO 2018-2019 ACTUAL BUDGET BUDGET TO 2018-2019POSITION 2016-2017 2017-2018 2018-2019 BUDGET 2016-2017 2017-2018 2018-2019 BUDGET 2016-2017 2017-2018 2018-2019 BUDGET
Coordinator 0.00 0.00 0.00 0.00 0.00 0.00 0.00 0.00 0.00 0.00 0.00 0.00
Teacher:General Education 0.00 0.00 0.00 0.00 0.00 0.00 0.00 0.00 0.00 0.00 0.00 0.00
Total 0.00 0.00 0.00 0.00 0.00 0.00 0.00 0.00 0.00 0.00 0.00 0.00
- 84 -

ADMINISTRATIVE SUPPORT SERVICES ADMINISTRATIVE SUPPORT SERVICES ADMINISTRATIVE SUPPORT SERVICES
GENERAL FUND POSITIONS
RESTRICTED FUND POSITIONS
ALL FUND POSITIONS
2017-2018 2017-2018 2017-2018Revised BUDGET Revised BUDGET Revised BUDGET
ACTUAL BUDGET BUDGET TO 2018-2019 ACTUAL BUDGET BUDGET TO 2018-2019 ACTUAL BUDGET BUDGET TO 2018-2019POSITION 2016-2017 2017-2018 2018-2019 BUDGET 2016-2017 2017-2018 2018-2019 BUDGET 2016-2017 2017-2018 2018-2019 BUDGET
Assistant Superintendent 0.60 0.60 0.60 0.00 0.00 0.00 0.00 0.00 0.60 0.60 0.60 0.00Reprographics Specialist 0.75 0.75 0.75 0.00 0.00 0.00 0.00 0.00 0.75 0.75 0.75 0.00Administrative Technician 1.25 1.25 1.25 0.00 0.00 0.00 0.00 0.00 1.25 1.25 1.25 0.00
Total 2.60 2.60 2.60 0.00 0.00 0.00 0.00 0.00 2.60 2.60 2.60 0.00
COMMUNITY RELATIONS COMMUNITY RELATIONS COMMUNITY RELATIONS
GENERAL FUND POSITIONS
RESTRICTED FUND POSITIONS
ALL FUND POSITIONS
2017-2018 2017-2018 2017-2018Revised BUDGET Revised BUDGET Revised BUDGET
ACTUAL BUDGET BUDGET TO 2018-2019 ACTUAL BUDGET BUDGET TO 2018-2019 ACTUAL BUDGET BUDGET TO 2018-2019POSITION 2016-2017 2017-2018 2018-2019 BUDGET 2016-2017 2017-2018 2018-2019 BUDGET 2016-2017 2017-2018 2018-2019 BUDGET
Administrative Technician 1.00 2.00 2.00 0.00 0.00 0.00 0.00 0.00 1.00 2.00 2.00 0.00
Total 1.00 2.00 2.00 0.00 0.00 0.00 0.00 0.00 1.00 2.00 2.00 0.00
- 85 -

ATHLETIC DEPARTMENT ATHLETIC DEPARTMENT ATHLETIC DEPARTMENT
GENERAL FUND POSITIONS
RESTRICTED FUND POSITIONS
ALL FUND POSITIONS
2017-2018 2017-2018 2017-2018Revised BUDGET Revised BUDGET Revised BUDGET
ACTUAL BUDGET BUDGET TO 2018-2019 ACTUAL BUDGET BUDGET TO 2018-2019 ACTUAL BUDGET BUDGET TO 2018-2019POSITION 2016-2017 2017-2018 2018-2019 BUDGET 2016-2017 2017-2018 2018-2019 BUDGET 2016-2017 2017-2018 2018-2019 BUDGET
Athletic Director 1.00 1.00 1.00 0.00 0.00 0.00 0.00 0.00 1.00 1.00 1.00 0.00Athletic Trainer 1.00 1.00 1.00 0.00 0.00 0.00 0.00 0.00 1.00 1.00 1.00 0.00Athletic Equip. & Fac. Mgr. 1.00 1.00 1.00 0.00 0.00 0.00 0.00 0.00 1.00 1.00 1.00 0.00Administrative Technician 1.00 1.00 1.00 0.00 0.00 0.00 0.00 0.00 1.00 1.00 1.00 0.00
Total 4.00 4.00 4.00 0.00 0.00 0.00 0.00 0.00 4.00 4.00 4.00 0.00
ALTERNATIVE EDUCATION ALTERNATIVE EDUCATION ALTERNATIVE EDUCATION
GENERAL FUND POSITIONS
RESTRICTED FUND POSITIONS
ALL FUND POSITIONS
2017-2018 2017-2018 2017-2018Revised BUDGET Revised BUDGET Revised BUDGET
ACTUAL BUDGET BUDGET TO 2018-2019 ACTUAL BUDGET BUDGET TO 2018-2019 ACTUAL BUDGET BUDGET TO 2018-2019POSITION 2016-2017 2017-2018 2018-2019 BUDGET 2016-2017 2017-2018 2018-2019 BUDGET 2016-2017 2017-2018 2018-2019 BUDGET
Teacher:General Education 2.00 3.00 3.00 0.00 0.00 0.00 0.00 0.00 2.00 3.00 3.00 0.00Special Education 1.00 1.00 1.00 0.00 0.00 0.00 0.00 0.00 1.00 1.00 1.00 0.00
Counselor 2.00 2.00 2.00 0.00 0.00 0.00 0.00 0.00 2.00 2.00 2.00 0.00
Instructional Assistant:Special Education 1.00 0.00 0.00 0.00 0.00 0.00 0.00 0.00 1.00 0.00 0.00 0.00
Administrative Technician 0.00 0.00 1.00 1.00 0.00 0.00 0.00 0.00 0.00 0.00 1.00 1.00
Total 6.00 6.00 7.00 1.00 0.00 0.00 0.00 0.00 6.00 6.00 7.00 1.00
- 86 -

FINANCE DEPARTMENT FINANCE DEPARTMENT FINANCE DEPARTMENT
GENERAL FUND POSITIONS
RESTRICTED FUND POSITIONS
ALL FUND POSITIONS
2017-2018 2017-2018 2017-2018Revised BUDGET Revised BUDGET Revised BUDGET
ACTUAL BUDGET BUDGET TO 2018-2019 ACTUAL BUDGET BUDGET TO 2018-2019 ACTUAL BUDGET BUDGET TO 2018-2019POSITION 2016-2017 2017-2018 2018-2019 BUDGET 2016-2017 2017-2018 2018-2019 BUDGET 2016-2017 2017-2018 2018-2019 BUDGET
Assistant Superintendent 0.20 0.20 0.20 0.00 0.00 0.00 0.00 0.00 0.20 0.20 0.20 0.00Director 1.00 1.00 1.00 0.00 0.00 0.00 0.00 0.00 1.00 1.00 1.00 0.00Coordinator of Accounting/Payroll 1.00 0.00 0.00 0.00 0.00 0.00 0.00 0.00 1.00 0.00 0.00 0.00Coordinator of Budgets/Benefits 1.00 1.00 1.00 0.00 0.00 0.00 0.00 0.00 1.00 1.00 1.00 0.00Administrative Technician 4.00 4.23 4.23 0.00 0.00 0.00 0.00 0.00 4.00 4.23 4.23 0.00
Total 7.20 6.43 6.43 0.00 0.00 0.00 0.00 0.00 7.20 6.43 6.43 0.00
HUMAN RESOURCE DEPARTMENT HUMAN RESOURCE DEPARTMENT HUMAN RESOURCE DEPARTMENT
GENERAL FUND POSITIONS
RESTRICTED FUND POSITIONS
ALL FUND POSITIONS
2017-2018 2017-2018 2017-2018Revised BUDGET Revised BUDGET Revised BUDGET
ACTUAL BUDGET BUDGET TO 2018-2019 ACTUAL BUDGET BUDGET TO 2018-2019 ACTUAL BUDGET BUDGET TO 2018-2019POSITION 2016-2017 2017-2018 2018-2019 BUDGET 2016-2017 2017-2018 2018-2019 BUDGET 2016-2017 2017-2018 2018-2019 BUDGET
Director 1.00 0.80 0.80 0.00 0.00 0.00 0.00 0.00 1.00 0.80 0.80 0.00Coordinator 1.50 1.50 1.50 0.00 0.00 0.00 0.00 0.00 1.50 1.50 1.50 0.00Administrative Technician 2.00 2.00 2.00 0.00 0.00 0.00 0.00 0.00 2.00 2.00 2.00 0.00
Secretary:Division Wide 1.00 1.00 1.00 0.00 0.00 0.00 0.00 0.00 1.00 1.00 1.00 0.00
Total 5.50 5.30 5.30 0.00 0.00 0.00 0.00 0.00 5.50 5.30 5.30 0.00
- 87 -
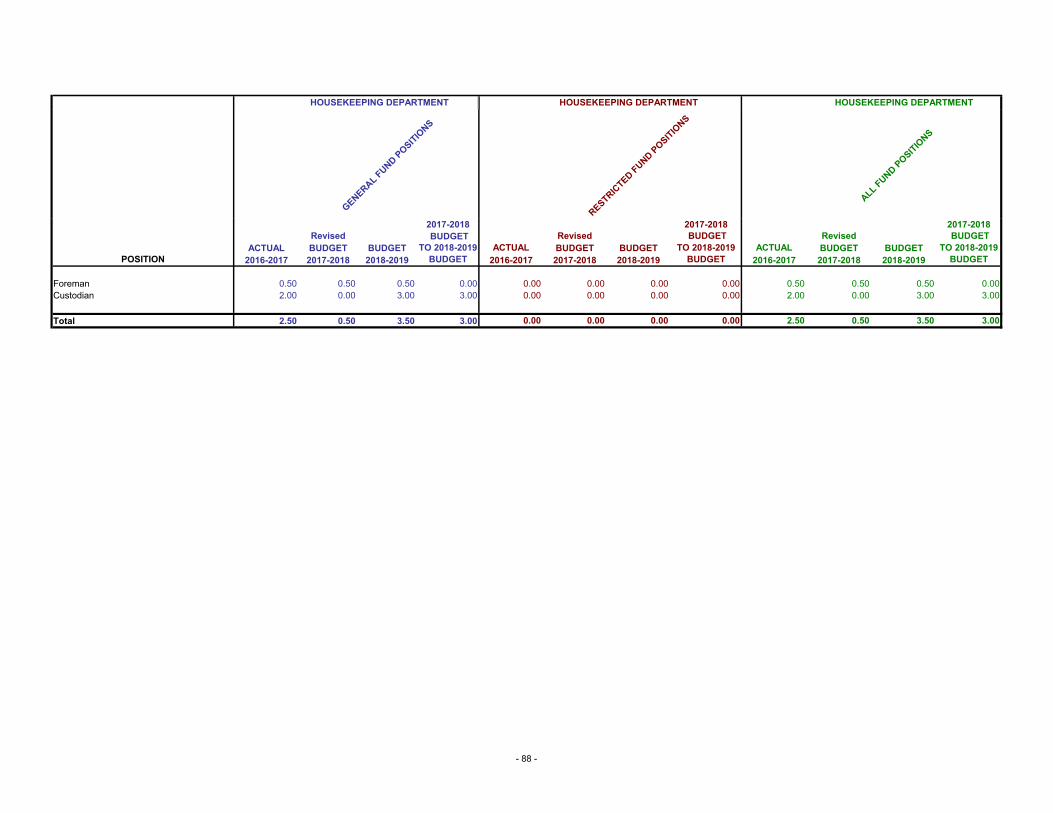
HOUSEKEEPING DEPARTMENT HOUSEKEEPING DEPARTMENT HOUSEKEEPING DEPARTMENT
GENERAL FUND POSITIONS
RESTRICTED FUND POSITIONS
ALL FUND POSITIONS
2017-2018 2017-2018 2017-2018Revised BUDGET Revised BUDGET Revised BUDGET
ACTUAL BUDGET BUDGET TO 2018-2019 ACTUAL BUDGET BUDGET TO 2018-2019 ACTUAL BUDGET BUDGET TO 2018-2019POSITION 2016-2017 2017-2018 2018-2019 BUDGET 2016-2017 2017-2018 2018-2019 BUDGET 2016-2017 2017-2018 2018-2019 BUDGET
Foreman 0.50 0.50 0.50 0.00 0.00 0.00 0.00 0.00 0.50 0.50 0.50 0.00Custodian 2.00 0.00 3.00 3.00 0.00 0.00 0.00 0.00 2.00 0.00 3.00 3.00
Total 2.50 0.50 3.50 3.00 0.00 0.00 0.00 0.00 2.50 0.50 3.50 3.00
- 88 -

MAINTENANCE DEPARTMENT MAINTENANCE DEPARTMENT MAINTENANCE DEPARTMENT
GENERAL FUND POSITIONS
RESTRICTED FUND POSITIONS
ALL FUND POSITIONS
2017-2018 2017-2018 2017-2018Revised BUDGET Revised BUDGET Revised BUDGET
ACTUAL BUDGET BUDGET TO 2018-2019 ACTUAL BUDGET BUDGET TO 2018-2019 ACTUAL BUDGET BUDGET TO 2018-2019POSITION 2016-2017 2017-2018 2018-2019 BUDGET 2016-2017 2017-2018 2018-2019 BUDGET 2016-2017 2017-2018 2018-2019 BUDGET
Administrative Technician 1.00 1.00 1.00 0.00 0.00 0.00 0.00 0.00 1.00 1.00 1.00 0.00Craftsman 3.00 0.00 2.00 2.00 0.00 0.00 0.00 0.00 3.00 0.00 2.00 2.00
Total 4.00 1.00 3.00 2.00 0.00 0.00 0.00 0.00 4.00 1.00 3.00 2.00
- 89 -

CLASS PROGRAM CLASS PROGRAM CLASS PROGRAM
GENERAL FUND POSITIONS
RESTRICTED FUND POSITIONS
ALL FUND POSITIONS
2017-2018 2017-2018 2017-2018Revised BUDGET Revised BUDGET Revised BUDGET
ACTUAL BUDGET BUDGET TO 2018-2019 ACTUAL BUDGET BUDGET TO 2018-2019 ACTUAL BUDGET BUDGET TO 2018-2019POSITION 2016-2017 2017-2018 2018-2019 BUDGET 2016-2017 2017-2018 2018-2019 BUDGET 2016-2017 2017-2018 2018-2019 BUDGET
Coordinator 0.00 0.00 0.00 0.00 0.25 0.00 0.25 0.25 0.25 0.00 0.25 0.25Secretary:
Division Wide 0.00 0.00 0.00 0.00 1.00 0.00 1.00 1.00 1.00 0.00 1.00 1.00
Total 0.00 0.00 0.00 0.00 1.25 0.00 1.25 1.25 1.25 0.00 1.25 1.25
- 90 -

HOSPITAL EDUCATION PROGRAM HOSPITAL EDUCATION PROGRAM HOSPITAL EDUCATION PROGRAM
GENERAL FUND POSITIONS
RESTRICTED FUND POSITIONS
ALL FUND POSITIONS
2017-2018 2017-2018 2017-2018Revised BUDGET Revised BUDGET Revised BUDGET
ACTUAL BUDGET BUDGET TO 2018-2019 ACTUAL BUDGET BUDGET TO 2018-2019 ACTUAL BUDGET BUDGET TO 2018-2019POSITION 2016-2017 2017-2018 2018-2019 BUDGET 2016-2017 2017-2018 2018-2019 BUDGET 2016-2017 2017-2018 2018-2019 BUDGET
Director 0.00 0.00 0.00 0.00 1.00 0.00 1.00 1.00 1.00 0.00 1.00 1.00
Teacher:General Education 0.00 0.00 0.00 0.00 14.00 0.00 14.00 14.00 14.00 0.00 14.00 14.00
Instructional Assistant:General Education 0.00 0.00 0.00 0.00 2.00 0.00 3.00 3.00 2.00 0.00 3.00 3.00
Administrative Technician 0.00 0.00 0.00 0.00 2.00 0.00 2.00 2.00 2.00 0.00 2.00 2.00
Total 0.00 0.00 0.00 0.00 19.00 0.00 20.00 20.00 19.00 0.00 20.00 20.00
BLUE RIDGE DETENTION CENTER BLUE RIDGE DETENTION CENTER BLUE RIDGE DETENTION CENTER
GENERAL FUND POSITIONS
RESTRICTED FUND POSITIONS
ALL FUND POSITIONS
2017-2018 2017-2018 2017-2018Revised BUDGET Revised BUDGET Revised BUDGET
ACTUAL BUDGET BUDGET TO 2018-2019 ACTUAL BUDGET BUDGET TO 2018-2019 ACTUAL BUDGET BUDGET TO 2018-2019POSITION 2016-2017 2017-2018 2018-2019 BUDGET 2016-2017 2017-2018 2018-2019 BUDGET 2016-2017 2017-2018 2018-2019 BUDGET
Coordinator 0.00 0.00 0.00 0.00 2.00 7.00 2.00 -5.00 2.00 7.00 2.00 -5.00Teacher 0.00 0.00 0.00 0.00 7.00 0.00 7.00 7.00 7.00 0.00 7.00 7.00
Total 0.00 0.00 0.00 0.00 9.00 7.00 9.00 2.00 9.00 7.00 9.00 2.00
- 91 -

ADULT EDUCATION ADULT EDUCATION ADULT EDUCATION
GENERAL FUND POSITIONS
RESTRICTED FUND POSITIONS
ALL FUND POSITIONS
2017-2018 2017-2018 2017-2018Revised BUDGET Revised BUDGET Revised BUDGET
ACTUAL BUDGET BUDGET TO 2018-2019 ACTUAL BUDGET BUDGET TO 2018-2019 ACTUAL BUDGET BUDGET TO 2018-2019POSITION 2016-2017 2017-2018 2018-2019 BUDGET 2016-2017 2017-2018 2018-2019 BUDGET 2016-2017 2017-2018 2018-2019 BUDGET
Coordinator 0.00 0.00 0.00 0.00 1.00 2.47 0.00 -2.47 1.00 2.47 0.00 -2.47Teacher 0.00 0.00 0.00 0.00 2.83 2.00 1.00 -1.00 2.83 2.00 1.00 -1.00Administrative Technician 0.00 0.00 0.00 0.00 2.00 0.00 1.00 1.00 2.00 0.00 1.00 1.00
Total 0.00 0.00 0.00 0.00 5.83 4.47 2.00 -2.47 5.83 4.47 2.00 -2.47
CHILD NUTRITION DEPARTMENT CHILD NUTRITION DEPARTMENT CHILD NUTRITION DEPARTMENT
GENERAL FUND POSITIONS
RESTRICTED FUND POSITIONS
ALL FUND POSITIONS
2017-2018 2017-2018 2017-2018Revised BUDGET Revised BUDGET Revised BUDGET
ACTUAL BUDGET BUDGET TO 2018-2019 ACTUAL BUDGET BUDGET TO 2018-2019 ACTUAL BUDGET BUDGET TO 2018-2019POSITION 2016-2017 2017-2018 2018-2019 BUDGET 2016-2017 2017-2018 2018-2019 BUDGET 2016-2017 2017-2018 2018-2019 BUDGET
Program Administrator 0.00 0.00 0.00 0.00 1.00 1.00 1.00 0.00 1.00 1.00 1.00 0.00Coordinator 0.00 0.00 0.00 0.00 1.00 0.00 1.00 1.00 1.00 0.00 1.00 1.00
Total 0.00 0.00 0.00 0.00 2.00 1.00 2.00 1.00 2.00 1.00 2.00 1.00
- 92 -

OTHER FUNDS
- 93 -

Charlottesville City Schools2018-2019 Special Revenue Funds Operating Budget
Revenue Summary
RevisedBudget Budget
2017-2018 2018-2019Funding Source
City of Charlottesville:Text Media $231,644 $231,644Adult Education 276,156 268,113Walker AVID Tutors 15,000 15,000Musical Instruments 25,000 25,000Technology Replacement Fund 557,070 557,070Uniforms 15,000 15,000Virginia Preschool 610,777 610,777Scholars Local 38,000 38,000Remediation 447,583 447,583Furniture Replacement 10,000 10,000School Nutrition 80,000 80,000WALK Program 166,239 166,239
Total City of Charlottesville $2,472,469 $2,464,426
Commonwealth of Virginia:Text-media $156,740 $136,609School Nutrition 27,920 34,168Adult Education 302,000 91,117
Grants Fund:
Prevention, Intervention and Remediation 298,403 291,697Hospital Education 1,929,469 1,944,000Blue Ridge Detention Center 1,053,088 1,038,062Virginia Preschool Initiative 490,000 532,875VPSA Technology 280,000 280,000School Equipment Security 68,800 68,800Governor's Youth Academy 67,889 67,889SOL Algebra Readiness 25,851 25,851Reading Intervention - PALS 59,012 58,266National Board Incentive 17,484 17,484Governor's School 14,985 14,985Medicaid 357,273 367,544i3 Grant 320,447 0Project Graduation 8,162 4,069The One Club 1,900 1,900
Total Commonwealth of Virginia $5,479,423 $4,975,316
- 94 -

Charlottesville City Schools2018-2019 Special Revenue Funds Operating Budget
Revenue Summary
RevisedBudget Budget
2017-2018 2018-2019Funding Source
Federal Government:School Nutrition $1,438,422 $1,593,416School Nutrition - In Kind Commodities 95,000 88,707Adult Education 309,000 0
Federal Government, Continued...Grants Fund:
Title I - Improving Basic Programs 1,467,743 1,512,367Title II, Part A - Teacher Quality 248,083 257,737Title III, Part A - Limited English Proficiency 50,407 50,407Title IV-B 21st Century 199,530 199,530Title VI-B Special Education 951,020 967,600Title III-A Immigrant and Youth 16,806 16,806Carl Perkins 84,994 84,994Special Education - Preschool 35,440 36,677Instructional Program Improvement 30,000 30,000Homeless Assistance 27,493 27,493Project Ease 6,464 6,464
Total Federal Government $4,960,402 $4,872,199
Tuition and Other Sources:Text-media - Interest on Investments $12,249 $12,249School Nutrition - Meal Charges 477,905 455,564CLASS - Tuition Fees 818,335 818,335MLK Performing Arts Center - Fees 114,653 116,512Adult Education 148,727 0
Grants Fund:
Boyd Tinsley 74,959 74,959AVID 48,404 48,404Dental Grant 10,034 10,034WALK Program 216,423 219,028Regional and Miscellaneous Grants 189,912 189,912Fines and Other Miscellaneous 60,734 146,981
Total Tuition and Other Sources $2,172,335 $2,091,978
Total Revenues and Transfers $15,084,629 $14,403,919
- 95 -

Charlottesville City Schools2018-2019 Special Revenue Funds Operating Budget
Budget Centers
RevisedActual Budget Staff Budget Staff Dollar Staff
Text Media Fund 2016-2017 2017-2018 2017-2018 2018-2019 2018-2019 Change Change
Textmedia Supplies $225,058 $320,341 $380,502 $60,161
Operating Costs $225,058 $320,341 $380,502 $60,161
Total Text Media Fund $225,058 $320,341 0.00 $380,502 0.00 $60,161 0.00
RevisedActual Budget Staff Budget Staff Dollar Staff
School Nutrition 2016-2017 2017-2018 2017-2018 2018-2019 2018-2019 Change Change
Coordinator $75,571 $77,256 1.00 $78,801 1.00 $1,545 0.00Administrative Technician 59,723 61,211 1.00 62,435 1.00 1,224 0.00Nutrition Worker 566,349 585,762 32.01 597,477 32.01 11,715 0.00Hourly Pay 64,985 40,000 40,000 0
Personnel Services $766,628 $764,229 34.01 $778,713 34.01 $14,484 0.00
Social Security $53,775 $56,256 $57,323 $1,067Retirement - VRS 45,105 87,600 89,260 1,660Disability 1,472 118 120 2Health - Employer Contribution (FLEXCOMP) 186,629 213,014 213,014 0Group Life Insurance 8,025 8,535 8,697 162
Employee Benefits $295,007 $365,523 $368,414 $2,891
Purchased Service $19 $85 $85 $0Inservice 783 777 777 0Service Contracts 8,916 14,000 14,000 0Travel 7,938 4,566 4,566 0Dues & Memberships 290 236 236 0Office Supplies 6,406 4,556 4,556 0Repair & Maintenance 2,393 6,118 6,118 0Commodities 761,924 82,000 150,733 68,733Technology Software 16,990 50 50 0Meat and Cheese 0 51,005 51,005 0Prepared Foods 11,464 110,000 110,000 0Sundry 0 41,635 41,635 0Produce 124,367 131,335 131,335 0Paper Products 104,792 55,000 101,500 46,500Cleaning Supplies 1,523 9,092 9,092 0Fruits and Vegetables 0 134,973 134,973 0Bread/grain 0 123,019 123,019 0Milk 0 130,427 130,427 0Ice Cream 0 12,869 12,869 0Beverages 0 23,854 23,854 0A La Carte 0 33,000 33,000 0Patron Reimbursement 763 391 391 0Promotions 0 2,526 2,526 0Equipment Replacement 5,027 4,981 4,981 0New Equipment 563 13,000 13,000 0
Operating Costs $1,054,157 $989,495 $1,104,728 $115,233
Total School Nutrition $2,115,791 $2,119,247 34.01 $2,251,855 34.01 $132,608 0.00
- 96 -

Charlottesville City Schools2018-2019 Special Revenue Funds Operating Budget
Budget Centers
RevisedActual Budget Staff Budget Staff Dollar Staff
C.L.A.S.S. 2016-2017 2017-2018 2017-2018 2018-2019 2018-2019 Change Change
Coordinator $26,699 $26,571 0.25 $27,102 0.25 $531 0.00Administrative Technician 70,700 53,190 1.00 54,254 1.00 1,064 0.00Site Director 287,231 327,913 6.00 332,471 6.00 4,558 0.00Hourly Pay 264,866 200,962 200,962 0
Personnel Services $649,496 $608,636 7.25 $614,789 7.25 $6,153 0.00
Social Security $49,464 $44,803 $45,256 $453Retirement - VRS 49,800 48,519 49,010 491Health - Employer Contribution (FLEXCOMP) 30,684 28,454 28,454 0Group Life Insurance 4,091 3,785 3,823 38
Employee Benefits $134,039 $125,835 $126,820 $985
Inservice $300 $79 $79 $0Purchased Service 26,160 1,329 1,329 0Transportation - City 6,843 19,600 12,462 -7,138Food Products 3,579 236 236 0Telecommunication 3,688 1,015 1,015 0General Liability 0 1,007 1,007 0Office Supplies 13,217 27,000 27,000 0Instructional Supplies 14,416 29,500 29,500 0Postage 1,401 1,370 1,370 0Travel 54 834 834 0New Equipment 3,250 1,894 1,894 0Technology Hardware 0 0 0
Operating Costs $72,908 $83,864 $76,726 -$7,138
Total C.L.A.S.S. $856,443 $818,335 7.25 $818,335 7.25 $0 0.00
RevisedActual Budget Staff Budget Staff Dollar Staff
MLK-Performing Arts Center 2016-2017 2017-2018 2017-2018 2018-2019 2018-2019 Change Change
Coordinator $76,575 $78,306 1.50 $79,872 1.50 $1,566 0.00Hourly Pay 220 4,398 4,398 0
Personnel Services $76,795 $82,704 1.50 $84,270 1.50 $1,566 0.00
Social Security $5,224 $6,088 $6,203 $115Retirement - VRS 8,588 8,708 8,873 165Health - Employer Contribution (FLEXCOMP) 6,027 6,027 6,027 0Group Life Insurance 707 679 692 13
Employee Benefits $20,546 $21,502 $21,795 $293
Purchased Service $0 $0 $0 $0Telecommunication 0 995 995 0Office Supplies 0 443 443 0Repair & Maintenance 3,333 9,009 9,009 0
Operating Costs $3,333 $10,447 $10,447 $0
Total MLK-Performing Arts Center $100,674 $114,653 1.50 $116,512 1.50 $1,859 0.00
- 97 -

Charlottesville City Schools2018-2019 Special Revenue Funds Operating Budget
Budget Centers
RevisedActual Budget Staff Budget Staff Dollar Staff
Adult Education 2016-2017 2017-2018 2017-2018 2018-2019 2018-2019 Change Change
Coordinator $125,295 $94,924 1.00 $0 0.00 -$94,924 -1.00Teacher - General Education 154,917 193,100 1.50 58,965 1.00 -134,135 -0.50Counselor 14,600 0 0.00 0 0.00 0 0.00Administrative Technician 73,913 74,677 2.00 52,095 1.00 -22,582 -1.00Hourly Pay 455,619 335,000 0 -335,000
Personnel Services $824,344 $697,701 4.50 $111,060 2.00 -$586,641 -2.50
Social Security $61,077 $49,854 $8,175 -$41,679Retirement - VRS 46,002 38,273 11,268 -27,005Disability 366 0 0 0Health - Employer Contribution (FLEXCOMP) 40,388 9,069 18,544 9,475Group Life Insurance 3,821 2,986 877 -2,109
Employee Benefits $151,654 $100,182 $38,864 -$61,318
Inservice $878 $3,240 $0 -$3,240Purchased Service 37,888 56,620 209,306 152,686Printing & Binding 0 1,690 0 -1,690Advertising 0 488 0 -488Water, Gas, and Sewer 519 937 0 -937Electricity 4,944 3,387 0 -3,387Postal Service 290 121 0 -121Telecommunications 1,029 0 0 0Lease & Rent of Buildings 91,168 95,000 0 -95,000Lease & Rent of Equipment 2,745 2,149 0 -2,149Other Materials and Supplies 31,184 38,800 0 -38,800Office Supplies 330 2,897 0 -2,897Copier Maintenance & Supplies 0 905 0 -905Travel 8,302 2,500 0 -2,500Dues and Memberships 25 0 0 0Educational Supplies 0 1,022 0 -1,022Technology Software 0 20 0 -20Indirect Costs 0 3,590 0 -3,590New Furniture 591 7,785 0 -7,785Hardware Additions 0 4,849 0 -4,849New Equipment 0 12,000 0 -12,000
Operating Costs $179,893 $238,000 $209,306 -$28,694
Total Adult Education $1,155,891 $1,035,883 4.50 $359,230 2.00 -$676,653 -2.50
RevisedActual Budget Staff Budget Staff Dollar Staff
Prevention, Intervention, and Remediation 2016-2017 2017-2018 2017-2018 2018-2019 2018-2019 Change Change
Reading Intervention 284,391 $290,303 5.00 $290,303 5.00 0 0.00Hourly Pay $81,759 228,015 228,015 $0
Personnel Services $366,150 $518,318 5.00 $518,318 5.00 $0 0.00
Social Security $25,290 $38,154 $38,154 $0Retirement - VRS 19,502 19,748 19,748 0Health - Employer Contribution (FLEXCOMP) 30,501 30,501 30,501 0Group Life Insurance 1,608 1,541 1,541 0
Employee Benefits $76,901 $89,944 $89,944 $0
Purchased Services $1,250 $13,000 $3,000 -$10,000Inservice 22,592 1,000 9,475 8,475Transportation 3,875 1,000 1,000 0Travel 0 1,307 1,307 0Hardware Additions 0 13,223 13,223 0Equipment Additions 0 0 0 0Technology - Software 131,152 103,013 103,013 0Educational Supplies 55,709 0 0 0
Operating Costs $214,578 $132,543 $131,018 -$1,525
Total Prevention, Intervention, and Remediation $657,629 $740,805 5.00 $739,280 5.00 -$1,525 0.00
- 98 -

Charlottesville City Schools2018-2019 Special Revenue Funds Operating Budget
Budget Centers
RevisedActual Budget Staff Budget Staff Dollar Staff
Technology Replacement Fund 2016-2017 2017-2018 2017-2018 2018-2019 2018-2019 Change Change
Purchased Service $34,509 $0 $0 $0Inservice 1,867 0 0 0Technology Hardware 351,676 515,196 515,196 0Technology Infrastructure 134,102 138,535 138,535 0Technology Materials & Supplies 34,901 59,564 59,564 0Technology Software 57,890 123,775 123,775 0
Operating Costs $614,945 $837,070 $837,070 $0
Total Technology Replacement Fund $614,945 $837,070 $837,070 $0
RevisedActual Budget Staff Budget Staff Dollar Staff
Uniform Replacement 2016-2017 2017-2018 2017-2018 2018-2019 2018-2019 Change Change
Other Educational Supplies $56,033 $15,000 $15,000 $0
Operating Costs $56,033 $15,000 $15,000 $0
Total Uniform Replacement $56,033 $15,000 $15,000 $0
RevisedActual Budget Staff Budget Staff Dollar Staff
Musical Instruments 2016-2017 2017-2018 2017-2018 2018-2019 2018-2019 Change Change
Equipment Replacement $11,685 $11,685 $0Equipment Additions 17,712 3,200 3,200 0Repair and Maintenace 3,323 6,300 6,300 0
Operating Costs $21,035 $21,185 $21,185 $0
Total Musical Instruments $21,035 $21,185 $21,185 $0
RevisedActual Budget Staff Budget Staff Dollar Staff
Boyd Tinsley 2016-2017 2017-2018 2017-2018 2018-2019 2018-2019 Change Change
Hourly Pay $30,813 $41,379 $41,379 $0
Personnel Services $30,813 $41,379 0.00 $41,379 0.00 $0 0.00
Social Security $2,357 $3,046 $3,046 $0
Employee Benefits $2,357 $3,046 $3,046 $0
Purchased Services $34,659 $19,191 $19,191 $0Transportation 0 1,657 1,657 0Educational Supplies 6,927 6,764 6,764 0New Equipment 894 2,922 2,922 0
Operating Costs $42,480 $30,534 $30,534 $0
Total Boyd Tinsley $75,650 $74,959 0.00 $74,959 0.00 $0 0.00
- 99 -

Charlottesville City Schools2018-2019 Special Revenue Funds Operating Budget
Budget Centers
RevisedActual Budget Staff Budget Staff Dollar Staff
Walker AVID Tutors 2016-2017 2017-2018 2017-2018 2018-2019 2018-2019 Change Change
Hourly Pay $5,126 $5,000 $5,000 $0
Personnel Services $5,126 $5,000 0.00 $5,000 0.00 $0 0.00
Social Security $86 $368 $368 $0
Employee Benefits $86 $368 $368 $0
Purchased Services $0 $3,000 $3,000 $0Transportation 0 1,187 1,187 0Educational Supplies 0 7,414 7,414 0
Operating Costs $0 $11,601 $11,601 $0
Total Walker Tutors $5,212 $16,969 0.00 $16,969 0.00 $0 0.00
RevisedActual Budget Staff Budget Staff Dollar Staff
WALK Program - General Fund 2016-2017 2017-2018 2017-2018 2018-2019 2018-2019 Change Change
Coordinator $64,661 $66,316 1.00 $68,969 1.00 $2,653 0.00Teacher - General Education 46,359 108,851 2.00 113,205 2.00 4,354 0.00Hourly Pay 5,526 133,988 152,648 18,660 0.00
Personnel Services $116,546 $309,155 3.00 $334,822 3.00 $25,667 0.00
Social Security $6,490 $22,758 $24,647 $1,889Retirement - VRS 19,591 27,624 2,484 -25,140Disability 95 127 138 11Health - Employer Contribution (FLEXCOMP) 17,058 20,843 20,843 0Group Life Insurance 1,617 2,155 2,334 179
Employee Benefits $44,851 $73,507 $50,445 -$23,062
Total WALK Program - General Fund $161,397 $382,662 3.00 $385,267 3.00 $2,605 0.00
RevisedActual Budget Staff Budget Staff Dollar Staff
WALK Program - CHS 2016-2017 2017-2018 2017-2018 2018-2019 2018-2019 Change Change
Teacher - General Education $32,530 $54,461 1.00 $56,639 1.00 $2,178 0.00Hourly Pay 61,080 21,082 21,082 0 0.00
Personnel Services $93,610 $75,543 1.00 $77,721 1.00 $2,178 0.00
Social Security $8,837 $5,561 $5,721 $160Retirement - VRS 4,936 8,588 8,836 248Disability 0 0 0 0Health - Employer Contribution (FLEXCOMP) 3,334 5,716 5,716 0Group Life Insurance 406 670 689 19
Employee Benefits $17,513 $20,535 $20,962 $427
Purchased Services $415 $1,000 $1,000 $0Educational Supplies 0 66,542 66,542 0
Operating Costs $415 $67,542 $67,542 $0
Total WALK Program - CHS $111,538 $163,620 1.00 $166,225 1.00 $2,605 0.00
- 100 -

Charlottesville City Schools2018-2019 Special Revenue Funds Operating Budget
Budget Centers
RevisedActual Budget Staff Budget Staff Dollar Staff
i3 Grant 2016-2017 2017-2018 2017-2018 2018-2019 2018-2019 Change Change
Coordinator $50,662 $51,048 0.50 $0 0.00 -$51,048 -0.50Teacher - General Education 62,101 66,391 1.20 0 0.00 -66,391 -1.20Hourly Pay 3,848 8,250 0 -8,250 0.00
Personnel Services $116,611 $125,689 1.70 $0 0.00 -$125,689 -1.70
Social Security $8,764 $9,252 $0 -$9,252Retirement - VRS 17,973 18,520 0 -18,520Disability 82 112 0 -112Health - Employer Contribution (FLEXCOMP) 7,086 2,990 0 -2,990Group Life Insurance 1,482 1,445 0 -1,445
Employee Benefits $35,387 $32,319 $0 -$32,319
Inservice $11,527 $6,276 $0 -$6,276Travel 31,397 20,565 0 -20,565Educational Supplies 51,567 30,368 0 -30,368New Equipment 63,595 105,230 0 -105,230
Operating Costs $158,086 $162,439 $0 -$162,439
Total i3 Grant $310,084 $320,447 1.70 $0 0.00 -$320,447 -1.70
RevisedActual Budget Staff Budget Staff Dollar Staff
WALK Program - Restricted Donation 2016-2017 2017-2018 2017-2018 2018-2019 2018-2019 Change Change
Hourly Pay $0 $11,543 $11,543 $0 0.00
Personnel Services $0 $11,543 0.00 $11,543 0.00 $0 0.00
Social Security $0 $850 $850 $0
Employee Benefits $0 $850 $850 $0
Educational Supplies $34,820 $35,179 $35,179 $0
Operating Costs $34,820 $35,179 $35,179 $0
Total WALK Program - Restricted Donation $34,820 $47,572 0.00 $47,572 0.00 $0 0.00
RevisedActual Budget Staff Budget Staff Dollar Staff
AVID 2016-2017 2017-2018 2017-2018 2018-2019 2018-2019 Change Change
Hourly Pay $9,708 $29,469 $29,469 $0 0.00
Personnel Services $9,708 $29,469 0.00 $29,469 0.00 $0 0.00
Social Security $743 $2,169 $2,169 $0
Employee Benefits $743 $2,169 $2,169 $0
Purchased Services $11,198 $6,400 $6,400 $0Educational Supplies 8,126 10,366 10,366 0
Operating Costs $19,324 $16,766 $16,766 $0
Total AVID $29,775 $48,404 0.00 $48,404 0.00 $0 0.00
- 101 -

Charlottesville City Schools2018-2019 Special Revenue Funds Operating Budget
Budget Centers
Revised Actual Budget Staff Budget Staff Dollar Staff
Reading & Writing - Venable 2016-2017 2017-2018 2017-2018 2018-2019 2018-2019 Change Change
Hourly Pay $3,605 $9,858 $9,858 $0 0.00
Personnel Services $3,605 $9,858 0.00 $9,858 0.00 $0 0.00
Social Security $276 $726 $726 $0
Employee Benefits $276 $726 $726 $0
Transportation $3,446 $467 $467 $0Educational Supplies 1,511 2,150 2,150 0
Operating Costs $4,957 $2,617 $2,617 $0
Total Reading & Writing - Venable $8,838 $13,201 0.00 $13,201 0.00 $0 0.00
Revised Actual Budget Staff Budget Staff Dollar Staff
Dental Grant 2016-2017 2017-2018 2017-2018 2018-2019 2018-2019 Change Change
Purchased Services $795 $7,334 $7,334 $0Educational Supplies 5,808 2,700 2,700 0
Operating Costs $6,603 $10,034 $10,034 $0
Total Dental Grant $6,603 $10,034 $10,034 $0
RevisedActual Budget Staff Budget Staff Dollar Staff
Hospital Education 2016-2017 2017-2018 2017-2018 2018-2019 2018-2019 Change Change
Director $115,417 $110,148 1.00 $112,351 1.00 $2,203 0.00Teacher - General Education 917,758 1,000,672 14.00 1,040,699 14.00 40,027 0.00Instructional Assistant - General Education 94,187 106,453 3.00 108,582 3.00 2,129 0.00Administrative Technician 74,785 95,684 2.00 97,598 2.00 1,914 0.00Substitute Teacher 8 17,000 9,453 -7,547
Personnel Services $1,202,155 $1,329,957 20.00 $1,368,683 20.00 $38,726 0.00
Social Security $88,171 $97,901 $100,751 $2,850Retirement - VRS 188,846 207,052 214,256 7,204Disability 1,221 469 485 16Health - Employer Contribution (FLEXCOMP) 133,649 145,810 145,810 0Sick Leave and Service Credit Benefit 0 0 0 0Group Life Insurance 15,602 16,150 16,712 562
Employee Benefits $427,489 $467,382 $478,014 $10,632
Purchased Service $7,879 $0 $0 $0Lease & Rent of Equipment 2,787 1,197 1,197 0Travel 5,334 6,238 6,238 0Other Educational Supplies 39,277 23,668 23,668 0Textmedia Supplies 2,138 0 0 0Technology Software 0 264 0 -264Indirect Costs 59,716 85,000 60,000 -25,000Inservice 3,000 186 200 14New Equipment 5,386 15,577 6,000 -9,577
Operating Costs $125,517 $132,130 $97,303 -$34,827
Total Hospital Education $1,755,161 $1,929,469 20.00 $1,944,000 20.00 $14,531 0.00
- 102 -

Charlottesville City Schools2018-2019 Special Revenue Funds Operating Budget
Budget Centers
RevisedActual Budget Staff Budget Staff Dollar Staff
Blue Ridge Detention Center 2016-2017 2017-2018 2017-2018 2018-2019 2018-2019 Change Change
Coordinator $117,162 $190,950 2.00 $194,769 2.00 $3,819 0.00Teacher - General Education 457,180 467,612 7.00 486,316 7.00 18,704 0.00Substitute Teacher 354 5,000 5,000 0
Personnel Services $574,696 $663,562 9.00 $686,085 9.00 $22,523 0.00
Social Security $41,952 $48,846 $50,504 $1,658Retirement - VRS 88,913 103,856 107,381 3,525Disability 575 173 179 6Health - Employer Contribution (FLEXCOMP) 61,341 66,055 66,055 0Group Life Insurance 7,358 8,100 8,375 275
Employee Benefits $200,139 $227,030 $232,494 $5,464
Purchased Service $73,600 $75,000 $75,000 $0Telecommunication 0 2,400 2,400 0Lease & Rent of Equipment 1,095 1,200 1,200 0Travel 2,298 10,100 3,000 -7,100Educational Supplies 7,446 11,800 10,000 -1,800Office Supplies 87 4,000 200 -3,800Textmedia Supplies 0 8,000 0 -8,000Infrustructure additions 0 8,000 0 -8,000Advertising 0 600 0 -600Indirect Costs 28,735 19,683 19,683 0Hardware Replacement 0 13,713 0 -13,713New Equipment 35,333 8,000 8,000 0
Operating Costs $148,594 $162,496 $119,483 -$43,013
Total Blue Ridge Detention Center $923,429 $1,053,088 9.00 $1,038,062 9.00 -$15,026 0.00
RevisedActual Budget Staff Budget Staff Dollar Staff
Virginia Preschool 2016-2017 2017-2018 2017-2018 2018-2019 2018-2019 Change Change
Teacher - General Education $583,333 $606,413 9.91 $630,670 9.91 $24,257 0.00Instructional Assistant - General Education 219,638 220,368 9.91 224,775 9.91 4,407 0.00Hourly Pay 13 0 0 0
Personnel Services $802,984 $826,781 19.82 $855,445 19.82 $28,664 0.00
Social Security $59,707 $60,861 $62,971 $2,110Retirement - VRS 127,890 130,384 134,904 4,520Disability 979 345 357 12Health - Employer Contribution (FLEXCOMP) 103,615 69,026 69,026 0Group Life Insurance 10,602 10,169 10,522 353
Employee Benefits $302,793 $270,785 $277,780 $6,995
Office Supplies $0 $2,070 $10,427 $8,357
Operating Costs $0 $2,070 $10,427 $8,357
Total Virginia Preschool $1,105,777 $1,099,636 19.82 $1,143,652 19.82 $44,016 0.00
- 103 -

Charlottesville City Schools2018-2019 Special Revenue Funds Operating Budget
Budget Centers
RevisedActual Budget Staff Budget Staff Dollar Staff
SOL Algebra Readiness 2016-2017 2017-2018 2017-2018 2018-2019 2018-2019 Change Change
Hourly Pay $9,696 $23,711 0.00 $23,711 0.00 $0 0.00
Personnel Services $9,696 $23,711 0.00 $23,711 0.00 $0 0.00
Social Security $804 $1,745 $1,745 $0
Employee Benefits $804 $1,745 $1,745 $0
Transportation - Other $16,948 $395 $395 $0
Operating Costs $16,948 $395 $395 $0
Total SOL Algebra Readiness $27,448 $25,851 0.00 $25,851 0.00 $0 0.00
RevisedActual Budget Staff Budget Staff Dollar Staff
PALS 2016-2017 2017-2018 2017-2018 2018-2019 2018-2019 Change Change
Hourly Pay $33,212 $55,838 $54,271 -$1,567
Personnel Services $33,212 $55,838 0.00 $54,271 0.00 -$1,567 0.00
Social Security $2,844 $4,110 $3,995 -$115
Employee Benefits $2,844 $4,110 $3,995 -$115
Materials $20,729 $0 $0 $0
Operating Costs $20,729 $0 $0 $0
Total PALS $56,785 $59,948 0.00 $58,266 0.00 -$1,682 0.00
RevisedActual Budget Staff Budget Staff Dollar Staff
Project Graduation 2016-2017 2017-2018 2017-2018 2018-2019 2018-2019 Change Change
Hourly Pay $0 $5,773 $3,790 -$1,983 0.00
Personnel Services $0 $5,773 0.00 $3,790 0.00 -$1,983 0.00
Social Security $0 $425 $279 -$146
Employee Benefits $0 $425 $279 -$146
Supplies $3,767 $3,999 $0 -$3,999
Operating Costs $3,767 $3,999 $0 -$3,999
Total Project Graduation $3,767 $10,197 0.00 $4,069 0.00 -$6,128 0.00
- 104 -

Charlottesville City Schools2018-2019 Special Revenue Funds Operating Budget
Budget Centers
RevisedActual Budget Staff Budget Staff Dollar Staff
Governor's Youth Academy 2016-2017 2017-2018 2017-2018 2018-2019 2018-2019 Change Change
Hourly Pay $0 $8,000 $8,000 $0 0.00
Personnel Services $0 $8,000 0.00 $8,000 0.00 $0 0.00
Social Security $0 $589 $589 $0
Employee Benefits $0 $589 $589 $0
Purchased Service $0 $25,283 $25,283 $0Other Transportation 0 12,400 12,400 0Educational Supplies 0 2,528 2,528 0Technology Materials and Supplies 0 17,304 17,304 0Indirect Costs 0 1,785 1,785 0
Operating Costs $0 $59,300 $59,300 $0
Total Governor's Youth Academy $0 $67,889 0.00 $67,889 0.00 $0 0.00
RevisedActual Budget Staff Budget Staff Dollar Staff
Governor's School 2016-2017 2017-2018 2017-2018 2018-2019 2018-2019 Change Change
Hourly Pay $11,000 $5,400 $5,400 $0 0.00
Personnel Services $11,000 $5,400 0.00 $5,400 0.00 $0 0.00
Social Security $842 $398 $398 $0
Employee Benefits $842 $398 $398 $0
Purchased Service $1,590 $6,850 $6,850 $0Educational Supplies 11 2,337 2,337 0
Operating Costs $1,601 $9,187 $9,187 $0
Total Governor's School $13,443 $14,985 0.00 $14,985 0.00 $0 0.00
- 105 -

Charlottesville City Schools2018-2019 Special Revenue Funds Operating Budget
Budget Centers
RevisedActual Budget Staff Budget Staff Dollar Staff
National Board Incentive 2016-2017 2017-2018 2017-2018 2018-2019 2018-2019 Change Change
Hourly Pay $11,612 $16,285 $16,285 $0 0.00
Personnel Services $11,612 $16,285 0.00 $16,285 0.00 $0 0.00
Social Security $888 $1,199 $1,199 $0
Employee Benefits $888 $1,199 $1,199 $0
Total National Board Incentive $12,500 $17,484 0.00 $17,484 0.00 $0 0.00
RevisedActual Budget Staff Budget Staff Dollar Staff
Medicaid 2016-2017 2017-2018 2017-2018 2018-2019 2018-2019 Change Change
Teacher - Special Education $116,178 $153,885 2.50 $160,040 2.50 $6,155 0.00Instructional Assistant - Special Education 109,381 112,979 6.00 115,239 6.00 2,260 0.00
Personnel Services $225,559 $266,864 8.50 $275,279 8.50 $8,415 0.00
Social Security $17,056 $19,644 $20,264 $620Retirement - VRS 32,536 36,090 37,228 1,138Disability 127 281 290 9Health - Employer Contribution (FLEXCOMP) 28,462 31,581 31,581 0Group Life Insurance 2,571 2,813 2,902 89
Employee Benefits $80,752 $90,409 $92,265 $1,856
Total Medicaid $306,311 $357,273 8.50 $367,544 8.50 $10,271 0.00
RevisedActual Budget Staff Budget Staff Dollar Staff
The One Club 2016-2017 2017-2018 2017-2018 2018-2019 2018-2019 Change Change
Other Transportation $0 $1,477 $1,477 $0Travel 0 423 423 0
Operating Costs $0 $1,900 $1,900 $0
Total The One Club $0 $1,900 0.00 $1,900 0.00 $0 0.00
RevisedActual Budget Staff Budget Staff Dollar Staff
School Equipment Security 2016-2017 2017-2018 2017-2018 2018-2019 2018-2019 Change Change
Purchased Service $39,430 $68,800 $68,800 $0
Operating Costs $39,430 $68,800 $68,800 $0
Total School Equipment Security $39,430 $68,800 0.00 $68,800 0.00 $0 0.00
- 106 -

Charlottesville City Schools2018-2019 Special Revenue Funds Operating Budget
Budget Centers
RevisedActual Budget Staff Budget Staff Dollar Staff
Title I - Improving Basic Programs 2016-2017 2017-2018 2017-2018 2018-2019 2018-2019 Change Change
Director $0 $0 0.00 $0 0.00 $0 0.00Teacher - General Education 906,881 916,052 15.50 952,694 15.50 36,642 0.00Instructional Assistant - General Education 0 0 0.00 0 0.00 0 0.00Administrative Technician 0 0 0.00 0 0.00 0 0.00Substitute Teacher 0 25,000 25,000 0Hourly Pay 68,618 139,586 139,586 0
Personnel Services $975,499 $1,080,638 15.50 $1,117,280 15.50 $36,642 0.00
Social Security $72,013 $79,548 $82,245 $2,697Retirement - VRS 141,845 144,460 149,358 4,898Disability 1,000 150 155 5Health - Employer Contribution (FLEXCOMP) 86,670 87,576 87,576 0Group Life Insurance 11,771 11,268 11,650 382
Employee Benefits $313,299 $323,002 $330,984 $7,982
Inservice $6,001 $0 $0 $0Purchased Service 26,955 13,446 13,446 0Other Educational Supplies 42,303 20,657 20,657 0Printing and Binding 0 0 0 0Indirect Costs 30,235 30,000 30,000 0
Operating Costs $105,494 $64,103 $64,103 $0
Total Title I - Improving Basic Programs $1,394,292 $1,467,743 15.50 $1,512,367 15.50 $44,624 0.00
RevisedActual Budget Staff Budget Staff Dollar Staff
Title I, Part D - Neglected or Delinquent 2016-2017 2017-2018 2017-2018 2018-2019 2018-2019 Change Change
Coordinator $0 $0 0.00 $0 0.00 $0 0.00Hourly Pay 0 0 0 0
Personnel Services $0 $0 0.00 $0 0.00 $0 0.00
Social Security $0 $0 $0 $0Retirement - VRS 0 0 0 0Health - Employer Contribution (FLEXCOMP) 0 0 0 0Group Life Insurance 0 0 0 0
Employee Benefits $0 $0 $0 $0
Purchased Service $0 $0 $0 $0Inservice 0 0 0 0Technology Materials & Supplies 0 0 0 0Educational Supplies 0 0 0 0
Operating Costs $0 $0 $0 $0
Total Title I, Part D - Neglected or Delinquent $0 $0 0.00 $0 0.00 $0 0.00
- 107 -

Charlottesville City Schools2018-2019 Special Revenue Funds Operating Budget
Budget Centers
RevisedActual Budget Staff Budget Staff Dollar Staff
Title II, Part A - Teacher Quality 2016-2017 2017-2018 2017-2018 2018-2019 2018-2019 Change Change
Teacher - General Education $190,357 $193,738 4.00 $201,488 4.00 $7,750 0.00
Personnel Services $190,357 $193,738 4.00 $201,488 4.00 $7,750 0.00
Social Security $14,610 $14,261 $14,832 $571Retirement - VRS 30,405 30,552 31,774 1,222Disability 62 395 411 16Health - Employer Contribution (FLEXCOMP) 10,542 6,755 6,755 0Group Life Insurance 2,494 2,382 2,477 95
Employee Benefits $58,113 $54,345 $56,249 $1,904
Purchased Service $0 $0 $0 $0Inservice 0 0 0 0Travel 0 0 0 0Educational Supplies 0 0 0 0
Operating Costs $0 $0 $0 $0
Total Title II, Part A - Teacher Quality $248,470 $248,083 4.00 $257,737 4.00 $9,654 0.00
RevisedActual Budget Staff Budget Staff Dollar Staff
Title III, Part A - Limited English Proficiency 2016-2017 2017-2018 2017-2018 2018-2019 2018-2019 Change Change
Teacher - Special Education $0 $0 0.00 $0 0.00 $0 0.00Hourly Pay 18,897 35,065 35,065 0
Personnel Services $18,897 $35,065 0.00 $35,065 0.00 $0 0.00
Social Security $1,446 $2,581 $2,581 $0
Employee Benefits $1,446 $2,581 $2,581 $0
Purchased Service $4,104 $3,000 $3,000 $0Educational Supplies 17,026 6,261 6,261 0Inservice 1,283 3,500 3,500 0
Operating Costs $22,413 $12,761 $12,761 $0
Total Title III, Part A - Limited English Proficiency $42,756 $50,407 0.00 $50,407 0.00 $0 0.00
- 108 -

Charlottesville City Schools2018-2019 Special Revenue Funds Operating Budget
Budget Centers
RevisedActual Budget Staff Budget Staff Dollar Staff
Title III-A Immigrant and Youth 2016-2017 2017-2018 2017-2018 2018-2019 2018-2019 Change Change
Hourly Pay $976 $8,000 0.00 $8,000 0.00 $0 0.00
Personnel Services $976 $8,000 $8,000 $0
Social Security $75 $589 $589 $0
Employee Benefits $75 $589 $589 $0
Purchased Services $0 $4,000 $4,000 $0Educational Supplies 1,175 3,342 3,342 0Indirect Costs 45 875 875 0
Operating Costs $1,220 $8,217 $8,217 $0
Total Title III-A Immigrant and Youth $2,271 $16,806 0.00 $16,806 0.00 $0 0.00
RevisedActual Budget Staff Budget Staff Dollar Staff
Instructional Program Improvement 2016-2017 2017-2018 2017-2018 2018-2019 2018-2019 Change Change
Educational Supplies $0 $9,800 $9,800 $0Books & Subscriptions 0 4,000 4,000 0New Equipment 0 16,200 16,200 0
Operating Costs $0 $30,000 $30,000 $0
Total Instructional Program Improvement $0 $30,000 0.00 $30,000 0.00 $0 0.00
RevisedActual Budget Staff Budget Staff Dollar Staff
Title VI-B Flow Through 2016-2017 2017-2018 2017-2018 2018-2019 2018-2019 Change Change
Coordinator $198,996 $172,860 2.00 $176,317 2.00 $3,457 0.00Teacher - Special Education 352,346 389,223 6.85 397,007 6.85 7,784 0.00Instructional Assistant - Special Education 105,547 106,646 4.91 108,779 4.91 2,133 0.00Substitute Teacher 0 3,000 3,000 0Hourly Pay 0 1,000 1,000 0
Personnel Services $656,889 $672,729 13.76 $686,103 13.76 $13,374 0.00
Social Security $48,602 $49,521 $50,505 $984Retirement - VRS 102,020 103,225 105,277 2,052Disability 617 485 495 10Health - Employer Contribution (FLEXCOMP) 84,366 81,497 81,497 0Group Life Insurance 8,437 8,052 8,212 160
Employee Benefits $244,042 $242,780 $245,986 $3,206
Purchased Services $0 $9,000 $9,000 $0Indirect Costs 20,714 22,511 22,511 0Educational Supplies 0 4,000 4,000 0
Operating Costs $20,714 $35,511 $35,511 $0
Total Title VI-B Flow Through $921,645 $951,020 13.76 $967,600 13.76 $16,580 0.00
- 109 -

Charlottesville City Schools2018-2019 Special Revenue Funds Operating Budget
Budget Centers
RevisedActual Budget Staff Budget Staff Dollar Staff
Title IV-B 21st Century 2016-2017 2017-2018 2017-2018 2018-2019 2018-2019 Change Change
Purchased Service $143,879 $149,680 $149,680 $0Other Transportation 9,738 15,000 15,000 0Travel 650 3,000 3,000 0Educational Supplies 17,777 24,350 24,350 0Indirect Costs 0 7,500 7,500 0
Operating Costs $172,044 $199,530 $199,530 $0
Total Title IV-B 21st Century $172,044 $199,530 0.00 $199,530 0.00 $0 0.00
RevisedActual Budget Staff Budget Staff Dollar Staff
Title I Workforce Inv. Act - Carl Perkins 2016-2017 2017-2018 2017-2018 2018-2019 2018-2019 Change Change
Hourly Pay $3,743 $641 $641 $0 0.00
Personnel Services $3,743 $641 $641 $0
Social Security $287 $47 $47 $0
Employee Benefits $287 $47 $47 $0
Purchased Services $16,658 $15,075 $15,075 $0In-service 2,386 6,000 6,000 0Educational Supplies 0 1,523 1,523 0Technology Software 0 6,769 6,769 0Technology - Hardware 63,160 54,939 54,939 0Indirect Costs 0 0 0 0
Operating Costs $82,204 $84,306 $84,306 $0
Total Title I Workforce Inv. Act - Carl Perkins $86,234 $84,994 0.00 $84,994 0.00 $0 0.00
RevisedActual Budget Staff Budget Staff Dollar Staff
Special Education Preschool 2016-2017 2017-2018 2017-2018 2018-2019 2018-2019 Change Change
Teacher - Special Education $34,624 $24,881 0.51 $25,876 0.51 $995 0.00
Personnel Services $34,624 $24,881 0.51 $25,876 0.51 $995 0.00
Social Security $2,743 $1,832 $1,905 $73Retirement - VRS 3,659 3,924 4,081 157Disability 8 0 0 0Health - Employer Contribution (FLEXCOMP) 1,140 2,897 2,897 0Group Life Insurance 414 306 318 12
Employee Benefits $7,964 $8,959 $9,201 $242
Indirect Costs $1,323 $1,600 $1,600 $0
Operating Costs $1,323 $1,600 $1,600 $0
Total Special Education Preschool $43,911 $35,440 0.51 $36,677 0.51 $1,237 0.00
- 110 -

Charlottesville City Schools2018-2019 Special Revenue Funds Operating Budget
Budget Centers
RevisedActual Budget Staff Budget Staff Dollar Staff
Homeless Assistance 2016-2017 2017-2018 2017-2018 2018-2019 2018-2019 Change Change
Hourly Pay $2,889 $7,855 $7,855 $0
Personnel Services $2,889 $7,855 $7,855 $0
Social Security $249 $578 $578 $0
Employee Benefits $249 $578 $578 $0
Purchased Services $3,314 $1,500 $1,500 $0In-service 640 2,100 2,100 0Transportation 8,082 5,000 5,000 0Other Expenses 1,349 6,960 6,960 0Educational Supplies 15,174 3,500 3,500 0
Operating Costs $28,559 $19,060 $19,060 $0
Total Homeless Assistance $31,697 $27,493 0.00 $27,493 0.00 $0 0.00
RevisedActual Budget Staff Budget Staff Dollar Staff
Project Ease 2016-2017 2017-2018 2017-2018 2018-2019 2018-2019 Change Change
Hourly Pay $0 $3,925 $3,925 $0
Personnel Services $0 $3,925 $3,925 $0
Social Security $0 $289 $289 $0
Employee Benefits $0 $289 $289 $0
Purchased Services $0 $750 $750 $0In-service 0 1,000 1,000 0Educational Supplies 0 500 500 0
Operating Costs $0 $2,250 $2,250 $0
Total Project Ease $0 $6,464 0.00 $6,464 0.00 $0 0.00
RevisedActual Budget Staff Budget Staff Dollar Staff
Regional and Miscellaneous Grants 2016-2017 2017-2018 2017-2018 2018-2019 2018-2019 Change Change
Hourly Pay $174,199 $71,807 $71,807 $0
Personnel Services $174,199 $71,807 $71,807 $0
Social Security $12,079 $5,286 $5,286 $0
Employee Benefits $12,079 $5,286 $5,286 $0
Purchased Services $23,014 $15,603 $15,603 $0In-service 3,910 2,523 2,523 0Educational Supplies 75,042 28,091 28,091 0Technology Hardware 282,000 9,382 9,382 0Travel 2,472 584 584 0Transportation 620 889 889 0Indirect Costs 0 750 750 0New Equipment 10,739 20,235 20,235 0New Furniture 36,641 4,592 4,592 0
Operating Costs $434,438 $82,649 $82,649 $0
Total Regional and Miscellaneous $620,716 $159,742 $159,742 $0
Total Special Revenue Funds $14,355,503 $15,084,629 149.05 $14,403,919 144.85 -$680,710 -4.20
- 111 -

STANDARDS OF QUALITY
- 112 -

ANALYSIS OF SOQ REQUIREMENTS TO ACTUAL STAFFING
Personnel SOQ Requirements Charlottesville Staffing Exceeds By
Estimated Cost
Difference
Class Size: Kindergarten
through Grade 4
Division wide ratio for kindergarten of 24:1 with no class larger than 29 pupils; for grade 1 of 24:1 with no class larger than 30 pupils; for grades 2 and 3 of 24:1 with no class larger than 30 pupils; for grade 4 of 25:1 with no class larger than 35.
Schools are staffed using a formula with target average class sizes in line with state Class Size Reduction requirements. Class sizes currently range from 19 to 24. Results in 14.96 teachers and 49 instructional assistants more than required.
$3,112,948
Class Size: Upper
Elementary
Division wide ratio of 25:1 with no class larger than 35 pupils. Division wide ratio of 24:1 in Grade 6 English classes
Formula for allocation of general education classroom teachers is 19.5:1. Results in 5 teachers and 0 instructional assistants more than required.
$407,195
Class Size: Middle
School wide ratio of 21:1 and 24:1 in English classes.
Formula for allocation of general education classroom teachers is 19.5:1 plus additional staff for programmatic considerations. Results in 3 teachers and 0 instructional assistants more than required.
$250,260
Class Size: Secondary
School wide ratio of 21:1 and 24:1 in English classes.
Formula for allocation of general education classroom teachers is 20.5:1 plus additional staff for programmatic considerations. Results in 12.6 teachers and instructional assistants more than required.
$1,024,645
Principal: Elementary and
Upper Elementary
Half-time up to 299 students. Full-time at 300 students 0.80 $104,650
Principal: Middle and Secondary
Full-time principal at each school regardless of size. 0.00 $0
Assistant Principal:
Elementary and Upper
Elementary
Half-time at 600 students. Full-time at 900 students 9.00 $903,861
Assistant Principal:
Middle and Secondary
Full-time for each 600 students. 4.00 $437,916
- 113 -

ANALYSIS OF SOQ REQUIREMENTS TO ACTUAL STAFFING
Personnel SOQ Requirements Charlottesville Staffing Exceeds By
Estimated Cost
Difference
Librarian: Elementary and
Upper Elementary
Part-time up to 299 students and full-time at 300 students. 0.00 $0
Librarian: Middle and Secondary
Half-time up to 299 students and full-time at 300 students. Two full-time at 1,000 students.
0.00 $0
Counselor: Elementary
One hour per day per 100 students, full-time at 500 students, additional time per 100 students or major fraction.
3.20 $258,144
Counselor: Upper
Elementary
One hour per day per 100 students, full-time at 500 students, additional time per 100 students or major fraction.
0.76 $60,725
Counselor: Middle
One full-time at 400 students. One additional period per 80 students or major fraction.
0.73 $63,634
Counselor: Secondary
One full-time at 350 students. One additional period per 70 students or major fraction.
2.67 $239,456
Clerical: Elementary
Part-time up to 299 students. Full-time at 300 students. 0.00 $0
Clerical: Upper Elementary
Part-time up to 299 students. Full-time at 300 students. -0.30 -$31,288
Clerical: Middle
One full-time. One additional full-time for each 600 students beyond 200. One full-time for library at 750 students.
0.03 $1,495
Clerical: Secondary
One full-time. One additional for each 600 students beyond 200. One full-time for library at 750 students.
1.39 $67,301
- 114 -

ANALYSIS OF SOQ REQUIREMENTS TO ACTUAL STAFFING
Personnel SOQ Requirements Charlottesville Staffing Exceeds By
Estimated Cost
Difference
Art, Music, Physical
Education: K-5
Five full-time positions per 1,000 students to serve as resource teachers for art, music and physical education.
10.06 $833,733
Physical Education:
6-8
Must provide physical education/ health program. Staffing standards not specified in Standards of Quality.
3.00 $248,628
Art: 6-8Must provide art education program. Staffing standards not specified in Standards of Quality.
1.50 $135,756
Gifted/AVID
Must provide a program of gifted education. Staffing standards not specified in Standards of Quality. Gifted students must be taught by teachers with special training.
13.17 $1,094,473
English as a Second
Language Teachers
Must provide 17 full-time equivalent instructional positions for each 1,000 students identified as having limited English proficiency.
1.31 $104,291
Music Teachers: Vocal and
Instrumental 6-8
Must provide a program of general music. Staffing standards not specified in Standards of Quality.
10.00 $935,278
PsychologistsServices must be provided. Staffing standards not specified in Standards of Quality.
4.00 $352,894
Technology Support
Two technology support positions per 1,000 students in K - 12. 1.36 $168,656
- 115 -

PAY TABLES
- 116 -

TABLE OF CONTENTS PAY TABLES
2018-2019 Page
TEACHER................................................................................................. 117 Pay Table D / T0 TEACHER HOSPITAL EDUCATION..................................................... 118-120 Pay Tables - H2 / T2 - H3 / T3 - H4 / T4 ACCOUNTING/ADMINISTRATIVE TECHNICIAN............................. 121 Pay Table TE /AT ADULT EDUCATION PROGRAM SPECIALIST................................... 122 Pay Table AE ASSISTANT PRINCIPAL…………………............................................ 123 Pay Table Z/AP ATHLETIC DIRECTOR............................................................................ 124 Pay Table B2 / AD ATHLETIC EQUIP/FACILITY MGR....................................................... 125 Pay Table AM / AF BOOK BUDDIES…….………………………………………………….. 126 Pay Table BB CHILD NUTRITION MANAGER ……….…...................................... 127-129 Pay Tables – J / K - J1 / K1 - J2 / K2 CHILD NUTRITION ASSISTANT MANAGER …................................... 130-132 Pay Tables - J3 / K3 - J5 / K5 – J6 / K6 CHILD NUTRITION WORKER………………. …................................... 133-138 Pay Tables – Q / R0 - Q1 / R1 - Q6 / R6 - Q2 / R2 - Q5 / R5 - Q4 / R4 CLASS…………….................................................................................... 139-140 Pay Tables – SD / SS – SF / SG COMMUNITY RELATIONS SPECIALIST…………………………….. 141 Pay Table CR / CL COORDINATOR………………………………………………………… 142-147 Pay Tables – W / W1 - X1 / Y1 - X2 / Y2 - X3 / Y3 - CM / CN - X4 / Y4 CUSTODIAN.............................................................................................. 148 Pay Table I / CU DIRECTORS................................................................................................. 149 Pay Table A / A1 EXTENDED LEARNING TEACHER........................................................ 150 Pay Table HD HEAD CUSTODIAN................................................................................... 151 Pay Table H / HC

Table of Contents Con’t Page Help Desk……………………….................................................................. 152 Pay Table HD INSTRUCTIONAL ASSISTANT……………………………...………….. 153 Pay Table R / S INSTRUCTIONAL ASSISTANT – HOSPITAL EDUCATION................. 154 Pay Table H5 / S5 INSTRUCTIONAL COACH……………………………………................. 155 Pay Table IC LEAD TECHNICAL SUPPORT SPECIALIST............................................ 156 Pay Table W / W1 MAINTENANCE/CRAFTSMAN................................................................ 157 Pay Table M / M1 MANAGER – MLK-PAC, NUTRITION COORDINATOR………………158 Pay Table L / L1 NETWORK ENGINEER..………………………………………………… 159 Pay Table W / W1 NURSE - LPN............................................................................................... 160 Pay Table F / F1 NURSE - RN................................................................................................. 161 Pay Table G / G1 PRINCIPAL................................................................................................. 162-164 Pay Tables – P1 / EP - Y / MP - AA / HP SECRETARY.............................................................................................. 165 Pay Table CS / SE SPECIAL COUNSELOR ...…………….................................................... 166 Pay Table PE / SC SUPERVISOR…………………………..................................................... 167 Pay Table ST / SP TECHNICAL SUPPORT SPECIALIST..................................................... 168 Pay Table N / N1 TRAINER………………………………………………………………… 169 Pay Table T / TR ZONE MAINTENANCE CHIEF………………………………………… 170 Pay Table ZM / ZC SUBSTITUTE AND HOURLY PAY RATES............................................ 171 DEGREE SUPPLEMENTS........................................................................ 172 SUPPLEMENTAL PAY SCHEDULES..................................................... 173-176

Pay Table D Pay Table T0Days: 200 Days: 200
Exempt Exempt
Placement 2018-2019 Full Time 2018-2019 Part Time
0 46,403 44,3111 46,867 44,7542 47,335 45,2023 47,813 45,8124 48,459 46,4305 49,116 47,0816 49,803 47,8107 50,576 48,5518 51,360 49,3059 52,156 50,06810 52,966 50,89411 53,839 51,73412 54,729 52,56213 55,603 53,40214 56,492 54,25615 57,395 55,07116 58,256 55,89717 59,130 56,73518 60,016 57,58619 60,917 58,44920 61,827 59,18121 62,599 59,92122 63,380 60,67023 64,174 61,42824 64,976 62,19625 65,787 62,91126 66,543 63,63527 67,308 64,36628 68,083 65,10829 71,106 67,227
* Teacher contracts are 200 days** Media Specialist contracts are 210 days*** Elementary Counselors contracts are 200 days****Upper Elementary, Middle and High School Counselor contracts are
TEACHER
- 117 -
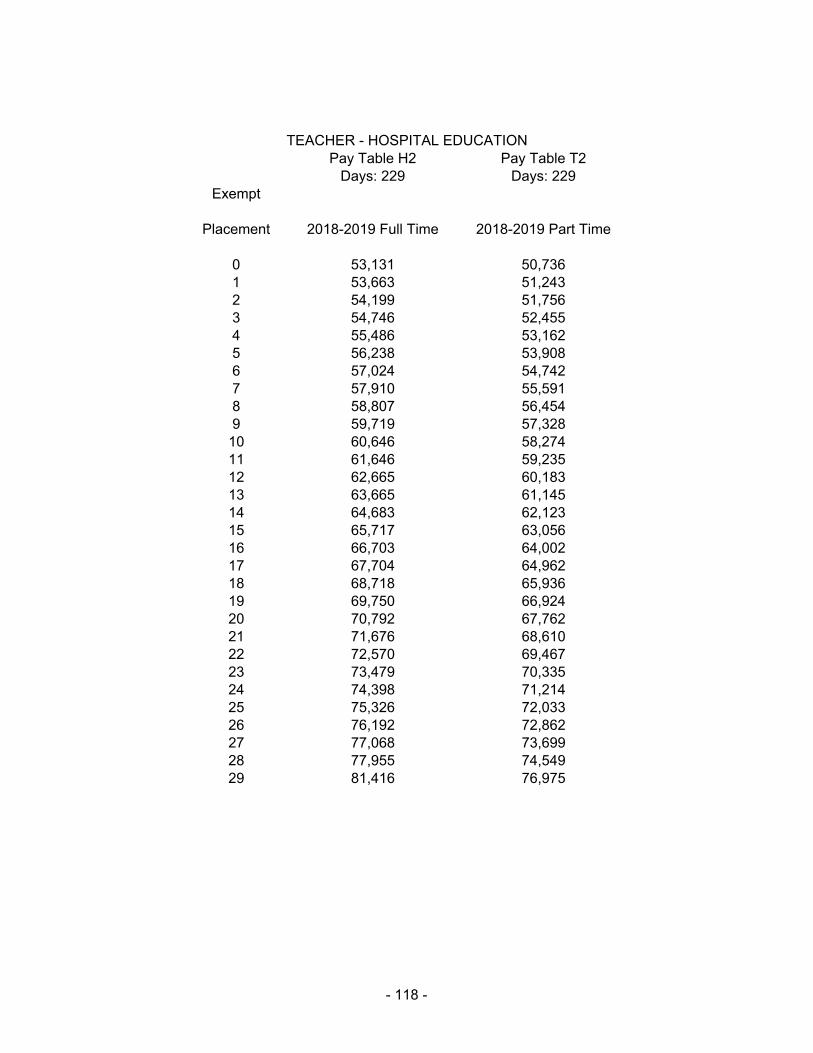
Pay Table H2 Pay Table T2Days: 229 Days: 229
Exempt
Placement 2018-2019 Full Time 2018-2019 Part Time
0 53,131 50,7361 53,663 51,2432 54,199 51,7563 54,746 52,4554 55,486 53,1625 56,238 53,9086 57,024 54,7427 57,910 55,5918 58,807 56,4549 59,719 57,328
10 60,646 58,27411 61,646 59,23512 62,665 60,18313 63,665 61,14514 64,683 62,12315 65,717 63,05616 66,703 64,00217 67,704 64,96218 68,718 65,93619 69,750 66,92420 70,792 67,76221 71,676 68,61022 72,570 69,46723 73,479 70,33524 74,398 71,21425 75,326 72,03326 76,192 72,86227 77,068 73,69928 77,955 74,54929 81,416 76,975
TEACHER - HOSPITAL EDUCATION
- 118 -

Pay Table H3 Pay Table T3Days: 240 Days: 240
Exempt Exempt
Placement 2018-2019 Full Time 2018-2019 Part Time
0 55,684 53,1731 56,240 53,7052 56,802 54,2423 57,376 54,9744 58,151 55,7165 58,939 56,4976 59,764 57,3727 60,691 58,2618 61,632 59,1669 62,587 60,082
10 63,559 61,07311 64,607 62,08112 65,675 63,07413 66,724 64,08214 67,790 65,10715 68,874 66,08516 69,907 67,07617 70,956 68,08218 72,019 69,10319 73,100 70,13920 74,192 71,01721 75,119 71,90522 76,056 72,80423 77,009 73,71424 77,971 74,63525 78,944 75,49326 79,852 76,36227 80,770 77,23928 81,700 78,13029 85,327 80,672
TEACHER - HOSPITAL EDUCATION
- 119 -

Pay Table H4 Pay Table T4Days: 260 Days: 260
Exempt Exempt
Placement 2018-2019 Full Time 2018-2019 Part Time
0 60,324 57,6041 60,927 58,1802 61,536 58,7633 62,157 59,5564 62,997 60,3595 63,851 61,2056 64,744 62,1537 65,749 63,1168 66,768 64,0979 67,803 65,088
10 68,856 66,16211 69,991 67,25412 71,148 68,33113 72,284 69,42314 73,440 70,53315 74,614 71,59216 75,733 72,66617 76,869 73,75618 78,021 74,86219 79,192 75,98420 80,375 76,93521 81,379 77,89722 82,394 78,87123 83,426 79,85624 84,469 80,85525 85,523 81,78426 86,506 82,72627 87,500 83,67628 88,508 84,64029 92,438 87,395
TEACHER - HOSPITAL EDUCATION
- 120 -

Pay Table TE Pay Table ATDays: 260 Hours: 8.0 Days: 260 Hours: 8.0
Placement 2018-2019 Full Time 2018-2019 Part Time
0 29,549 28,3521 29,992 28,7772 30,443 29,2093 30,901 29,7324 31,454 30,2695 32,022 30,8146 32,599 31,3707 33,186 31,9328 33,782 32,5079 34,389 33,097
10 35,013 33,68911 35,638 34,29612 36,281 34,91313 36,935 35,54214 37,600 36,17915 38,277 36,83416 38,968 37,49717 39,668 38,17018 40,380 38,85719 41,107 39,55620 41,848 40,27021 42,601 40,99522 43,369 41,73223 44,148 42,48424 44,945 43,25025 45,755 44,02726 46,577 44,82027 47,412 45,49228 48,123 46,17529 51,457 48,650
ACCOUNTING/ADMINISTRATIVE TECHNICIAN
- 121 -

Pay Table AEDays: 220 Hours: 8.0
Placement 2018-2019 Full Time
0 47,6401 48,2122 48,7893 49,3754 49,9675 50,5676 51,1747 51,7898 52,4089 53,038
10 53,67611 54,31712 54,97013 55,63014 56,29815 56,97416 57,65817 58,35018 59,05119 59,76020 60,47721 61,20322 61,93723 62,68024 63,43225 64,19326 64,96427 65,74428 66,53329 67,500
ADULT EDUCATION PROGRAM SPECIALIST
- 122 -
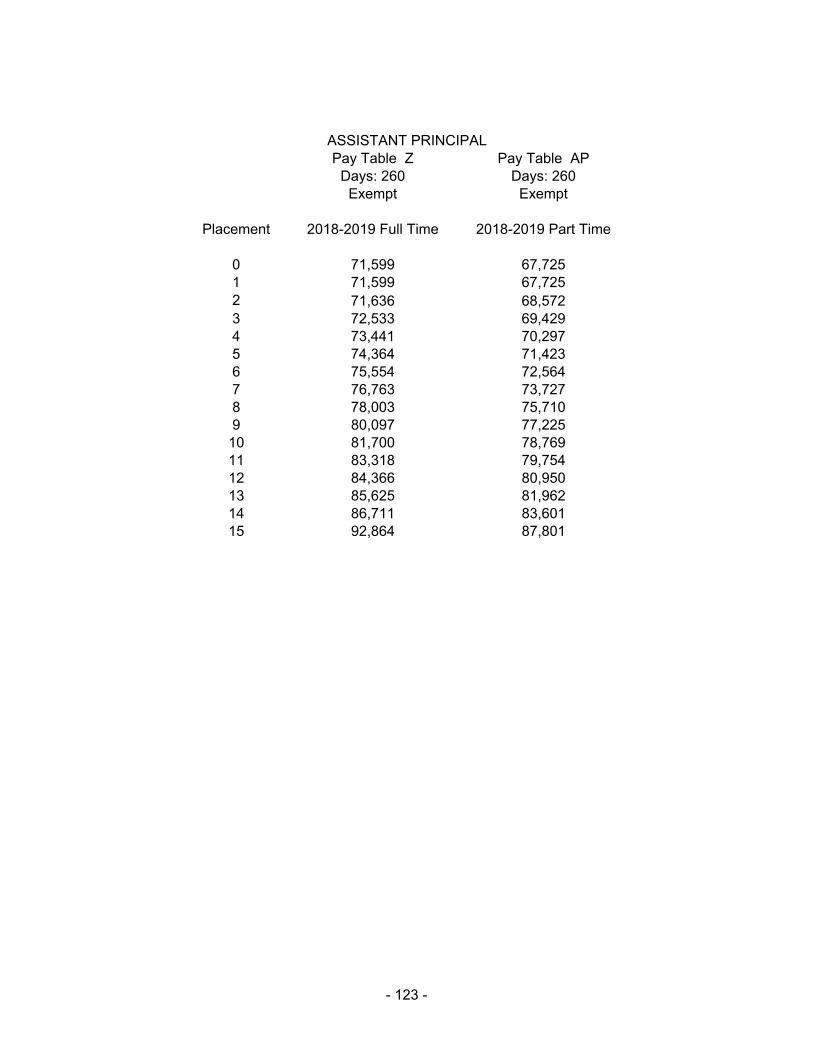
Pay Table Z Pay Table APDays: 260 Days: 260
Exempt Exempt
Placement 2018-2019 Full Time 2018-2019 Part Time
0 71,599 67,7251 71,599 67,7252 71,636 68,5723 72,533 69,4294 73,441 70,2975 74,364 71,4236 75,554 72,5647 76,763 73,7278 78,003 75,7109 80,097 77,22510 81,700 78,76911 83,318 79,75412 84,366 80,95013 85,625 81,96214 86,711 83,60115 92,864 87,801
ASSISTANT PRINCIPAL
- 123 -

Pay Table B2 Pay Table ADDays: 260 Days: 260
Exempt Exempt
Placement 2018-2019 Full Time 2018-2019 Part Time
0 51,122 49,5751 52,451 50,8652 53,809 51,6783 54,667 52,4544 55,487 53,2395 56,319 54,0376 57,164 54,8487 58,022 55,6718 58,892 56,5079 59,778 57,49010 60,818 58,49011 61,877 59,50812 62,954 60,54413 64,049 61,59514 65,161 62,66315 66,291 63,75316 67,443 64,86117 68,615 65,98818 69,809 67,13819 71,026 68,30420 72,258 69,49221 73,515 70,70522 74,799 71,94323 76,107 73,19624 77,433 74,47225 78,784 75,77626 80,163 77,09927 81,563 78,44728 82,988 79,81829 86,117 81,420
ATHLETIC DIRECTOR
- 124 -
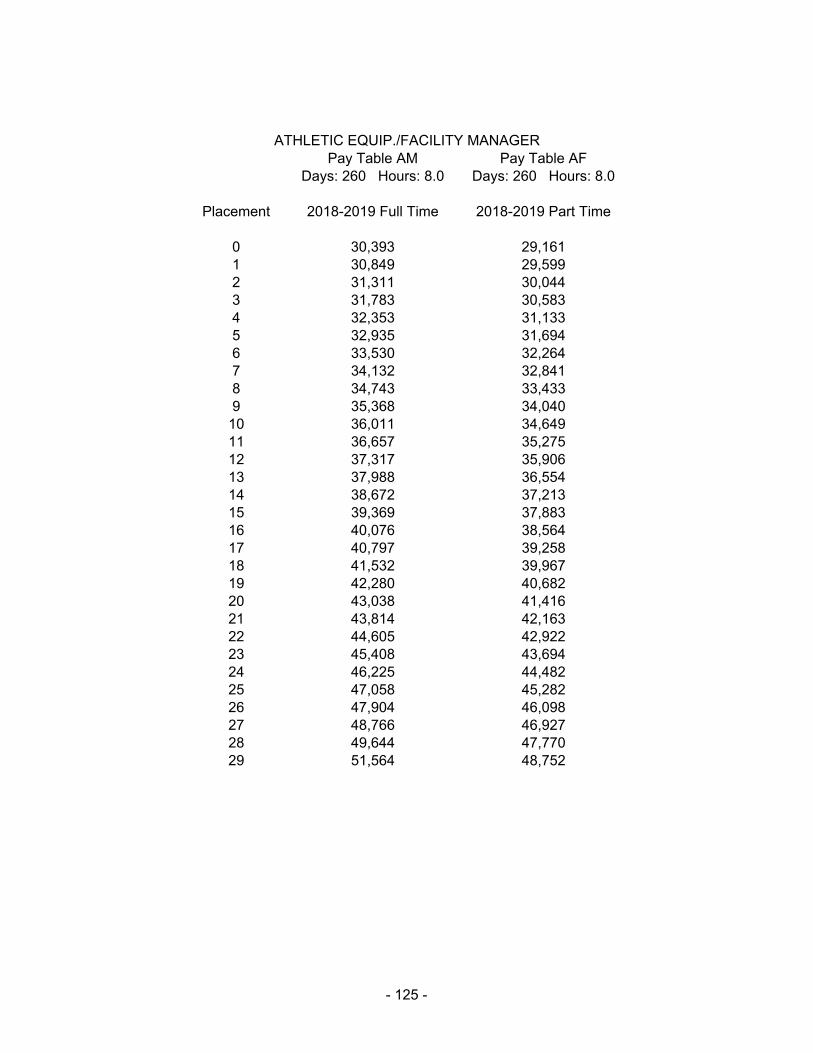
Pay Table AM Pay Table AFDays: 260 Hours: 8.0 Days: 260 Hours: 8.0
Placement 2018-2019 Full Time 2018-2019 Part Time
0 30,393 29,1611 30,849 29,5992 31,311 30,0443 31,783 30,5834 32,353 31,1335 32,935 31,6946 33,530 32,2647 34,132 32,8418 34,743 33,4339 35,368 34,040
10 36,011 34,64911 36,657 35,27512 37,317 35,90613 37,988 36,55414 38,672 37,21315 39,369 37,88316 40,076 38,56417 40,797 39,25818 41,532 39,96719 42,280 40,68220 43,038 41,41621 43,814 42,16322 44,605 42,92223 45,408 43,69424 46,225 44,48225 47,058 45,28226 47,904 46,09827 48,766 46,92728 49,644 47,77029 51,564 48,752
ATHLETIC EQUIP./FACILITY MANAGER
- 125 -
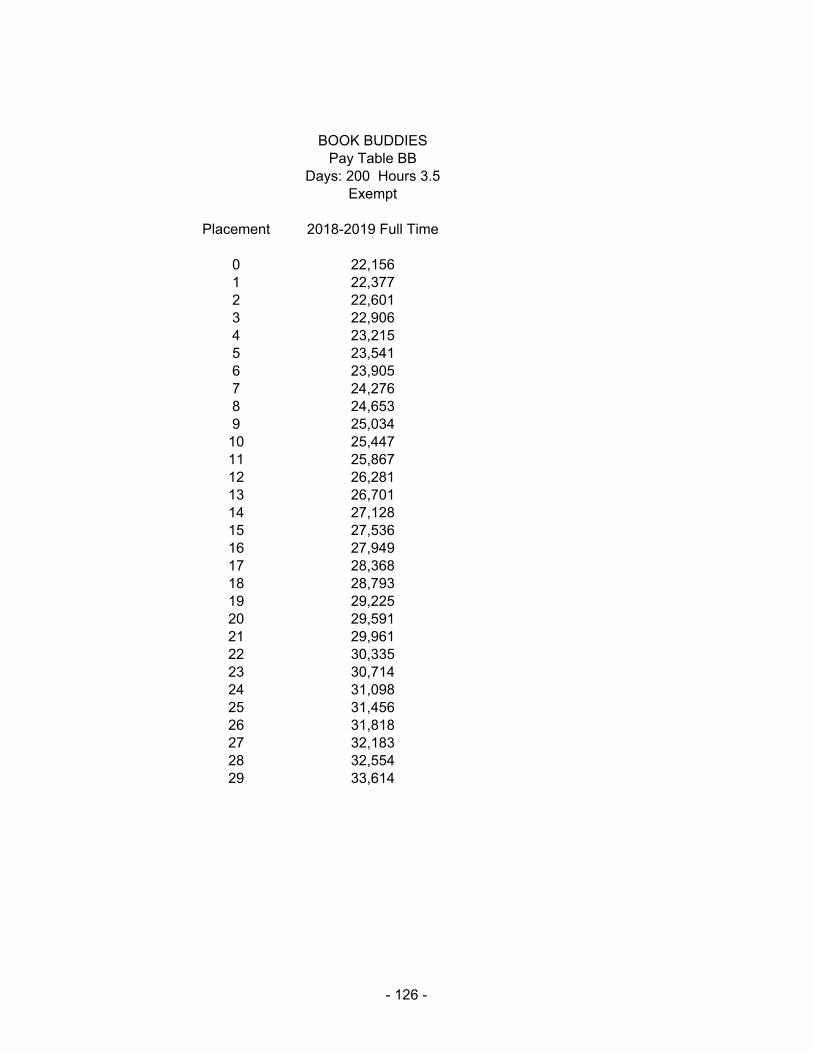
BOOK BUDDIESPay Table BB
Days: 200 Hours 3.5Exempt
Placement 2018-2019 Full Time
0 22,1561 22,3772 22,6013 22,9064 23,2155 23,5416 23,9057 24,2768 24,6539 25,034
10 25,44711 25,86712 26,28113 26,70114 27,12815 27,53616 27,94917 28,36818 28,79319 29,22520 29,59121 29,96122 30,33523 30,71424 31,09825 31,45626 31,81827 32,18328 32,55429 33,614
- 126 -

Pay Table J Pay Table KDays: 184 Hours: 8.0 Days: 184 Hours: 8.0
Placement 2018-2019 Full Time 2018-2019 Part Time
0 20,255 19,4351 20,559 19,7272 20,866 20,0223 21,179 20,3214 21,497 20,6265 21,819 20,9366 22,147 21,2507 22,479 21,5698 22,816 21,8939 23,159 22,242
10 23,528 22,59711 23,905 22,95912 24,287 23,32713 24,677 23,70114 25,073 24,07915 25,472 24,46516 25,880 24,85617 26,293 25,25418 26,714 25,65819 27,142 26,06920 27,577 26,48521 28,017 26,90922 28,466 27,34123 28,922 27,77724 29,383 28,22225 29,854 28,67326 30,332 29,13127 30,816 29,59828 31,311 30,07229 32,396 30,629
CHILD NUTRITION MANAGER - HIGH SCHOOL
- 127 -

Pay Table J1 Pay Table K1Days: 184 Hours: 7.0 Days: 184 Hours: 7.0
Placement 2018-2019 Full Time 2018-2019 Part Time
0 17,373 16,6701 17,634 16,9212 17,899 17,1753 18,168 17,4334 18,439 17,6955 18,716 17,9616 18,996 18,2307 19,283 18,5038 19,573 18,7819 19,867 19,08010 20,184 19,38411 20,506 19,69512 20,835 20,01113 21,168 20,33014 21,507 20,65515 21,850 20,98716 22,201 21,32217 22,556 21,66318 22,917 22,01019 23,283 22,36220 23,655 22,71921 24,034 23,08422 24,419 23,45323 24,810 23,82724 25,206 24,20925 25,610 24,59626 26,019 24,99027 26,435 25,39028 26,859 25,79629 27,791 26,275
CHILD NUTRITION MANAGER - MIDDLE
- 128 -

Pay Table J2 Pay Table K2Days: 184 Hours: 7.0 Days: 184 Hours: 7.0
Placement 2018-2019 Full Time 2018-2019 Part Time
0 16,546 15,8771 16,795 16,1152 17,048 16,3573 17,303 16,6044 17,564 16,8525 17,828 17,1046 18,095 17,3607 18,366 17,6208 18,641 17,8859 18,921 18,17010 19,223 18,46011 19,529 18,75912 19,844 19,05813 20,160 19,36314 20,482 19,67115 20,810 19,98816 21,143 20,30717 21,482 20,63118 21,825 20,96219 22,175 21,29820 22,529 21,63821 22,889 21,98422 23,257 22,33723 23,629 22,69324 24,006 23,05725 24,392 23,42526 24,779 23,80027 25,176 24,18128 25,580 24,56829 26,468 25,024
CHILD NUTRITION MANAGER - ELEMENTARY
- 129 -

Pay Table J3 Pay Table K3Days: 180 Hours: 7.0 Days: 180 Hours: 7.0
Placement 2018-2019 Full Time 2018-2019 Part Time
0 16,158 15,4661 16,360 15,6602 16,564 15,8543 16,773 16,0934 17,024 16,3365 17,281 16,5806 17,540 16,8277 17,803 17,0808 18,070 17,3369 18,338 17,59710 18,617 17,86111 18,896 18,12912 19,179 18,40113 19,466 18,67714 19,757 18,95715 20,054 19,25916 20,374 19,56917 20,701 19,88218 21,032 20,19919 21,369 20,52420 21,710 20,85121 22,057 21,18522 22,411 21,52423 22,770 21,86824 23,133 22,21825 23,504 22,57426 23,880 22,93427 24,262 23,30228 24,651 23,67429 25,504 24,114
CHILD NUTRITION ASSISTANT MANAGER
- 130 -

Pay Table J5 Pay Table K5Days: 180 Hours: 5.0 Days: 180 Hours: 5.0
Placement 2018-2019 Full Time 2018-2019 Part Time
0 11,550 11,0551 11,694 11,1932 11,839 11,3323 11,989 11,5034 12,170 11,6765 12,351 11,8516 12,536 12,0297 12,725 12,2108 12,915 12,3929 13,109 12,57910 13,306 12,76711 13,506 12,95812 13,708 13,15213 13,914 13,35014 14,123 13,55015 14,334 13,76716 14,564 13,98717 14,797 14,21118 15,033 14,43819 15,274 14,67020 15,520 14,90321 15,766 15,14322 16,019 15,38623 16,274 15,63224 16,534 15,88125 16,800 16,13426 17,068 16,39327 17,341 16,65628 17,619 16,92229 18,231 17,235
CHILD NUTRITION ASSISTANT MANAGER
- 131 -

Pay Table J6 Pay Table K6Days: 180 Hours: 6.0 Days: 180 Hours: 6.0
Placement 2018-2019 Full Time 2018-2019 Part Time
0 13,853 13,2611 14,026 13,4262 14,202 13,5943 14,380 13,7984 14,596 14,0055 14,814 14,2156 15,037 14,4297 15,264 14,6458 15,491 14,8659 15,724 15,08710 15,960 15,31311 16,200 15,54412 16,442 15,77713 16,687 16,01314 16,939 16,25315 17,194 16,51316 17,469 16,77817 17,748 17,04618 18,032 17,31919 18,320 17,59620 18,617 17,87721 18,913 18,16322 19,216 18,45323 19,522 18,74924 19,834 19,05125 20,153 19,35426 20,474 19,66327 20,802 19,98028 21,134 20,29829 21,868 20,675
CHILD NUTRITION ASSISTANT MANAGER
- 132 -

Pay Table Q Pay Table R0Days: 180 Hours: 7.0 Days: 180 Hours: 7.0
Placement 2018-2019 Full Time 2018-2019 Part Time
0 15,710 15,0741 15,947 15,3002 16,185 15,5303 16,427 15,7624 16,673 15,9985 16,924 16,2396 17,178 16,4837 17,436 16,7318 17,698 16,9819 17,964 17,23410 18,234 17,49311 18,506 17,75612 18,784 18,02213 19,065 18,29314 19,352 18,56715 19,642 18,86316 19,955 19,16817 20,277 19,47418 20,599 19,78419 20,929 20,10220 21,265 20,42321 21,604 20,74922 21,950 21,08223 22,302 21,41824 22,658 21,76225 23,021 22,11026 23,389 22,46427 23,764 22,82328 24,144 23,18829 24,981 23,619
CHILD NUTRITION WORKER
- 133 -

Pay Table Q1 Pay Table R1Days: 180 Hours: 6.5 Days: 180 Hours: 6.5
Placement 2018-2019 Full Time 2018-2019 Part Time
0 14,589 13,9981 14,807 14,2082 15,029 14,4213 15,256 14,6374 15,484 14,8575 15,715 15,0806 15,952 15,3057 16,192 15,5368 16,434 15,7699 16,679 16,005
10 16,930 16,24511 17,184 16,48912 17,443 16,73713 17,705 16,98814 17,971 17,24115 18,241 17,51716 18,532 17,80017 18,828 18,08518 19,128 18,37319 19,436 18,66720 19,747 18,96421 20,062 19,26722 20,383 19,57923 20,710 19,89024 21,040 20,20725 21,379 20,53226 21,719 20,85927 22,067 21,19428 22,421 21,53329 23,197 21,931
CHILD NUTRITION WORKER
- 134 -

Pay Table Q6 Pay Table R6Days: 180 Hours: 6.0 Days: 180 Hours: 6.0
Placement 2018-2019 Full Time 2018-2019 Part Time
0 13,465 12,9201 13,667 13,1142 13,873 13,3113 14,080 13,5114 14,292 13,7145 14,506 13,9196 14,724 14,1287 14,945 14,3408 15,169 14,5559 15,398 14,773
10 15,627 14,99511 15,862 15,22012 16,100 15,44713 16,342 15,68014 16,587 15,91515 16,835 16,17016 17,104 16,42817 17,378 16,69118 17,656 16,95719 17,941 17,22920 18,228 17,50421 18,519 17,78422 18,815 18,07223 19,115 18,36024 19,421 18,65425 19,733 18,95126 20,048 19,25327 20,367 19,56328 20,696 19,87629 21,811 20,622
CHILD NUTRITION WORKER
- 135 -

Pay Table Q2 Pay Table R2Days: 180 Hours: 5.5 Days: 180 Hours: 5.5
Placement 2018-2019 Full Time 2018-2019 Part Time
0 12,345 11,8451 12,530 12,0222 12,718 12,2023 12,908 12,3864 13,102 12,5725 13,299 12,7606 13,498 12,9517 13,701 13,1468 13,906 13,3439 14,115 13,543
10 14,326 13,74611 14,541 13,95312 14,759 14,16213 14,982 14,37414 15,206 14,59015 15,433 14,82416 15,681 15,06017 15,933 15,30118 16,188 15,54619 16,446 15,79620 16,710 16,04821 16,976 16,30522 17,247 16,56523 17,524 16,83024 17,805 17,09825 18,090 17,37226 18,380 17,64927 18,673 17,93628 18,971 18,22229 19,630 18,558
CHILD NUTRITION WORKER
- 136 -

Pay Table Q5 Pay Table R5Days: 180 Hours: 5.0 Days: 180 Hours: 5.0
Placement 2018-2019 Full Time 2018-2019 Part Time
0 11,222 10,7671 11,390 10,9292 11,561 11,0933 11,733 11,2594 11,911 11,4275 12,088 11,5996 12,270 11,7747 12,455 11,9508 12,640 12,1299 12,831 12,312
10 13,024 12,49611 13,219 12,68312 13,416 12,87313 13,618 13,06714 13,822 13,26315 14,030 13,47516 14,254 13,69017 14,482 13,91018 14,715 14,13219 14,949 14,35920 15,189 14,58821 15,431 14,82222 15,679 15,05823 15,930 15,29924 16,185 15,54525 16,445 15,79426 16,707 16,04627 16,972 16,30228 17,244 16,56229 18,176 17,186
CHILD NUTRITION WORKER
- 137 -

Pay Table Q4 Pay Table R4Days: 180 Hours: 4.0 Days: 180 Hours: 4.0
Placement 2018-2019 Full Time 2018-2019 Part Time
0 8,977 8,6141 9,112 8,7442 9,249 8,8753 9,387 9,0084 9,528 9,1435 9,671 9,2806 9,816 9,4197 9,964 9,5608 10,113 9,7049 10,264 9,849
10 10,418 9,99611 10,576 10,14712 10,733 10,30013 10,893 10,45314 11,058 10,61015 11,224 10,77916 11,404 10,95317 11,586 11,12818 11,772 11,30619 11,960 11,48820 12,150 11,67021 12,346 11,85722 12,543 12,04723 12,744 12,23924 12,948 12,43625 13,155 12,63426 13,365 12,83627 13,579 13,04228 13,796 13,25029 14,275 13,496
CHILD NUTRITION WORKER
- 138 -

Pay Table SD Pay Table SSDays: 260 Hours: 7.5 Days: 260 Hours: 7.5
Placement 2018-2019 Full Time 2018-2019 Part Time
0 43,401 41,0531 43,401 41,0532 43,423 41,5663 43,967 42,0864 44,519 42,7175 45,186 43,3586 45,865 44,0087 46,554 44,6698 47,252 45,3389 47,960 46,01910 48,680 46,71011 49,411 47,40912 50,151 48,11913 50,902 48,84314 51,667 49,57515 54,406 51,437
CLASS SENIOR SITE DIRECTOR
- 139 -

Pay Table SF Pay Table SGDays: 200 Hours: 7.5 Days: 200 Hours: 7.5
Placement 2018-2019 Full Time 2018-2019 Part Time
0 31,880 30,1551 31,880 30,1552 31,896 30,5313 32,294 30,9134 32,702 31,3775 33,190 31,8476 33,689 32,3267 34,196 32,8108 34,709 33,3029 35,228 33,804
10 35,757 34,31011 36,294 34,82312 36,836 35,34513 37,389 35,87614 37,950 36,41415 39,191 37,053
CLASS SITE DIRECTOR
- 140 -

Pay Table CR Pay Table CLDays: 260 Days: 260
Exempt Exempt
Placement 2018-2019 Full Time 2018-2019 Part Time
0 47,610 45,5731 48,206 46,1442 48,808 46,7213 49,419 47,3034 50,035 47,8955 50,662 48,4946 51,294 49,1007 51,937 49,7148 52,586 50,3359 53,242 50,96410 53,906 51,60111 54,581 52,24512 55,262 52,89913 55,954 53,56114 56,654 54,23215 57,364 54,90916 58,079 55,59617 58,805 56,28918 59,540 56,99219 60,285 57,70520 61,037 58,42621 61,801 59,15722 62,574 59,89723 63,357 60,64424 64,148 61,40325 64,951 62,17126 65,762 62,94827 66,584 63,73428 67,416 64,53129 70,753 66,892
COMMUNITY RELATIONS SPECIALIST
- 141 -

Pay Table W Pay Table W1Days: 260 Days: 260
Exempt Exempt
Placement 2018-2019 Full Time 2018-2019 Part Time
0 57,500 55,1171 58,304 55,8892 59,120 56,6733 59,947 57,4654 60,787 58,2705 61,638 59,0866 62,500 59,9127 63,376 60,7518 64,263 61,6029 65,162 62,46510 66,077 63,40211 67,069 64,35212 68,075 65,31813 69,096 66,29814 70,132 67,29315 71,184 68,30116 72,251 69,32617 73,336 70,36518 74,435 71,42219 75,551 72,49320 76,684 73,58221 77,835 74,68522 79,003 75,80323 80,187 76,94024 81,389 78,09525 82,611 79,26726 83,851 80,45527 85,110 81,66228 86,386 82,88729 89,287 84,415
COORDINATOR ADMINISTRATIVE
- 142 -

Pay Table X1 Pay Table Y1Days: 260 Days: 260
Exempt Exempt
Placement 2018-2019 Full Time 2018-2019 Part Time
0 71,599 67,7251 71,599 67,7252 71,636 68,5723 72,533 69,4294 73,441 70,2975 74,364 71,4236 75,554 72,5647 76,763 73,7278 78,003 75,7109 80,097 77,22510 81,700 78,76911 83,318 79,75412 84,366 80,95013 85,625 81,96214 86,711 83,60115 92,864 87,801
COORDINATOR - LEADERSHIP
- 143 -

Pay Table X2 Pay Table Y2Days: 240 Days: 240
Exempt Exempt
Placement 2018-2019 Full Time 2018-2019 Part Time
0 66,091 62,5151 66,091 62,5152 66,126 63,2973 66,954 64,0884 67,792 64,8905 68,644 65,9296 69,742 66,9827 70,858 68,0568 72,003 69,8869 73,936 71,28510 75,415 72,71011 76,909 73,61912 77,876 74,72313 79,038 75,65714 80,041 77,17015 85,721 81,047
COORDINATOR - LEADERSHIP / ASSISTANT PRINCIPAL
- 144 -

Pay Table X3 Pay Table Y3Days: 220 Days: 220
Exempt Exempt
Placement 2018-2019 Full Time 2018-2019 Part Time
0 60,584 57,3061 60,584 57,3062 60,615 58,0223 61,374 58,7484 62,142 59,4825 62,923 60,4356 63,930 61,4007 64,953 62,3848 66,003 64,0629 67,774 65,34410 69,131 66,65111 70,500 67,48412 71,387 68,49613 72,452 69,35214 73,371 70,73915 78,577 74,293
COORDINATOR - LEADERSHIP / ASSISTANT PRINCIPAL
- 145 -

Pay Table CM Pay Table CNDays: 260 Hours: 8.0 Days: 260 Hours: 8.0
Placement 2018-2019 Full Time 2018-2019 Part Time
0 44,662 42,8541 45,331 43,4972 46,012 44,1493 46,706 44,9214 47,523 45,7085 48,355 46,5086 49,201 47,3217 50,061 48,1448 50,933 48,9899 51,824 49,850
10 52,737 50,72011 53,656 51,60812 54,595 52,51313 55,553 53,43614 56,530 54,37215 57,519 55,32716 58,528 56,29917 59,558 57,28518 60,602 58,29519 61,670 59,31720 62,751 60,36121 63,856 61,42222 64,980 62,50623 66,125 63,60824 67,290 64,72825 68,475 65,86726 69,681 67,03027 70,910 68,21228 72,160 69,41429 74,902 70,815
COORDINATOR OF MAINTENANCE
- 146 -

PAY TABLE X4 PAY TABLE Y4Days: 260 Days: 260
Exempt Exempt
Placement 2018-2019 Full Time 2018-2019 Part Time
0 71,599 67,7251 71,599 67,7252 71,632 68,4703 72,422 69,2234 73,226 70,2485 74,311 71,2896 75,420 73,8277 78,096 74,9218 79,254 76,0299 80,425 77,15310 81,615 78,29411 82,822 79,45412 84,050 80,63113 85,294 81,82414 86,555 83,03415 91,198 86,222
COORDINATOR - TEACHER MENTOR / PD FACILITATOR
- 147 -

Pay Table I Pay Table CUDays: 260 Hours: 8.0 Days: 260 Hours: 8.0
Placement 2018-2019 Full Time 2018-2019 Part Time
0 28,206 24,8841 28,530 25,1962 28,859 25,5103 29,190 25,8294 29,527 26,1525 29,866 26,4806 30,209 26,8117 30,556 27,1598 30,908 27,5119 31,263 27,86810 31,623 28,23211 31,986 28,59812 32,354 28,97113 32,727 29,34714 33,103 29,72815 33,483 30,11516 33,868 30,50617 34,258 30,90318 34,652 31,30419 35,051 31,71220 35,454 32,12421 35,861 32,54222 36,274 32,96523 36,691 33,39324 37,112 33,82725 37,538 34,26626 37,972 34,71327 38,409 35,16428 38,849 35,62029 39,394 36,674
CUSTODIAN
- 148 -

Pay Table A Pay Table A1Days: 260 Days: 260
Exempt Exempt
Placement 2018-2019 Full Time 2018-2019 Part Time
0 96,193 90,9871 96,193 90,9872 96,257 92,5803 97,941 94,1974 99,649 95,8445 101,393 97,5216 103,167 99,2297 104,974 100,9618 106,817 104,1119 110,087 104,53210 110,583 106,36011 112,518 108,22812 114,493 110,12713 116,501 112,07214 118,557 113,91115 126,038 119,164
DIRECTORS
- 149 -

Pay Table BLDays: 200
Placement 2018-2019 Full Time
0 49,7421 50,2392 50,7413 51,2544 51,9465 52,6496 53,3847 54,2168 55,0559 55,90810 56,77711 57,71312 58,66513 59,60414 60,55615 61,52416 62,44817 63,38418 64,33319 65,29920 66,27521 67,10322 67,94023 68,79024 69,65025 70,51926 71,33027 72,15028 72,98129 76,221
EXTENDED LEARNING TEACHER
- 150 -

Pay Table H Pay Table HCDays: 260 Hours: 8.0 Days: 260 Hours: 8.0
Placement 2018-2019 Full Time 2018-2019 Part Time
0 29,052 25,7901 29,415 26,1762 29,783 26,6343 30,155 27,1004 30,533 27,5755 30,914 28,0576 31,301 28,5627 31,692 29,0768 32,088 29,5999 32,489 30,11810 32,895 30,64411 33,306 31,18112 33,722 31,74313 34,143 32,31414 34,570 32,89515 35,004 33,48716 35,441 34,09017 35,883 34,70418 36,331 35,32819 36,877 35,96520 37,540 36,61521 38,216 37,27322 38,905 37,94523 39,606 38,62824 40,398 39,32325 41,206 40,03126 42,031 40,75127 42,871 41,48728 43,729 42,10929 47,379 44,239
HEAD CUSTODIAN
- 151 -

Pay Table HDDays: 260 Hours: 7.0
Placement 2018-2019 Full Time
0 30,9101 31,3742 31,8453 32,3234 32,8085 33,3006 33,8017 34,3078 34,8209 35,34310 35,87411 36,41212 36,95813 37,51214 38,07415 38,64616 39,22717 39,81418 40,41219 41,01820 41,63321 42,25822 42,89123 43,53424 44,18725 44,84926 45,52227 46,20528 46,89929 47,722
HELP DESK
- 152 -
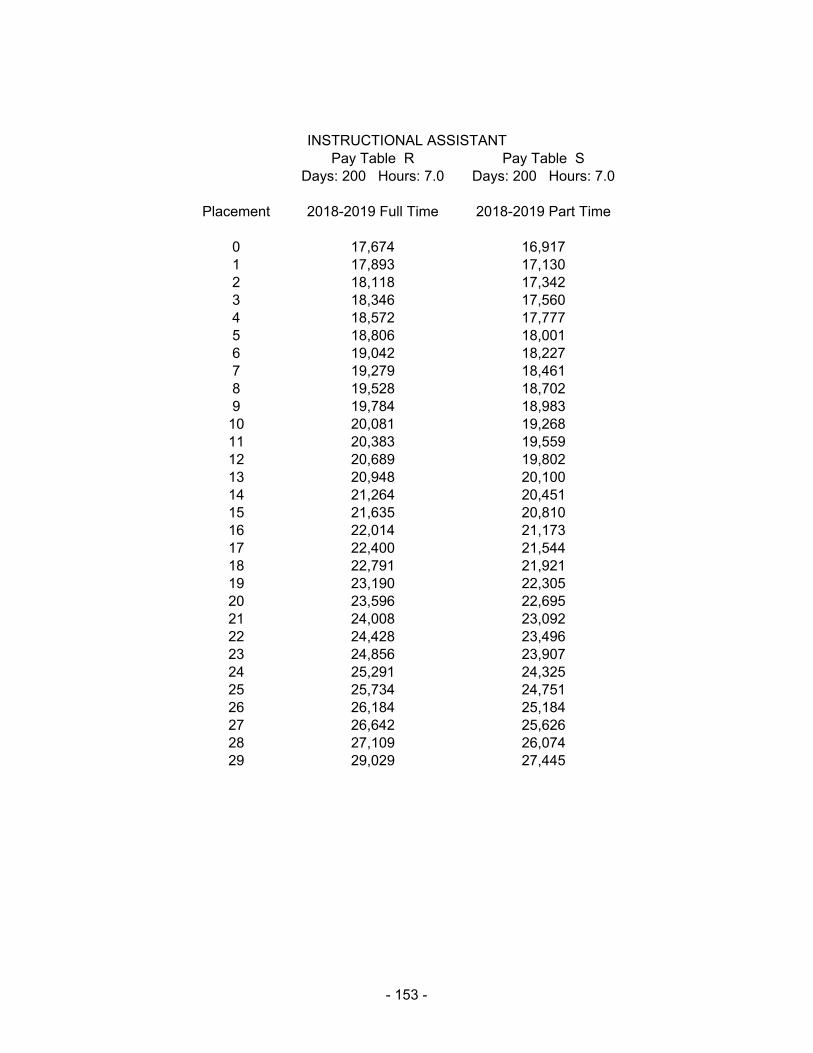
Pay Table R Pay Table SDays: 200 Hours: 7.0 Days: 200 Hours: 7.0
Placement 2018-2019 Full Time 2018-2019 Part Time
0 17,674 16,9171 17,893 17,1302 18,118 17,3423 18,346 17,5604 18,572 17,7775 18,806 18,0016 19,042 18,2277 19,279 18,4618 19,528 18,7029 19,784 18,98310 20,081 19,26811 20,383 19,55912 20,689 19,80213 20,948 20,10014 21,264 20,45115 21,635 20,81016 22,014 21,17317 22,400 21,54418 22,791 21,92119 23,190 22,30520 23,596 22,69521 24,008 23,09222 24,428 23,49623 24,856 23,90724 25,291 24,32525 25,734 24,75126 26,184 25,18427 26,642 25,62628 27,109 26,07429 29,029 27,445
INSTRUCTIONAL ASSISTANT
- 153 -

Pay Table H5 Pay Table S5Days: 260 Hours: 8.0 Days: 260 Hours: 8.0
Placement 2018-2019 Full Time 2018-2019 Part Time
0 26,257 25,1331 26,585 25,4472 26,917 25,7663 27,254 26,0884 27,594 26,4145 27,939 26,7456 28,289 27,0797 28,644 27,4318 29,015 27,7879 29,395 28,205
10 29,836 28,62811 30,283 29,05912 30,737 29,42113 31,123 29,86314 31,592 30,38515 32,144 30,91616 32,706 31,45817 33,279 32,00918 33,861 32,56819 34,454 33,13920 35,057 33,71721 35,672 34,30922 36,294 34,90823 36,930 35,51924 37,578 36,14025 38,232 36,77326 38,901 37,41727 39,584 38,07128 40,277 38,73729 42,808 40,472
INSTRUCTIONAL ASSISTANT - HOSPITAL EDUCATION
- 154 -

INSTRUCTIONAL COACHPay Table IC
Days: 220 Hours: 8.0
Placement 2018-2019 Full Time
0 58,3351 58,9192 59,5073 60,1084 60,9205 61,7466 62,6097 63,5818 64,5679 65,568
10 66,58611 67,68312 68,80213 69,90114 71,01915 72,15416 73,23617 74,33518 75,44919 76,58120 77,72521 78,69622 79,67823 80,67624 81,68425 82,70426 83,65427 84,61628 85,59029 89,390
- 155 -

Pay Table W Pay Table W1Days: 260 Days: 260
Exempt Exempt
Placement 2018-2019 Full Time 2018-2019 Part Time
0 57,500 55,1171 58,304 55,8892 59,120 56,6733 59,947 57,4654 60,787 58,2705 61,638 59,0866 62,500 59,9127 63,376 60,7518 64,263 61,6029 65,162 62,46510 66,077 63,40211 67,069 64,35212 68,075 65,31813 69,096 66,29814 70,132 67,29315 71,184 68,30116 72,251 69,32617 73,336 70,36518 74,435 71,42219 75,551 72,49320 76,684 73,58221 77,835 74,68522 79,003 75,80323 80,187 76,94024 81,389 78,09525 82,611 79,26726 83,851 80,45527 85,110 81,66228 86,386 82,88729 89,287 84,415
LEAD TECHNICAL SUPPORT SPECIALIST
- 156 -

Pay Table M Pay Table M1Days: 260 Hours: 8.0 Days: 260 Hours: 8.0
Placement 2018-2019 Full Time 2018-2019 Part Time
0 26,935 26,1511 27,668 26,8642 28,421 27,3573 28,941 27,8484 29,461 28,3505 29,992 28,8616 30,532 29,3817 31,083 29,9098 31,641 30,4489 32,210 30,998
10 32,791 31,55411 33,381 32,12212 33,981 32,70013 34,595 33,28714 35,214 33,88815 35,850 34,49916 36,497 35,12117 37,154 35,74918 37,819 36,39619 38,502 37,05020 39,194 37,71821 39,900 38,39722 40,620 39,08823 41,350 39,79224 42,095 40,50725 42,853 41,23526 43,624 41,97827 44,409 42,73228 45,207 43,50329 47,512 44,920
MAINTENANCE - CRAFTSMAN
- 157 -

Pay Table L Pay Table L1Days: 260 Days: 260
Placement 2018-2019 Full Time 2018-2019 Part Time
0 40,386 38,6581 40,891 39,1402 41,402 39,6303 41,921 40,2244 42,551 40,8285 43,189 41,4416 43,837 42,0637 44,496 42,6948 45,163 43,3349 45,840 43,983
10 46,527 44,64311 47,225 45,31312 47,935 45,99313 48,652 46,68314 49,382 47,38315 50,124 48,09416 50,876 48,81517 51,639 49,54818 52,413 50,29219 53,200 51,04620 53,999 51,81221 54,808 52,58922 55,630 53,37623 56,463 54,17624 57,310 54,98825 58,169 55,81326 59,043 56,65127 59,927 57,50228 60,826 58,36329 62,814 59,388
MANAGER - MLK-PAC, NUTRITION COORDINATOR
- 158 -

Pay Table W Pay Table W1Days: 260 Days: 260
Exempt Exempt
Placement 2018-2019 Full Time 2018-2019 Part Time
0 57,500 55,1171 58,304 55,8892 59,120 56,6733 59,947 57,4654 60,787 58,2705 61,638 59,0866 62,500 59,9127 63,376 60,7518 64,263 61,6029 65,162 62,46510 66,077 63,40211 67,069 64,35212 68,075 65,31813 69,096 66,29814 70,132 67,29315 71,184 68,30116 72,251 69,32617 73,336 70,36518 74,435 71,42219 75,551 72,49320 76,684 73,58221 77,835 74,68522 79,003 75,80323 80,187 76,94024 81,389 78,09525 82,611 79,26726 83,851 80,45527 85,110 81,66228 86,386 82,88729 89,287 84,415
NETWORK ENGINEER
- 159 -

Pay Table F Pay Table F1Days: 200 Hours: 7.0 Days: 200 Hours: 7.0
Placement 2018-2019 Full Time 2018-2019 Part Time
0 26,648 25,6321 27,115 26,0802 27,590 26,5373 28,072 27,0024 28,564 27,4735 29,064 27,9546 29,571 28,4447 30,091 28,9568 30,632 29,4769 31,183 30,007
10 31,745 30,54711 32,317 31,09612 32,897 31,65613 33,488 32,22614 34,092 32,80515 34,705 33,39816 35,331 33,99717 35,968 34,60918 36,614 35,23119 37,272 35,86620 37,941 36,51321 38,626 37,17122 39,322 37,84123 40,031 38,52224 40,753 39,21425 41,485 39,92126 42,232 40,64027 42,994 41,36928 43,765 42,11529 46,576 44,035
NURSE - LPN
- 160 -

Pay Table G Pay Table G1Days: 200 Hours: 7.0 Days: 200 Hours: 7.0
Placement 2018-2019 Full Time 2018-2019 Part Time
0 27,669 26,6141 28,154 27,0802 28,647 27,5543 29,148 28,0364 29,659 28,5265 30,178 29,0246 30,706 29,5337 31,243 30,0508 31,790 30,5919 32,362 31,14110 32,945 31,70011 33,537 32,27012 34,139 32,85213 34,753 33,44314 35,379 34,04515 36,016 34,65916 36,667 35,28417 37,327 35,91318 37,995 36,56219 38,681 37,22120 39,377 37,89121 40,085 38,57422 40,807 39,26823 41,542 39,97524 42,290 40,69425 43,049 41,42726 43,826 42,17427 44,616 42,93428 45,420 43,70529 48,428 45,785
NURSE - RN
- 161 -

Pay Table P1 Pay Table EPDays: 260 Days: 260
Exempt Exempt
Placement 2018-2019 Full Time 2018-2019 Part Time
0 82,454 78,9271 83,484 79,9132 84,528 80,9113 85,585 81,9234 86,661 83,1525 87,961 84,3996 89,281 85,6677 90,622 86,9508 91,980 88,2539 93,359 89,57810 94,758 90,92311 96,181 92,28612 97,621 93,60613 99,022 95,07514 100,575 96,50115 105,907 100,128
PRINCIPAL - ELEMENTARY
- 162 -
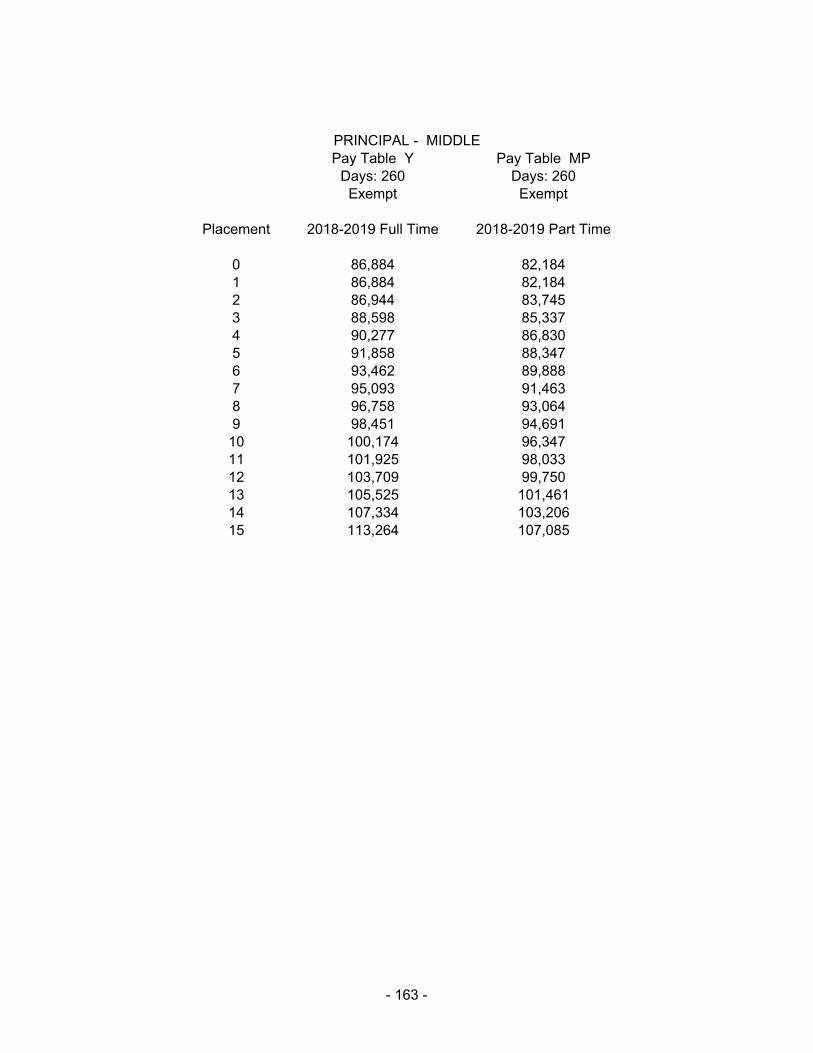
Pay Table Y Pay Table MPDays: 260 Days: 260
Exempt Exempt
Placement 2018-2019 Full Time 2018-2019 Part Time
0 86,884 82,1841 86,884 82,1842 86,944 83,7453 88,598 85,3374 90,277 86,8305 91,858 88,3476 93,462 89,8887 95,093 91,4638 96,758 93,0649 98,451 94,69110 100,174 96,34711 101,925 98,03312 103,709 99,75013 105,525 101,46114 107,334 103,20615 113,264 107,085
PRINCIPAL - MIDDLE
- 163 -

Pay Table AA Pay Table HPDays: 260 Days: 260
Exempt Exempt
Placement 2018-2019 Full Time 2018-2019 Part Time
0 93,457 88,4001 93,457 88,4002 93,519 89,9493 95,156 91,5184 96,817 93,1195 98,509 94,7486 100,235 96,4087 101,989 98,0908 103,774 100,0529 105,849 102,05310 107,968 104,09411 110,128 106,17712 112,329 108,29913 114,575 110,46514 116,866 112,67515 121,863 115,216
PRINCIPAL - HIGH SCHOOL
- 164 -

Pay Table CS Pay Table SEDays: 260 Hours: 8.0 Days: 260 Hours: 8.0
Placement 2018-2019 Full Time 2018-2019 Part Time
0 29,052 25,3201 29,415 25,7642 29,783 26,2153 30,155 26,6744 30,533 27,1415 30,914 27,6166 31,301 28,0997 31,692 28,6028 32,088 29,1189 32,489 29,643
10 32,895 30,17711 33,306 30,72012 33,722 31,27213 34,143 31,83514 34,570 32,40915 35,004 32,99316 35,441 33,58517 35,883 34,19118 36,331 34,80519 36,877 35,43320 37,540 36,07221 38,216 36,71922 38,905 37,37923 39,606 38,05324 40,398 38,73725 41,206 39,43626 42,031 40,14527 42,871 40,86828 43,729 41,60329 47,379 42,458
SECRETARY
- 165 -

Pay Table PE Pay Table SCDays: 200 Days: 200
Placement 2018-2019 Full Time 2018-2019 Part Time
0 36,041 34,6811 36,690 35,3072 37,352 35,9443 38,024 36,5884 38,708 37,2305 39,386 37,8826 40,075 38,5457 40,776 39,2198 41,490 39,9259 42,236 40,647
10 43,000 41,37611 43,773 42,12212 44,560 42,87913 45,363 43,65214 46,179 44,43615 47,009 45,23816 47,857 46,05217 48,720 46,87818 49,593 47,72419 50,488 48,58220 51,395 49,45721 52,321 50,34722 53,265 51,25523 54,224 52,17924 55,200 53,11625 56,191 54,07526 57,206 55,04727 58,234 56,03728 59,282 57,04429 61,576 58,217
SPECIAL COUNSELOR
- 166 -

Pay Table ST Pay Table SPDays: 260 Days: 260
Exempt Exempt
Placement 2018-2019 Full Time 2018-2019 Part Time
0 82,455 78,9281 83,485 79,9142 84,529 80,9123 85,586 81,9244 86,662 83,1535 87,962 84,4006 89,282 85,6677 90,623 86,9518 91,981 88,2559 93,360 89,57910 94,759 90,92411 96,182 92,28812 97,625 93,67113 99,088 95,07614 100,576 96,50215 106,931 101,098
SUPERVISOR
- 167 -

Pay Table N Pay Table N1Days: 260 Hours: 8.0 Days: 260 Hours: 8.0
Placement 2018-2019 Full Time 2018-2019 Part Time
0 45,987 44,2301 46,792 45,0062 47,611 45,7923 48,444 46,5944 49,291 47,4095 50,154 48,2386 51,031 49,0837 51,926 49,9638 52,857 50,8649 53,811 51,78310 54,783 52,71311 55,765 53,66312 56,769 54,62913 57,791 55,61214 58,831 56,61115 59,891 57,63216 60,967 58,66917 62,067 59,72518 63,182 60,80219 64,323 61,89420 65,477 63,00921 66,657 64,14322 67,857 65,29623 69,078 66,47424 70,324 67,66825 71,586 68,88726 72,874 70,12627 74,187 71,38928 75,523 72,67429 80,527 76,135
TECHNICAL SUPPORT SPECIALIST
- 168 -

Pay Table T Pay Table TRDays: 200 Days: 200
Exempt Exempt
Step 2018-2019 Full Time 2018-2019 Part Time
0 44,696 42,2781 44,696 42,2782 44,696 42,2783 44,720 42,8074 45,280 43,3425 45,846 43,8836 46,422 44,5427 47,119 45,2108 47,824 45,8899 48,541 46,577
10 49,271 47,27411 50,007 47,98412 50,758 48,70413 51,521 49,43414 52,291 50,17615 53,076 50,92616 53,872 51,69117 54,680 52,46818 55,500 53,25419 56,333 54,05220 57,179 54,86221 58,036 55,68622 58,908 56,52323 59,791 57,37024 60,687 58,22925 61,598 59,10426 62,522 59,99127 63,459 60,89128 64,411 61,80429 67,639 63,947
TRAINER
- 169 -

Pay Table ZM Pay Table ZCDays: 260 Hours: 8.0 Days: 260 Hours: 8.0
Placement 2018-2019 Full Time 2018-2019 Part Time
0 35,872 34,5031 36,502 35,1062 37,138 35,7213 37,788 36,3484 38,451 36,9815 39,123 37,6296 39,808 38,2887 40,505 38,9768 41,232 39,6769 41,974 40,393
10 42,732 41,11911 43,500 41,86012 44,284 42,61313 45,081 43,38114 45,893 44,16015 46,718 44,95716 47,559 45,76717 48,416 46,58718 49,284 47,42719 50,175 48,27820 51,075 49,15021 51,996 50,03522 52,932 50,93723 53,885 51,85224 54,854 52,78525 55,843 53,73626 56,847 54,70227 57,870 55,68628 58,912 56,69129 62,816 59,390
ZONE MAINTENANCE CHIEF
- 170 -

Substitute Pay Rates
a. Substitute Teacher - 60 hours of colllege credit or higher $ 11.43 per hourSubstitute with a valid teaching license $ 12.14 per hour
b. Substitute instructional assistant (maximum 7 hours per day) $ 10.71 per hourc. Designated extended substitute (for 2 weeks or longer,
scheduled in advance) $ 29.57 per hour
d. Instructional Assistant Substitute for Teacher $ 5.71 per hour
e. Extended Substitute Instructional Assistant for Full-time Teacher $ 11.43 per hour
f. Extended Substitute Instructional Assistant for Half-time Teacher $ 5.71 per hour
g. Designated extended Substitute Instructional Assistant $ 11.44 per hour(for 2 weeks or longer, scheduled in advance)
The rate applied for extended substitutes must be approved by the Department of Human Resources upon written request from the school principal or department administrator. Requests are not automatically granted and are not retroactive.
Hourly Pay Rates – Working With Students
Certified teacher (homebound, contracted or former employee) $ 25.00 per hour
Certified teacher (hourly employee) $ 19.50 per hour
Graduate student, BA or equivalent $ 19.50 for tutoring$ 19.50 for homebound
Undergraduate student $ 15.00 for tutoring(with at least one semester)
Instructional Assistant Hourly rate or appropriate teacher, degree rate, whichever is higher, forup to 40 hours a week; time and a half
after 40 hours on the combined rate.
High school student, high school graduate $ 9.75 per hour
Other Pay Rates
a. Hourly rate for in-service activities - teachers $ 19.50 per hourb. Hourly rate for curriculum work $ 19.50 per hourc. Hourly rate – classified skilled, substitute nurses and interpreters $ 15.00 per hourd. Substitute secretary (maximum 7.5 hours per day) $ 9.75 per hour
Substitute janitor (maximum 8 hours per day) Substitute school nutrition worker
e. Nutrition employees rate for catering $ 15.00 per hour(or hourly rate of pay whichever is greater)
These rates are inclusive of all identified and ongoing activities. Labor rates will be set by the Director of Human Resources for work performed for a purpose not specifically identified on the above list.
PL for Course Development $ 100.00 per 1.5 hour course
PL for Instructional Assistants Individual hourly rate during school year$ 9.75 per hour in summer
- 171 -

DEGREE SUPPLEMENTS - FULL TIME STAFF(full time supplements are higher due to Employee share of VRS passed to employees in 2012-2013)
Degree Daily Rates 200 Days 205 Days 220 Days 240 Days 245 Days 260 Days
BA + 15 $3.18 $636 $652 $700 $763 $779 $827
Master’s/CPA $11.58 $2,316 $2,374 $2,548 $2,779 $2,837 $3,011
Master’s + 30 $16.87 $3,374 $3,458 $3,711 $4,049 $4,133 $4,386
Doctorate $22.16 $4,432 $4,543 $4,875 $5,318 $5,429 $5,762
DEGREE SUPPLEMENTS - PART TIME STAFF(Amount X's % time)
Degree Daily Rates 200 Days 205 Days 220 Days 240 Days 245 Days 260 Days
BA + 15 $3.00 $600 $615 $660 $720 $735 $780 Master’s/CPA $11.00 $2,200 $2,255 $2,420 $2,640 $2,695 $2,860 Master’s + 30 $16.00 $3,200 $3,280 $3,520 $3,840 $3,920 $4,160 Doctorate $22.00 $4,400 $4,510 $4,840 $5,280 $5,390 $5,720
DEGREE SUPPLEMENTS - PART TIME STAFFThe folloiwing positions receive the supplement indicated (part time = amount X's % time):
Employees on pay tables D, H1, He, H3, H4, 1,058$ Full TimeNartional Certification and H5 are eligible for an annual supplement
with documentation of national certification 1,000$ Part Timein their assigned area
Special Education Designated Special Education Instructional 529$ Full TimeInstructional Assistants Assistants receive a supplement based on
annual review of assignment and responsibilities 500$ Part Time
The following pay tables are eligible for degree supplements:
Assistant Principal, Assistant Superintendent, Associate Superintendent, Athletic Director, Coordinator - Administrative, Coordinator - Book Buddies, Coordinator – Leadership, Director,Principal, Special Counselor, Supervisor, Teacher, Network Engineer, Technical Support Specialist
Instructional Assistant, Intervention Specialist, Interpreter = $529 degree supplement for a BA and above. Part time = $500 X’s % time.
Longevity Pay
Longevity pay is provided to employees who meet the following criteria:1. Full time position2. Have 30 years of recognized experience by CCS3. Employed for at least 10 consecutive years in CCS in full-time position4. At the top of the pay scale (not eligible for step increase)
As long as the above criteria are met, payment is provided as follows:1. $1,058 at 30 years experience level2. $212 a year thereafter to a maximum of $3,174.
(Note: Employees who receive longevity pay will continue to be credited for the amount awarded. Any longevity pay earned through the new proposal replaces the amount previously
- 172 -

Step 1 Step 2 Step 3 Positions
Step 1 is the supplement for 0-3 years of experience in the designated position (or compara $3,000 $3,350 $3,700 1
Head Basketball - Girls (Fall) $3,000 $3,350 $3,700 1
Assistant Basketball – Boys (Winter) $1,000 $1,250 $1,500 1
Assistant Basketball – Girls (Fall) $1,000 $1,250 $1,500 1
Head JV Basketball – Boys (Winter) $1,000 $1,250 $1,500 1
Head JV Basketball – Girls (Fall) $1,000 $1,250 $1,500 1
Ninth Grade Basketball - Boys (Winter) $1,000 $1,250 $1,500 1
Ninth Grade Basketball - Girls (Fall) $1,000 $1,250 $1,500 1
Head Cheerleading (Fall) $1,500 $1,750 $2,000 1
Head Cheerleading (Winter) $2,250 $2,750 $3,375 1
Head JV Cheerleading (Fall) $1,000 $1,250 $1,500 1
Head JV Cheerleading (Winter) $1,000 $1,250 $1,500 1
Head Cheerleading Competition $1,000 $1,250 $1,500 1
Head Cross Country $2,250 $2,750 $3,375 1
Assistant Cross Country $1,000 $1,250 $1,500 1
Head Football $4,100 $4,600 $5,100 1
First Assistant Football $2,500 $3,000 $3,500 1
Second Assistant Football $2,000 $2,500 $3,000 1
Third Assistant Football $2,000 $2,500 $3,000 1
Fourth Assistant Football $2,000 $2,500 $3,000 1
Head Ninth Grade Football $1,000 $1,250 $1,500 1
Assistant Ninth Grade Football $1,000 $1,250 $1,500 3
Head Golf $1,500 $1,750 $2,000 1
Assistant Golf $1,000 $1,250 $1,500 1
Head Field Hockey $2,250 $2,750 $3,375 1
Assistant Field Hockey $1,000 $1,250 $1,500 3
Head Swimming/Diving $2,250 $2,500 $3,125 1
Assistant Swimming/Diving $1,000 $1,250 $1,500 2
Head Indoor Track $1,500 $1,750 $2,000 1
Assistant Indoor Track $1,000 $1,250 $1,500 2
Head Outdoor Track - Boys $2,250 $2,750 $3,500 1
Head Outdoor Track - Girls $2,250 $2,750 $3,500 1
Assistant Outdoor Track - Boys $1,000 $1,250 $1,500 1
Assistant Outdoor Track - Girls $1,000 $1,250 $1,500 1
Head Volleyball $2,000 $2,300 $2,750 1
Volunteer Stipends for Extra Curricular Activities for 2018-2019Step 1 is the supplement for 0-3 years of experience in the designated position (or comparable position), Step 2 is the supplement for 4-7 years of experience in the designated position (or comparable position), and Step 3 is the supplement for 8 or above years of experience in the designated position (or comparable position). After twelve years of experience in a designated position, the supplement for step 3 is increased by 10%. At every four year interval above 12 years of experience an additional 10% of Step 3 is added to the supplement. Flat rate across steps do not earn percentage rate increases.
- 173 -

Step 1 Step 2 Step 3 Positions
Volunteer Stipends for Extra Curricular Activities for 2018-2019Step 1 is the supplement for 0-3 years of experience in the designated position (or comparable position), Step 2 is the supplement for 4-7 years of experience in the designated position (or comparable position), and Step 3 is the supplement for 8 or above years of experience in the designated position (or comparable position). After twelve years of experience in a designated position, the supplement for step 3 is increased by 10%. At every four year interval above 12 years of experience an additional 10% of Step 3 is added to the supplement. Flat rate across steps do not earn percentage rate increases.
Assistant Volleyball $1,000 $1,250 $1,500 2
High School Head Wrestling $2,250 $2,750 $3,375 1
High School Assistant Wrestling $1,000 $1,250 $1,500 1
Head Baseball $2,250 $2,750 $3,375 1
Assistant Baseball $1,000 $1,250 $1,500 1
Head JV Baseball $1,000 $1,250 $1,500 1
Head Softball $2,250 $2,750 $3,375 1
Assistant Softball $1,000 $1,250 $1,500 1
Head JV Softball $1,000 $1,250 $1,500 1
Head Lacrosse - Boys $2,250 $2,750 $3,375 1
Head Lacrosse - Girls $2,250 $2,750 $3,375 1
Head JV Lacrosse – Boys $1,000 $1,250 $1,500 1
Head JV Lacrosse – Girls $1,000 $1,250 $1,500 1
Head Soccer - Boys $2,250 $2,750 $3,375 1
Head Soccer - Girls $2,250 $2,750 $3,375 1
Head JV Soccer - Boys $1,000 $1,250 $1,500 1
Head JV Soccer – Girls $1,000 $1,250 $1,500 1
Head Tennis – Boys $1,400 $1,800 $2,200 1
Head Tennis - Girls $1,400 $1,800 $2,200 1
Head Trainer (Fall) $2,500 $2,500 $2,500 1
Head Trainer (Winter) $2,500 $2,500 $2,500 1
Head Trainer (Spring) $2,500 $2,500 $2,500 1
Assistant Coordinator of Student Activities (one coordinator per season) $2,500 $2,500 $2,500 3
Graduation Coordinator $1,500 $1,500 $1,500 1
Class Sponsor (Freshman & Sophomore) $500 $500 $500 4
Class Sponsor (Junior & Senior) $1,100 $1,100 $1,100 4
CHS TV Quiz - Head Coach $1,000 $1,250 $1,500 1
CHS TV Quiz - Assistant Coach $500 $600 $725 1
CHS Debate $1,500 $1,750 $2,000 1
CHS DECA Sponsor $500 $600 $725 1
High School Department Head $4,000 $4,000 $4,000 11
CHS FBLA Sponsor $500 $600 $725 1
CHS FHA Sponsor $500 $600 $725 1
CHS Forensics $1,500 $1,750 $2,000 1
- 174 -

Step 1 Step 2 Step 3 Positions
Volunteer Stipends for Extra Curricular Activities for 2018-2019Step 1 is the supplement for 0-3 years of experience in the designated position (or comparable position), Step 2 is the supplement for 4-7 years of experience in the designated position (or comparable position), and Step 3 is the supplement for 8 or above years of experience in the designated position (or comparable position). After twelve years of experience in a designated position, the supplement for step 3 is increased by 10%. At every four year interval above 12 years of experience an additional 10% of Step 3 is added to the supplement. Flat rate across steps do not earn percentage rate increases.
CHS Key Club $1,000 $1,000 $1,000 1
CHS Knowledge Master Coach $1,000 $1,250 $1,500 2
CHS Language Club Sponsor $500 $600 $725 5
CHS Literary Magazine Advisor $1,000 $1,250 $1,500 1
Middle School Team Leaders $1,500 $1,500 $1,500 6
CHS Model UN Sponsor $500 $600 $725 1
CHS National Honor Society Sponsor $750 $750 $750 2
CHS Newspaper Advisor $2,000 $2,250 $2,500 1
CHS SCA Sponsors $1,000 $1,250 $1,500 2
CHS/Buford Technology Student Assoc. $600 $700 $825 2
CHS VHSL Academic Competition $1,500 $1,750 $2,000 2
Yearbook Advisor $2,000 $2,250 $2,500 1
High School Band Director (Fall) $2,116 $2,645 $3,306 1
High School Band Director (Spring) $1,190 $1,587 $1,984 1
High School Assistant Band Director $1,587 $2,116 $2,645 1
Middle School Band Director $1,058 $1,323 $1,587 1
Upper Elementary Band Director $1,058 $1,323 $1,587 2
High School Band Front $1,700 $1,900 $2,100 1
High School Drumline $1,300 $1,500 $1,800 1
High School Orchestra (Fall) $2,116 $2,645 $3,306 1
High School Orchestra (Spring) $1,190 $1,587 $1,984 1
Middle School Orchestra $1,058 $1,323 $1,587 1
Upper Elementary Orchestra $1,058 $1,323 $1,587 1
High School Chorus Director (Fall) $2,116 $2,645 $3,306 1
High School Chorus Director (Spring) $1,190 $1,587 $1,984 1
Middle School Chorus Director $1,058 $1,323 $1,587 1
Upper Elementary Chorus Director $1,058 $1,323 $1,587 1
High School Drama (Fall) $2,116 $2,645 $3,306 1
High School Drama (Spring) $1,190 $1,587 $1,984 1
CHS Step Team Sponsor $1,000 $1,000 $1,000 1
CHS International Club $500 $600 $725 1
CHS Multicultural Advisor $500 $600 $725 1
CHS Women’s History Month Coord. $500 $600 $725 1
CHS BACON Club Sponsor $750 $1,000 $1,500 1
CHS SECME Sponsor $500 $600 $725 1
- 175 -

Step 1 Step 2 Step 3 Positions
Volunteer Stipends for Extra Curricular Activities for 2018-2019Step 1 is the supplement for 0-3 years of experience in the designated position (or comparable position), Step 2 is the supplement for 4-7 years of experience in the designated position (or comparable position), and Step 3 is the supplement for 8 or above years of experience in the designated position (or comparable position). After twelve years of experience in a designated position, the supplement for step 3 is increased by 10%. At every four year interval above 12 years of experience an additional 10% of Step 3 is added to the supplement. Flat rate across steps do not earn percentage rate increases.
CHS Newsletter Sponsor $2,000 $2,000 $2,000 1
Middle School Intramural Director $1,000 $1,000 $1,000 1
Middle School Newspaper Sponsor $1,000 $1,000 $1,000 1
Middle School Nat’l Honor Society $400 $400 $400 2
Middle School Yearbook Sponsor $1,000 $1,000 $1,000 2
Middle School Knowledge Masters $1,250 $1,250 $1,250 2
Middle School SCA Sponsor $1,500 $1,500 $1,500 1
Middle School Girls Basketball (Fall) $500 $500 $500 1
Middle School Boys Basketball (Winter) $500 $500 $500 1
Middle School Football - Head Coach (Fall) $700 $700 $700 1
Middle School Wrestling (Winter) $500 $500 $500 1
Middle School Cheerleading (Fall) $500 $500 $500 1
Middle School Cheerleading (Winter) $500 $500 $500 1
Middle School Softball Head Coach (Spring) $500 $500 $500 1
Middle School Baseball Head Coach (Spring) $500 $500 $500 1
Middle School Lacrosse Head Coach (Spring) $500 $500 $500 1
Middle School Girls Volleyball (Fall) $500 $500 $500 1
Middle School Track (Spring) $500 $500 $500 1
Middle School Boys Football - Assistant Coach (Fall) $400 $400 $400 1
Middle School Girls Basketball - Assistant Coach (Fall) $250 $250 $250 1
Middle School Boys Basketball - Assistant Coach (Winter) $250 $250 $250 1
Middle School Cheerleading - Assistant Coach (Fall) $250 $250 $250 1
Middle School Cheerleading - Assistant Coach (Winter) $250 $250 $250 1
Middle School Softball - Assistant Coach (Spring) $250 $250 $250 1
Middle School Baseball - Assistant Coach (Spring) $250 $250 $250 1
Middle School Track - Assistant Coach (Spring) $250 $250 $250 1
Middle School Sports Facilitator (Fall) $350 $350 $350 1
Middle School Sports Facilitator (Winter) $350 $350 $350 1
Middle School Sports Facilitator (Spring) $350 $350 $350 1
Technology Support (2 – CHS, 1- all other schools) $1,400 $1,400 $1,400 10
Late Bus Monitor (Fall, Winter, Spring) $1,000 $1,000 $1,000 3
School Counselor Team Leader $750 $750 $750 1
Speech Pathologist Team Leader $750 $750 $750 1
- 176 -

GLOSSARY
- 177 -

GLOSSARY OF LINE ITEMS FOUND IN THE BUDGET
CITY FUNDS
STATE FUNDS
Average Daily Membership x Per Pupil Amount ‐ State Sales Tax x State’s Share Composite Index
TEXTBOOKS: Reimbursement funds are provided for free textbooks.
BASIC AID SOQ: Basic aid state funds are provided for basic operational costs which cover the cost per pupil, including providing for the number of instructional positions required by the Standards of Quality (SOQ). The minimum ratio is 51 professional personnel to 1,000 pupils. The funds cover the costs for the following educational programs: regular day school, gifted, vocational, special, library, and driver’s education. These funds also cover administration, school nurses, transportation, staff development, and fixed and other charges. Basic aid funds are distributed based upon the locality’s ability to pay the local share of the statewide per pupil amount established by JLARC. Listed below is the formula used to compute basic aid funds:
Average Daily Membership X Per Pupil Amount X - State Sales Tax X State Composite Index
SALES TAX: One and 1/8 cents of the five cents state sales tax is distributed to localities based on school age population. These funds are collected from businesses by local governments, remitted to the state, and distributed to schools by the state on a monthly basis.
((CCS Census count / Statewide total school age population) x Total state 1-1/8% sales tax estimate)) = Local Distribution
VOCATIONAL EDUCATION: Funds are distributed by the State Department of Education to support the state’s share of the number of vocational education teachers required by the Standards of Quality (SOQ). The state-approved program includes a variety of courses in business, health occupations, home economics, marketing, technology education, and trade-industrial education. The amount is allocated in accordance with the locality’s composite index.
((Per Pupil Amount x Unadjusted ADM) x (1 - Composite Index)) = State Share.
GIFTED AND TALENTED: Funds are distributed by the State Department of Education to the locality to support the state's share of one professional instructional position per 1,000 students. The amount is allocated in accordance with the locality's composite index.
((Per Pupil Amount x Adjusted ADM) x (1 - Composite Index)) = State Share.
SPECIAL EDUCATION: Special education students are identified for each category of exceptionality as defined by the State Department of Education. There are two types of special education payments- categorical and Standards of Quality. Additional SOQ funds are provided to support the state’s share of special education teachers required by the Standards of Quality.
((Per Pupil Amount x Unadjusted ADM) x (1 - Composite Index)) = State Share.
RETIREMENT - VRS RETIREMENT: The state provides funds to local school divisions to assist in the cost of the teacher retirement program. The retirement cost, shared between the state and local school divisions, is calculated based on the number of instructional positions required by the Standards of Quality for each school division and a statewide prevailing salary amount. These funds are paid directly to the division.
State and Local Shares: The state share of the calculated retirement cost is determined according to a locality's Composite Index of Local Ability-to-Pay. The local school divisions are responsible for all additional costs. Additional costs result from the retirement cost for those positions employed by the local school divisions in excess of the number of instructional positions required by the Standards of Quality and on the portion of local salaries higher than the funded SOQ salary allotments.
CITY APPROPRIATION: The City Appropriation represents the funds appropriated to CCS from the City's operating budget. The Standards of Quality require minimum funding to match state dollars and it is the City Appropriation that meets and exceeds this required match.
VRS - GROUP LIFE: This funding supports the state share of cost of employer contributions to the Virginia Retirement System (VRS) for Group Life benefits for funded SOQ instructional and professional support positions.
- 178 -

GLOSSARY OF LINE ITEMS FOUND IN THE BUDGETSOCIAL SECURITY: The state provides funds to local school division to assist in the cost of social security payments. The methodology used to calculate the social security cost and the state and local share of the calculated cost is identical to the teacher retirement payment.
((Per Pupil Amount x Adjusted ADM) x (1 - Composite Index)) = State Share.
REMEDIAL SUMMER SCHOOL: To assist pupils (Eligible Pupils) whose scores are in the bottom national quartile on Virginia State Assessment Program (VSAP) test, or who fail the literacy test prescribed by the Board of Education.
((Per Pupil Amount x Eligible Number of Students) x (1 - Composite Index)) = State Share
AT RISK: State payments for at-risk students are disbursed to CCS based on the estimated number of federal free lunch participants in CCS to support programs for students who are educationally at-risk. Funding is provided as a percentage add-on to Basic Aid to support the additional costs of educating at-risk students.
FUNDING: Funding is based on the percentage of students eligible for free lunch x Current year unadjusted ADM = Estimated number of students eligible for free lunch x (Add-on weight ranging from 1% to 12% based on free lunch eligibility rate) x Basic aid per pupil amount x (1 - Composite Index) x 100% = State Share.
K - 3 INITIATIVE: State funding is disbursed to school divisions as an incentive payment for reducing class sizes in grades Kindergarten through three below the required SOQ standard of a 24:1 pupil-teacher ratio. Payments are based on the incremental cost of providing the lower class sizes based on the lower of the statewide average per pupil cost of all divisions or the actual division per pupil cost. Schools with free lunch eligibility percentages of 30 percent and greater are eligible for funding. The required ratios range from 19:1 and may go as low as 14:1 based on the free lunch eligibility rate of the eligible school.
((K-3 funded fall membership for eligible schools x eligible per pupil amount) x (1 - Composite Index)) = State Share
FOSTER CARE CHILDREN: Foster care funding provides reimbursement to CCS for educating students in foster care that are not residents of Charlottesville. State funds are provided for prior year CCS costs for each pupil not a resident of Charlottesville if the student has been placed in foster care or other custodial care within the geographical boundaries of Charlottesville by a Virginia agency, whether state or local, which is authorized under the laws of the Commonwealth to place children. Funds also cover children who have been placed in an orphanage or children’s home which exercises legal guardianship rights, or who is a resident of Virginia and has been placed, not solely for school purposes, in a child-caring institution or group home. Funds are also provided to support handicapped children attending public school who have been placed in foster care or other such custodial care across jurisdictional lines.
FUNDING: Prior year total per pupil expenditure for operations for each division from Table 15 of the Superintendent’s Annual Report are divided by the number days of instruction in each division to yield a cost per day per division. Cost per day figure x number of days eligible foster care students were served by the school division as reported by the division = Standard Foster Care Reimbursement. Statewide weight for handicapping condition x Standard foster care cost per day = Total special education foster care cost per day. Total special education foster care cost per day x total number of student days reported in each handicapping condition = State cost for special education foster care. The sum of the cost for each handicapping condition = Special Education Foster Care Reimbursement.
CATEC PASS THROUGH FUNDING: CCS is fiscal agent for CATEC. Any funding received by CATEC from the state must pass through the accounts of CCS and then be transferred to CATEC. Currently, there are several such grants that fund vocational programs at CATEC.
HOMEBOUND: Homebound funding provides for the continuation of educational services for students who are temporarily confined to their homes for medical reasons. State funds reimburse school divisions for a portion of the hourly rate paid to teachers employed to provide homebound instruction to eligible children. These funds are based on prior year expenditure data. Divisions are reimbursed a percentage of hourly payments to teachers employed to provide homebound instruction to eligible children. The maximum hourly rate is established annually by the Department of Education, and the reimbursement percentage is based on the CCS composite index.
REGIONAL TUITION: Regional tuition reimbursement funding provides for students with low-incidence disabilities who can be served more appropriately and less expensively in a regional program than in more restrictive settings. For CCC, this is done through our participation in the Piedmont Regional Education Program, or PREP (see description of PREP below). All reimbursement is in lieu of the per pupil basic operation cost and other state aid otherwise available. Reimbursement is based on the state share (based on the state's composite index) of approved tuition costs for eligible students with disabilities at PREP.
ENGLISH AS A SECOND LANGUAGE: State funds are provided to support local school divisions providing the necessary educational services to children not having English as their primary language. The funding supports the salary and benefits cost of instructional positions at a standard of 17 positions per 1,000 ESL students.
((Seventeen teachers per 1,000 ESL students x average salary and fringe benefits) X (1 - Composite Index)) = State Share
- 179 -

GLOSSARY OF LINE ITEMS FOUND IN THE BUDGET
PREVENTION, INTERVENTION, AND REMEDIATION: Prevention, Intervention, and Remediation funding provides remedial services to children who need additional instruction. Funding is disbursed to local school divisions to support the state share of additional professional instructional positions ranging from a pupil teacher ratio of 10:1 to 18:1 based on the division-level failure rate on the SOL English and math tests for all students at risk of educational failure (the three-year average free lunch eligibility data is used as a proxy for at risk students).
((Per Pupil Amount x Unadjusted ADM) x (1 - Composite Index)) = State Share
TEXT-MEDIA: State law requires that students attending public schools receive free textbooks. State funding is provided on a per pupil basis based on the funded per pupil amount for textbooks.
((Per Pupil Amount x Adjusted ADM) x (1 - Composite Index)) = State Share
TEACHER MENTOR: Funds are allocated to provide grants to school divisions providing mentors for new teachers with zero years of teaching experience.
FUNDING: Provided as a per teacher amount, based on the proportional share of new teacher requests submitted by each school division to the total state funding.
SCHOOL NUTRITION (STATE): School divisions participating in the National School Lunch Program get cash subsidies and donated commodities from the U.S. Department of Agriculture for each meal they served. The lunches must meet Federal requirements, and they must offer free or reduced-price lunches to eligible children. This state reimbursement program is required by the federal National Nutrition School Lunch Program, the School Breakfast Program, and the After School Snack Program. State funds are required to meet maintenance of effort and match requirements for the federal funds received for the school lunch programs.
The rate of reimbursement for the current fiscal year is determined by the number of reimbursable lunches served during the previous year.
ADULT EDUCATION: All federal funds to the adult education program are competitive grants. These state grants include: General Adult Education, Race to GED, Regional Specialist. Regional Specialist supports a position in the Adult Education program, other funds support classroom activities.
HOSPITAL EDUCATION and BLUE RIDGE DETENTION: Education services are continued for students placed in state-operated facilities. State statute requires the state to provide appropriate education to all children in state hospitals, clinics, detention homes, and the Woodrow Wilson Rehabilitation Center. Education services are provided through contracted services with local school divisions. Funded positions are based on caseloads. A funding amount per position (to cover both personal and non-personal costs) is applied to each position to determine the total amount of funding for each division that provides education services in state operated programs.
VIRGINIA PRESCHOOL INITIATIVE: The Virginia Preschool Initiative provides funding for programs for unserved, at-risk four-year-old children, which include quality preschool education, health services, social services, parental involvement, and pupil transportation. Programs must provide full-day or half-day and, at least, school-year services. Educational services may be delivered by both public and private providers.
FUNDING: Projected number of four-year-olds x percent of students eligible for free lunch = (Estimated number of four-year-olds at-risk) - (number of four-year-olds served by Head Start programs) = 100 percent of at-risk four-year-olds. Estimated unserved at-risk four-year-olds x $6,000 (or $3,000 for half-day programs) x (1 - Composite Index [capped at 0.5000]) = State Share.
VPSA TECHNOLOGY: VPSA Technology program provides grant funding for school divisions to purchase additional technology to support the SOL Technology Initiative. Eligible schools include those reporting membership as of September 30th and are subject to state accreditation requirements, as well as regional centers including vocational centers, special education centers, alternative education centers, academic year Governor's Schools, and the School for the Deaf and Blind. There is currently an additional payment to school divisions of $26,000 for a period of three years for each school that is not fully accredited.
Number of eligible schools x $26,000 per school + $50,000 for the division. Requires a 20% match from CCS.
- 180 -
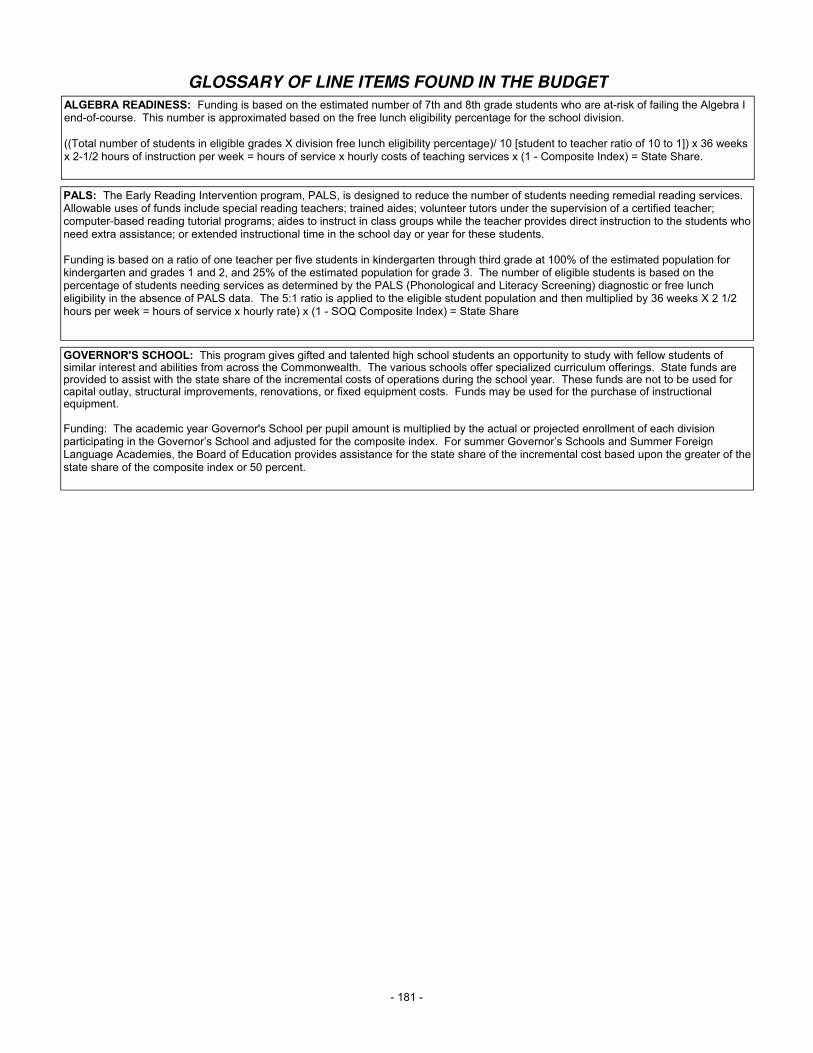
GLOSSARY OF LINE ITEMS FOUND IN THE BUDGET
ALGEBRA READINESS: Funding is based on the estimated number of 7th and 8th grade students who are at-risk of failing the Algebra I end-of-course. This number is approximated based on the free lunch eligibility percentage for the school division.
((Total number of students in eligible grades X division free lunch eligibility percentage)/ 10 [student to teacher ratio of 10 to 1]) x 36 weeks x 2-1/2 hours of instruction per week = hours of service x hourly costs of teaching services x (1 - Composite Index) = State Share.
PALS: The Early Reading Intervention program, PALS, is designed to reduce the number of students needing remedial reading services.Allowable uses of funds include special reading teachers; trained aides; volunteer tutors under the supervision of a certified teacher; computer-based reading tutorial programs; aides to instruct in class groups while the teacher provides direct instruction to the students who need extra assistance; or extended instructional time in the school day or year for these students.
Funding is based on a ratio of one teacher per five students in kindergarten through third grade at 100% of the estimated population for kindergarten and grades 1 and 2, and 25% of the estimated population for grade 3. The number of eligible students is based on the percentage of students needing services as determined by the PALS (Phonological and Literacy Screening) diagnostic or free luncheligibility in the absence of PALS data. The 5:1 ratio is applied to the eligible student population and then multiplied by 36 weeks X 2 1/2 hours per week = hours of service x hourly rate) x (1 - SOQ Composite Index) = State Share
GOVERNOR'S SCHOOL: This program gives gifted and talented high school students an opportunity to study with fellow students of similar interest and abilities from across the Commonwealth. The various schools offer specialized curriculum offerings. State funds are provided to assist with the state share of the incremental costs of operations during the school year. These funds are not to be used for capital outlay, structural improvements, renovations, or fixed equipment costs. Funds may be used for the purchase of instructional equipment.
Funding: The academic year Governor's School per pupil amount is multiplied by the actual or projected enrollment of each division participating in the Governor’s School and adjusted for the composite index. For summer Governor’s Schools and Summer Foreign Language Academies, the Board of Education provides assistance for the state share of the incremental cost based upon the greater of the state share of the composite index or 50 percent.
- 181 -

GLOSSARY OF LINE ITEMS FOUND IN THE BUDGETFEDERAL FUNDS
IMPACT AID - PUBLIC LAW 81-874: Geographic areas that are federally impacted with a variety of military operations are eligible for various levels of funding. These funds assist in offsetting local cost of education to pupils whose parents are associated with federally operated facilities.
SCHOOL NUTRITION: The National School Lunch Program (NSLP) is a federally assisted meal program operating in public and nonprofit private schools and residential child care institutions. It provides nutritionally balanced, low-cost or free lunches to children each school day. The program was established under the National School Lunch Act, signed by President Harry Truman in 1946. Under this program, the school divisions is reimbursed at a per meal rate determined by the NSLP.
ADULT EDUCATION: All federal funds to the adult education program are competitive grants and all support classrooms. These federal grants include: Adult Basic Education; English Literacy Civics Grants.
TITLE I- IMPROVING BASIC PROGRAMS: Title I funds are used to ensure that all children have a fair, equal, and significant opportunity to obtain a high quality education and reach, at a minimum, proficiency on challenging State academic achievement standards “ (in reading and mathematics) and state academic assessments (No Child Left Behind Act). The Title I, Part A program in CCS provides reading and/or math teachers to support identified schools in this effort. Each elementary school that participates writes its own plan to meet the needs of its students.
TITLE I, PART D - NEGLECTED OR DELINQUENT: Funds are used to administer a comprehensive assessment of reading and math skills to students enrolled in a Juvenile Detention Home Education Program and to determine the need for remediation.
TITLE II, PART A - TEACHER QUALITY: Funds support and provide course reimbursement to instructional staff, consultant fees,workshops for paraprofessional certifications, and various other instructional workshops.
TITLE II, PART D - TECHNOLOGY: Funds provide technical integration workshops and summer training sessions. Funding also provides stipends for Technology Integration Specialists.
TITLE III, PART A - LIMITED ENGLISH PROFICIENCY: Funding provides for services for limited English speakers in grades K–12 with the goal of having 45% of LEP students demonstrate progress in acquiring English language proficiency as demonstrated by the students movement from one English language proficiency level to the next.
TITLE VI-B SPECIAL EDUCATION: Title VI-B of the Individuals with Disabilities Education Act is a federal program that provides funding for districts to supplement the level of special education and related services provided to students with disabilities who are enrolled in special education programs. Funds are are used for salaries and benefits for professional and paraprofessional positions, supplemental pay for professionals doing additional special education related work, and autism consultation and training.
CARL PERKINS: The Carl D. Perkins Vocational and Technical Education Act of 1998, known as Perkins III, regulates career and technical education from the federal level. It also provides grants to states and local school divisions to help fund improvements in career and technical education programs, projects, and activities. School divisions receiving Perkins dollars may use these funds for such efforts as:providing students with experiences in and understanding of all aspects of an industry; developing, improving, or expanding the use of technology in vocational and technical education programs; providing professional development programs to teachers, counselors, and,administrators; initiating, improving, expanding, and modernizing quality vocational technical education programs; linking secondary vocational and technical education with postsecondary programs; and providing support services for students who are members of special populations who may need extra assistance to be successful in the programs in which they are enrolled.
SPECIAL EDUCATION - PRESCHOOL: Special Education - Preschool is a component to the Title VI-B Special Education grant and is based on the number of preschool students with disabilities. Funding is used to provide a portion of the salary for an additional preschool special education teacher. The remainder is used for instructional materials.
HOMELESS ASSISTANCE: The McKinney-Vento Homeless Assistance Act programs administered by HUD that award funds competitively require the development of a Continuum of Care system in the community where assistance is being sought. A continuum of care system is designed to address the critical problem of homelessness through a coordinated community-based process of identifying needs and building a system to address those needs. The approach is predicated on the understanding that homelessness is not caused merely by a lack of shelter, but involves a variety of underlying, unmet needs - physical, economic, and social. Transportation, extra instructional materials, CLASS scholarships, tutors.
- 182 -

GLOSSARY OF LINE ITEMS FOUND IN THE BUDGET
TUITION AND OTHER SOURCES
BUILDING RENT PERMITS: Fees are charged for the use of school buildings for functions by agencies and/or organizations outside the school system.
TUITION: Tuition is revenue from fees charged for exceptional education and day school programs and fees charged for out of district tuition.
PREP - CHARGES FOR SERVICES: Reimbursement funds paid to the school system by Piedmont Regional Education Program for the use of teachers and classrooms; includes salaries, benefits, rent, and other related costs.
SALE OF SURPLUS PROPERTY: Income from the sale of surplus property.
INDIRECT COST RECOVERY: Reimbursement for administrative costs not covered directly in grant expenditures.
TEXT- MEDIA INTEREST ON INVESTMENTS: Accumulated funds in the Textmedia account are invested in the Commonwealth of Virginia's Local Government Invetment Pool.
SCHOOL NUTRITION - MEAL CHARGES: The School Board sets rates that are charged to students for school lunches and breakfasts. Rates are set for full and reduced price meals. Students who qualify for free lunch under federal guidelines are not charged.
CLASS - TUITION FEES: The School Board sets rates that are charged to students for services in the Creative Learning After School and in the Summer (CLASS) program.
MLK PERFORMING ARTS CENTER - FEES: The School Board sets rates that are charged to those interested in renting the facility for private or public use.
ADULT EDUCATION: The School Board sets tuition rates that are charged to students for participation in the program.
BOYD TINSLEY: Mr. Boyd Tinsley, a former student of the Charlottesville City Schools, annualy donates $75,000 to the division to be used $25,000 each in three separate programs: academics, to support students who show strong potential for college readiness; tennis program; and the orchestra program.
DENTAL GRANT: Funds are used by the division to contract with local dentists who agree to see students needing emergency dental appointments and treatment for acute care.
REGIONAL AND MISCELLANEOUS GRANTS/OTHER: A variety of grants come and go from year to year and are represented as a whole in this line item. These grants are typically small (less than $25,000) and provided by local businesses or community members.
- 183 -

GLOSSARY OF LINE ITEMS FOUND IN THE BUDGET
EXPENDITURE CATEGORIES
PERSONNEL SERVICES: Expenditures including full time salaries, substitutes, supplements, and hourly wages.
Position titles for all groups of employees:
ADMINISTRATION Superintendent; Deputy Superintendent; Director
INSTRUCTIONAL STAFF Principal; Dean of Students; Assistant Principal; Teacher; Instructional Coordinator; Librarian
OTHER PROFESSIONAL Nurse; Counselor; Psychologist; Social Worker; Coordinator; Network Administrator; Athletic Director
TECHNICALInstructional Assistant; Intervention Specialist; Administrative Technician; Inventory Specialist; Data Systems Technician;
Athletic Equipment and Facilities Manager; Custodian Foreman
CLERICAL Secretary
CRAFTS, TRADES, LABOR Craftsman; Custodian; School Nutrition Worker
EMPLOYEE BENEFITS: These items represent the employer share of the benefit cost.
SOCIAL SECURITY: Currently 7.65% of all salaries, 6.2% for Social Security, 1.45% for Medicare.
Retirement – VRS: The school system participates in a defined benefit pension plan administered by the Virginia Retirement System (VRS). All full-time, salaried permanent employees must participate in the plan as a condition of employment. The school system currently pays both the employee and employer share of contributions. Effective July 1, 2010, there are two retirement plans in effect at VRS. Plan 1 are members hired into covered positions prior to 7/1/2010, Plan 2 are members hired on or after 7/1/2010. Under Plan 1, employees are eligible for unreduced retirement benefits at age 65 with 5 years of service (the higher the years of service, the higher the benefit). Under Plan 2, employees are eligible for unreduced retirement benefits at the normal retirement age for social security with 5 years of service, or when age and service added together equal 90 (e.g., age 60 with 30 years of service credit).
Health – Employer Contribution (FLEXCOMP): The school system’s health insurance plan is a cafeteria plan under Section 125 of the Internal Revenue Code of 1986, as amended. The Plan includes a dependent care assistance program under Section 129 of the Code (referred to as a “Dependent Care Reimbursement Account”) and a medical reimbursement program under Section 105 of the Code (referred to as a “Health Care Reimbursement Account”). The employer contribution under this plan is known as FLEXCOMP.
Retirement - at retirement, employees who have at least 10 years of consecutive years of service with CCS will receive an annual payment toward the cost of individual health insurance coverage under the CCS health insurance plan for 7 years from the date of retirement or until age 65. For employees who retire from a position working less than 7 hours/day, the payment will equal $2,000/year. For employees who retire from a position working 7 hours/day or more, the payment will equal $4,000/year. Employees who are not eligible or choose not to receive the standard benefit will receive $2,500 or $5,000 depending on hours worked per day.
Group Life Insurance: For employees covered under the VRS, the school system also provides for group life insurance with a natural death benefit equal to twice the employee’s contract salary rounded to the next thousand, and for accidental death, four times the employee’s contract salary rounded to the next thousand.
Unemployment: Payments are made by the school division under the Virginia Unemployment Compensation Act (Title 60.2, Code of Virginia) for terminated employees who qualify for benefits as determined by the Virginia Employment Commission. The school system is a “reimbursable employer” and reimburses the Commission dollar-for-dollar for it’s proportionate share of benefits paid. When a claim is filed, the employer for whom the individual last worked for thirty days is liable for the claim.
Worker’s Compensation: The school division participates in a worker’s compensation pool with other regional entities. Worker’s compensation benefits are paid through this pool and cover job related injuries subject to eligibility as determined by the Virginia Worker’s Compensation Commission, the state agency which administers the Virginia Worker’s Compensation Act.
- 184 -

GLOSSARY OF LINE ITEMS FOUND IN THE BUDGET
OPERATING - CONTRACTUAL OBLIGATIONS: These items represent contracted services of the School Board. Those listed below represent the most significant ongoing services that are contracted to outside entities.
Employee Sick Leave and Service Credit Benefit: Sick Leave - sick leave is paid out based on whether the employee is retiring or simply leaving employment with CCS. Retiring employees with at least 3 consecutive years of service with CCS are paid $10/day if less than 10 years of service, $20/day 10-19 years, $30/day 20-29 years, $40/day 30+ years. Employees otherwise leaving employment with 3 or more years of service with CCS are paid $10/day for a maximum of 25 days.
Service Credit - at retirement, employees with 5 or more consecutive years of service with CCS will receive $200/year for each year of service to a maximum of $6,000.
Employee Assistance: The school system has entered into a contract with IQ Health Systems to provide a confidential employee assistance program (EAP) that is free to employees and is equipped to deal with a wide range of employee problems including marital, family and interpersonal, psychological or situational difficulties related to job, alcohol and/or other drug abuse, legal, financial, and other adjustment issues. In addition, the EAP provides job and supervisory coaching services.
Facility Repair and Maintenance Contract - City: In 1997-1998, in an effort to reduce costs and gain efficiency by combining duplicative services and streamline operations, the school board entered into an agreement with the City of Charlottesville to provide maintenance and repair services to all school facilities.
Transportation Contract - City: In 1986-1987, in an effort to reduce costs and gain efficiency by combining duplicative services and streamline operations, the school system entered into an agreement with the City of Charlottesville to provide pupil transportation services.
Security Contract - City: The school system contracts with the City to provide Community Service Officers (CSO’s) and police officers to enhance security in the school division for students grades 7-12.
Comprehensive Services Act: Established in 1994, the Comprehensive Services Act for At-Risk Youth and Families (CSA) is a state law that consolidated funding for legally mandated services to certain troubled children and families and required the establishment of local interagency management and service delivery systems to plan and provide services. In Charlottesville and Albemarle County, the CSA program is overseen by the Commission on Children and Families. In Charlottesville, the cost of this program is split between the City (approximately 75%) and the Schools (25%).
WorkSource Enterprises: Since the mid-1970’s, Charlottesville City Schools has contracted with WorkSource Enterprises to provide work adjustment training, situational assessments and placement services for students with disabilities as determined in their IEP. In addition, WorkSource provides placement services to those students designated by the school division as being “at risk” and in need of support services. Employment Specialists conduct job development, work readiness skills training, job placement, employment counseling, and follow-up support as determined by the student’s individual placement program. These services are supplemented with grants and other funding sources and serves students age 16 and above in grades 9-12.
Vocational Ed Contract - CATEC: Opened in 1973 as a jointly owned and operated facility of Charlottesville City and Albemarle County to provide career and technical education to high school students and adults. Revenue support comes from state, local, and other sources with the largest percentage (70%) from Charlottesville and Albemarle County Schools; local contributions are based 50% on ADM of the two school divisions and 50% on the school divisions ADM at CATEC.
Piedmont Regional Education Program: The Piedmont Regional Education Program (PREP) was established in 1975 to provide special education and related services to school divisions in Planning District 10. Divisions collaberating in this program are: Charlottesville, Albemerle, Fluvanna, Greene, Louisa, Orange, Nelson, Culpeper, Madison, and Rappahannock County. PREP provides quality programs in a more cost effective manner than could be accomplished by individual school divisions by pooling resources and services regionally for students with low incidence disabilities. In addition to the Parent Resource Center (PRC), PREP offers the following services to the participating school divisions: Ivy Creek School (serving students with emotional disabilities); Special Education and Related Services; Program for Severe/Profound/ Multiple Disabilities & Autism; Program for Emotional Disabilities; Hearing Impaired Program.
Legal and Audit Services: The school system contracts each year for independent legal and audit services division wide. The school division is a component unit of the City of Charlottesville and annual financial reports are prepared in combination with the City. In addition to the annual audit of the overall operations of the school division, CCS annually audits checking accounts managed at each school building that contain funds outside of the governmental funds of CCS. These accounts include revenues for such items as building rental, sunshine funds, small local donations and fund raising.
- 185 -