fy results 03 presentation final for pdf format - swisscom · wireline business – improved...
TRANSCRIPT
1
2003 results, conference call24 March 2004
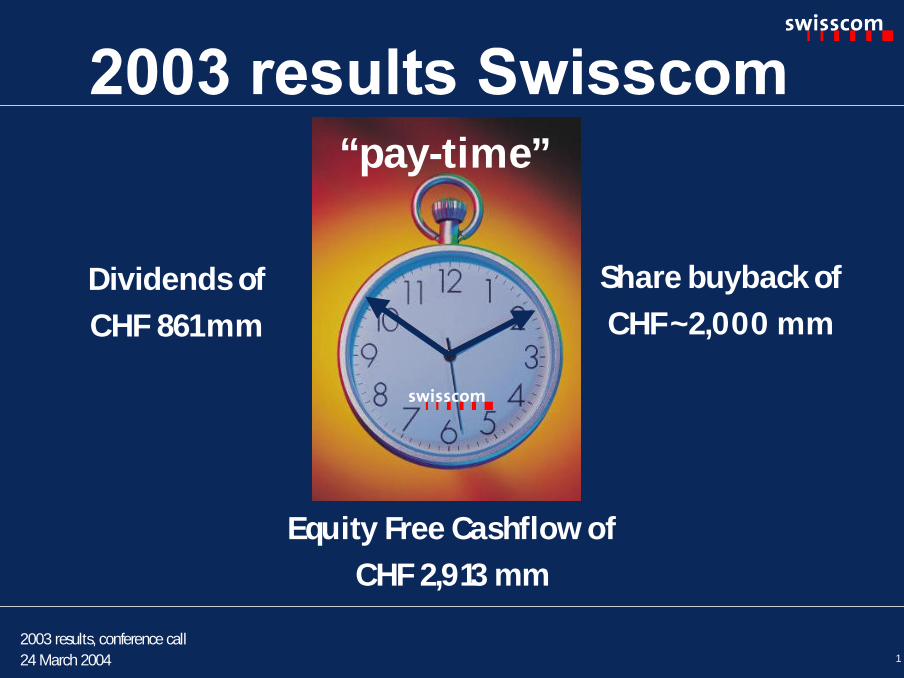
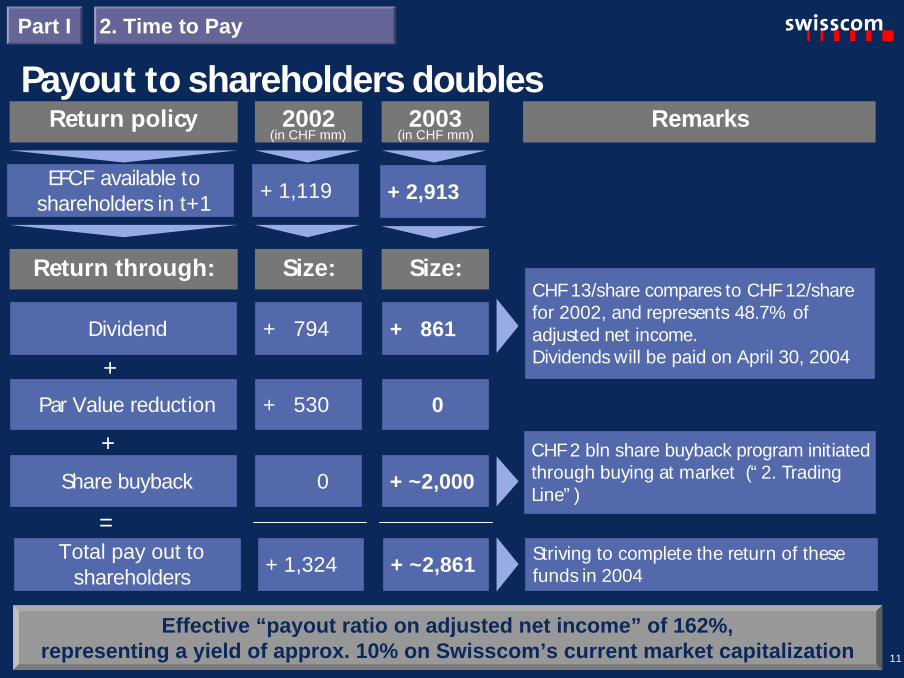
Dividends ofCHF 861 mm
Share buyback ofCHF~2,000 mm
Equity Free Cashflow ofCHF 2,913 mm
“pay-time”

2
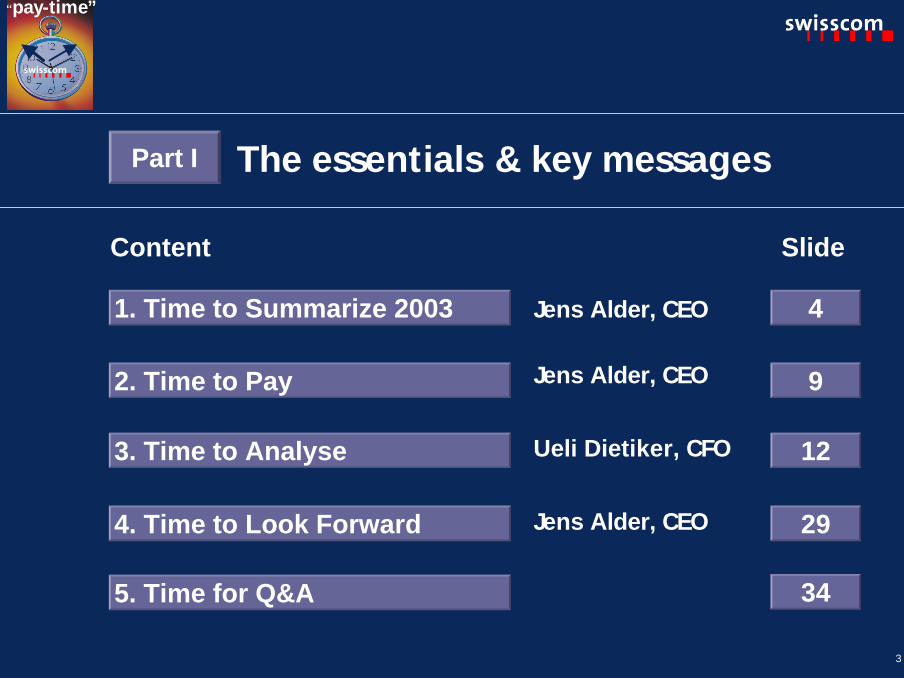
Time division for this conference call:
The essentials & key messages
Supporting background information
Part I[presented]
Part II[not presented]
“pay-time”
3
Jens Alder, CEO
Jens Alder, CEO
Ueli Dietiker, CFO
Jens Alder, CEO
1. Time to Summarize 2003
2. Time to Pay
3. Time to Analyse
5. Time for Q&A
4
9
12
Content Slide
34
4. Time to Look Forward 29
Part I The essentials & key messages
“pay-time”
4
2003 results, conference call24 March 2004
“ pay-time ““pay-time”
5
1. Time to Summarize 2003
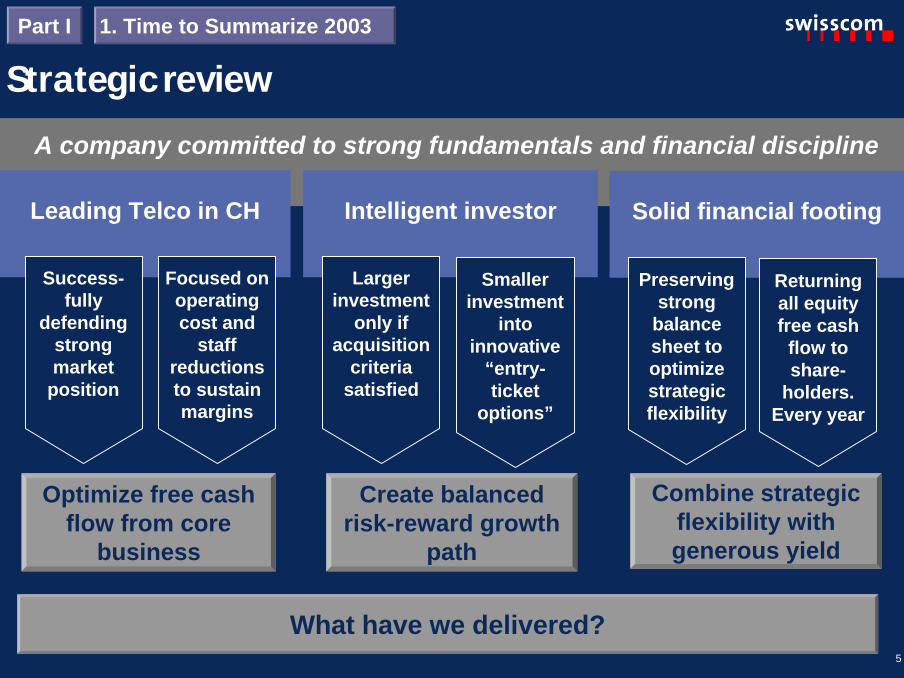
Strategic reviewA company committed to strong fundamentals and financial discipline
Leading Telco in CH Intelligent investor
Smallerinvestment
intoinnovative
“entry-ticket
options”
Largerinvestment
only ifacquisition
criteriasatisfied
Solid financial footing
Returningall equityfree cash
flow toshare-
holders.Every year
Optimize free cashflow from core
business
Create balancedrisk-reward growth
path
Combine strategicflexibility withgenerous yield
Success-fully
defendingstrongmarket
position
Focused onoperatingcost and
staffreductionsto sustainmargins
Preservingstrong
balancesheet tooptimizestrategicflexibility
Part I
What have we delivered?
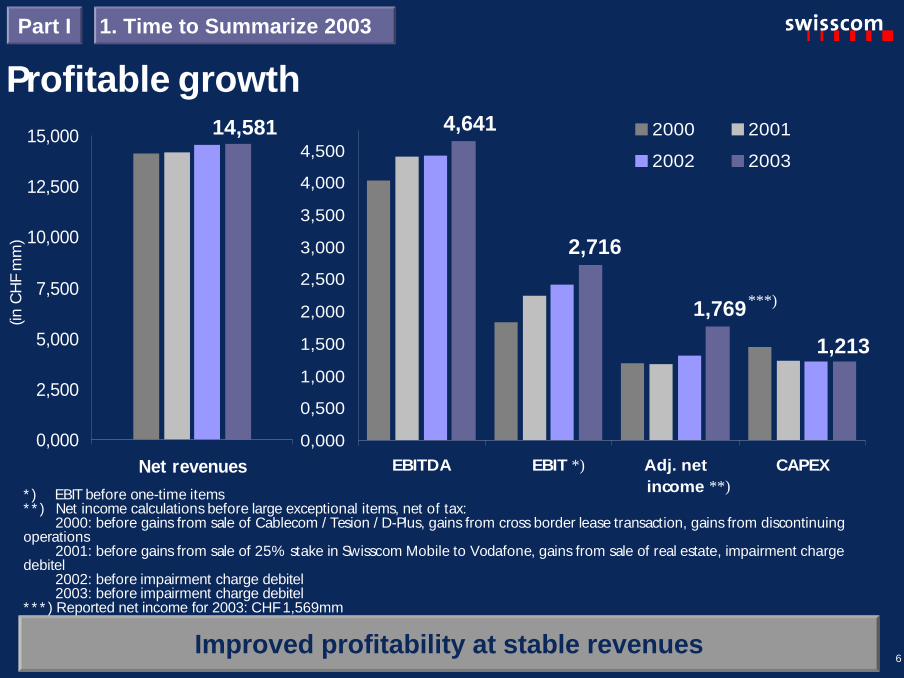
6
Profitable growth
Improved profitability at stable revenues
1. Time to Summarize 2003Part I
0,000
2,500
5,000
7,500
10,000
12,500
15,000
Net revenues
(inC
HF
mm
)
**)* ) EBIT before one-time items* * ) Net income calculations before large exceptional items, net of tax:
2000: before gains from sale of Cablecom / Tesion / D-Plus, gains from cross border lease transaction, gains from discontinuingoperations
2001: before gains from sale of 25% stake in Swisscom Mobile to Vodafone, gains from sale of real estate, impairment chargedebitel
2002: before impairment charge debitel2003: before impairment charge debitel
* * * ) Reported net income for 2003: CHF 1,569mm
0,000
0,500
1,000
1,500
2,000
2,500
3,000
3,500
4,000
4,500
EBITDA EBIT Adj. netincome
CAPEX
2000 2001
2002 2003
14,581 4,641
2,716
1,213
1,769
*)
***)
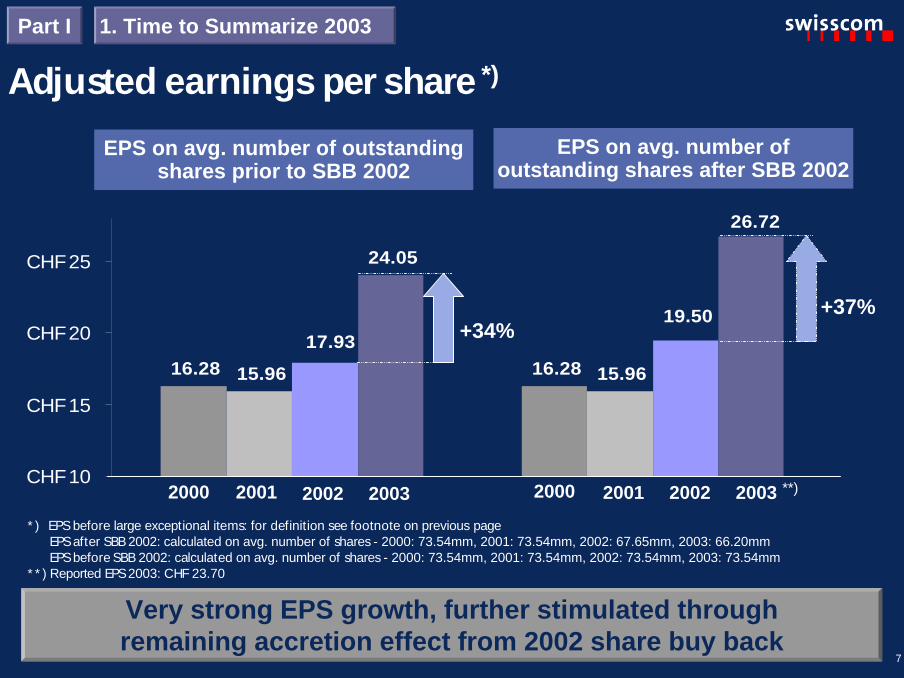
7
16.28 16.2815.96 15.96
24.05
19.5017.93
26.72
CHF 10
CHF 15
CHF 20
CHF 25
Adjusted earnings per share *)
* ) EPS before large exceptional items: for definition see footnote on previous pageEPS after SBB 2002: calculated on avg. number of shares - 2000: 73.54mm, 2001: 73.54mm, 2002: 67.65mm, 2003: 66.20mmEPS before SBB 2002: calculated on avg. number of shares - 2000: 73.54mm, 2001: 73.54mm, 2002: 73.54mm, 2003: 73.54mm
* * ) Reported EPS 2003: CHF 23.70
Very strong EPS growth, further stimulated throughremaining accretion effect from 2002 share buy back
+34%
EPS on avg. number ofoutstanding shares after SBB 2002
EPS on avg. number of outstandingshares prior to SBB 2002
+37%
2000 2001 2002 2003 2000 2001 2002 2003
1. Time to Summarize 2003Part I
**)
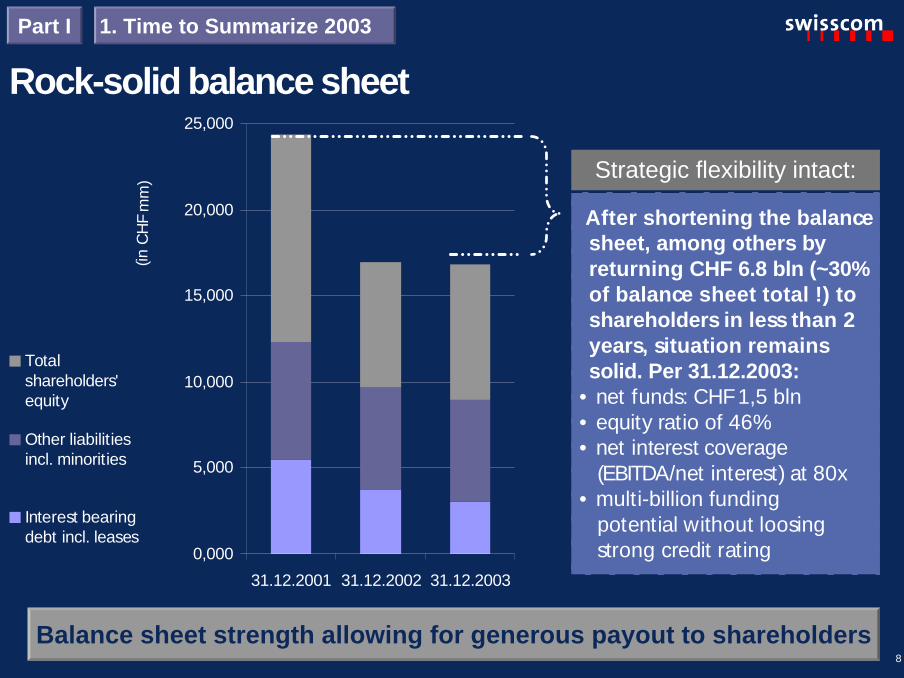
8
Balance sheet strength allowing for generous payout to shareholders
0,000
5,000
10,000
15,000
20,000
25,000
31.12.2001 31.12.2002 31.12.2003
Totalshareholders'equity
Other liabilitiesincl. minorities
Interest bearingdebt incl. leases
( inC
HF
mm
)
After shortening the balancesheet, among others byreturning CHF 6.8 bln (~30%of balance sheet total !) toshareholders in less than 2years, situation remainssolid. Per 31.12.2003:
• net funds: CHF 1,5 bln• equity ratio of 46%• net interest coverage
(EBITDA/net interest) at 80x• multi-billion funding
potential without loosingstrong credit rating
Strategic flexibility intact:
Rock-solid balance sheet1. Time to Summarize 2003Part I
9
2003 results, conference call24 March 2004
“pay-time”
10
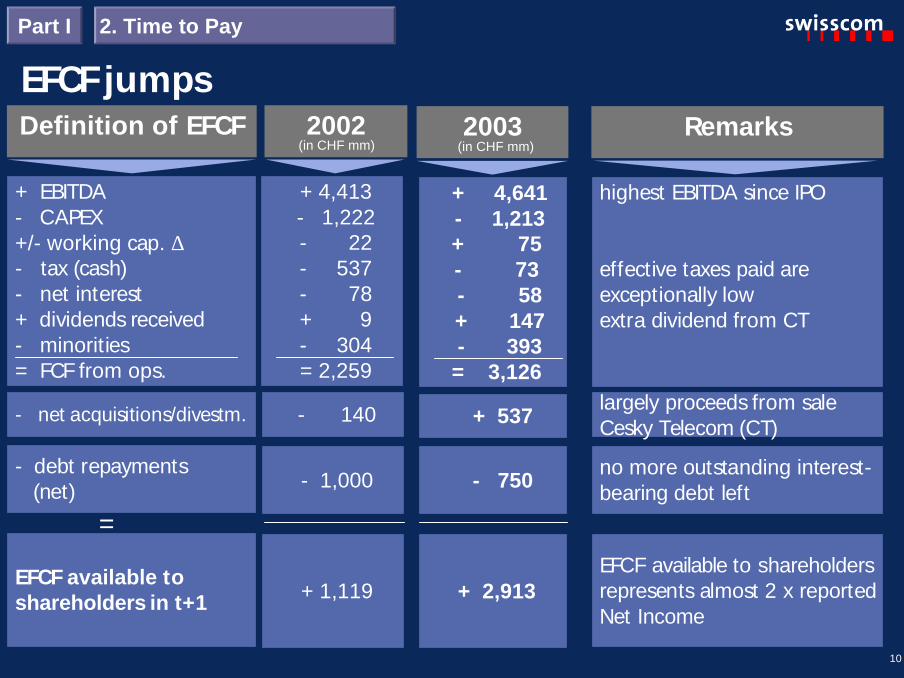
EFCF jumps2. Time to PayPart I
- net acquisitions/divestm.
- debt repayments(net)
EFCF available toshareholders in t+1
+ EBITDA- CAPEX+/- working cap. ∆- tax (cash)- net interest+ dividends received- minorities= FCF from ops.
Definition of EFCF
=
largely proceeds from saleCesky Telecom (CT)
no more outstanding interest-bearing debt left
EFCF available to shareholdersrepresents almost 2 x reportedNet Income
highest EBITDA since IPO
effective taxes paid areexceptionally lowextra dividend from CT
Remarks2003
+ 537
- 750
+ 2,913
+ 4,641- 1,213+ 75- 73- 58+ 147- 393
= 3,126
- 140
- 1,000
+ 1,119
+ 4,413- 1,222- 22- 537- 78+ 9- 304= 2,259
2002(in CHF mm) (in CHF mm)
11
EFCF available toshareholders in t+1 + 1,119
Return policy 2002 Remarks
Return through: Size:
Dividend + 794
Par Value reduction + 530
Total pay out toshareholders + 1,324
++
=
CHF 2 bln share buyback program initiatedthrough buying at market (“ 2. TradingLine” )
CHF 13/share compares to CHF 12/sharefor 2002, and represents 48.7% ofadjusted net income.Dividends will be paid on April 30, 2004
Striving to complete the return of thesefunds in 2004
Effective “payout ratio on adjusted net income” of 162%,representing a yield of approx. 10% on Swisscom’s current market capitalization
+ 2,913
2003
Size:
+ 861
0
+ ~2,861
Share buyback 0 + ~2,000
+
Payout to shareholders doubles(in CHF mm) (in CHF mm)
2. Time to PayPart I
12
2003 results, conference call24 March 2004
“pay-time”
13
Part I
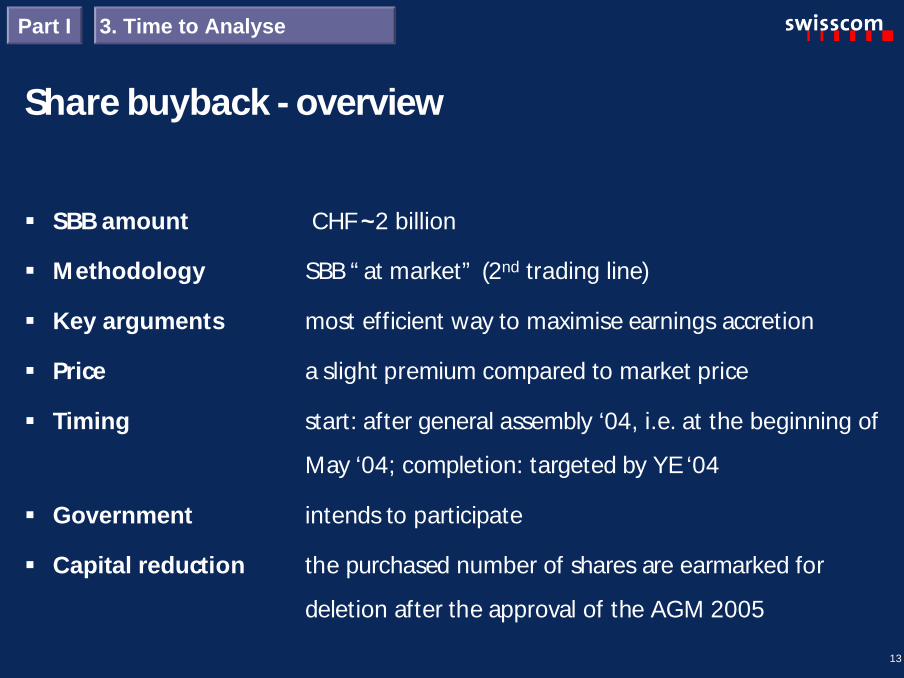
Share buyback - overview
§ SBB amount CHF~2 billion
§ Methodology SBB “ at market” (2nd trading line)
§ Key arguments most efficient way to maximise earnings accretion
§ Price a slight premium compared to market price
§ Timing start: after general assembly ‘04, i.e. at the beginning of
May ‘04; completion: targeted by YE ‘04
§ Government intends to participate
§ Capital reduction the purchased number of shares are earmarked for
deletion after the approval of the AGM 2005
3. Time to Analyse

14
Share buyback - taxes
Part I 3. Time to Analyse
Withholdingtax
Swissprivate investor
Incometax
§ 35% of purchaseprice minus nominalvalue of CHF 1/share
§ fully reclaimable
Swissinstitutional investor
Foreigninvestor
§ 35% of purchaseprice minus nominalvalue of CHF 1/share
§ fully reclaimable
§ 35% of purchaseprice minus nominalvalue of CHF 1/share
§ bilateral tax treatydetermines what canbe reclaimed
§ on purchase priceminus nominal valueof CHF 1/share
§ on purchase priceminus investor’sbook value
§ depending on localtax law
15
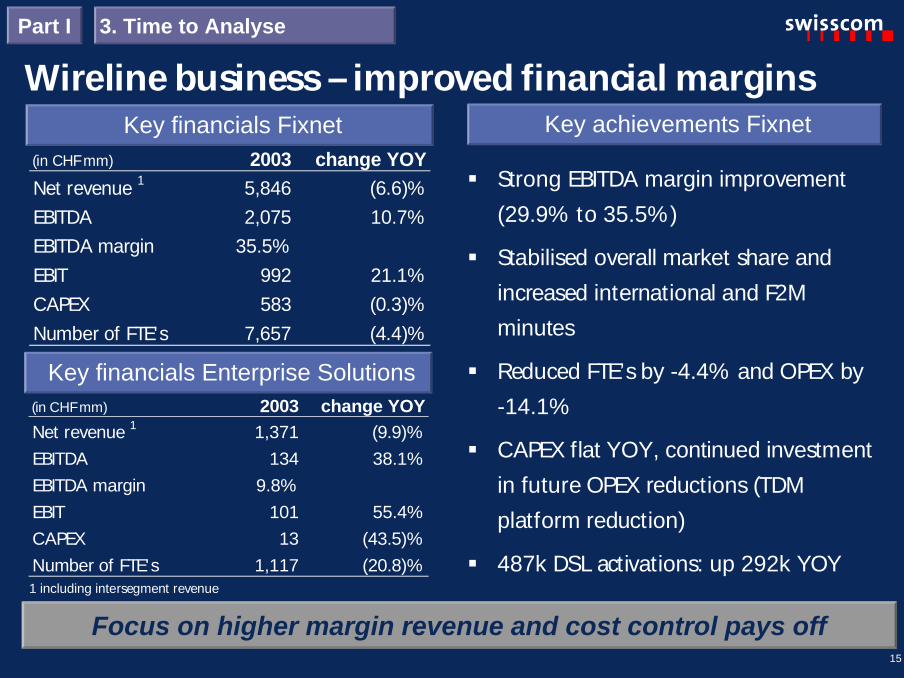
Wireline business – improved financial marginsKey achievements Fixnet
Focus on higher margin revenue and cost control pays off
§ Strong EBITDA margin improvement(29.9% to 35.5%)
§ Stabilised overall market share andincreased international and F2Mminutes
§ Reduced FTE’s by -4.4% and OPEX by-14.1%
§ CAPEX flat YOY, continued investmentin future OPEX reductions (TDMplatform reduction)
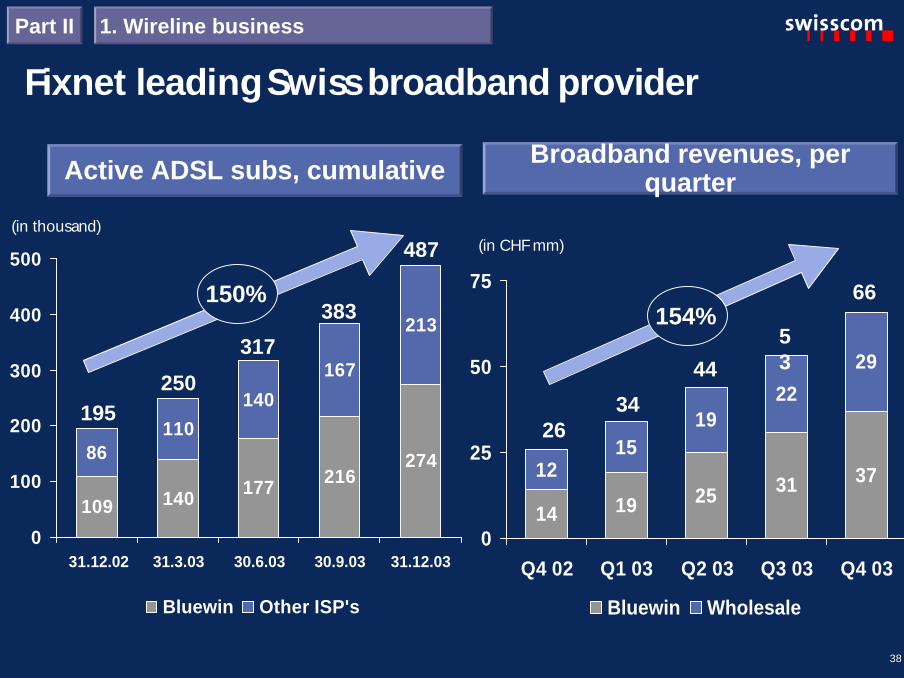
§ 487k DSL activations: up 292k YOY
Key financials Fixnet
Key financials Enterprise Solutions
(in CHF mm) 2003 change YOYNet revenue 1 5,846 (6.6)%EBITDA 2,075 10.7%EBITDA margin 35.5%EBIT 992 21.1%CAPEX 583 (0.3)%Number of FTE's 7,657 (4.4)%
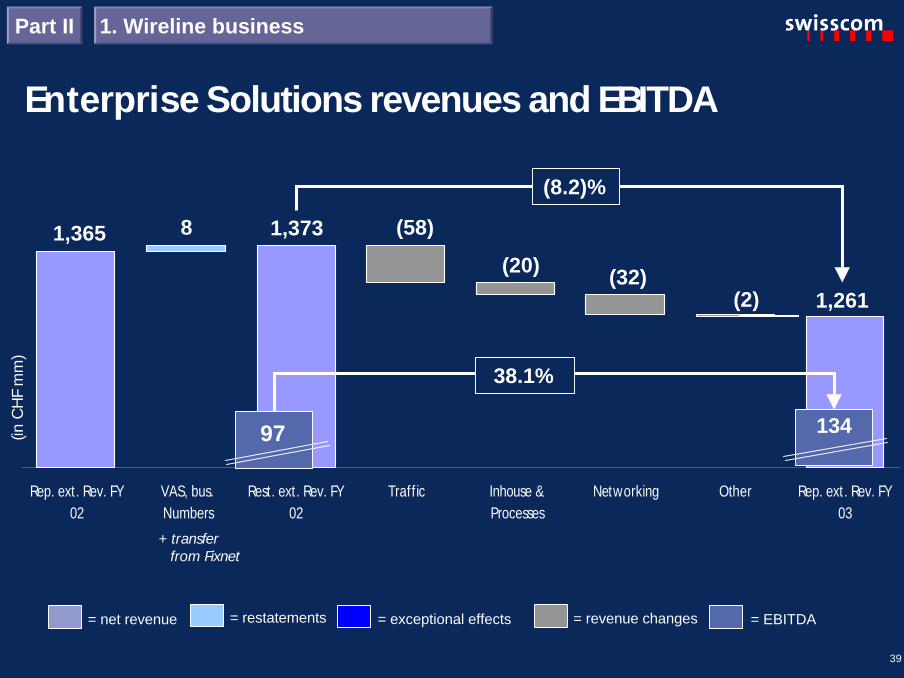
(in CHF mm) 2003 change YOYNet revenue 1 1,371 (9.9)%EBITDA 134 38.1%EBITDA margin 9.8%EBIT 101 55.4%CAPEX 13 (43.5)%Number of FTE's 1,117 (20.8)%1 including intersegment revenue
3. Time to AnalysePart I
16
a) Access1) Shift from narrow to broadband2) 55k lines lost due to mobile
substitution and 25k due tosale of TFL (Liechtenstein)
3) Proportion of access revenuesfrom PSTN and ISDN shiftingswiftly: 93% in ‘02 vs. 87% in‘03
4) ADSL - both wholesale andretail growing rapidly
5) Bluewin still by far the largestISP and with a market share inADSL access of approx. 57%
6) Access revenues growingpartially at expense of trafficrevenues
Access revenues:CHF 1,715mm (+8.5% YOY)
+8.5%Total
-16.7%-6.6%-10.8%Narrowband Bluewin
+190%+15%+152%ADSL Bluewin
+155%+3.5%+148%ADSL Wholesale
+1.2%-0.2%+1.4%ISDN
+0.3%+2.8%-2.4%PSTN
RevenuesWeightedavg. price
Lines
3. Time to AnalysePart I
17
50
75
100
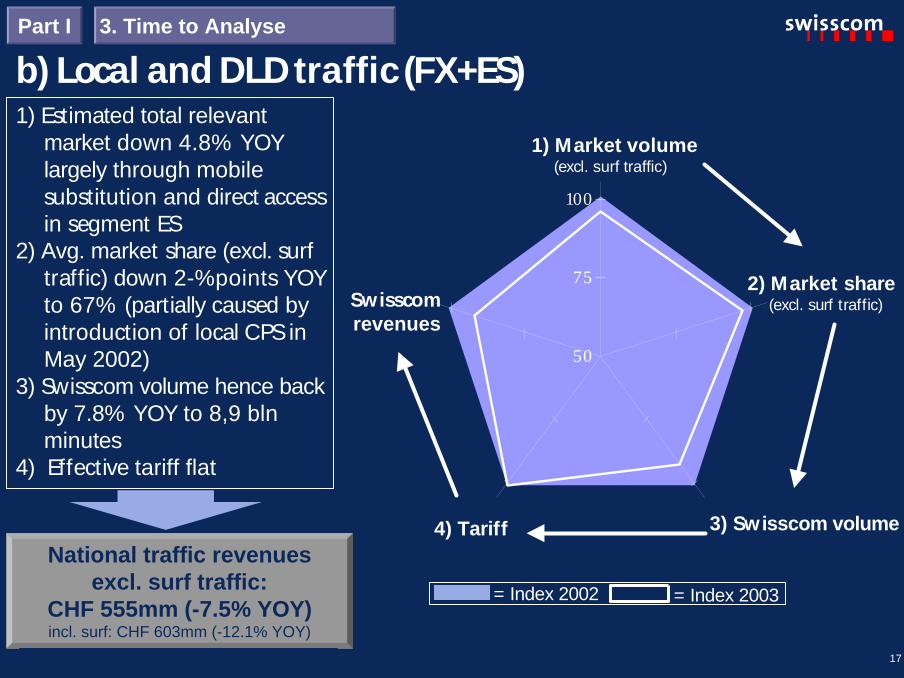
b) Local and DLD traffic (FX+ES)1) Estimated total relevant
market down 4.8% YOYlargely through mobilesubstitution and direct accessin segment ES
2) Avg. market share (excl. surftraffic) down 2-%points YOYto 67% (partially caused byintroduction of local CPS inMay 2002)
3) Swisscom volume hence backby 7.8% YOY to 8,9 blnminutes
4) Effective tariff flat
National traffic revenuesexcl. surf traffic:
CHF 555mm (-7.5% YOY)incl. surf: CHF 603mm (-12.1% YOY)
3. Time to AnalysePart I
Swisscomrevenues
3) Swisscom volume
2) Market share(excl. surf traffic)
1) Market volume(excl. surf traffic)
4) Tariff
= Index 2002 = Index 2003
18
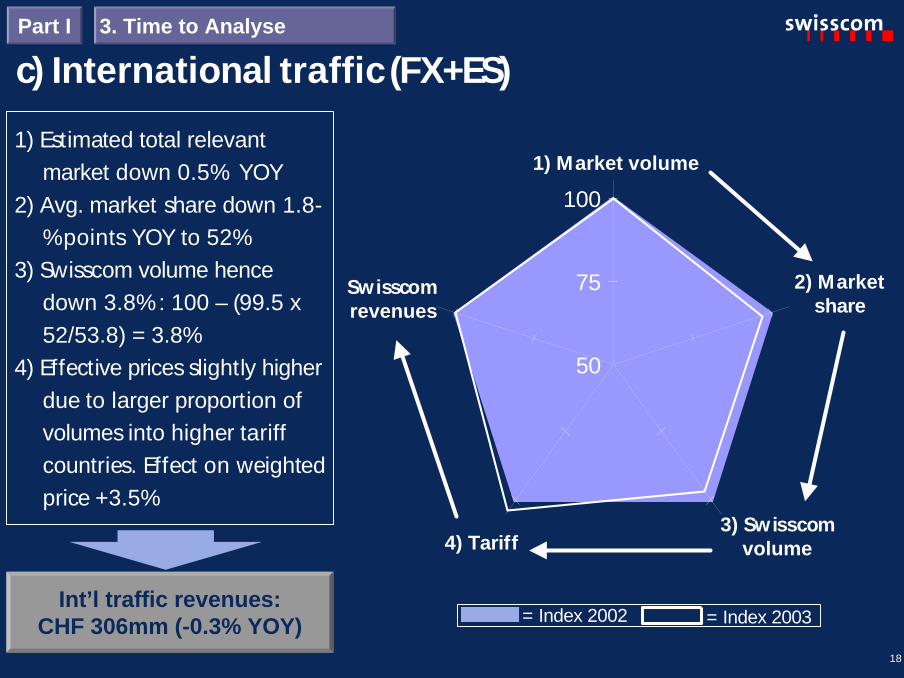
c) International traffic (FX+ES)1) Estimated total relevant
market down 0.5% YOY2) Avg. market share down 1.8-
%points YOY to 52%3) Swisscom volume hence
down 3.8%: 100 – (99.5 x52/53.8) = 3.8%
4) Effective prices slightly higherdue to larger proportion ofvolumes into higher tariffcountries. Effect on weightedprice +3.5%
Int’l traffic revenues:CHF 306mm (-0.3% YOY)
50
75
100
3. Time to AnalysePart I
Swisscomrevenues
3) Swisscomvolume
2) Marketshare
1) Market volume
4) Tariff
= Index 2002 = Index 2003

19
d) F2M traffic (FX+ES)1) Total market up 1% YOY
through higher penetrationMobile
2) Avg. market share up 0.5-%points YOY to 64%
3) Swisscom volume hence up1.5%
4) Avg. tariff 2% lower
F2M traffic revenues:CHF 600mm (-0.7% YOY)
50
75
100
3. Time to AnalysePart I
Swisscomrevenues
3) Swisscomvolume
2) Marketshare
1) Market volume
4) Tariff
= Index 2002 = Index 2003
20
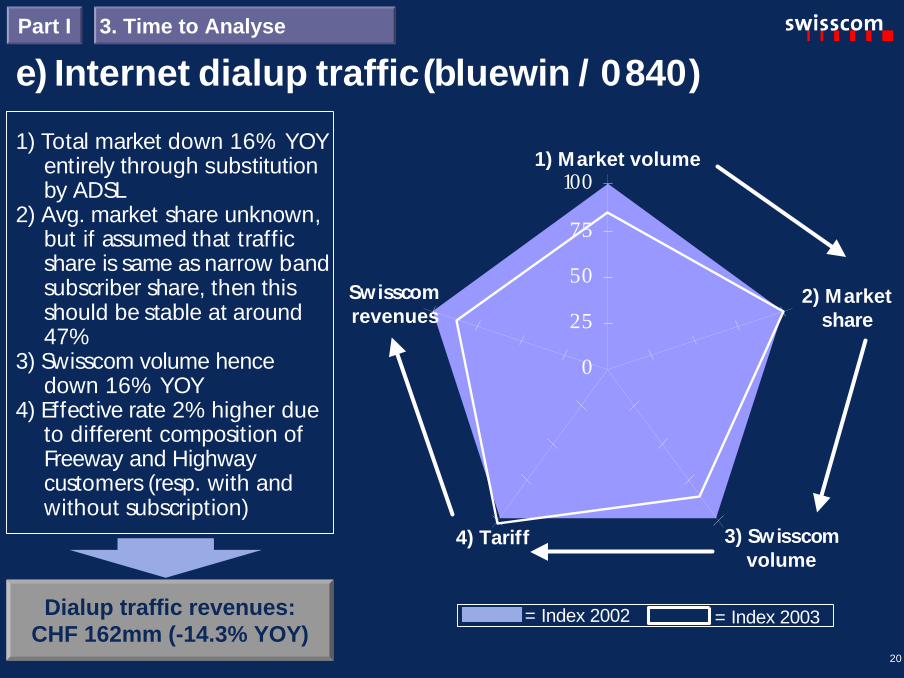
e) Internet dialup traffic (bluewin / 0840)1) Total market down 16% YOY
entirely through substitutionby ADSL
2) Avg. market share unknown,but if assumed that trafficshare is same as narrow bandsubscriber share, then thisshould be stable at around47%
3) Swisscom volume hencedown 16% YOY
4) Effective rate 2% higher dueto different composition ofFreeway and Highwaycustomers (resp. with andwithout subscription)
Dialup traffic revenues:CHF 162mm (-14.3% YOY)
0
25
50
75
100
3. Time to AnalysePart I
Swisscomrevenues
3) Swisscomvolume
2) Marketshare
1) Market volume
4) Tariff
= Index 2002 = Index 2003
21
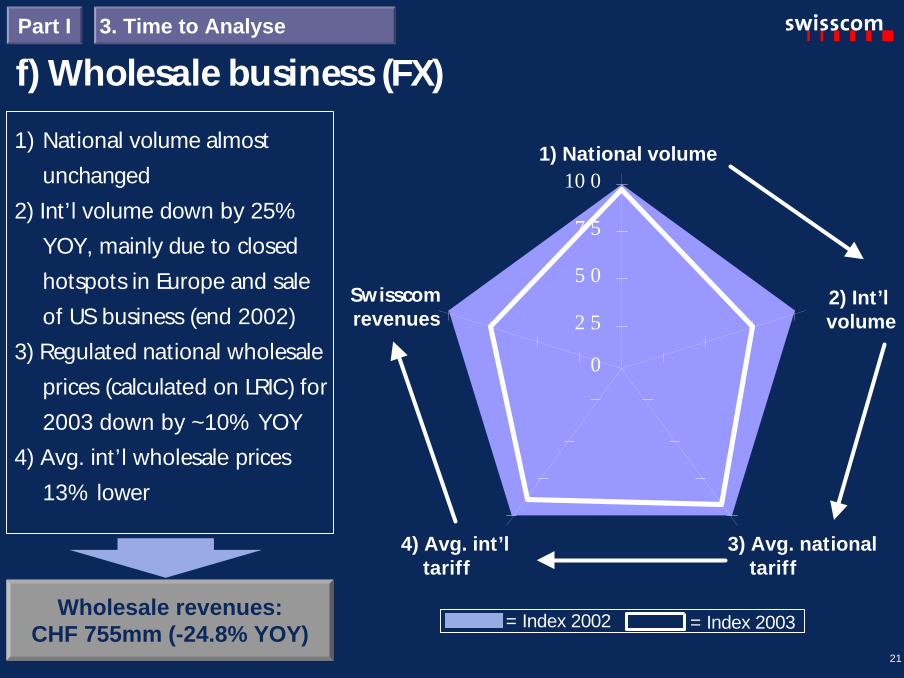
f) Wholesale business (FX)3. Time to AnalysePart I
1) National volume almostunchanged
2) Int’l volume down by 25%YOY, mainly due to closedhotspots in Europe and saleof US business (end 2002)
3) Regulated national wholesaleprices (calculated on LRIC) for2003 down by ~10% YOY
4) Avg. int’l wholesale prices13% lower
Wholesale revenues:CHF 755mm (-24.8% YOY)
Swisscomrevenues
3) Avg. nationaltariff
2) Int’lvolume
1) National volume
4) Avg. int’ltariff
0
2 5
5 0
7 5
10 0
= Index 2002 = Index 2003
22
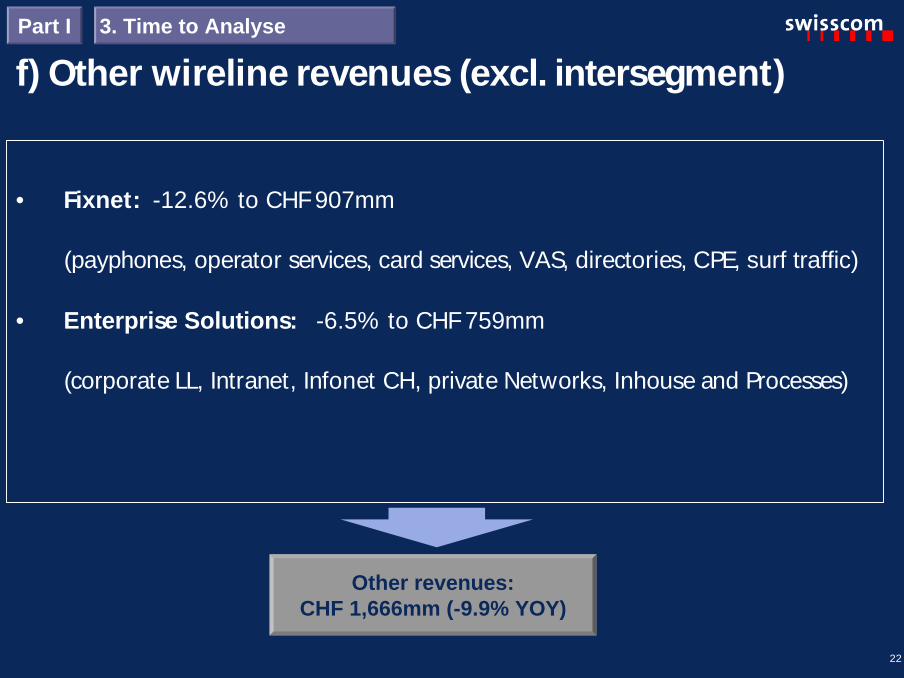
f) Other wireline revenues (excl. intersegment)
• Fixnet: -12.6% to CHF 907mm
(payphones, operator services, card services, VAS, directories, CPE, surf traffic)
• Enterprise Solutions: -6.5% to CHF 759mm
(corporate LL, Intranet, Infonet CH, private Networks, Inhouse and Processes)
Other revenues:CHF 1,666mm (-9.9% YOY)
3. Time to AnalysePart I
23
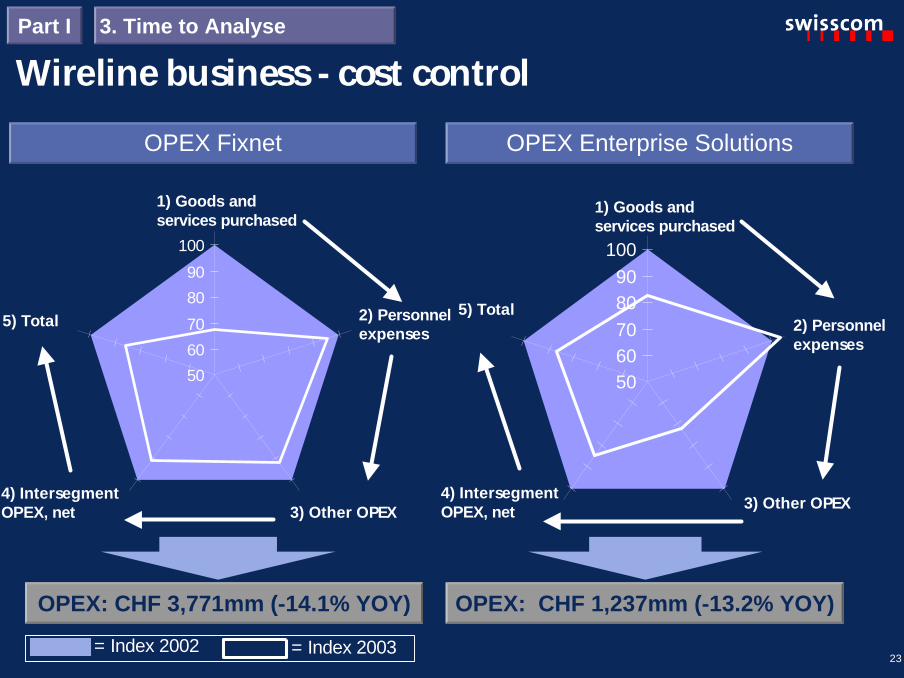
Wireline business - cost control
OPEX: CHF 3,771mm (-14.1% YOY)
OPEX Fixnet
50
60
70
80
90
100
1) Goods andservices purchased
2) Personnelexpenses
3) Other OPEX4) IntersegmentOPEX, net
5) Total
OPEX: CHF 1,237mm (-13.2% YOY)
OPEX Enterprise Solutions
5060708090
100
1) Goods andservices purchased
2) Personnelexpenses
3) Other OPEX4) IntersegmentOPEX, net
5) Total
3. Time to AnalysePart I
= Index 2002 = Index 2003
24
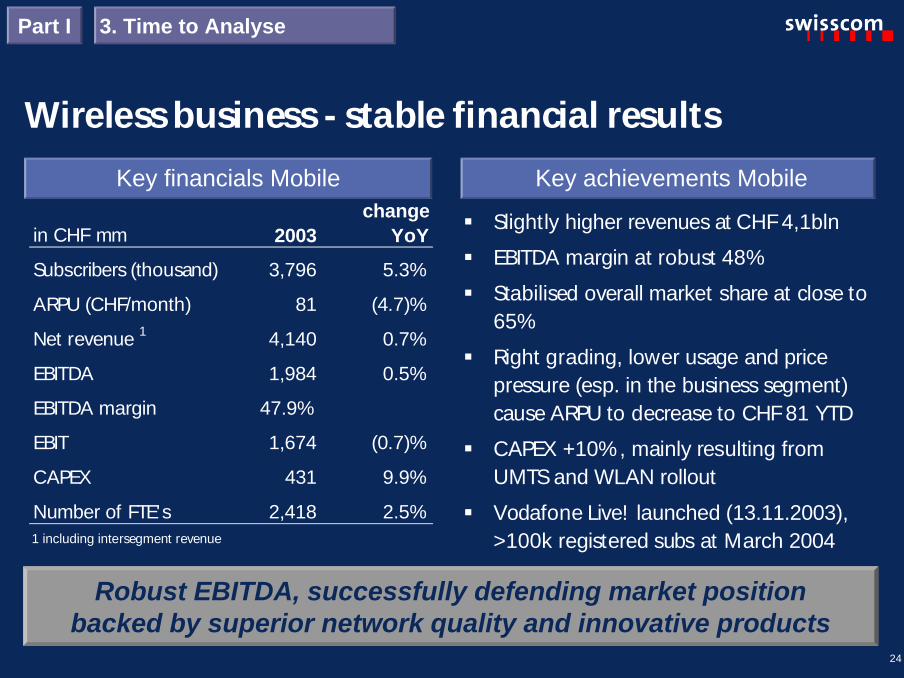
Wireless business - stable financial resultsKey achievements Mobile
Robust EBITDA, successfully defending market positionbacked by superior network quality and innovative products
§ Slightly higher revenues at CHF 4,1bln
§ EBITDA margin at robust 48%
§ Stabilised overall market share at close to65%
§ Right grading, lower usage and pricepressure (esp. in the business segment)cause ARPU to decrease to CHF 81 YTD
§ CAPEX +10%, mainly resulting fromUMTS and WLAN rollout
§ Vodafone Live! launched (13.11.2003),>100k registered subs at March 2004
Key financials Mobile
1 including intersegment revenue
in CHF mm 2003change
YoY
Subscribers (thousand) 3,796 5.3%
ARPU (CHF/month) 81 (4.7)%
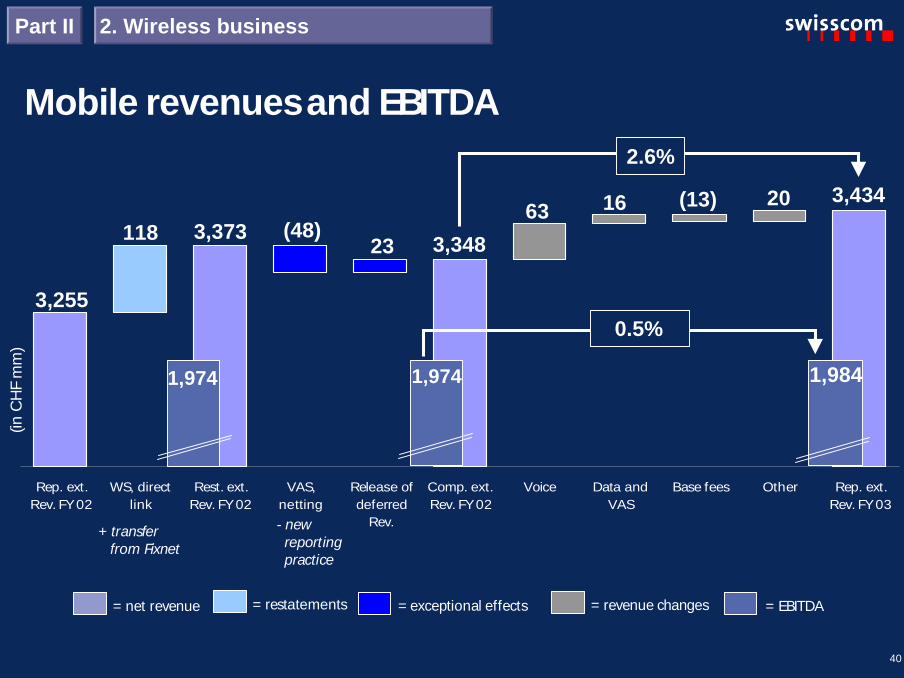
Net revenue 1 4,140 0.7%
EBITDA 1,984 0.5%
EBITDA margin 47.9%
EBIT 1,674 (0.7)%
CAPEX 431 9.9%
Number of FTE's 2,418 2.5%
3. Time to AnalysePart I
25
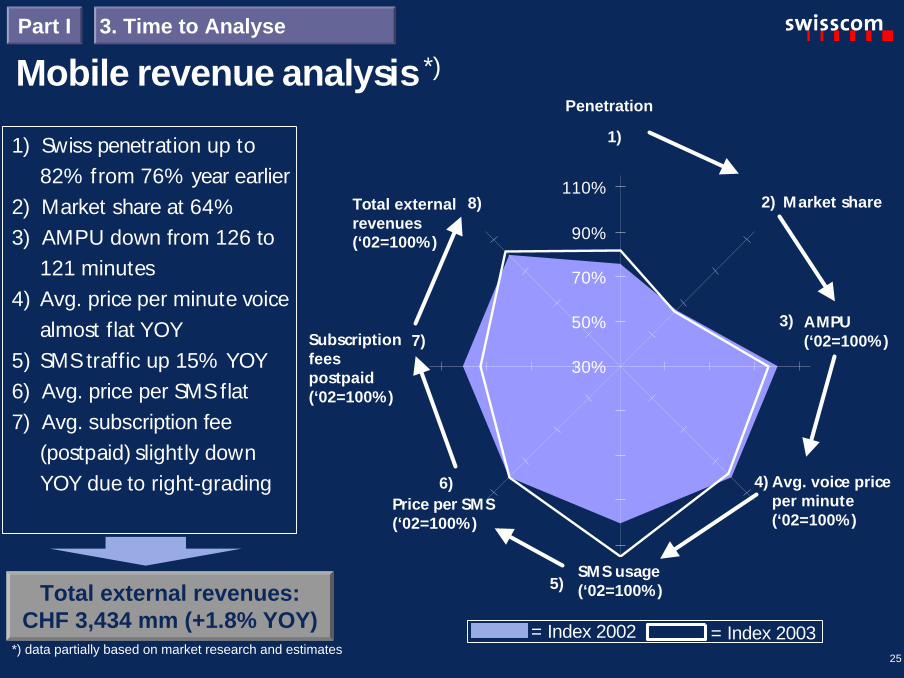
1) Swiss penetration up to82% from 76% year earlier
2) Market share at 64%3) AMPU down from 126 to
121 minutes4) Avg. price per minute voice
almost flat YOY5) SMS traffic up 15% YOY6) Avg. price per SMS flat7) Avg. subscription fee
(postpaid) slightly downYOY due to right-grading
Mobile revenue analysis *)
Total external revenues:CHF 3,434 mm (+1.8% YOY)
3. Time to AnalysePart I
30%
50%
70%
90%
110%
Subscriptionfeespostpaid(‘02=100%)
1)
6) 4)
3)
2)
5)
7)
Total externalrevenues(‘02=100%)
Price per SMS(‘02=100%)
8)
Penetration
Market share
AMPU(‘02=100%)
SMS usage(‘02=100%)
Avg. voice priceper minute(‘02=100%)
= Index 2002 = Index 2003*) data partially based on market research and estimates
26
3. Time to AnalysePart I
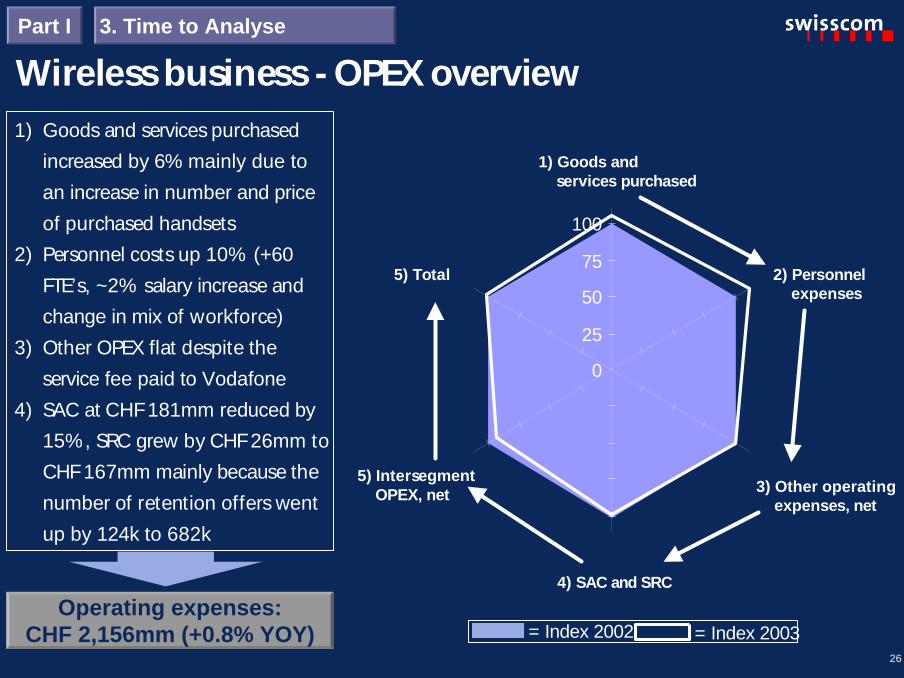
1) Goods and services purchasedincreased by 6% mainly due toan increase in number and priceof purchased handsets
2) Personnel costs up 10% (+60FTE’s, ~2% salary increase andchange in mix of workforce)
3) Other OPEX flat despite theservice fee paid to Vodafone
4) SAC at CHF 181mm reduced by15%, SRC grew by CHF 26mm toCHF 167mm mainly because thenumber of retention offers wentup by 124k to 682k
Operating expenses:CHF 2,156mm (+0.8% YOY)
Wireless business - OPEX overview
0
25
50
75
100
1) Goods andservices purchased
2) Personnelexpenses
3) Other operatingexpenses, net
5) IntersegmentOPEX, net
5) Total
4) SAC and SRC
= Index 2002 = Index 2003
27
Other businesses§ debitel - revenues up 10.8% YOY to CHF 4,555mm (+6.5% in EUR), backed by 571k
new subscribers (mainly postpaid) in Germany. EBITDA margin of 3.0%
§ Swisscom Systems - restructuring program progressing as planned. 510 FTE’s reducedin 2003 to 1,057 FTE’s per YE
§ Swisscom IT Services - restructuring steps led to extra costs and a lower operatingresult in 2003. Planned reduction of workforce by YE 2004: -300 FTE’s
§ Billag - revenues 2003 flat YOY, doubling in 2004 thanks to acquisition of T-Systems’Card Services as per YE 2003
§ SIMAG (real estate company) - restructuring announced, leading to 14% reduction ofworkforce by YE 2004 (-55 FTE’s). Related charges taken in 2003
§ Swisscom Eurospot - secured prime position in Europe’s P-WLAN business within1 year:n 2,000 contracted hotspots in 10 countries, of which 750 operational (March 2004)n operational hotspots are equipped with over 9,000 access pointsn additional coverage through roaming (~1,100 locations)
3. Time to AnalysePart I
28
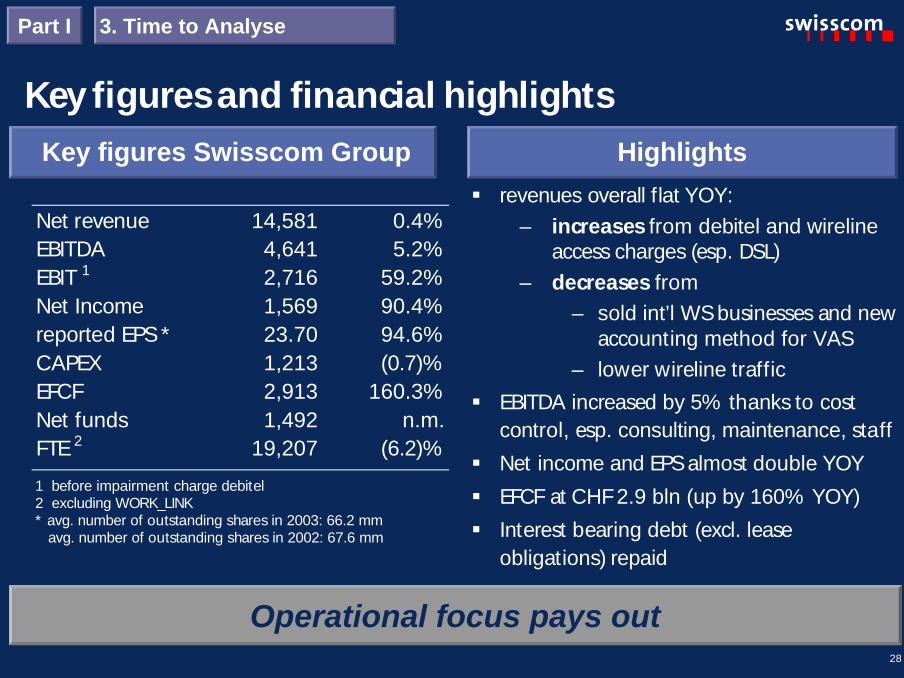
Key figures and financial highlightsKey figures Swisscom Group Highlights
Net revenue 14,581 0.4%EBITDA 4,641 5.2%EBIT 1 2,716 59.2%Net Income 1,569 90.4%reported EPS * 23.70 94.6%CAPEX 1,213 (0.7)%EFCF 2,913 160.3%Net funds 1,492 n.m.FTE2 19,207 (6.2)%
1 before impairment charge debitel2 excluding WORK_LINK* avg. number of outstanding shares in 2003: 66.2 mm
avg. number of outstanding shares in 2002: 67.6 mm
§ revenues overall flat YOY:– increases from debitel and wireline
access charges (esp. DSL)– decreases from
– sold int’l WS businesses and newaccounting method for VAS
– lower wireline traffic§ EBITDA increased by 5% thanks to cost
control, esp. consulting, maintenance, staff
§ Net income and EPS almost double YOY
§ EFCF at CHF 2.9 bln (up by 160% YOY)
§ Interest bearing debt (excl. leaseobligations) repaid
Operational focus pays out
3. Time to AnalysePart I
29
2003 results, conference call24 March 2004
“pay-time”
30
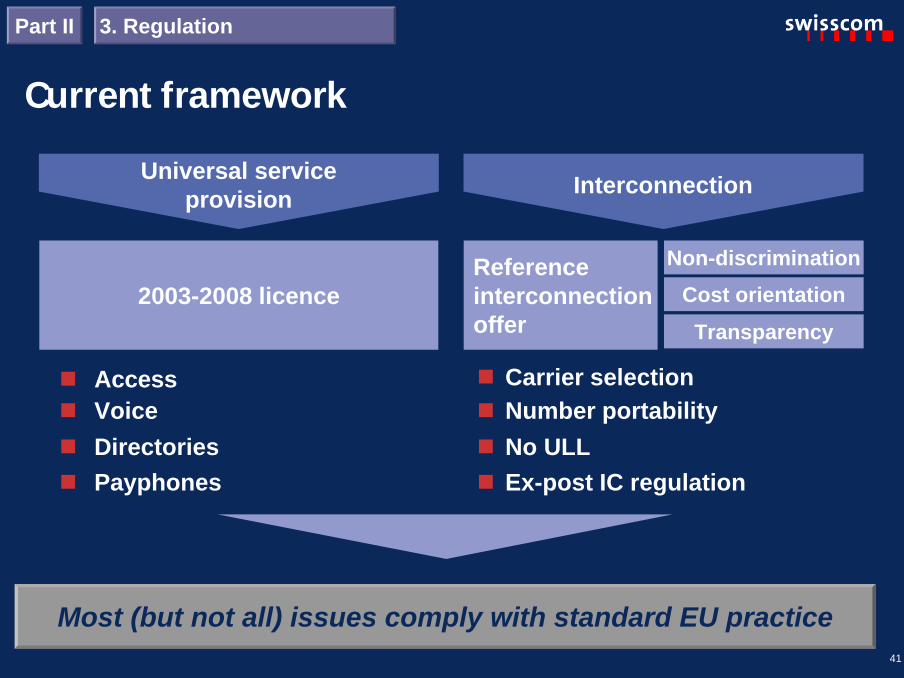
Regulation: update
Handling regulatory pressure remains core competence
Wireline
– LRIC: ComCom (6 November 2003) requiring to reduce IC prices in favourof 2 competitors by 25-35% retroactively for the years 2000-2003; finaldecision of Swiss Federal Court outstanding
– ULL: no final resolution to be expected until 2005/2006
– Access Reselling: obligation to offer access reselling is verified by SwissCompetition Commission
Wireless– Termination tariffs and SMS: are non-regulated tariffs, but are verified by
Swiss Competition Commission
Part I 4. Time to Look Forward
31
Potential sale debitel
§ debitel represents a financial investment
§ Swisscom is currently in discussions for a potential sale
§ debitel’s book value in 2003 further reduced by impairment charge of CHF
280mm, and stands at CHF 848mm as per year-end 2003 (of which CHF 710mm
goodwill)
§ Cumulative Translation Adjustments of CHF 221mm (non-cash) to be expected in
2004 accounts
§ Cash proceeds from a potential sale would add to the EFCF of 2004
4. Time to Look ForwardPart I
32
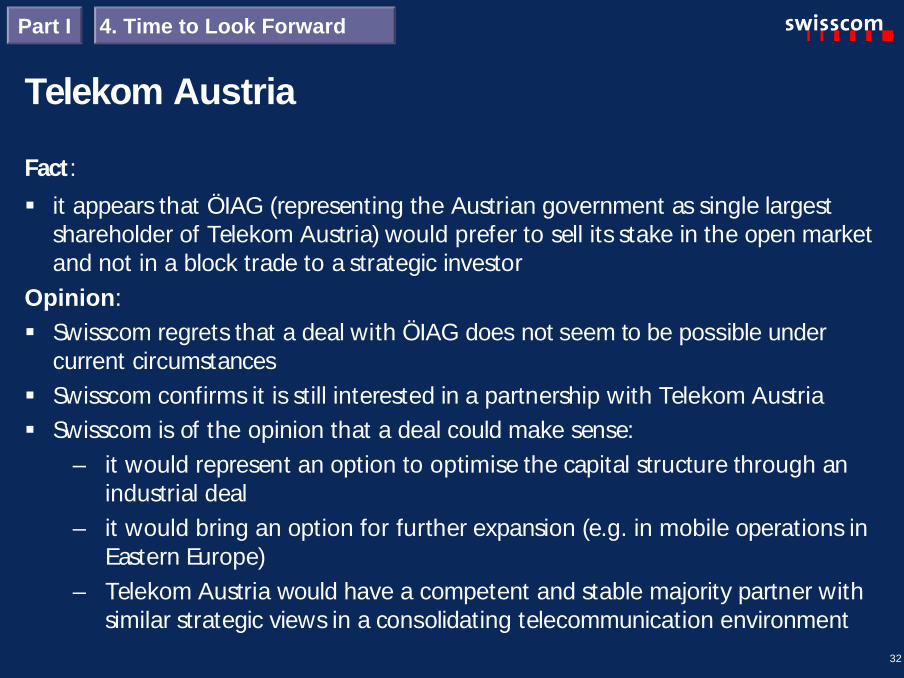
Telekom AustriaFact:
§ it appears that ÖIAG (representing the Austrian government as single largestshareholder of Telekom Austria) would prefer to sell its stake in the open marketand not in a block trade to a strategic investor
Opinion:§ Swisscom regrets that a deal with ÖIAG does not seem to be possible under
current circumstances§ Swisscom confirms it is still interested in a partnership with Telekom Austria§ Swisscom is of the opinion that a deal could make sense:
– it would represent an option to optimise the capital structure through anindustrial deal
– it would bring an option for further expansion (e.g. in mobile operations inEastern Europe)
– Telekom Austria would have a competent and stable majority partner withsimilar strategic views in a consolidating telecommunication environment
4. Time to Look ForwardPart I
33
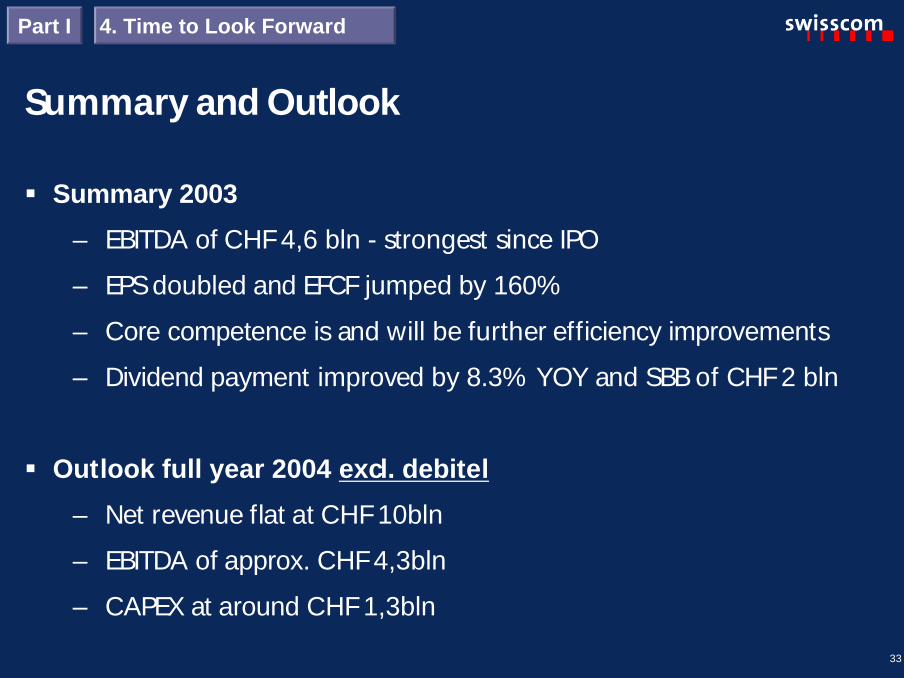
Summary and Outlook
§ Summary 2003
– EBITDA of CHF 4,6 bln - strongest since IPO
– EPS doubled and EFCF jumped by 160%
– Core competence is and will be further efficiency improvements
– Dividend payment improved by 8.3% YOY and SBB of CHF 2 bln
§ Outlook full year 2004 excl. debitel
– Net revenue flat at CHF 10bln
– EBITDA of approx. CHF 4,3bln
– CAPEX at around CHF 1,3bln
4. Time to Look ForwardPart I

34
2003 results, conference call24 March 2004
“pay-time”
35
Thank you for your attention!
Questions & Answers
Please also refer to separate background slidesdetailing the presentation of the key messagesFor further information, please contact:Phone : +41 31 342 6410Fax : +41 31 342 6411Email : [email protected] : www.swisscom.com/ir
5. Time for Q&APart I

36
1. Wireline business
2. Wireless business
3. Regulation
37
40
41
Content Slide
Part II Supporting background information
4. Group financials 42
“pay-time”
37
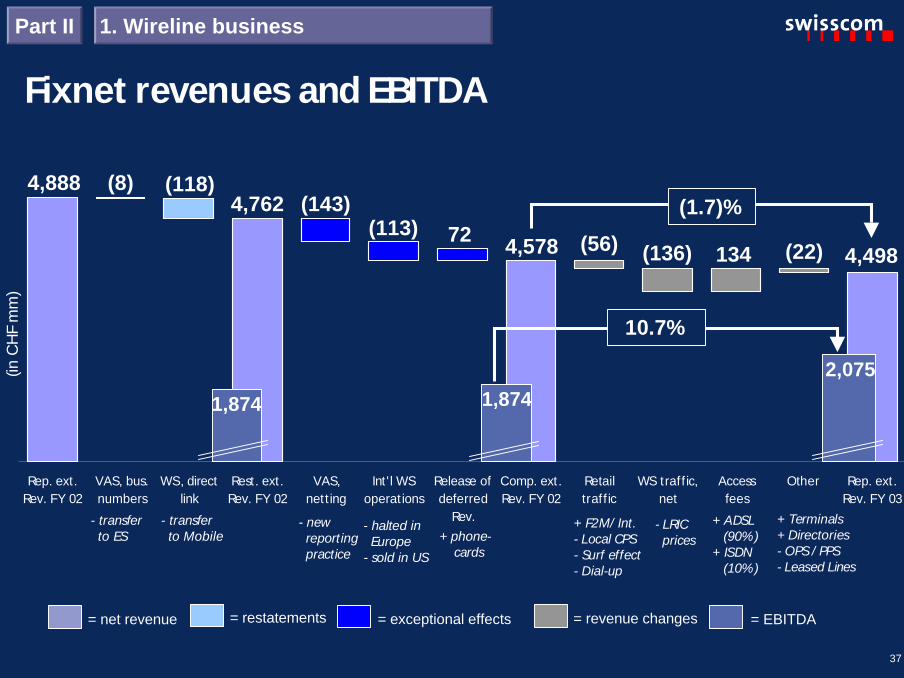
Fixnet revenues and EBITDA
Rep. ext.Rev. FY 02
VAS, bus.numbers
WS, directlink
Rest. ext.Rev. FY 02
VAS,nett ing
Int ' l WSoperat ions
Release ofdeferred
Rev.
Comp. ext.Rev. FY 02
Retailtraff ic
WS traff ic,net
Accessfees
Other Rep. ext.Rev. FY 03
+ ADSL(90%)
+ ISDN(10%)
+ F2M/ Int.- Local CPS- Surf effect- Dial-up
- halted inEurope
- sold in US
+ Terminals+ Directories- OPS / PPS- Leased Lines
- newreportingpractice
- transferto ES
= EBITDA= net revenue = exceptional effects = revenue changes= restatements
(inC
HF
mm
)
- transferto Mobile
1. Wireline businessPart II
- LRICprices+ phone-
cards
4,888 (8) (118)4,762 (143)
(113) 72 4,578 (56) (136) 134 (22) 4,498
(1.7)%
1,874
2,075
10.7%
1,874
38
Fixnet leading Swiss broadband provider
14 19 25 31 371215
1922
29
0
25
50
75
Q4 02 Q1 03 Q2 03 Q3 03 Q4 03
Bluewin Wholesale
Active ADSL subs, cumulativeBroadband revenues, per
quarter
109 140 177 21627486
110
140
167
213
0
100
200
300
400
500
31.12.02 31.3.03 30.6.03 30.9.03 31.12.03
Bluewin Other ISP's
(in CHF mm)(in thousand)
2634
4453
66154%
487
383
317
250195
150%
1. Wireline businessPart II
39
Enterprise Solutions revenues and EBITDA
Rep. ext. Rev. FY02
VAS, bus.Numbers
Rest. ext. Rev. FY02
Traff ic Inhouse &Processes
Networking Other Rep. ext. Rev. FY03
+ transferfrom Fixnet
1. Wireline businessPart II
= EBITDA= net revenue = exceptional effects = revenue changes= restatements
(inC
HF
mm
)
1,365 8 1,373 (58)
(20) (32)(2) 1,261
(8.2)%
97
38.1%
134
40
Mobile revenues and EBITDA
2. Wireless businessPart II
Rep. ext.Rev. FY 02
WS, directlink
Rest. ext.Rev. FY 02
VAS,netting
Release ofdeferred
Rev.
Comp. ext.Rev. FY 02
Voice Data andVAS
Base fees Other Rep. ext.Rev. FY 03
3,255
118 3,37363 (13) 20 3,434
(48)16
1,984
3,348
(inC
HF
mm
)
1,974
2.6%
+ transferfrom Fixnet
= EBITDA= net revenue = exceptional effects = revenue changes= restatements
23
0.5%
- newreportingpractice
1,974
41
n Access n Carrier selectionn Number portabilityn Voice
2003-2008 licence
n Directoriesn Payphones
Referenceinterconnectionoffer
Non-discrimination
Cost orientation
Transparency
n No ULLn Ex-post IC regulation
Most (but not all) issues comply with standard EU practice
Universal serviceprovision Interconnection
Current framework3. RegulationPart II
42
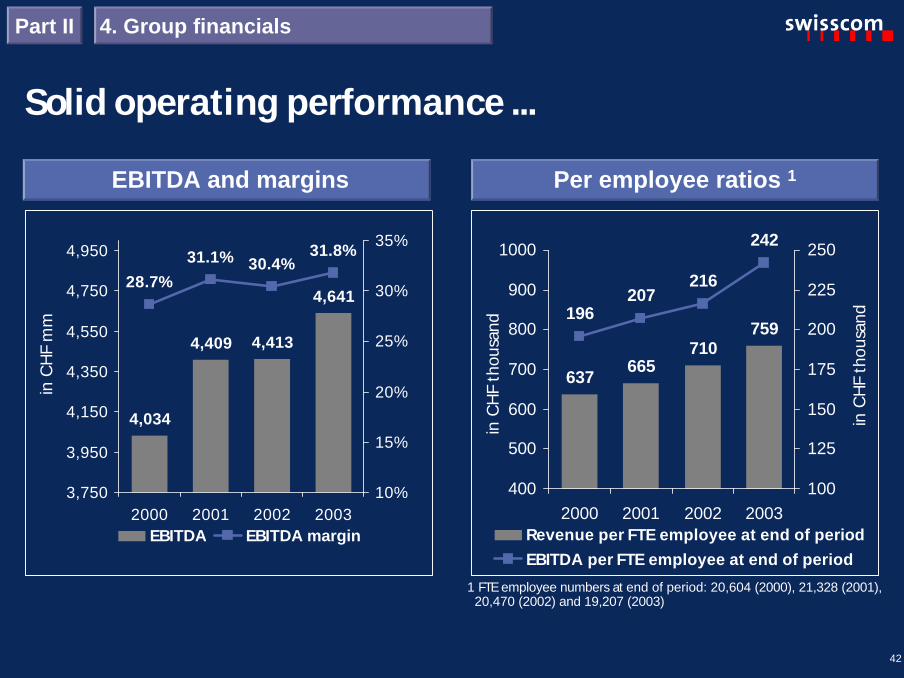
Solid operating performance ...
4,034
4,409 4,413
4,64128.7%
31.1% 30.4%31.8%
3,750
3,950
4,150
4,350
4,550
4,750
4,950
2000 2001 2002 2003
inC
HF
mm
10%
15%
20%
25%
30%
35%
EBITDA EBITDA margin
EBITDA and margins Per employee ratios 1
637665
710759
196207
216
242
400
500
600
700
800
900
1000
2000 2001 2002 2003in
CH
Fth
ousa
nd100
125
150
175
200
225
250
inC
HF
thou
sand
Revenue per FTE employee at end of periodEBITDA per FTE employee at end of period
1 FTE employee numbers at end of period: 20,604 (2000), 21,328 (2001),20,470 (2002) and 19,207 (2003)
Part II 4. Group financials
43
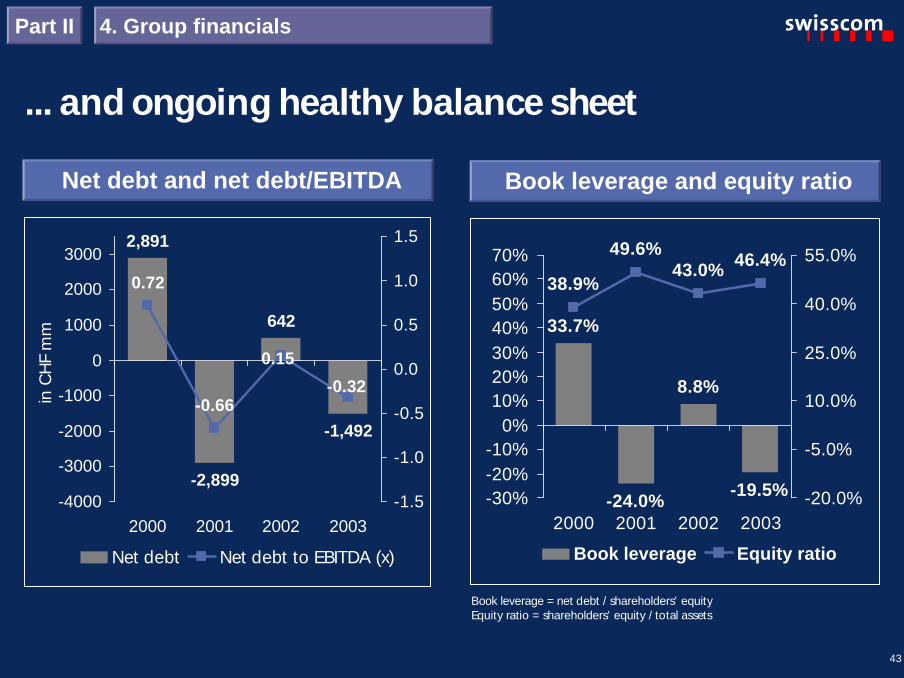
... and ongoing healthy balance sheet
33.7%
-24.0%
8.8%
-19.5%
38.9%
49.6%43.0% 46.4%
-30%-20%-10%
0%10%20%30%40%50%60%70%
2000 2001 2002 2003-20.0%
-5.0%
10.0%
25.0%
40.0%
55.0%
Book leverage Equity ratio
Book leverage and equity ratio
2,891
-2,899
642
-1,492
0.72
-0.66
0.15
-0.32
-4000
-3000
-2000
-1000
0
1000
2000
3000
2000 2001 2002 2003
inC
HF
mm
-1.5
-1.0
-0.5
0.0
0.5
1.0
1.5
Net debt Net debt to EBITDA (x)
Net debt and net debt/EBITDA
Book leverage = net debt / shareholders’ equityEquity ratio = shareholders’ equity / total assets
Part II 4. Group financials
44
Key figures 2003 per quarter
4. Group financialsPart II
0,000
0,500
1,000
1,500
2,000
2,500
3,000
3,500
4,000
Net revenue EBITDA EBIT Net income CAPEX EFCF
Q1 03 Q2 03 Q3 03 Q4 03 Avg. 02 Avg. 03
(in CHF mm)
Avg. 03:1,160
Avg. 03:3,645
Avg. 03:679 Avg. 03:
392 Avg. 03:303
Avg. 03:728
*)
*) before impairment charge debitel, **) reported net income
**)
45
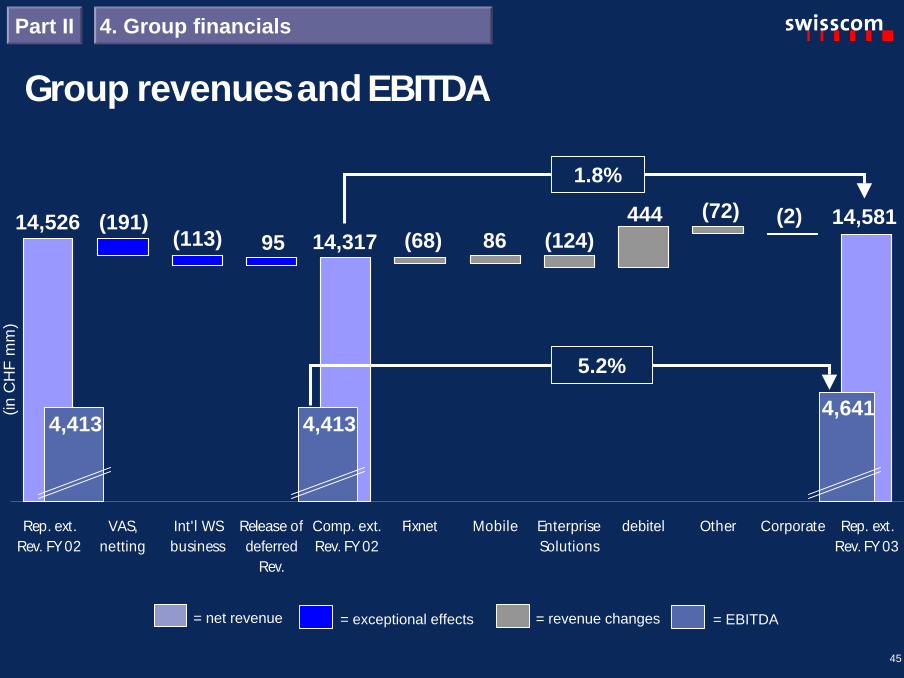
Group revenues and EBITDA
Rep. ext.Rev. FY 02
VAS,netting
Int'l WSbusiness
Release ofdeferred
Rev.
Comp. ext.Rev. FY 02
Fixnet Mobile EnterpriseSolutions
debitel Other Corporate Rep. ext.Rev. FY 03
14,526(113) (68) (124)
444 (72) (2) 14,581
4,4134,641
(191)14,317
4,413
1.8%
(inC
HF
mm
)
= EBITDA= net revenue = exceptional effects = revenue changes
5.2%
8695
4. Group financialsPart II
46
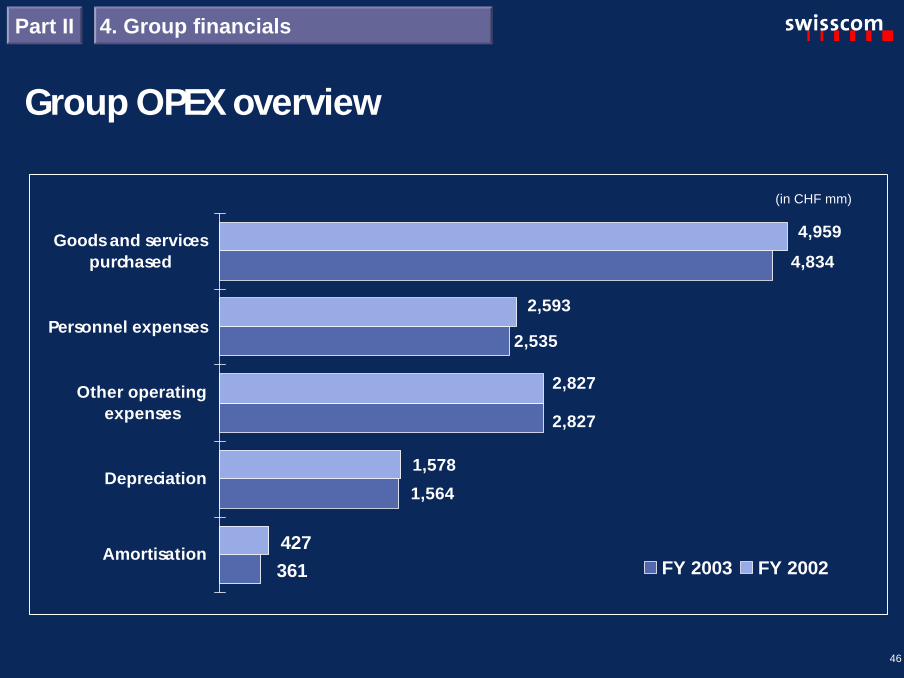
Group OPEX overview
2,535
4,834
2,827
1,564
4,959
2,827
2,593
1,578
Amortisation
Depreciation
Other operatingexpenses
Personnel expenses
Goods and servicespurchased
FY 2003 FY 2002
(in CHF mm)
Part II 4. Group financials
427361
47
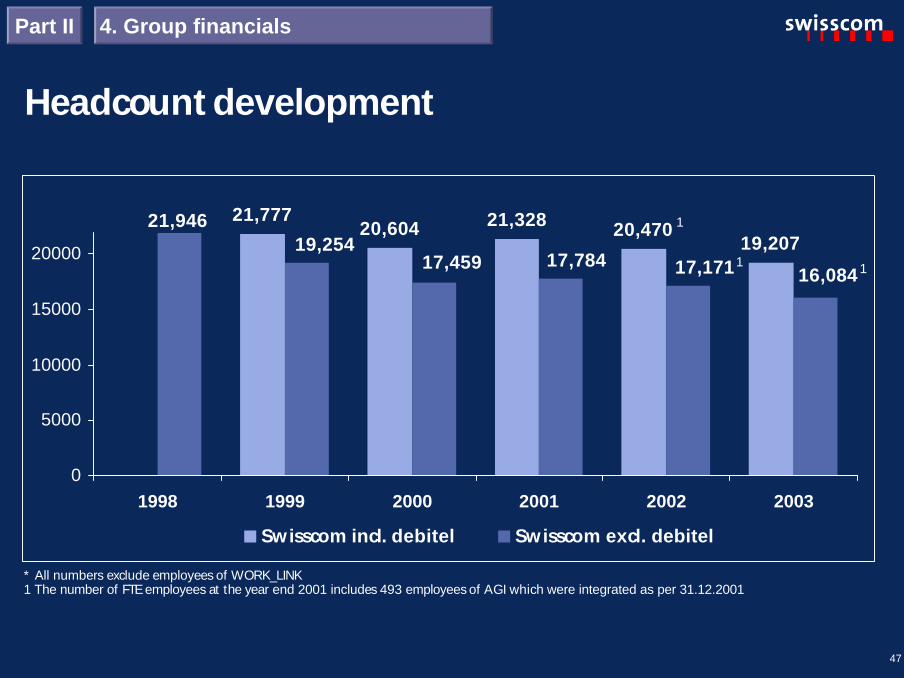
Headcount development
21,77720,604 21,328 20,470
19,207
16,084
21,946
17,17117,78417,45919,254
0
5000
10000
15000
20000
1998 1999 2000 2001 2002 2003
Swisscom incl. debitel Swisscom excl. debitel
1
1
* All numbers exclude employees of WORK_LINK1 The number of FTE employees at the year end 2001 includes 493 employees of AGI which were integrated as per 31.12.2001
Part II 4. Group financials
1
48
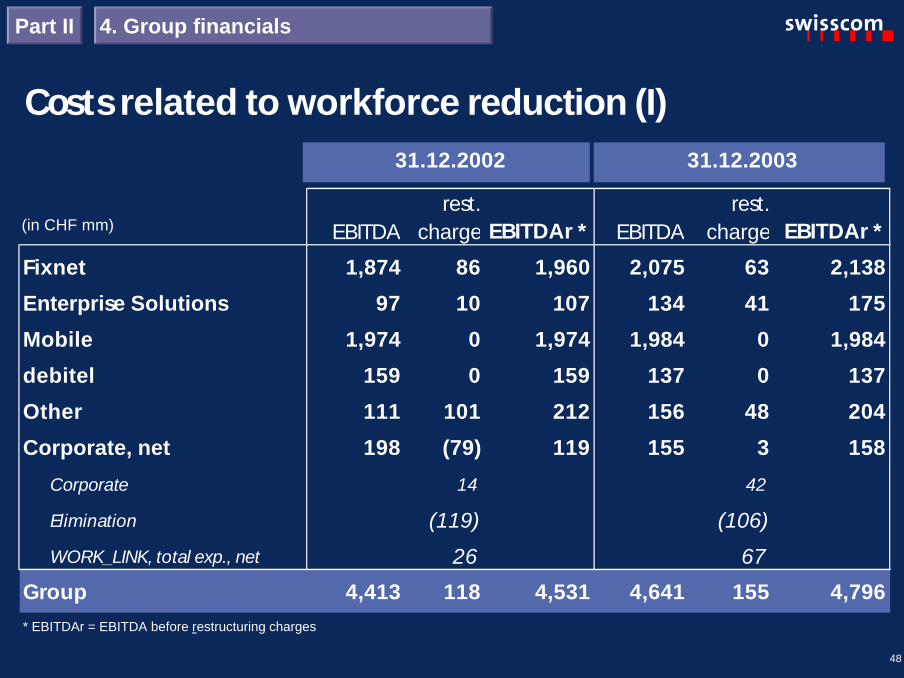
Costs related to workforce reduction (I)
EBITDArest.
charge EBITDAr * EBITDArest.
charge EBITDAr *
Fixnet 1,874 86 1,960 2,075 63 2,138
Enterprise Solutions 97 10 107 134 41 175
Mobile 1,974 0 1,974 1,984 0 1,984
debitel 159 0 159 137 0 137
Other 111 101 212 156 48 204
Corporate, net 198 (79) 119 155 3 158
Corporate 14 42
Elimination (119) (106)
WORK_LINK, total exp., net 26 67
Group 4,413 118 4,531 4,641 155 4,796
31.12.2002 31.12.2003
* EBITDAr = EBITDA before restructuring charges
(in CHF mm)
Part II 4. Group financials
49
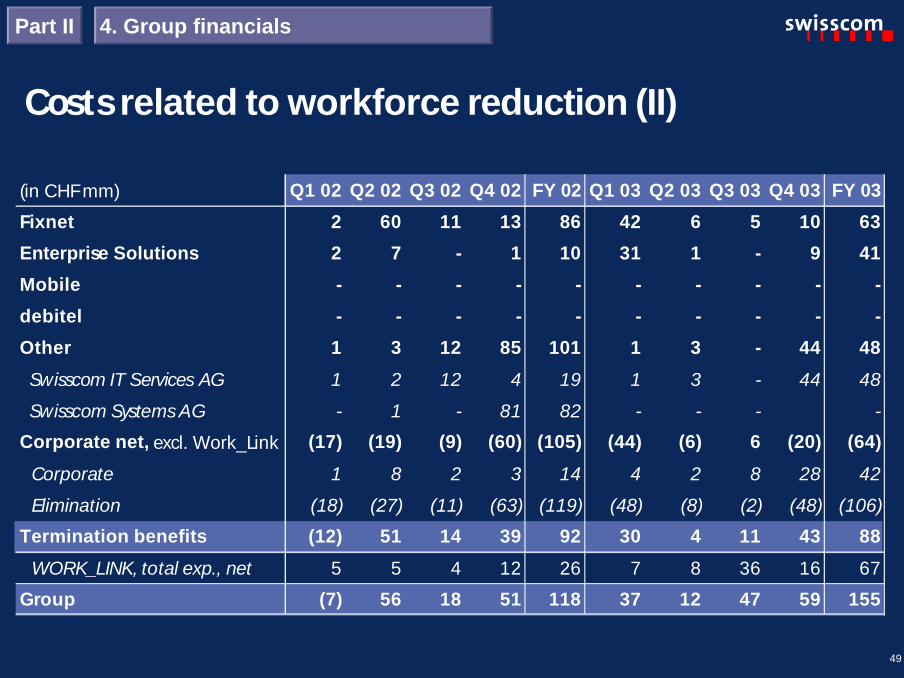
Costs related to workforce reduction (II)
Part II 4. Group financials
(in CHF mm) Q1 02 Q2 02 Q3 02 Q4 02 FY 02 Q1 03 Q2 03 Q3 03 Q4 03 FY 03
Fixnet 2 60 11 13 86 42 6 5 10 63
Enterprise Solutions 2 7 - 1 10 31 1 - 9 41
Mobile - - - - - - - - - -
debitel - - - - - - - - - -
Other 1 3 12 85 101 1 3 - 44 48
Swisscom IT Services AG 1 2 12 4 19 1 3 - 44 48
Swisscom Systems AG - 1 - 81 82 - - - -
Corporate net, excl. Work_Link (17) (19) (9) (60) (105) (44) (6) 6 (20) (64)
Corporate 1 8 2 3 14 4 2 8 28 42
Elimination (18) (27) (11) (63) (119) (48) (8) (2) (48) (106)
Termination benefits (12) 51 14 39 92 30 4 11 43 88
WORK_LINK, total exp., net 5 5 4 12 26 7 8 36 16 67
Group (7) 56 18 51 118 37 12 47 59 155
50
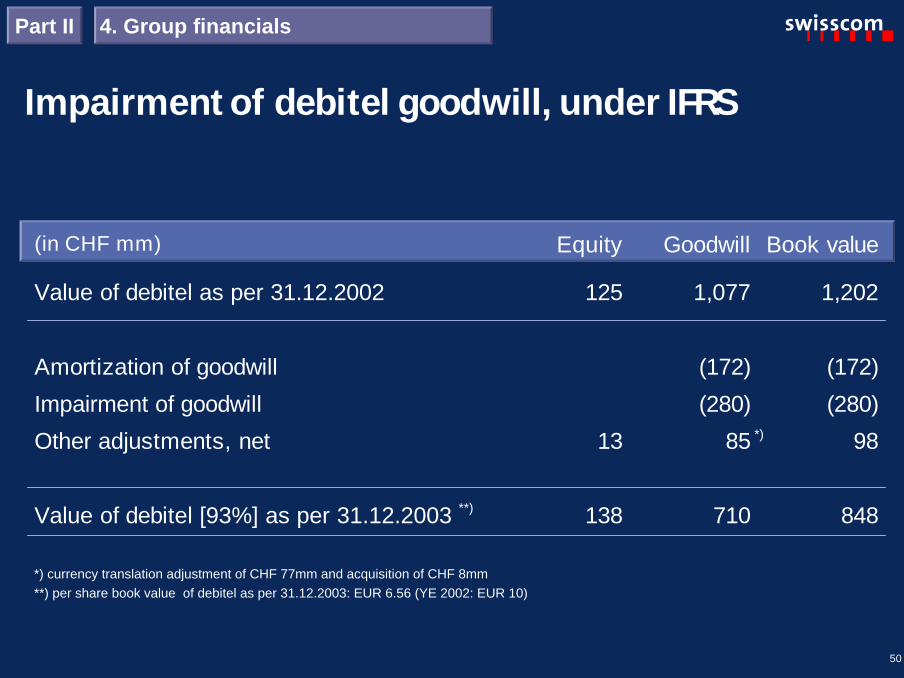
Impairment of debitel goodwill, under IFRS
(in CHF mm) Equity Goodwill Book value
Value of debitel as per 31.12.2002 125 1,077 1,202
Amortization of goodwill (172) (172)
Impairment of goodwill (280) (280)
Other adjustments, net 13 85 98
Value of debitel [93%] as per 31.12.2003 138 710 848
Part II 4. Group financials
*) currency translation adjustment of CHF 77mm and acquisition of CHF 8mm**) per share book value of debitel as per 31.12.2003: EUR 6.56 (YE 2002: EUR 10)
*)
**)
51
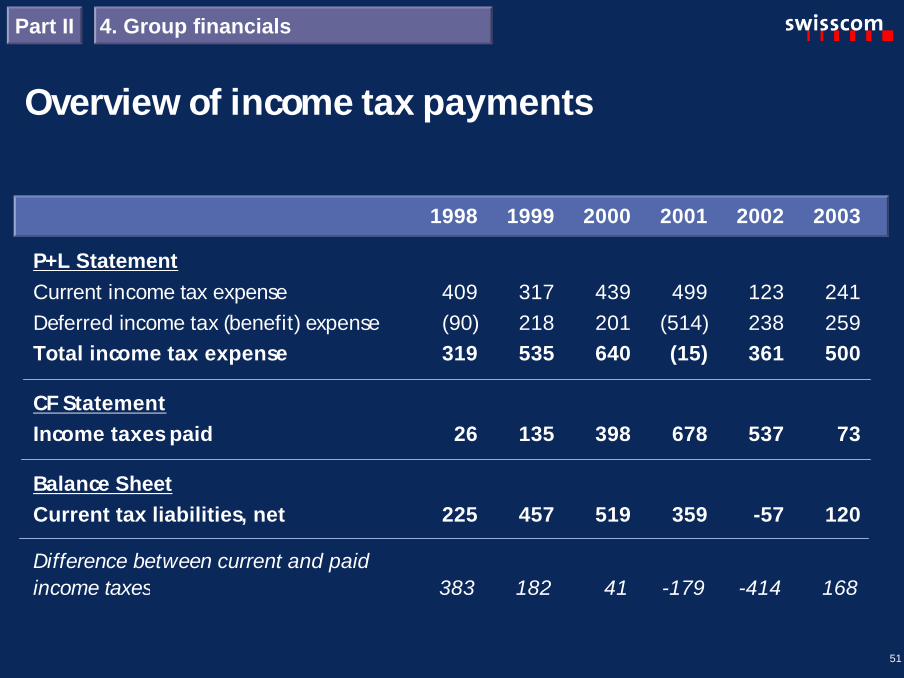
Overview of income tax payments
1998 1999 2000 2001 2002 2003
P+L StatementCurrent income tax expense 409 317 439 499 123 241Deferred income tax (benefit) expense (90) 218 201 (514) 238 259Total income tax expense 319 535 640 (15) 361 500
CF StatementIncome taxes paid 26 135 398 678 537 73
Balance SheetCurrent tax liabilities, net 225 457 519 359 -57 120
Difference between current and paidincome taxes 383 182 41 -179 -414 168
Part II 4. Group financials
52
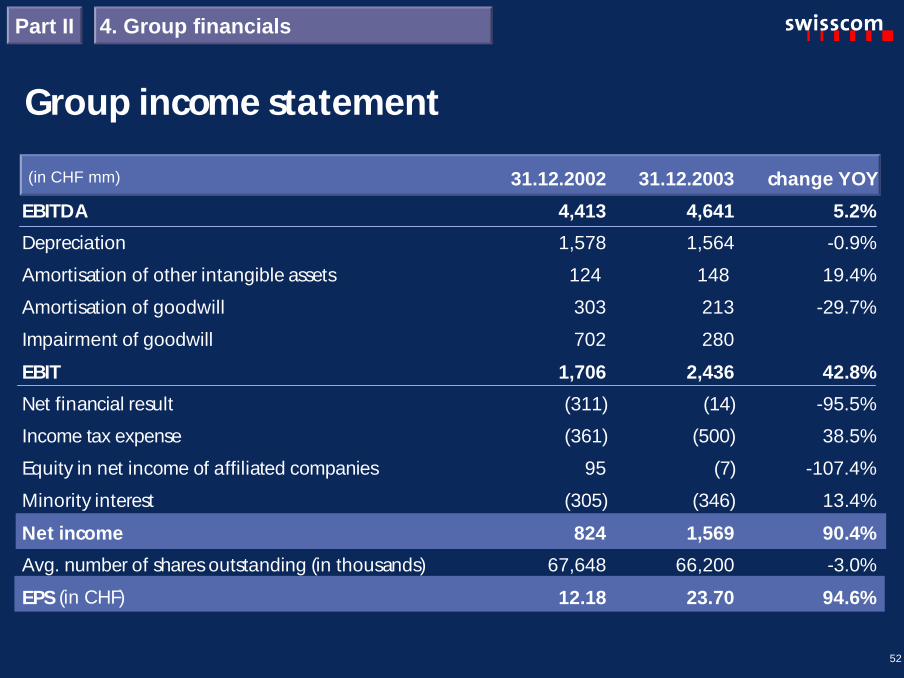
Group income statement31.12.2002 31.12.2003 change YOY
EBITDA 4,413 4,641 5.2%
Depreciation 1,578 1,564 -0.9%
Amortisation of other intangible assets 124 148 19.4%
Amortisation of goodwill 303 213 -29.7%
Impairment of goodwill 702 280
EBIT 1,706 2,436 42.8%
Net financial result (311) (14) -95.5%
Income tax expense (361) (500) 38.5%
Equity in net income of affiliated companies 95 (7) -107.4%
Minority interest (305) (346) 13.4%
Net income 824 1,569 90.4%
Avg. number of shares outstanding (in thousands) 67,648 66,200 -3.0%
EPS (in CHF) 12.18 23.70 94.6%
(in CHF mm)
Part II 4. Group financials
53
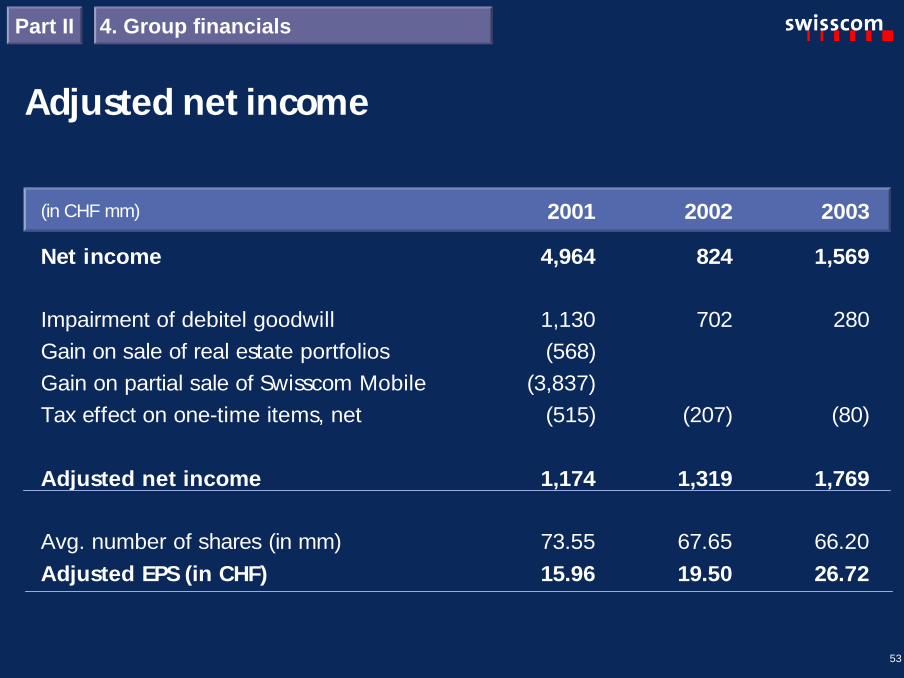
Adjusted net income
(in CHF mm) 2001 2002 2003
Net income 4,964 824 1,569
Impairment of debitel goodwill 1,130 702 280Gain on sale of real estate portfolios (568)Gain on partial sale of Swisscom Mobile (3,837)Tax effect on one-time items, net (515) (207) (80)
Adjusted net income 1,174 1,319 1,769
Avg. number of shares (in mm) 73.55 67.65 66.20Adjusted EPS (in CHF) 15.96 19.50 26.72
Part II 4. Group financials

54
CAPEX analysis
CAPEX developmentfor group without debitel
1,3911,168 1,154 1,165
13.8%
11.2% 11.5% 11.6%
0
500
1000
1500
2000
2500
2000 2001 2002 2003
inC
HF
mm
0%
3%
5%
8%
10%
13%
15%
CAPEX CAPEX/net revenue
1,213 1,165
583431
8.3%
11.6%10.4%10.0%
0
250
500
750
1000
1250
totalgroup
groupexcl.
debitel
Fixnet Mobilein
CH
Fm
m0.0%
2.0%
4.0%6.0%
8.0%
10.0%
12.0%14.0%
16.0%
CAPEXCAPEX/net revenueCAPEX/revenue incl. intersegment
CAPEX 2003
Part II 4. Group financials

55
Change of net debt / net funds
(1,213)CAPEX
Net cash providedby operating activities
4,732
Net debt31.12.02
642
(393)Dividendspaid to
minorities
Net funds31.12.03
1,492(794)Dividends
Par valuereduction
(530)
(in CHF mm)
Part II 4. Group financials
Proceedsfrom
CT sale510
Other(178)
56
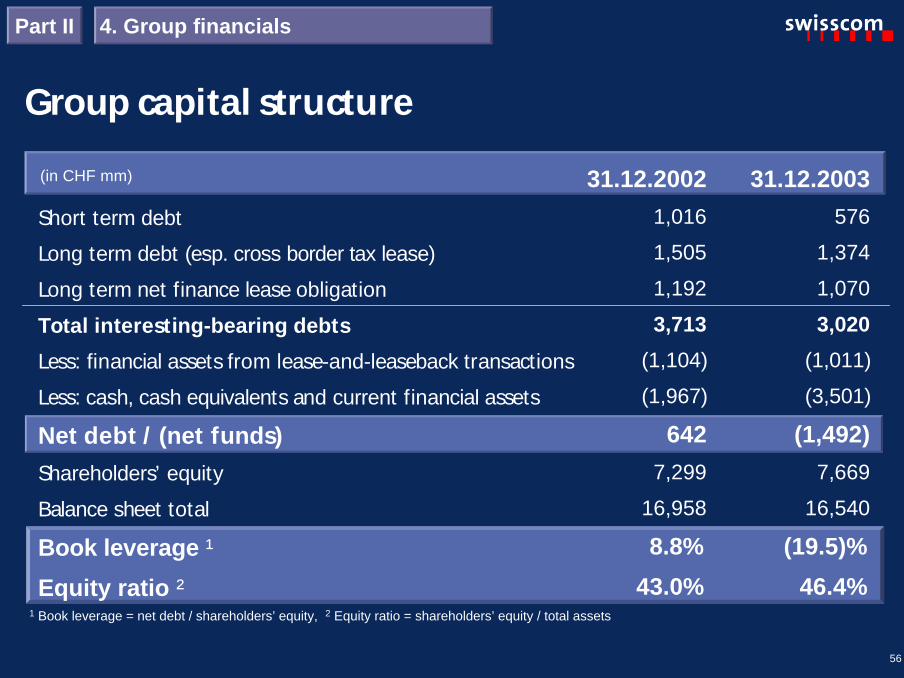
Group capital structure
Short term debt
Long term debt (esp. cross border tax lease)
Long term net finance lease obligation
Total interesting-bearing debts
Less: financial assets from lease-and-leaseback transactions
Less: cash, cash equivalents and current financial assets
Net debt / (net funds)Shareholders’ equity
Balance sheet total
Book leverage ¹
Equity ratio ²
31.12.20021,016
1,505
1,192
3,713
(1,104)
(1,967)
6427,299
16,958
8.8%
43.0%
31.12.2003576
1,374
1,070
3,020
(1,011)
(3,501)
(1,492)7,669
16,540
(19.5)%
46.4%1 Book leverage = net debt / shareholders’ equity, 2 Equity ratio = shareholders’ equity / total assets
(in CHF mm)
Part II 4. Group financials

57
(in CHF mm)Shareholders'
equitySwisscom AG
Sharecapital
non-distributable
reserves
distri- butablereserves
31.12.2002 before 2002 profit distribution 5,216 596 119 4,501Dividend in 2003 (794) (794)PVR paid in 2003 (530) (530) (106) 106Net income under Swiss GAAP 1,154 1,154
31.12.2003 before 2003 profit distribution 5,046 66 13 4,967Dividend in 2004 (861) (861)Share buyback in 2004 (2,000) (2,000)
After 2003 profit distribution, before 2004profits 2,185 66 13 2,106
Distributable reserves as per YE 2003Part II 4. Group financials
58
”This communication contains statements that constitute "forward-looking statements". In thiscommunication, such forward-looking statements include, without limitation, statements relating to ourfinancial condition, results of operations and business and certain of our strategic plans and objectives.
Because these forward-looking statements are subject to risks and uncertainties, actual future resultsmay differ materially from those expressed in or implied by the statements. Many of these risks anduncertainties relate to factors which are beyond Swisscom’s ability to control or estimate precisely, suchas future market conditions, currency fluctuations, the behaviour of other market participants, the actionsof governmental regulators and other risk factors detailed in Swisscom’s past and future filings andreports filed with SWX Swiss Exchange and the U.S. Securities and Exchange Commission and postedon our websites.
Readers are cautioned not to put undue reliance on forward-looking statements, which speak only of thedate of this communication.
Swisscom disclaims any intention or obligation to update and revise any forward-looking statements,whether as a result of new information, future events or otherwise.”
Cautionary statementregarding forward-looking statements
2003 results, conference call24 March 2004