future automotive challenges &...
TRANSCRIPT

© Ricardo plc 2017
Future Automotive
Challenges & Opportunities
Professor Neville Jackson
Chief Technology & Innovation Officer
Ricardo plc22nd November, 2017

© Ricardo plc 2017 November 2017 2
Contents
• Market & Policy Drivers
• Transport Energy Options
• Electrification of Transport
– Vehicle Technologies
– Life Cycle & Energy Infrastructure Challenges
• Future Propulsion Mix to meet Environmental Goals
• i-Mobility, Connected Vehicle Data & Autonomy

© Ricardo plc 2017 November 2017 3
Contents
• Market & Policy Drivers
• Transport Energy Options
• Electrification of Transport
– Vehicle Technologies
– Life Cycle & Energy Infrastructure Challenges
• Future Propulsion Mix to meet Environmental Goals
• i-Mobility, Connected Vehicle Data & Autonomy

© Ricardo plc 2017 November 2017 4
Global long term GHG targets consistent – City Authorities & Planners
also increasingly focused on “healthy Lifestyles & Environments”
Source: United Nations Framework Convention on Climate Change
China:
– 20% of energy from low-carbon sources by 2030
– CO2/GDP reduced by 60-65% by 2030 (ref. 2005)
Europe:
– 40% reduction in GHG by 2030 (1990 basis)
– 89-95% reduction in GHG by 2050 (1990 basis)
USA (prior to President Trumps withdrawal):
– 26-28% reduction in GHG by 2025 (2005 basis)
– 83% reduction in GHG by 2050 (2005 basis)
City Planning & Policies:
– Ultra Low Emission Zones
– Walking, Cycling, Public Transport Prioritised
What are the implications for energy supply, powertrain technologies & business models?

© Ricardo plc 2017 November 2017 5
Traffic congestion, pollution, parking, air quality, safety and affordability
are all driving demand for radical interventions
• UK to ban “conventionally” fuelled cars by 2040 (excludes hybrids of all types)
– London congestion charge & ULEZ, restrictions on diesels, alternative fuelled taxis and buses.
• Germany’s Bundesrat resolution to ban the internal combustion engine starting in 2030
– Hamburg plans 40% of city car free by 2034.
– Vauban (Freiburg) has banned cars, residents rent a €20,000 parking space on the city outskirts
• Finland, Helsinki overhauling public transport via smartphones; car ownership pointless by 2025.
• France, Paris plans to ban diesel vehicles by 2020
• Amsterdam is to ban city centre cars on Saturdays, to reduce motor traffic and pollution
• China & California ZEV mandates: China plan to phase out vehicles powered by fossil fuelsSource: Media reports
(London Smog 1952)

© Ricardo plc 2017 November 2017 6
• Many Governments have
stated objectives and policies
for phasing out combustion
engine vehicles before 2050
• UK intention has been to
eliminate conventional gasoline
& diesel passenger cars by
2040 as part of a “clean air”
strategy
• EU working on proposal (with
UK support) to introduce EU
wide mandate/credit for ZEV
vehicles in 2025-2040
timeframe
• There are already >500
individual restrictions on ICE
vehicle use in specific zones
in European Cities
The “clean air” agenda has driven Governments towards ZEV mandates
due to a perceived lack of progress in electrification

© Ricardo plc 2017 November 2017 7
Contents
• Market & Policy Drivers
• Transport Energy Options
• Electrification of Transport
– Vehicle Technologies
– Life Cycle & Energy Infrastructure Challenges
• Future Propulsion Mix to meet Environmental Goals
• i-Mobility, Connected Vehicle Data & Autonomy

© Ricardo plc 2017 November 2017 8
Sustainable Low Carbon Propulsion System
Source: Ricardo, *Steyr
Electrification is only one part of the future transport solution – we
will still require low carbon liquid fuels for many decades…
Energy Density (kW.hr/kg)
LNG incl. tank
10
8
6
4
2
12
Gasoline, Diesel,
Kerosene, Biomass
to Liquids
HVO (Biodiesel)
Ethanol
Li-ion Batteries0
Coal?
CNG (250 bar)
including tank
H2 (700 bar)
including tank
FAME (Biodiesel)
15-20 Tonne
Payload*
10-20 Tonne
Battery

© Ricardo plc 2017 November 2017 9
Electrified roads for heavy duty applications – a possibility for
specific environmental challenges?
Source: recombu.com:Sweden is testing electric roads for trucks, ITS International: Using electricity to power road freight
Safety Issues:
– Need dual catenary
as no road surface
connection
• Power:
– Total power input for
multiple HGV’s on an
incline likely to be 5-
10 MW
– Initial trials at 600
volts - not compatible
with multi-vehicle
demands
• Costs
– $5–6 million per km
likely to be prohibitive
– Who pays?

© Ricardo plc 2017 November 2017 10
Ultra Low or Zero carbon trucks – probably a choice between H2 Fuel
cells with renewable hydrogen or Bio-Waste/Power to Liquid Fuels
H2 Fuel Cell Trucks – Toyota/Nikola Motors
Waste to
Hydrocarbon
Liquid Fuels
Black Water
Treatment
Works
Treatment WorksAgriculture
Fertiliser
• Methane
• Syngas Energy
Renewable “Synthetic” Fuels<>
Renewable
Electricity
to Liquid
Fuels

© Ricardo plc 2017 November 2017 11
ICE thermal efficiency ~60% in future products? – still significant
further potential for improvements in combustion engine efficiency
Source: Ricardo Analysis, SAE 2015-26-0038 Opposed-Piston 2-Stroke Multi-Cylinder Engine Dynamometer Demonstration, Cousin Of The Chainsaw Engine Could Power 100-MPG Car
30
40
50
60
70
Pe
ak S
ha
ft T
herm
al E
ffic
iency (
ήe
%)
Gasoline
LD Diesel
HD Diesel
20Time / Product Generations
Air Quality Emissions reduced to “virtual zero”
GasolineDI - Dilute
US DoE Target for
Combustion engine
US DoE Target including use of
waste heat
Recuperated Split-Cycle
SI Efficiencies converge
towards CI DI levels
+ 1st Gen Ex Heat Recovery
1st Gen includes:
turbocompound – electrical or
mechanical
Initial Rankine Cycles 2nd Gen includes:
Optimised Rankine cycles
Heat to power systems
Thermo-electric systems
+ 2nd Gen Ex Heat RecoveryBest F1
Closed Split Cycle Zero NOx
Ricardo advanced
research - significant
further potentialRecuperated SS+Stirling Cycle

© Ricardo plc 2017 November 2017 12
Contents
• Market & Policy Drivers
• Transport Energy Options
• Electrification of Transport
– Vehicle Technologies
– Life Cycle & Energy Infrastructure Challenges
• Future Propulsion Mix to meet Environmental Goals
• i-Mobility, Connected Vehicle Data & Autonomy

© Ricardo plc 2017 November 2017 13
Increasing degrees of
electrification to recover
and re-use energy
Pure ICE Efficiency limit for Pass Cars
Pure ICE Efficiency limit for Light Trucks
0
20
40
60
80
100
120
140
160
180
200
Fle
et A
vera
ge C
O2
-g/k
m E
quiv
ale
nt
GHG reductions beyond 2025 not yet defined but likely to continue –
2030 targets defined on more holistic basis?
121
92
89
75
Potential change in regulatory
landscape to include Well to
Wheel & Life Cycle Impact?
Incre
asin
g
Bio
-co
nte
nt
in f
ue
l
102
70
69
55
Likely Future
Trajectories
Source: Ricardo analysis
“Real World”
Credits
Potential impact
from mid term
review
The average vehicle will
need to have some form
of electrification post 2020
to meet CO2 regulations

© Ricardo plc 2017 November 2017 14
Electrification can be applied in a number of configurations - no “one
size fits all” solution – 48 volt systems for volume & PHEV for premium
Increasing degree of vehicle electrification
Micro/Mild: Solution for the
“Average Car”
Ricardo HyBoost ~ 95 g/km in
“C” class car
Ricardo ADEPT ~ 70 g/km in
family car via 48v systems
Micro-hybrid 48v architecture
under development since 2011
Below 60v “hazardous” threshold
Full Hybrid: Niche or High
Performance
Prius best-selling hybrid - but, at
70 g/km cost/benefit eroded by
48 v systems?
New WLTP cycle reduce
benefits of hybrid systems
KERS systems make sense in
supercars
Plugged In: The Future? – From
Premium to Volume
BMW i3 – EV with optional range
extender
Tesla – shows that there is a market
for a premium “eco” product
Favourable treatment in legislative
cycles makes PHEV technology
attractive in larger premium vehicles
Mild HybridMicro Hybrid Full HybridPlug –in
Hybrid
Range
Extended EVPure EV
Batteries & Electrification
Source: Ricardo Analysis

© Ricardo plc 2017 November 2017 15
Growth in automotive electronics and electrical system functionality
has led to rapid growth in power demands
• Number of vehicle electrical/electronic continuing to increase
– Challenges for both average and peak power demands – Multiple
ADAS/Autonomous processing requirements also a major future challenge
– Power demands beyond limit of 12 volt functionality & will drive introduction
of 48 volt powernet
Electronic ignition
Engine ECUAuto trans’ ECUABS brakingElectronic StabilityTraction ControlSatellite NavigationTraffic Information
Supervisory P/T controlClosed loop comb controlVVA, e-valves/actuatorsBrake-by-WireElectric power steeringElectric HVACElectronic StabilityTraction ControlTorque VectoringAdaptive Cruise ControlSmart Lane FollowingRadar Hazard WarningSatellite NavigationTraffic InformationV2V & V2I comms/telematics
Vehicle electrical/electronic systems growth:
Increased user comfort & safety
Benefits to vehicle user and environment
1980 2000 20201990 20302010
Fu
nctio
n/P
ow
er
Re
qu
ire
me
nts
Fu
ll A
uto
no
mous C
on
tro
l?
Future Vehicle Electrical Power (Peak):
Power (W)
Engine Fuel Pump/Injectors 140
Throttle 60
Ignition 60
Sensors & Actuators 120
Solenoids/Relays 25
P/T ECU 80
Coolant Pump 400
Transmission Clutch Actuation 250
Gear Selection 150
Chassis/Body Elec Power Steering 350
Brake by Wire 250
HVAC 4500
Heated Screen 500
Window 600
Power locks 200
Wipers/Washers 150
Seat Actuation 400
Body ECU 80
Lighting etc. Headlamps 120
Side Lights 100
Turn Signals 120
Reversing 50
Infotainment Audio System 300
Navigation/GPS 150
Information Displays 40
HVAC Venting 80
HVAC Blower 400
Total 9675
© Ricardo plc 2017 November 2017 16
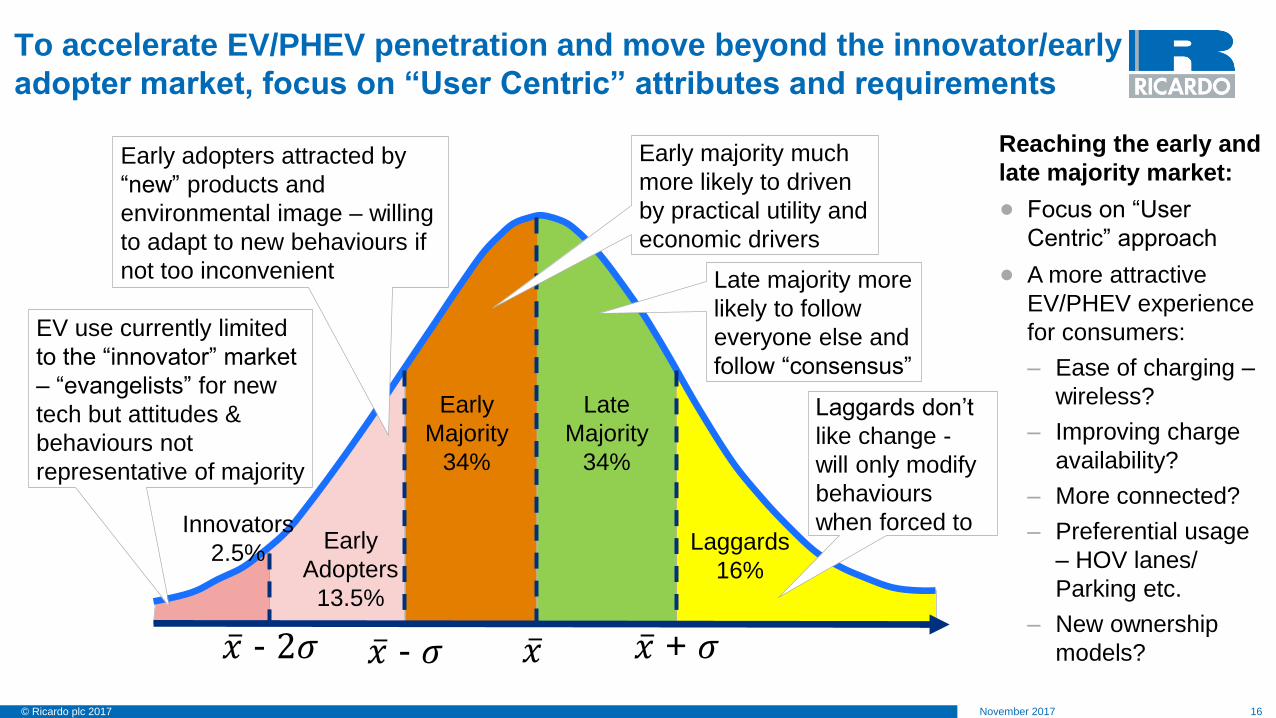
Innovators
2.5%Early
Adopters
13.5%
Early
Majority
34%
Late
Majority
34%
Laggards
16%
ҧ𝑥ҧ𝑥 - 𝜎 ҧ𝑥 + 𝜎ҧ𝑥 - 2𝜎
EV use currently limited
to the “innovator” market
– “evangelists” for new
tech but attitudes &
behaviours not
representative of majority
Early adopters attracted by
“new” products and
environmental image – willing
to adapt to new behaviours if
not too inconvenient
Early majority much
more likely to driven
by practical utility and
economic drivers
Late majority more
likely to follow
everyone else and
follow “consensus”
Laggards don’t
like change -
will only modify
behaviours
when forced to
Reaching the early and
late majority market:
• Focus on “User
Centric” approach
• A more attractive
EV/PHEV experience
for consumers:
– Ease of charging –
wireless?
– Improving charge
availability?
– More connected?
– Preferential usage
– HOV lanes/
Parking etc.
– New ownership
models?
To accelerate EV/PHEV penetration and move beyond the innovator/early
adopter market, focus on “User Centric” attributes and requirements

© Ricardo plc 2017 November 2017 17
OEM’s will fit larger batteries to EV’s - growth implications for Li-ion
battery manufacture – mostly in China in the short term
• Majority of new lithium-ion battery
capacity is currently being built in China
• Many national governments are
providing substantial incentives to attract
EV battery manufacture
– Battery manufacturing location may
influence vehicle assembly operations
Source: carwow, inside evs, web, Visual Capitalist (Chart)
OEM Model Production Range (miles)
Chevrolet Bolt 2016 238
Hyundai Ioniq 2017 110
Ford Focus 2017 110
Fisker E-Motion 2017 400
Renault Zoe 2017 186
Tesla Model 3 2017-8 200
Audi etron SUV 2018 310
Aston Martin Rapid E 2018 200
Jaguar I-Pace EV 2018 220
Faraday FF91 2018 378
Tesla Roadster 2019 400
Tesla Model S 2019 500
Mercedes Gen EQ 2019 300
Volvo full size 2019 200
Audi A9 etron by 2020 300
Nissan Leaf by 2020 200
Porsche Mission E by 2020 310
VW I.D. Concept by 2020 240
BMW i5 SUV 2021 300
By 2020, mass
production of
lithium-ion
batteries will be
concentrated in
just 4 countries

© Ricardo plc 2017 November 2017 18
Many xEV market forecasts have been published – Recent forecasts
generally less bullish but data suggests considerable uncertainty
Source: Published forecasts and Ricardo data
0%
10%
20%
30%
40%
50%
60%
70%
2015 2020 2025 2030
Ma
rke
t p
en
etr
atio
n (
ne
w c
ar
sa
les)
Market penetration predictions for BEV & PHEV acea LOW 2017
acea HIGH 2017
IEA B2DS 2017
IEA 2DS 2017
Paris Declaration 2017
IEA RTS 2017
Roland Berger Scenario A 2016
Roland Berger Scenario B 2016
Oliver Wyman "slight change" 2015
Oliver Wyman "Awareness" 2015
Oliver Wyman "Green world" 2015
McKinsey below 10 2014
McKinsey below 40 2014
McKinsey below 100 2014
Camecon tech 2 2013
Camecon tech 3 2013
ATKearney 2012
CE Delft "most realistic" 2011
CE Delft "ICE breakthrough" 2011
CE Delft "EV breakthrough" 2011
JRC EU15 low 2011
JRC EU15 medium 2011
JRC EU15 high 2011
JRC EU12 low 2011
JRC EU12 medium 2011
JRC EU12 high 2011
Ricardo view from industry
feedback post “Dieselgate” is
that planned xEV manufacture &
sales at least 30-40% by 2030
ERTRAC Prediction assuming CO2 targets achieved via
improvements in ICE-based vehicles and hybridisation
ERTRAC Prediction assuming breakthrough in energy storage
cost reduction and major infrastructure investments for re-charging

© Ricardo plc 2017 November 2017 19
Contents
• Market & Policy Drivers
• Transport Energy Options
• Electrification of Transport
– Vehicle Technologies
– Life Cycle & Energy Infrastructure Challenges
• Future Propulsion Mix to meet Environmental Goals
• i-Mobility, Connected Vehicle Data & Autonomy

© Ricardo plc 2017 November 2017 20
If our objective is to reduce environmental impacts and improve
sustainability, are we looking at the bigger picture?
“Fuel”
Generate Distribute
Production
Source: Ricardo
Disposal/Re-cycle
RIP
Materials
“In-Use”
Processing
• Impacts from conventional
combustion engine vehicles
mostly from “in-use” phase
– Materials, manufacturing
and fuel production
account for 20-30% of
total life cycle
• Electric and H2 Fuel cell
vehicles currently generate
most impacts from energy
or fuel generation,
materials, processing &
production
– 30-70% of total life cycle
depending on battery
size, grid carbon
intensity & mileage

© Ricardo plc 2017 November 2017 21
• Embedded CO2 estimated at
150-200 kg/kW.hr
• About half from material
extraction & processing, the
other half from manufacturing:
– Manufacturing emissions
dominated by electricity use
and associated grid carbon
intensity
– Lower grid carbon intensity
reduces manufacturing CO2
• The majority of embedded GHG
emissions are from the battery
electrodes
• Re-cycling of battery materials
remains challenging and adds
around 15 kg/kW.hr CO2eq
A recent review of published Life Cycle Emissions for batteries suggests
that embedded GHG emissions range from 150-200 kg CO2eq/kW.hr
Source: The Life Cycle Energy Consumption and Greenhouse Gas Emissions from Lithium-Ion Batteries – Romare & Dahllof, IVL Sweden

© Ricardo plc 2017 November 2017 22
Current battery production GHG emissions ~ 150-200 kg/kW.hr – 240
mile battery equivalent to 40 mpg gasoline vehicle travelling 70,000 km?
0
50
100
150
200
250
300
350
400
0
10
20
30
40
50
60
70
80
0 20000 40000 60000 80000 100000 120000 140000 160000 180000
Maxim
um
Ele
ctr
ic V
ehic
le R
ange [
km
]
Batte
ry S
ize [kW
.hr]
Equivalent "mileage" for ICE vehicle to produce same GHG emissions [km]
GHG Emissions from Battery Production
375 km (240 mile) battery equivalent
to efficient ICE vehicle (~70mpg real
world) travelling 158,000 km
375 km (240 mile) range battery
equivalent to “average” 40 mpg
gasoline vehicle travelling 70,000 km
Reducing Electricity
Grid Carbon Intensity
Reducing Fuel Carbon
Intensity & Increased
ICE efficiency
Source: Ricardo analysis; The Life Cycle Energy Consumption and Greenhouse Gas Emissions from Lithium-Ion Batteries – Romare & Dahllof, IVL Sweden

© Ricardo plc 2017 November 2017 23
Grid voltage levels and charging times for 250+ mile range 85 kW.hr
battery – to charge at >15 miles/hour need three phase supply
Higher power capability chargers need to
connect to the medium voltage grid to
deliver sufficient usable energy in minutes;
multiple chargers may share one
connection
Slow
Up to 3.5kW
Fast
22kWRapid
Up to 50kW
33kV Medium voltage
11kV Medium voltage
Ultrafast
90 – 350kW
Charging rate
Low voltage three
Phase 415V
Low voltage single
phase 220V
7 m
iles/h
our
15-2
0
mile
s /h
ou
r
80%* 50%*
50 miles/hour
200-500
miles/hour
Source: Ricardo analysis * = charge level within charging time from low State of Charge
UK Grid
connection24
18
12
6
0
Charge time
(hours)
Grid connection also depends
on # points / location
Medium
7kW
100 miles/hour

© Ricardo plc 2017 November 2017 24
• To achieve EV market uptake, need longer range and improved
charging facilities
• Local urban/city networks are insufficiently sized to support even
low uptake of EV’s and Plug-in vehicles
• Average electricity demand will only increase gradually but “peak”
demand will be an issue (EV owners all charge at same time)
Auto Industry concerned that Infrastructure will limit market penetration
– Supply/Network operators currently unconvinced about early action
• Network Operators believe that overall average power demand for
xEV’s will be insignificant before 2030
• There is no business case for recharging facilities, particularly
fast charge – all will need high subsidies
• Local network issues will be resolved by demand control and
strategic positioning of recharge facilities
Source: Ricardo Analysis, UK OLEV, Role of the power sector for Electromobility - Iberdrola
Note: EU Directive 2014/94/EU4 provides an obligation on member state governments to expand the network of
charging points (CP), as the number of vehicles in service grows – there is no guidance on funding requirements

© Ricardo plc 2017 November 2017 25
City/Urban journeys dominated by ZEV mobility - Infrastructure & the
Built Environment likely to be the controlling limit on EV penetration
• Smaller batteries and lower ranges more compatible with existing city/urban networks
– Intercity/longer range refuelling/recharging better served by low/zero carbon “drop-in”
conventional fuels or renewable hydrogen networkSource: 1) Tesla, 2) Julich - Germany, 3) UK Energy Technology Institute
Strategically positioned
H2 refuelling stations on
critical road network
less expensive than
high power EV charging
City & Urban
journeys powered
predominantly via
renewable
electricity
UK Example:• Future Cities:
– Focus on healthy living & sustainable utilities
– Air Quality - Imperative for Zero Tailpipe Emissions
– Drive towards multi-modal (road/rail/metro) mobility:
• Walking, Cycling, Ride Sharing (public & private)
• Battery Giga-factories:
– 15-20 in EU alone (at €4-€5 billion each1) for 30-40% EV penetration
– Need to assess and minimise total environmental impact:
• Embedded CO2, rare material mining/extraction, toxic waste etc.
• Refuelling/Recharging infrastructures:
– Introducing new infrastructures prohibitively expensive
• Extensive “smart grid” system – implementation?
• Electricity distribution capacity insufficient to support large scale
(350+ mile range) EV penetration – upgrade costs:
– Germany - €150b+2, UK €15b+3 & smart grids?
© Ricardo plc 2017 November 2017 26
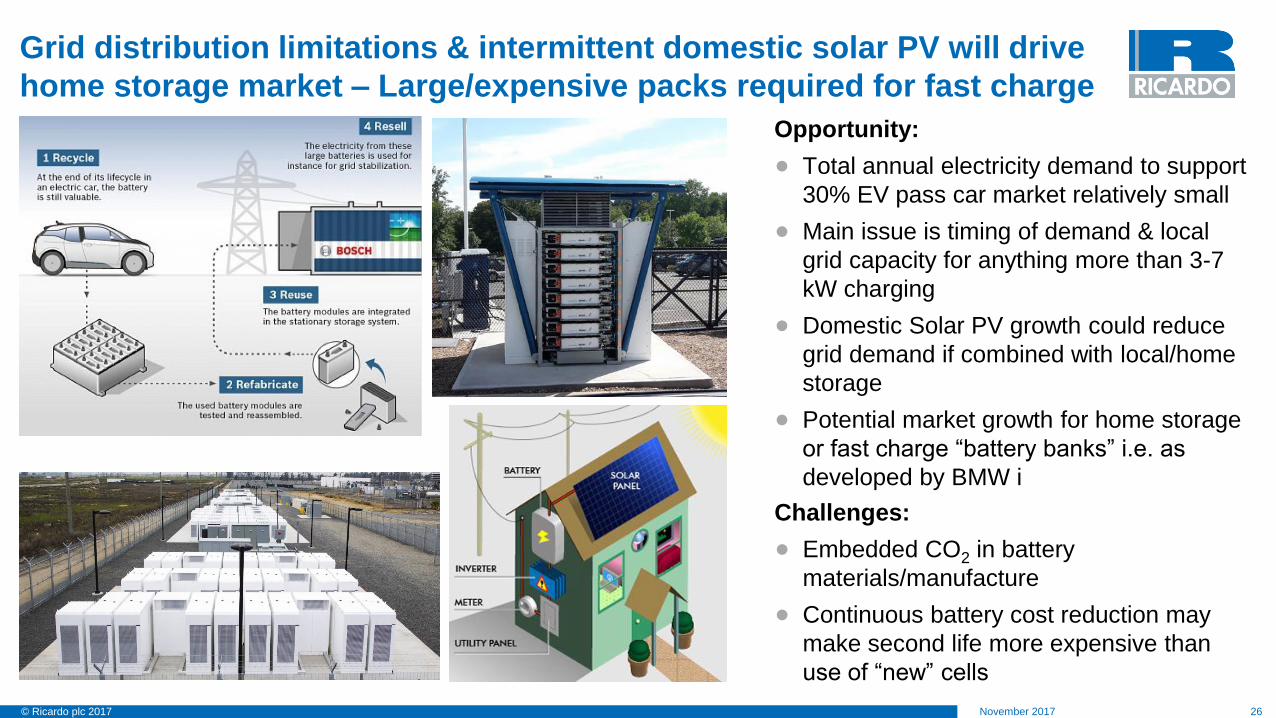
Grid distribution limitations & intermittent domestic solar PV will drive
home storage market – Large/expensive packs required for fast charge
Opportunity:
• Total annual electricity demand to support
30% EV pass car market relatively small
• Main issue is timing of demand & local
grid capacity for anything more than 3-7
kW charging
• Domestic Solar PV growth could reduce
grid demand if combined with local/home
storage
• Potential market growth for home storage
or fast charge “battery banks” i.e. as
developed by BMW i
Challenges:
• Embedded CO2 in battery
materials/manufacture
• Continuous battery cost reduction may
make second life more expensive than
use of “new” cells

© Ricardo plc 2017 November 2017 27
Contents
• Market & Policy Drivers
• Transport Energy Options
• Electrification of Transport
– Vehicle Technologies
– Life Cycle & Energy Infrastructure Challenges
• Future Propulsion Mix to meet Environmental Goals
• i-Mobility, Connected Vehicle Data & Autonomy

© Ricardo plc 2017 November 2017 28
A00
D
A0
A
B
C
P1
P2
Ricardo view of the 2030 passenger vehicle electrified powertrain mix
- penetration rates by powertrain type will vary by segment
Powertrain mix by manufacturer
BEV
PHEV
Gasoline with mild
hybridisation
(MHEV, HEV)
Diesel
FCEV
Powertrain mix 2030 – developed markets – high level of charging infrastructure
Source: Ricardo analysis
Vehicle segment
L-Cat
City Pod
A
B
C
D
SUV
E

© Ricardo plc 2017 November 2017 29
A00
D
A0
A
B
C
P1
P2
Ricardo view of the 2030 passenger vehicle electrified powertrain mix
- penetration rates by powertrain type will vary by segment
Powertrain mix by manufacturer
BEV
PHEV
Gasoline with mild
hybridisation
(MHEV, HEV)
FCEV
Powertrain mix 2030 – developed markets – Limited charging infrastructure
Vehicle segment
L-Cat
City Pod
A
B
C
D
SUV
E
Source: Ricardo analysis
Diesel

© Ricardo plc 2017 November 2017 30
• Reducing carbon intensity of energy/fuels:
– Gasoline/Diesel
– Natural Gas
– Electricity
– Hydrogen
COP21 GHG targets in transport not straightforward – Need efficiency
improvements, new energy vectors & carbon intensity reductions
2050 Targets
(-80+% GHG)
Efficiency improvements
Reducing carbon intensity of energy/fuels
Vehicle (energy per vehicle km)
Passenger, Goods (energy per pass. km or tonne km)
Mobility System focus: Logistics/ride
sharing & Mobility as a Service via
connected & autonomous technologies
Propulsion technologies, light-
weighting, aerodynamics, rolling
resistance etc.
Increasingly renewable content – sustainable bio, algal & synthetic fuels
Increasing H2 content, biogas and e-gas
From Natural Gas reforming to renewable sources (e.g. large scale electrolysis)
Increasing requirement for
intermittent renewable
energy storage – H2 may be
lowest cost approach?
Multiple options for renewable H2:
- Heat (via NG networks)
- Transport
- Displacing fossil H2 in oil refineries
Source: Ricardo analysis
Increasing renewables/low carbon intensity/central & distributed storage
Without technology innovations,
road transport CO2 will be 4x 2050
target due to increased demand

© Ricardo plc 2017 November 2017 31
Source: Automotive Council, *ERTRAC, E4tech, Element Energy, Ricardo analysis
ERTRAC analysis for 80% reduction in road transport GHG - half of
energy from electricity by 2050 – remainder from Bio & Waste
Today 2050 (ERTRAC Estimate)
• By 2050, ~50% of all road transport energy from electricity. The remainder comes from chemical energy
– Chemical energy (including H2) for energy intensive transport (HGV & high speed journeys / intercity)
• Choice will be between decarbonising legacy (diesel/gasoline) fuels or investing in new infrastructures
for H2 generation & supply for transport – largely defined by economics and national fiscal policies
• Fuel Cell propulsion system cost challenges will be overcome - renewable H2 supply driven by need for
“storage” of intermittent renewable electricity and to reduce carbon intensity of domestic heating
• Increasing focus on “total environmental impact” will drive more holistic balance between use of critical
materials, embedded and emitted emissions and recycling/re-use
Liquid
FossilOthers
Liquid Fossil
Biofuels,
Synthetic Fuels
H2
Renewable
Electricity
Efficiency Improvements
Chemical
Energy

© Ricardo plc 2017 November 2017 32
Contents
• Market & Policy Drivers
• Transport Energy Options
• Electrification of Transport
– Vehicle Technologies
– Life Cycle & Energy Infrastructure Challenges
• Future Propulsion Mix to meet Environmental Goals
• i-Mobility, Connected Vehicle Data & Autonomy

© Ricardo plc 2017 November 2017 33
Future Powertrain choices more dependent on new Ownership
/Business models than technology developments?
Powertrain
Technology
Ownership
Models
i-Mobility Automotive OEM’s
Tech Companies
Tech Ride Share Co’s
Current ownership model require powertrains with broad utility i-Mobility technologies will increase “on-demand” services
– Ability to increase passengers/vehicle, improve vehicle road utilisation & reduce parking requirements
“on demand” vehicles enables more dedicated utility:– Electric Vehicles for inner city use– Plug-in for urban mobility– Advanced ICE/Low GHG fuels for intercity
Change in business/ownership models may have more impact on
future powertrain diversity than technology advancesSource: Bloomberg - The Merging Worlds of Technology and Cars
TataOwner of
Jaguar
Land Rover
Volvo
ToyotaFiat
Chrysler
FordGM
UberMicrosoft
Civil
Maps
Nirenberg
Neuroscience
Velodyne
Lidar
SAIPS Chariot
Lyft
Sidecar
Cruise Automation
Didi Uber
China
Apple
Baidu
Mobileye
Intel BMW
Blacklane
Car2Go
RideScout
MyTaxi
HailoNokia
HERE Matternet
AthlonCar Lease
International
DriveNow
Scoop
VW
Gett DFKI
Renault-
Nissan
Sylpheo
Daimler
Volvo and Uber
entered into a
$300 million joint
venture to develop
a fully autonomous
car by 2021.
Ford is among five
investors who
provided $6.6 million
in seed funding for
Civil Maps.
Uber and Didi
have invested
in each other
after teaming
up in China.GM invested
$500 million in
Lyft and bought
Cruise Automation
for $1 billion.
Ford has a
licensing
agreement with
Nirenberg
Neuroscience.
Ford and Baidu
each invested
$75 million in
Velodyne
Lidar.
Apple invested
$1b in Didi,
which partners
with Lyft.
BMW, Mobileye,
and Intel partnered
to create a self-
driving car.
VW, BMW, &
Daimler
partnered to
buy Nokia’s
HERE maps.
Daimler and
Matternet have a
joint venture to
make drones.
VW owns a stake in
the German Research
Center for Artificial
Intelligence (DFKI).
VW invested
$300 million in
taxi-hailing
company, Gett.

© Ricardo plc 2017 November 2017 34
Connected & Autonomous functionality offers a range of benefits to
both consumers and city/local authorities• Key drivers for autonomous control of vehicles:
– Improved safety:
• We will not achieve targeted reductions in road transport
casualties without addressing human error – responsible for 90+%
of road transport accidents
– Consumer benefits:
• Less “wasted” time commuting or travelling using road transport
– Improved vehicle utilisation – passenger cars spend ~95% of their
life parked:
• The interaction with connected services offers an opportunity to
develop “on-demand” services where vehicle utilisation can be
increased – both passenger car and goods transport
• Can reduce parking demand – a major issue in most cities
– Improved use of infrastructure – average vehicle occupancy is 1.4
people/car
• Increasing the number of passengers per vehicle or goods per
vehicle via the interaction with connected services offers potential
reductions in congestion and reduced journey times

© Ricardo plc 2017 November 2017 35
Passenger cars more complex than any other volume product –
Significant implications for future vehicle electrical systems
Source: IEEE Spectrum: This Car Runs on Code; Image: Daimler
1.7 5.7 6.520
60
100
300?3000?
0
50
100
150
200
250
300
350
F-22 RaptorFighter Jet
F-35 JointStrike Fighter
Boeing 787Dreamliner
Premium CarRadio/Nav
System
Windows 8 MercedesBenz S-Class
FullyAutonomous
Vehicle
Million Lines of Code
! Teraflop = 1012 Floating Point Operations per Second
• Global automotive
electronics industry
estimated at
$275bn/year by 2020
– ~70% of vehicle
value in
electronics/control/
software by 2030?
• Premium vehicles contain ~ 100 microprocessors networked throughout the car
– More than an Airbus A380
• Current “autonomous” vehicles process around 1 teraflop of information and continues to grow – predictions
suggest processing at petaflop capacity required in practice
– GPU power consumption ~ 1 kW/10,000 processing cores
– Latest NVIDIA Pegasus board ~ 1014 FLOPS - consumes 0.5 kW + air cooling

© Ricardo plc 2017 November 2017 36
A human brain has ~ 100 billion neurons & 1000 trillion connections –
when will a computer match this capability?
Source: Ray Kurzweil
10-10
10-5
10
105
1010
1020
1025
1030
1035
1040
1045
1050
1055
1060
1015
Calc
ula
tions p
er
Second p
er
$1000
Human Brain
All Human Brains
Mouse Brain
Insect Brain
1964 First Supercomputer (CDC
6600) rated at 3 megaflops (106
calculations/second)
Single core (CPU) and cost ~$60
million equivalent today
2016 Chinese Sunway
TaihuLight Supercomputer rated
at 1017 FLOPS (similar to
human?) using 10,649,600 cores
Power consumption estimated at
15 MW
Total computer system occupies
around 80 m3
Human brain consumes ~20 W
Photonics
Sequential Parallel
CDC 6600
Supercomputer
Sunway TaihuLight
Supercomputer
From Supercomputer
to less than $1000?
20 Years
10 Years?
?

© Ricardo plc 2017 November 2017 37
A qualitative/pattern recognition route to autonomous control more
effective than an algorithm & rule based approach?
• Will we be able to deliver fully autonomous vehicle functionality via an
algorithm and rule based approach?
• Or will we need to move to a “qualitative” rather than “quantitative” processing
approach:
– An analogue rather than digital processing environment that recognises and
responds to pattern recognition via pre-defined reaction – much like we do?
Focus on the right outcome from a
recognised input rather than a rule-
based (and very time consuming)
objective analysis
Neural networks:
© Ricardo plc 2017 November 2017 38
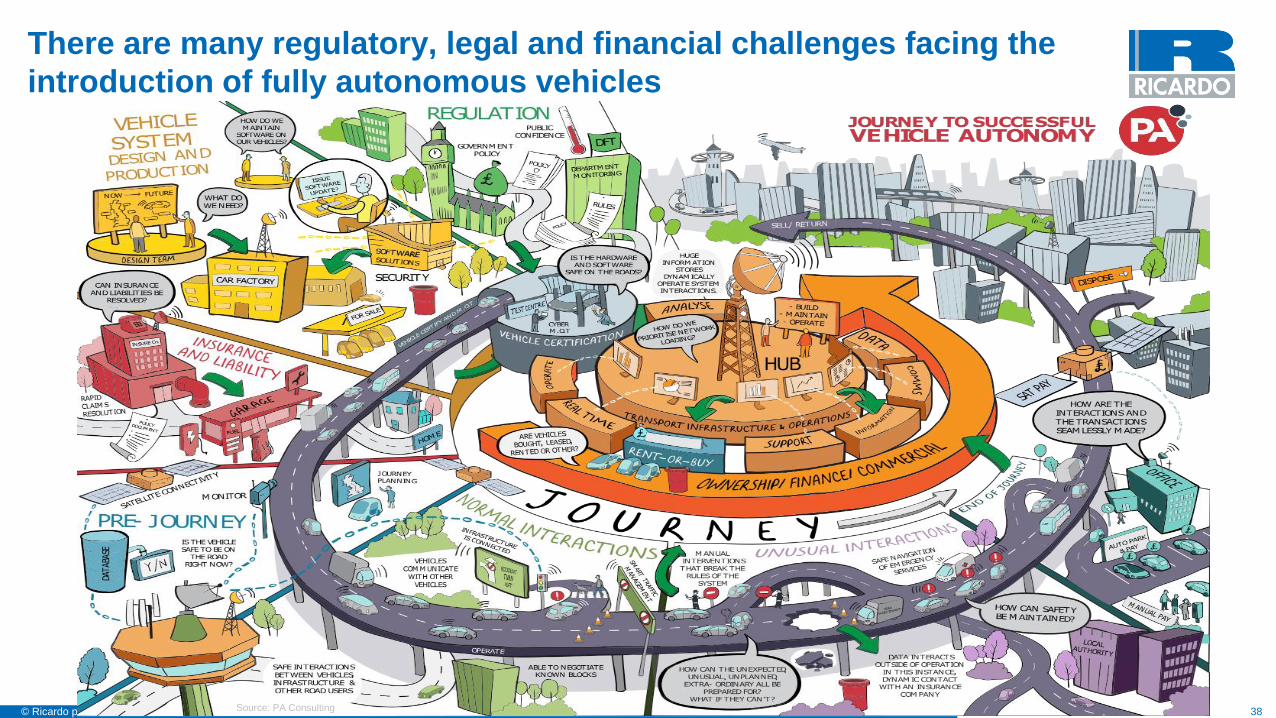
There are many regulatory, legal and financial challenges facing the
introduction of fully autonomous vehicles
Source: PA Consulting
© Ricardo plc 2017 November 2017 39
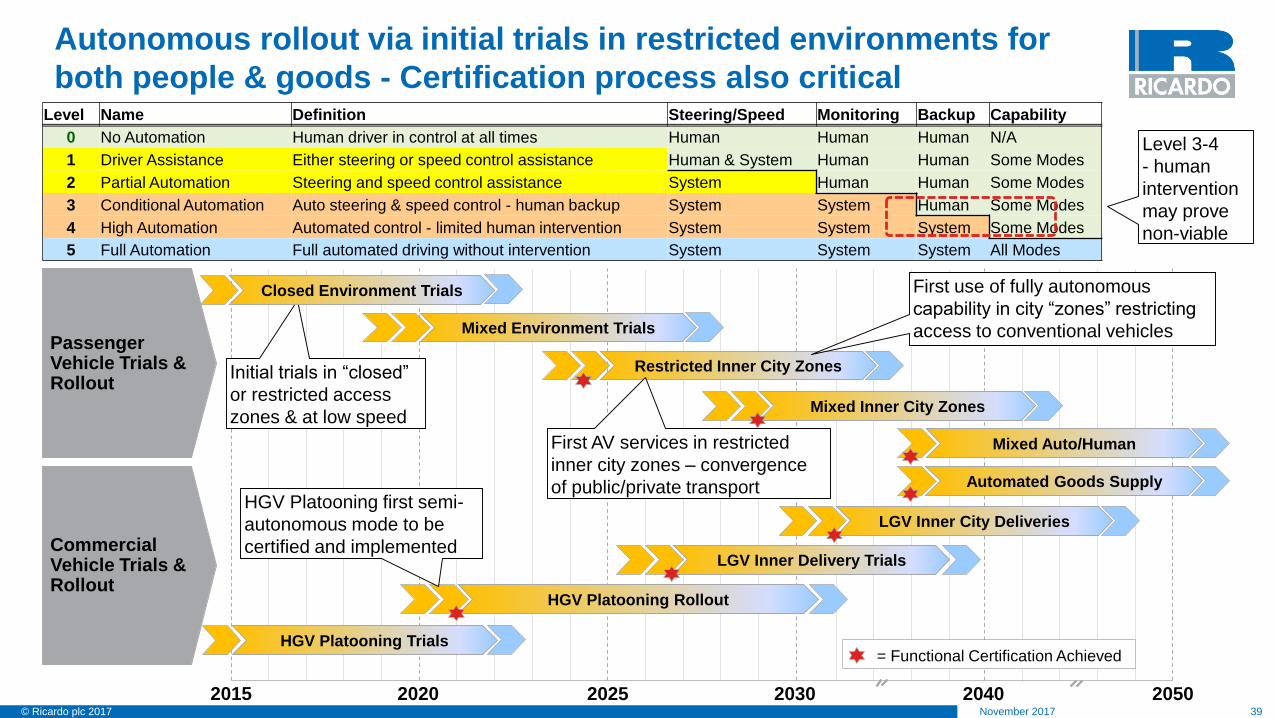
Autonomous rollout via initial trials in restricted environments for
both people & goods - Certification process also criticalLevel Name Definition Steering/Speed Monitoring Backup Capability
0 No Automation Human driver in control at all times Human Human Human N/A
1 Driver Assistance Either steering or speed control assistance Human & System Human Human Some Modes
2 Partial Automation Steering and speed control assistance System Human Human Some Modes
3 Conditional Automation Auto steering & speed control - human backup System System Human Some Modes
4 High Automation Automated control - limited human intervention System System System Some Modes
5 Full Automation Full automated driving without intervention System System System All Modes
Level 3-4
- human
intervention
may prove
non-viable
2015 20252020 20502030 2040
Passenger Vehicle Trials & Rollout
Commercial Vehicle Trials & Rollout
Initial trials in “closed”
or restricted access
zones & at low speed
= Functional Certification Achieved
Closed Environment Trials
Mixed Environment Trials
Restricted Inner City Zones
First AV services in restricted
inner city zones – convergence
of public/private transport
First use of fully autonomous
capability in city “zones” restricting
access to conventional vehicles
Mixed Inner City Zones
Mixed Auto/Human
Automated Goods Supply
LGV Inner City Deliveries
LGV Inner Delivery Trials
HGV Platooning Rollout
HGV Platooning Trials
HGV Platooning first semi-
autonomous mode to be
certified and implemented

© Ricardo plc 2017 November 2017 40
A Vision of Future Mobility – Fully co-operative, multi-modal on-
demand systems – Public & Private transport converges….
Fully
Autonomous
Multi-
Connectivity
Self
Parking
On-demand
Availability
Auto Charging
(Inductive)Co-operative
PlatooningZero
Crashes
Utility on
Demand
Source: General Motors / Shanghai Expo