fusionreactor - fusioncloud overview
TRANSCRIPT

Introducing FusionCLOUDGoing way beyond traditional Application Performance Monitors
For more information – please contact [email protected]
FusionCLOUD Features• CLOUD Dashboard – very configurable, thresholds, grouping servers
• Bi-directional secure channel (SOCKET) – Ability to send requests down to your
server e.g. Stack Trace / Garbage Collection / Execute script
• Application view – generated from individual or clustered servers
• Application broken down by %Time taken, Average, Slowest, Throughput, #Errors
• Automatic identification of „interesting transactions“
• Ability to SAVE requests, transactions, stack traces, JDBC
• Server Metrics, Transactions, Requests, JDBC
• Alerting Engine for email, PageDuty, HipChat, Email, Slack, OpsGenie , VictorOps,
FLOWDOCK, Twilio, IRCCAT etc.
FusionCLOUD Facts• Hybrid Solution – FusionReactor on-premise + FusionCLOUD (optional)
• Infrastructure runs on AWS
• Beta has been running for around 12 months – now migrating beta users „soft
rollout“
• Licensing Model
– CLOUD – Server Reservations combined with On-demand (similar to AWS)
• Editions available –
– Enterprise – Multi-Server, Advanced Reporting, Mobile Client, Enterprise Scripting
– Ultimate – Production Debugger, Production Profiler, Production Memory Analyzer (TBA)
• Pricing
– Enterprise - $99 month / $990 year
– Ultimate - $149 month / $1490 year

Copyright Intergral GmbH 2016
FusionCLOUD Dashboard allows servers to be grouped together. Servers can be
highlighted to show more details, as well as being placed into „Live“ mode – and being
updated in real time
Different views are available, showing more and less details. This is the server list view.
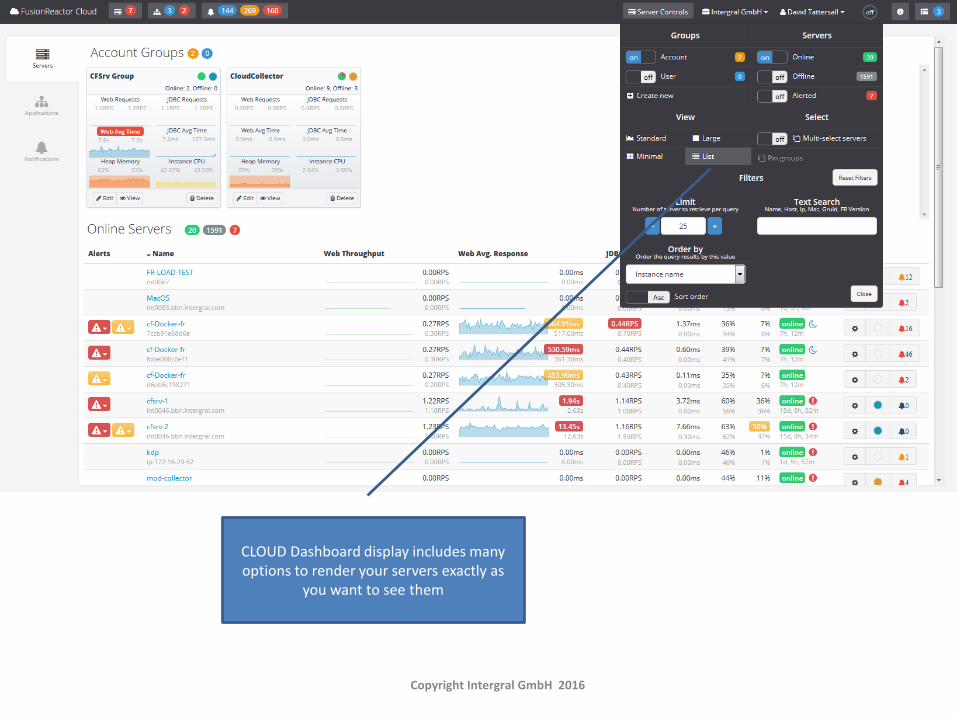
CLOUD Dashboard display includes many options to render your servers exactly as
you want to see them
Copyright Intergral GmbH 2016
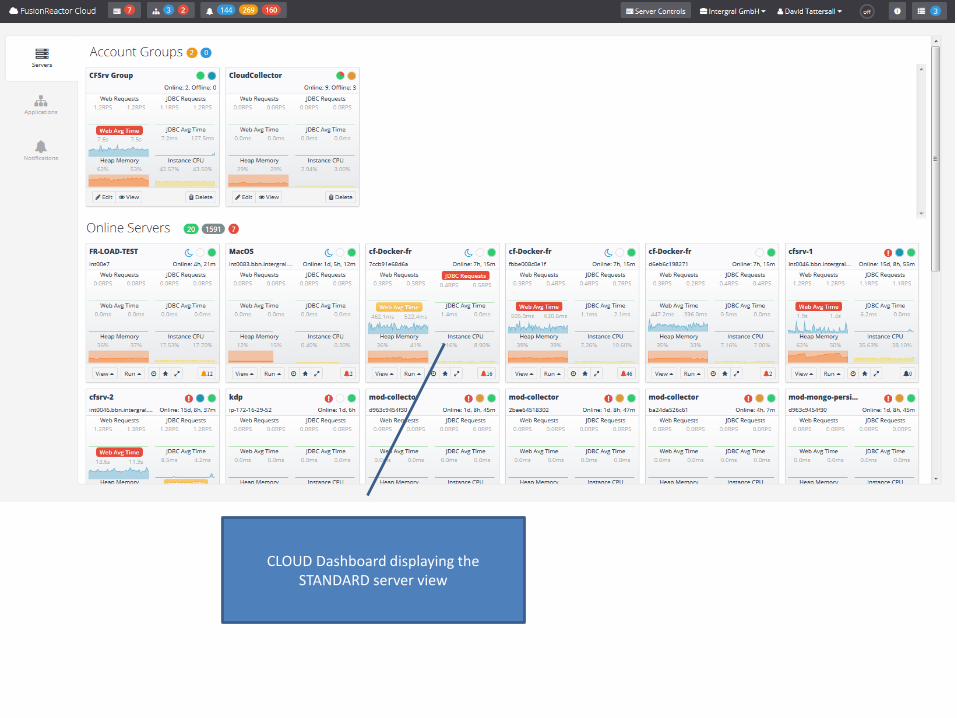
CLOUD Dashboard displaying the STANDARD server view

The Application view provides a combined image of how registered applications are
performing. Clicking on the Errors will take you to a detail page showing a list of issues
for rapid identification
Copyright Intergral GmbH 2016
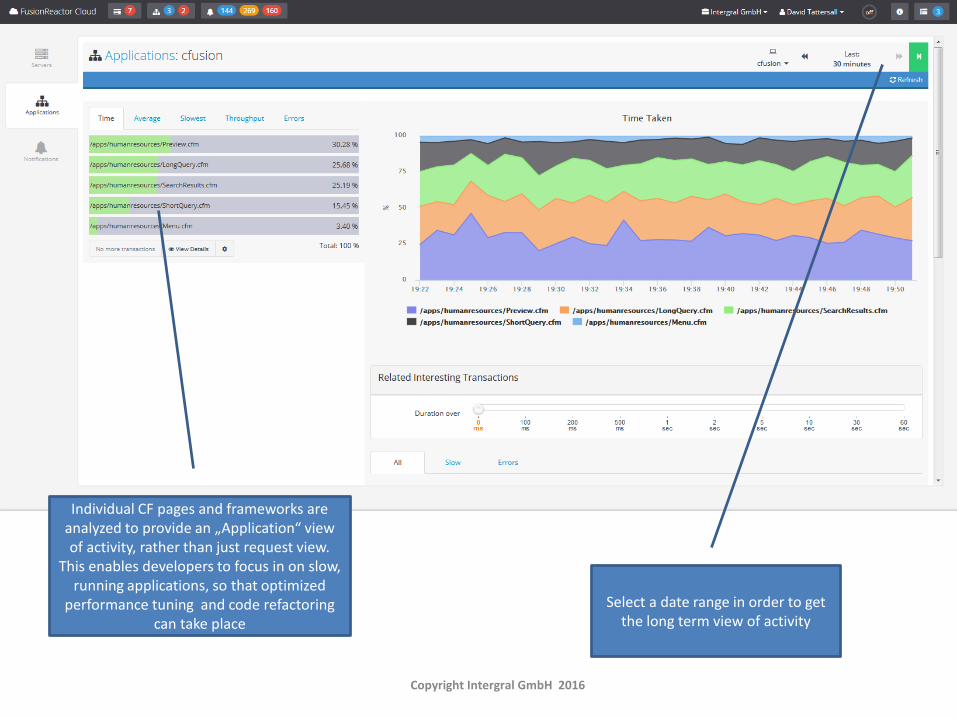
Select a date range in order to get the long term view of activity
Individual CF pages and frameworks are analyzed to provide an „Application“ view of activity, rather than just request view.
This enables developers to focus in on slow, running applications, so that optimized
performance tuning and code refactoring can take place
Copyright Intergral GmbH 2016
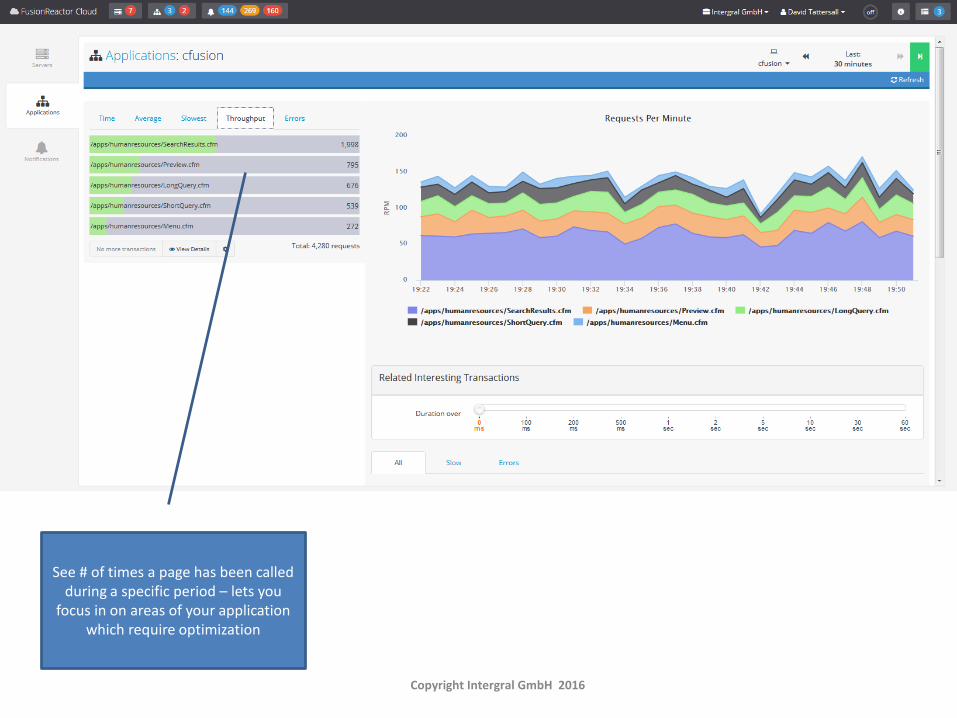
See # of times a page has been called during a specific period – lets you
focus in on areas of your application which require optimization
Copyright Intergral GmbH 2016

Get a breakdown of different groups of requests e.g. Currently Runninf, Slow, Erroneous, Stack Traces etc.
Drill into more details or save a request for later analysis
Copyright Intergral GmbH 2016
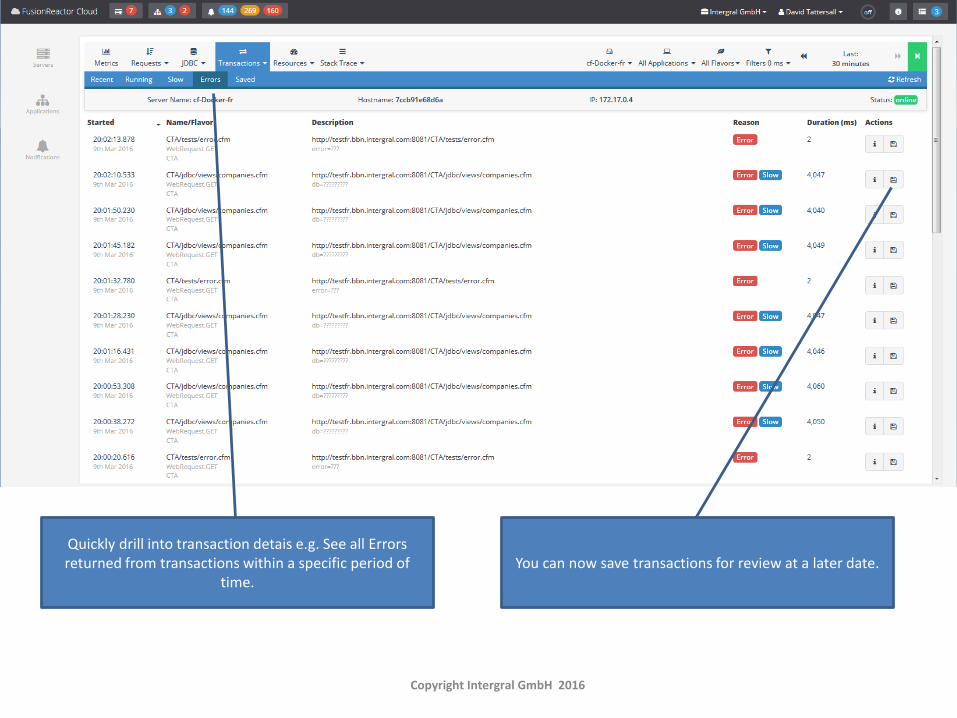
Quickly drill into transaction detais e.g. See all Errors returned from transactions within a specific period of
time. You can now save transactions for review at a later date.
Copyright Intergral GmbH 2016
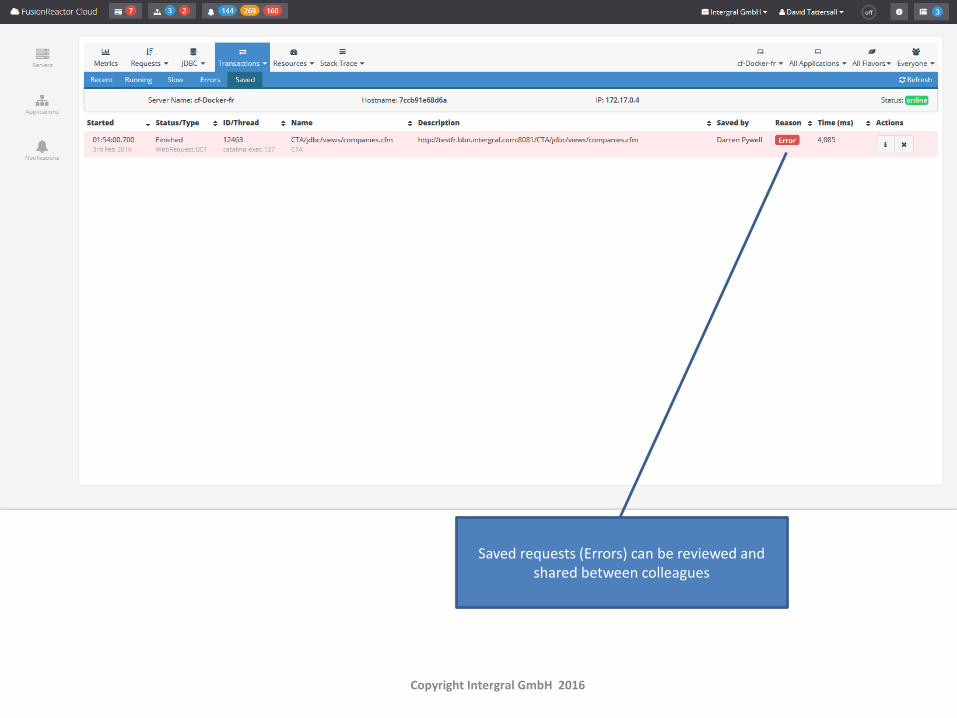
Saved requests (Errors) can be reviewed and shared between colleagues
Copyright Intergral GmbH 2016
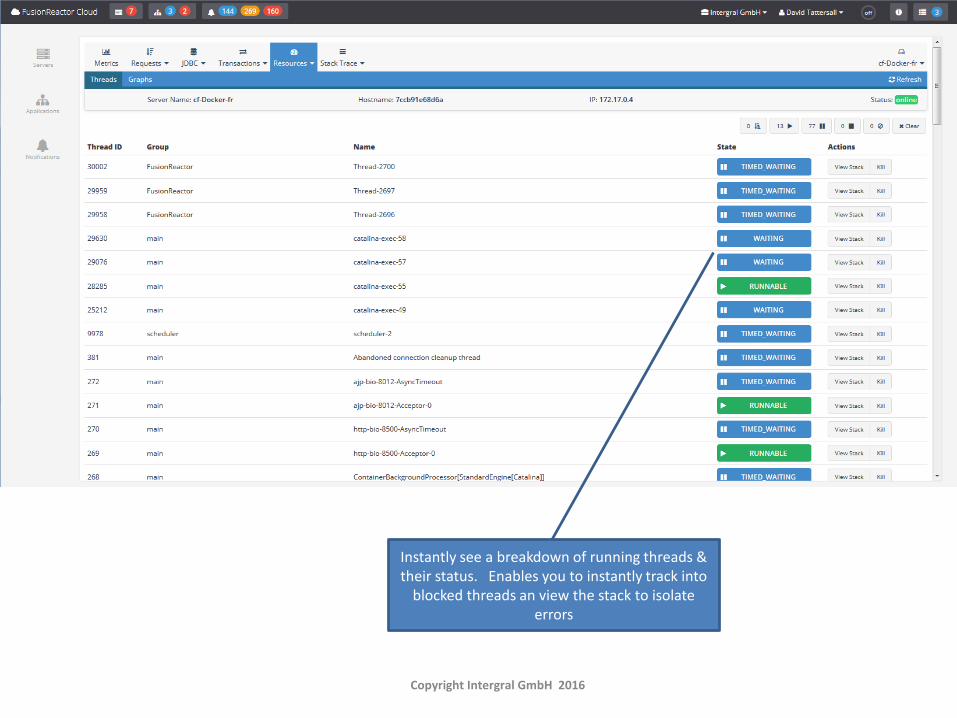
Instantly see a breakdown of running threads & their status. Enables you to instantly track into
blocked threads an view the stack to isolate errors
Copyright Intergral GmbH 2016
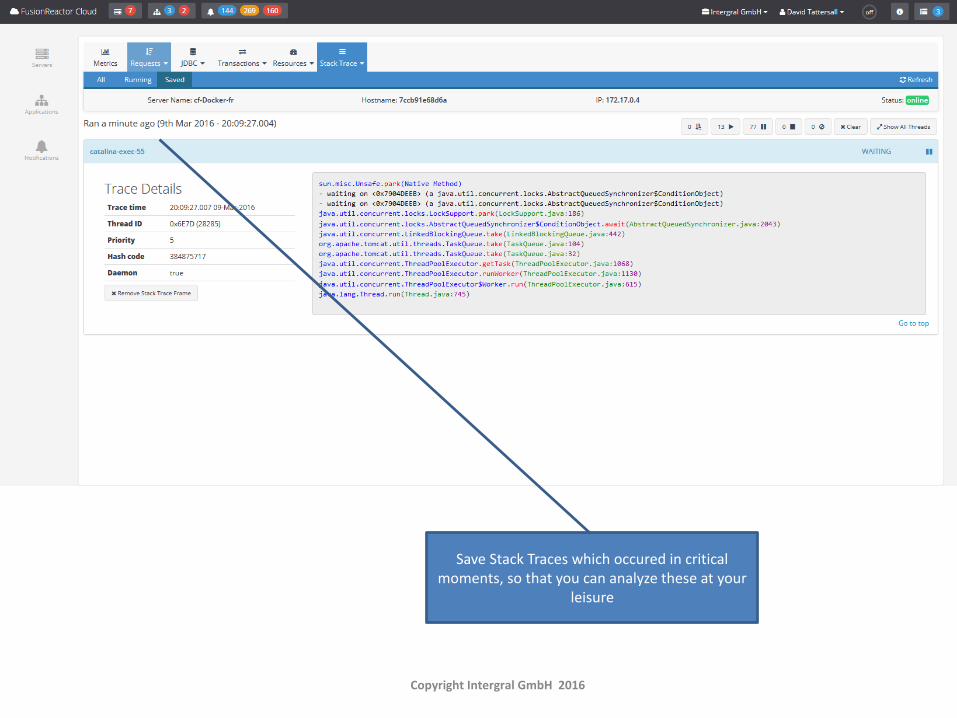
Save Stack Traces which occured in critical moments, so that you can analyze these at your
leisure
Copyright Intergral GmbH 2016
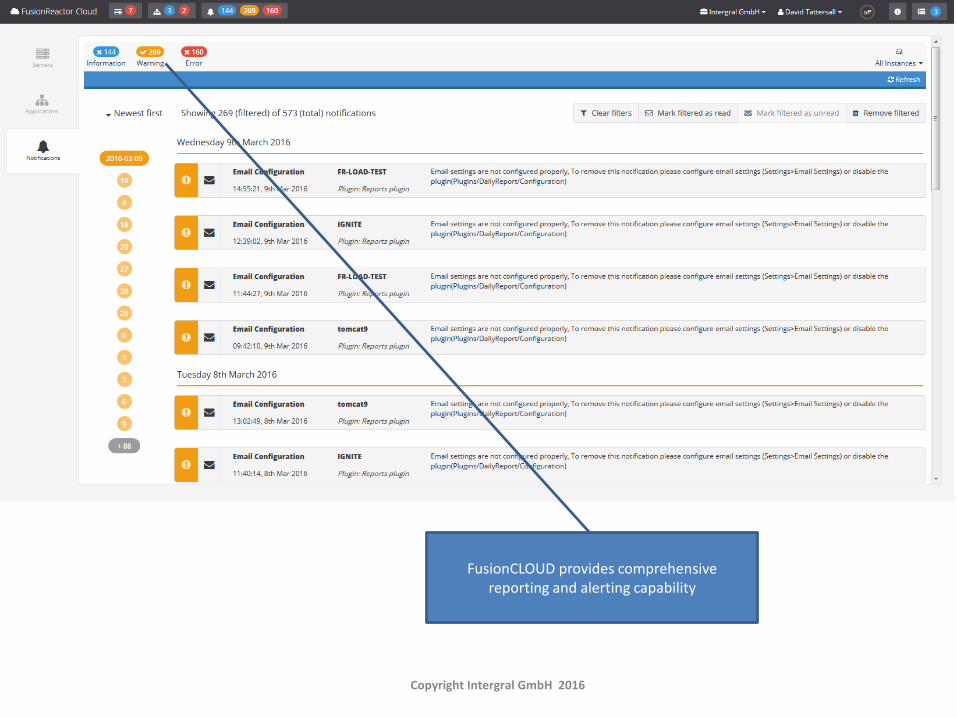
FusionCLOUD provides comprehensive reporting and alerting capability
Copyright Intergral GmbH 2016
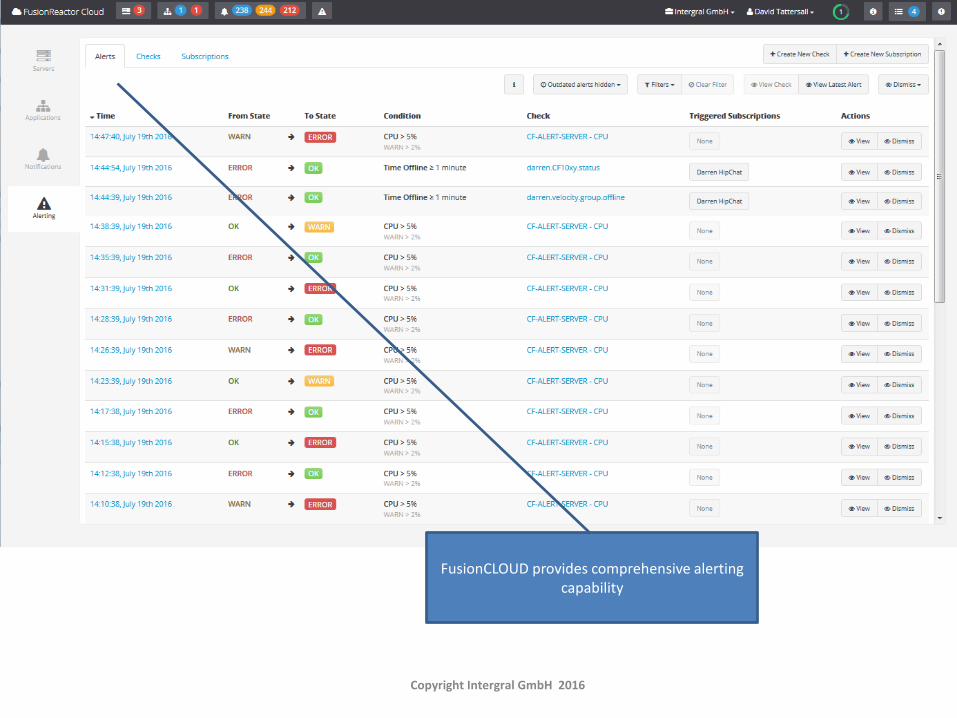
FusionCLOUD provides comprehensive alerting capability
Copyright Intergral GmbH 2016
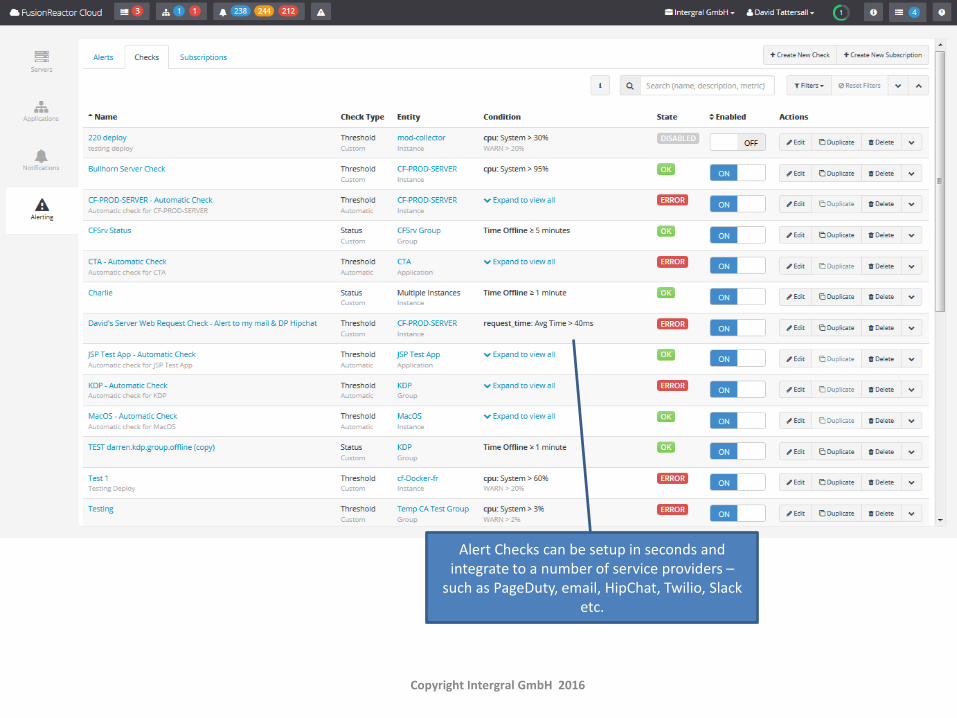
Alert Checks can be setup in seconds and integrate to a number of service providers –
such as PageDuty, email, HipChat, Twilio, Slack etc.
Copyright Intergral GmbH 2016