fusion research center - digital library/67531/metadc677726/m2/1/high... · fusion research center...
TRANSCRIPT

FUSION RESEARCH CENTER
DOE/ER/542-41-145 FRCR #464
Optimization of a Mega-Ampere Spherical Tokamak for Beta-Limit and Confinement Studies
S. C. McCool, A.J. Wootton, R.V. Bravenec, G.G. Castle, P.H. Edmonds, K.W. Gentle, J.W. Jagger, B. Richards, David W. Ross, William L. Rowan, E.R. Solano
P.M. Valanju, R.R. White
Fusion Research Center The University of Texas at Austin
Austin, Texas 78712
October 1, 1994
THE UNIVERSITY OF TEXAS
Austin, Texas

Portions of this document may be illegible in electronic image products. Images are produced from the best available original document.

DISCLAIMER
This report was prepared as an account of work sponsored by an agency of the United States Government. Neither the United States Government nor any agency thereof, nor any of their employees, make any warranty, express or implied, or assumes any legal liabili- ty or responsibility for the accuracy, completeness, or usefulness of any information, appa- ratus, product, or process disclosed, or represents that its use would not infringe privately owned rights. Reference herein to any specific commercial product, process, or service by trade name, trademark, manufactum, or otherwise does not necessarily constitute or imply its endorsement, recommendation, or favoring by the United States Government or any agency thereof. The views and opinions of authors expressed herein do not necessar- ily state or reflect those of the United States Government or any agency thereof.

Optimization of a Mega-Ampere Spherical Tokamak for Beta-Limit and Confinement Studies
S.C. McCool, A.J. Wootton, R.V. Bravenec, G.G. Castle, P.H. Edmonds, K.W. Gentle, J.W. Jagger, B. Richards, David W. Ross, William L.
Rowan, E.R. Solano, P.M. Valanju, R.R. White
Fusion Research Center University of Texas Austin, TX 78712
October 1994

Executive Summary
In the draft whitepaper summarizing the Spherical Tokamak workshop held at ORNL in July, 1994 and proposing a mega-ampere class national ST, a number of device requirements are stated in order to address the relevant physics issues. These include P m = 4-10 M W using Do+D+ to study P-limit and confinement scaling at low A=b/a. Also implied is that this device should allow for a very long pulse -10-100 sec. upgrade to study heat flux handling in plasma facing components. In this note, we will demonstrate that with appropriate device and parameter optimization, it is unnecessary and even undesirable to meet these requirements. In fact, all of the relevant physics issues can be adequately addressed with P m e 3.5 MW (4 M W in most cases), HO+D+, and with a pulse length of less than 0.5 sec. This is accompanied by significant cost savings and greatly improved diagnostic and experimental access.
To design a next-step ST which can attain all of the physics goals for minimal cost, we have developed a transport scaling and device optimization code. This code, STOP, includes 10 empirical confinement scaling laws and has been benchmarked against START. A key result is that the required PNB is sensitive to the achievable density limit, and an important realization is that it is advantageous to optimize parameters separately for each scaling law and for each physics goal. Using STOP we find we can achieve pN=5 with p ~ ~ d . 7 MW worst case, (p)=3 144% with Pm12 M W , and study predicted confinement degradation with auxiliary heating power. In particular ZE OH/ZE ~ ~ = 2 . 7 - 1 1 with ~.~<PNB/PoH<~~ using just two beams for 1,20.75 MA, and b20.6 m. In contrast, if one insists on using the nominal device parameters in each case, e.g. I,=l.O MA, Ro=0.8 m, achieving pN>5 typically requires Pmz7.5 W.
With only two neutral beams one can also study the scaling of p ~ = 5 , high (p), and auxiliary heating confinement degradation vs. aspect ratio for A=l.2 to 2.0. The proposed device will typically exceed the empirical H-mode power threshold by a factor 125-40, but by running high n, and BT in H or He with low POH (Ip=0.75 MA), one can just reach L- mode. We also conclude that while running D%D+ produces a -25% increase in ZE (which is already uncertain by a factor of 2-3), one incurs restricted machine access due to activation and tritium contamination, compromised physics operation, complicated machine and diagnostic operation and maintenance, and increased cost. Also we find it is not advisable to constrain the device design to study steady-state heat flux handling. These issues are not specific to low A, and will be addressed on TPX and ITER. The proposed device is not a volume neutron source. It is a physics experiment designed to explore the low aspect ratio regime.

Abstract
Recent favorable results on the START experiment have caused
renewed interest in the potential of low aspect ratio tokamaks. To aid in
designing a next-step spherical tokamak to study confinement scaling, high
beta, and high normalized beta plasmas for minimal cost, we have developed a
transport scaling and device optimization code. This code STOP, benchmarked against START, includes 10 empirical confinement scaling laws
and essential tokamak physics such as stability limits. Parameters are
optimized separately for each scaling law and physics goal. Using STOP we
find for R/a=1.2 to 2.0 one can achieve P N = ~ , (P)=31-44%, and easily study
predicted confinement degradation with auxiliary heating with just two neutral
beams ( P N B < ~ . ~ MW) for $20.75 MA, and h20.6 m. In contrast, if one
insists on using the nominal device parameters, Le. Ip=l MA and h=0 .8 m, with each scaling law, achieving P N = ~ requires typically P ~ p 7 . 5 MW. We
also conclude that while running Do+D+ increases ZE =25%, with ZE already
uncertain by 2 - 3 ~ , one incurs restricted machine access and compromised physics operation.

2
Introduction
As a result of the recent favorable results of the START spherical tokamak [A. Sykes, et al., Plasma Phys. Control. Fusion 35 (1993) 10511, there has been renewed interest in building a next-step spherical tokamak. Ideally this device will be carefully optimized to address all of the relevant physics at minimal cost. In this paper we describe a first attempt at device optimization to address a specific set of physics goals which have been previously proposed, namely the study of confinement scaling, high beta, and beta-limits at low aspect ratio. To aid in designing this device, we have developed a transport scaling and device optimization code. This code STOP, benchmarked against START, includes 10 empirical confinement scaling laws and essential tokamak physics including stability limits. Parameters are optimized separately for each scaling law and physics goal.
Using STOP we find for lUa=1.2 to 2.0 one can achieve P N = ~ , (p)=3 1-44%, and easily study predicted confinement degradation with auxiliary heating with just two neutral beams ( P ~ ~ e 3 . 5 MW) for Ip20.75 MA, and Ro20.6 m. In contrast, if one insists on the nominal device parameters, Le. I,=l MA and Ro=0.8 m, in each case, achieving p ~ = 5 requires typically P ~ p 7 . 5 MW. We also conclude that while running Do+D+ increases ZE =25%, with ZE already uncertain by 2-3x, one incurs restricted machine access and compromised physics operation.
This study is merely a first iteration in the design of a mega-ampere spherical tokamak, and primarily demonstrates the advantages of carrying out such device optimization. By optimizing the machine configuration for the various scaling laws and physics issues, we can significantly reduce the required beam power and cost of the experiment. A more complete analysis of the physics goals themselves and a more refined device optimization will be described elsewhere.
In this paper we will first describe the device optimization and transport scaling code we have developed and benchmarked against START data and more elaborate predictive studies. Then in section 2 we will discuss optimized operating scenarios developed to study the Troyon p- limit and plasmas with high volume average p at low aspect ratio. In

section 3, requirements for studying potentia
3
confinement degradation with auxiliary heating will be addressed. In section 4, the issues of relative confinement and H-mode power threshold for HO or DO neutral beam operation will be discussed along with operational and physics considerations of running with Do+D+. Section 5 will describe optimized scenarios for studying the L-H transition and H-mode enhanced confinement, and finally in section 6, the issue of long pulse operation and relevant time scales will be addressed. The expressions we have used for empirical confhement scaling laws and other related formulas are given in an appendix.
1. Device Optimization Code
We have constructed a preliminary spherical tokamak optimization
program STOP based loosely on Bill Nevin's spreadsheet [W.M. Nevins,
TPX DOC#93-9305 12-PPPL/G.Neilson-0 1 and private communication],
which incorporates numerous confinement scaling laws, and operational and stability limits. It accepts as input A, R, K, Ip, BT, (ne), Zeff, working gas, H-factor, and Paux. It computes qcyl and qv from Peng's formula
(essentially identical to the ITER formula, see appendix), plasma resistivity
from a Spitzer-like formula scaled to START data, and it self-consistently computes for ten different scaling laws Te(0), (Te), ZE, p, PN, and a
number of other quantities. The ion temperature is approximated as Ti(r)=(0.6 + 0.4 PNB/POH)Te(r) to account for Ohmic or neutral beam
heating. This expression doesn't correctly account for the variation of
electron-ion collision frequency with density, but it approximates experimental observations for PNB=O and PNB=PoH.
The code has been benchmarked against START confinement data and analysis, and against Princeton's analysis of PSTX. It has also been
checked against a Mathematica implementation of the confinement scaling laws. This code is essentially zero-D, but it does use appropriate
temperature and density profiles Te = ( l-p2)OLT, and ne = (1-p2)OLn, and
volume averaged quantities accounting for elongation and triangularity where applicable.

4
1.1 Density Limits STOP also checks or enforces the Greenwald and/or Hugill density
limits. This is an important issue because the maximum achievable beta,
with a given neutral beam power, can be a fairly sensitive function of the
density limit. The Greenwald limit is ne 20 < IP(MA)/na2 and the Hugill
limit is ne20 c hBT/R,q with h=2 [ITER Physics, D.E. Post, et al.,
IAEA/ITER/DS/21 ITER Doc. Series, IAEA, Vienna (1991)], where Ee 20 is the chord average density in 1020 m-3. If the expression for qcyl is
substituted for q in the Hugill limit, the Greenwald and Hugill limits are
found to differ by a factor involving only K and 6 with the Greenwald limit
the more optimistic of the two for 101.23 by a factor of approximately
0.40( 1 The physics basis for the density limit is generally
understood [ITER Physics Report] to be an edge density and radiation limit. A more sophisticated physics based analysis due to Borass [NET Report 95, EUR-FU/80/89-95] predicts a density limit for ITER lying
between the Hugill and Greenwald limits, with H-mode discharges coming
closer to the Greenwald limit. The Borass model is, however, extremely
difficult to apply, especially since so many details of the scrape-off layer in
spherical tokamaks remain unknown.
A recent study of the density limit on DIII-D [Petrie, Nucl. Fusion 33 (1993) 9291 demonstrates that the Hugill limit does not adequately
represent the DIII-D data. In particular, the unfavorable scaling of the Hugill limit with K was not observed when K was varied at constant q95.
On the other hand, the Greenwald limit when multiplied by 0.80 accurately predicts the density limit for all conditions in DIII-D as long as Zeff12. The density limit is degraded at higher Zeff. It remains to be demonstrated
if the more favorable K scaling of the Greenwald limit holds at low aspect ratio. Data presented by Sykes at the July '94 ST Workshop at ORNL shows that START seems to be restricted to the Hugill limit taking q=qcyl. We observe that for this data, if one were to take q=qV, START would
exceed the Hugill limit by a factor of 2 to 4. Either q=qcyl is the correct
choice, or the Hugill limit is not applicable at low A. We also observe that

much of the START high density data was taken with ~ 4 . 4 . For this value of K, the Greenwald limit is only 18% higher than the Hugill limit. Also with START'S internal coils, it seems likely that typically Zefp2.
Once again we find that the Greenwald limit is attained to within 20%. Unless stated otherwise, for the optimization cases presented here,
we have used 80% of the Greenwald limit, as an attainable density limit.
The effect of assuming the more pessimistic Hugill limit is also discussed.
We also point out that in many experiments [TFTR, Terry, 1990 IAEA
paper A-5-51, it has been possible to even exceed the Greenwald limit by as
much as a factor of two with pellet fueling.
1.2 Scaling Laws, Resistivity, and Parameter Range STOP includes 10 empirical confinement scaling laws including,
Ohmic, L-mode, and H-mode laws. The scaling laws used are Neo- Alcator, DIII-D-OH, Dissipative Trapped Electron Mode DTEM, Lackner-
Gottardi, Rebut-Lallia, Goldston L-mode, ITER89-P, DIII-D-JET, Kaye-
Goldston, and Kaye-all-complex. We also comment on the implications of
Goldston's OH-L-mode quadrature scaling law. The expressions used and
references are given in the Appendix. Confinement scaling laws have been modified where necessary to incorporate mass scaling and an H factor.
Note that the DIII-D-JET scaling law (see the appendix) is reduced from its
built-in H-factor of 2. N.B. For the Lackner-Gottardi scaling law, we have used q=qcyl
except where noted. In Lackner, et al., Nucl. Fusion 30 (1990), 767, it is stated explicitly that q=qcyl and chord average density were used in
obtaining this scaling law. Also, Lackner-Gottardi was based on deuterium
discharges, so the correct mass scaling factor (following the prescription of N.A. Uckan, Fusion Tech. 15 (1989) 391) is d z n o t & We have
added a factor of d m t o the published expression to account for this.
Some groups have optimistically used q=qV, which may in fact better
represent results at low A, but it is not supported by the original reference. Note that in publications from the START group [e.g. A. Sykes, et al.,
Plasma Phys. Control. Fusion 35 (1993) 10511, which refer to Lackner-
Gottardi, they have actually used the Connor-Lackner-Gottardi formula
which is a generalization for finite a/R and triangularity [M. Walsh, private
communication] which is approximately equal to the usual Lackner Gottardi expression with no mass scaling, but with q=qw.
A significant uncertainty at low aspect ratio is the plasma resistivity.
A neoclassical physics based expression must include the effects of trapped
particles and bootstrap current, but these are strongly profile dependent.
In this code a Spitzer-like expression calibrated to START has been
employed. The resistivity formula used here may not be valid at low A but
since it has been calibrated against START data it should be close. If the
loop voltage is lower than we estimate, Ohmic heating would be less
efficient, but longer OH pulses would be practical since volt-second
consumption would be reduced.
The purpose of this code is to assist in device optimization for specific physics goals. In order to minimize cost without compromising
any of the physics goals, we allow for slight variations in plasma
parameters (consistent with a single physical device). For example, to achieve high p, it is desirable to run at a reduced toroidal field. We have somewhat arbitrarily chosen B ~ = 0 . 3 T as a minimum practical toroidal
field. While it is unknown what the effect of field errors will be in the proposed device, we note that CDX-U has operated with B~=0.04 to 0.16 T
[Y.S. Hwang, ORNL ST Workshop July 19941. The "reasonable" range of
parameters and constraints we have assumed for a mega-ampere class
spherical tokamak are given in the following table.
6

Parameters and Constraints of a 1 MA Class ST
A = 1.33 - 1.7 for "low"-A Ohmic operation, AS2 for scaling
Ro > 0.55 m
Ro+a c 1.5 m (outer wall of vacuum chamber)
experiments, A=1.2 - 1.7 with current drive
Note: the plasma would be limited on the outside as necessary with a
movable limiter.
for 4 MA OH solenoid + wall + tiles, from preliminary engineering
Ro-a > 0.20 m
Ro-a > 0.10 m
TF core + wall + tiles without OH solenoid, using non-inductive
current drive only
~ = 1 . 5 (3 R0=0.9 to ~ = 2 . 3 (3 Ro=0.55 m to approximately account for
the natural increase in elongation observed in EFIT equilibrium runs
1.4 I IC S Kfit= -2.29 Ro + 3.56
2 ~ a c height of vacuum chamber (= 2 x 1.2 m) 6=0.3 based on preliminary equilibrium runs
0.3 T < BT
-20 < Ip(MA)/na2 = KJ - 1.26 h
Profile shapes an=0.70 and OCT= 1 .O assuming profiles:
An H factor is applied to L-mode scalings as long as Ptot > Ptbesh:
H=1.6 for H O + D+ or HO 3 H+ (see analysis below)
H= 2 for DO + D+ Zeff = 2 and dilution ni/ne = 0.7
Ip=0.75 - 1.2 MA
0.504/Ro (assuming 12 turns, ITF< 210 kA)
clym > 3 - - (Greenwald Limit)
I (MA)/na2 (Hugill limit) ne20 < h B T / R O q 1 + K 2 p
Te=Teo( l - ~ 2 ) ~ T , and Q=neo( 1-p 21%
8
2. Optimization for High J . ~ N and Volume Average P In order to test MHD theory at low aspect ratio, we want to be able
to produce plasmas with high p such that the volume average (p) in principle exceeds the predicted Troyon limit. That is
where the Troyon-limit PN = 5 at low aspect ratio [R.L. Miller's talk at the July '94 ORNL ST workshop] and
2.1 Scenario to Test the Troyon Beta-Limit
Using the constraints and reasonable operating parameters in the
range listed above, and assuming an H-factor of 1.6 consistent with HO + D+, we have used this code to determine the optimum plasma configuration
for each scaling law. We have also done some sensitivity studies noting for
example that for Lackner-Gottardi, RLW, and Kaye-Goldston, the power
required to reach p ~ = 5 is a strong function of the achievable plasma
density limit. For all of the scaling laws, J.3 increases fairly slowly with
Paux, so doubling J.3 is very expensive.
For each of the scaling laws it is possible to achieve p ~ > 5 with a
total input power (including Ohmic) of under 4 MW. This requires less
than 2.7 MW of NB power ( ~ 1 . 8 MW in every case except Neo-Alcator
and Goldston-quadrature with q=qcyl). This is done in most cases by
reducing BT to 0.3 T and R to 0.6 m. If one assumes that qw (rather than
qcyl) is the appropriate q to use in Neo-Alcator, Lackner-Gottardi, and
Goldston-quadrature (which seems likely from our analysis), p ~ > 5 can be
achieved with Ptot e 2.5 MW in every case. If the achieved H factor
reaches 2, due for example to running D beams, if we can run with BT e
0.3 T, if elongation can be favorably controlled, or other constraints are

slightly relaxed, it should be possible to investigate the p limits at low
aspect ratio for any of the scaling laws with Ptot e 2 M W .
As an indication of the sensitivity of these results to the density limit,
we have re-optimized the plasma conditions to achieve PN>5 while
restricting the density to the Hugill limit (which is not thought to be a real
limit [Petrie, Nucl. Fusion 33 (1993) 9291). The neutral beam power
required to achieve the P-limit goes up in nearly every case. Only Neo-
Alcator and Lackner-Gottardi require PNB>3.5 MW (4.8 MW and 4.25
MW respectively). However, this is using q=qcyl in the scaling law. If
q=qv is used, which is necessary to fit the START data, the required power
drops below 2 MW. Alternatively, it would be possible to reach the p- limit with these two scaling laws by dropping I, to 0.55 MA.
Note that if we insist that the nominal device parameters of Ro=0.8 m, A=1.45, I,=l MA, B ~ = 0 . 5 T, (ne 20)=0.5, and ~ = 1 . 6 are used in each
case, we pay an enormous penalty. In this case, even assuming an H factor
of 2, an average neutral beam power P N B = ~ . ~ MW is required (ranging
from 2.4 to 18 MW for the various scaling laws) to achieve p~=5.0. This
is consistent with the device requirements specified in the draft whitepaper.
But, by optimizing the machine configuration for the various scaling laws
and physics issues, we can significantly reduce the required beam power
and cost of the experiment.
In the following table and graph, some parameters have been more
tightly constrained than in the table above, namely b 2 0 . 6 m, Ip=0.8 to 1.0
MA, and AS1.52. The neutral beam power has been restricted to the cases
1.25, 2.0, 2.5, and 3.5 M W . These powers are achievable with a single
ORNL beam, a single LLNL beam (at reduced beam energy and current),
2 ORNL beams, or an ORNL beam + a LLNL beam respectively.

scaling Law
Neo-Alc
Kaye-all
Lack-Gott
RLW
Gold-L
Kay e-Gold
DIII-ET
ITER89-P
DIII-D-OH
Optimized Plasma Parameters to Achieve PN > 5.0
R(m) A I, BT be20) (MA) cr>
0.60 1.50 0.8 0.3 1.01
0.73 1.38 1 0.3 0.72
0.61 1.49 1 0.3 1.21
0.75 1.38 1 0.3 0.69
0.60 1.52 1 0.3 1.30
ZE PN (P) PNB , (ms) (%Io)
16.6 5.17 34.5 3.5
49.2 5.08 32.0 1.25
~ 40.3 5.05 41.2 1.25
170.2 5.15 31.6 1.25
~ 36.9 5.03 42.5 1.25
0.75 11.39 11 10.35 10.70 164.8 15.08- 126.9 11.25
~ ~~- ~ ~~ ~ ~
I
I 0.73 1.38 1 0.3 0.72 45.0 5.09 32.1 1.25
0.75 1.38 1 0.4 0.86 116.8 5.67 26.1 1.25
h o t
4.64
2.12
2.40
1.95
2.50
1.96
3.04
3.04
2.16
1.72
2.2 Beta-Limit Scaling with Aspect Ratio To ascertain that the P-limit can be studied over a range of aspect
ratio, we have determined the neutral beam and total power required to reach P N = ~ for A=1.2 - 2.0 assuming Lackner-Gottardi scaling (which has been compared favorably to START). The low aspect ratio limit would of course require non-inductive current drive and a low-A center core. The following parameters were chosen to allow this range of A while maintaining qv>3: R0=0.62 m, iIez0.8 Ip/7ca2, Ip=0.9 MA, and B~=0.3 T but increased gradually to 0.71 T as required to keep qv>3. As the graphs below show, P ~ c 3 . 3 5 M W (1.8 MW assuming q=qv) is required over the entire range of A. The power required, with q=qcyl, drops as A is increased from 1.2 because PN increases linearly with l/a. However when the q-limit is reached, the decrease in PN with increasing BT dominates. The conclusions are that two beams are adequate to reach the P-limit for any scaling law, and for Lackner-Gottardi even with q=qcyl this is true for 1.2 I A I 2.0.
10

Graphs of PNB and Ptot vs. A to reach PN=5 for Lackner-Gottardi Neutral Beam Power Required
for PN=5 versus Wa
Total Power Required for PN = 5 vs. R/a
5w
f a- U 0
- -I - -
- __.___.. i ...................... i ............. ~ ____..--
a
- - - - 0 I
I
- I I
I I
I I
I I
1 1.2 1.4 1.6 1.8 2 2.2
R i a

2.3 Scenario for Achieving Maximum Volume Averaged Beta
In this section we investigate optimizing plasma parameters to maximize absolute volume average beta (p). In general, to maximize (p) for a given heating power, the major radius is decreased to minimize plasma volume. Then the aspect ratio is minimized, constrained by the center core, to allow the greatest I, before the q limit is reached. Note that Ohmic heating is the most efficient way to increase p since an increase in I, allows higher plasma densities to be achieved. Once the qv limit is reached, neutral beam power can be added until p ~ = 5 .
In the table shown below, we have restricted ourselves to Ro = 0.6 m, A = 1.5, I, = 1.07 MA (to keep qv>3), B~=0 .3 T, and PN < 5 for stability. These studies indicate that with PAUX I 2 M W , a mega-ampere ST should be able to achieve (p) > 30% (44% except for Neo-Alcator, DIII-D-JET, and Goldston-quadrature) for any of the ten scaling laws studied. Since we used the same I,, a, and BT in each case, all of the scaling laws reach the same value of (p) = pNIp/aBT for p ~ = 5 . For Neo- Alcator and DIII-D-JET we are unable to reach p ~ = 5 with P N B = ~ MW, for the conditions specified. For kLW and Kaye-Goldston which can reach P N = ~ with Ohmic heating alone, it is necessary to reduce the density to avoid reaching the P N = ~ limit with less than the maximum I, dictated by the qw<3 limit. We conclude that if any of these empirical scaling laws are valid at low A, this device should achieve a volume average beta in excess of 30%. This compares very favorably with the maximum (p) achievable in present high aspect ratio tokamaks.
12

13
Optimized Plasma Parameters to Achieve Maximum { p) Ro = 0.6 m, A = 1.5, I, = 1.07 MA, B ~ = 0 . 3 T
Neo-Alc 11.35 116.6 13.54 .I 31.6 12 14.25
Lack-Gott 1.35 44.7
RLW 1.19 114.2
Gold-L 1.35 38.9
Kaye-Gold 1.15 119.8
DIII-JET 1.35 23.3
ITER89-P 1.35 32.4
DTEM 1.64 42.9
DIU-OH 1.49 57.3
4.99
4.98
4.99
4.99
4.38
4.99
4.98
4.98
44.5 0.9 2.22
44.4 0 0.87
44.5 1.2 2.54
44.5 0 0.83
39.1 2 3.74
44.5 1.6 3.06
44.4 1 2.30
44.4 0.5 1.73

14
Chart of Optimized Volume Average Beta for each Scaling Law
Neo- Kaye- Lack- RLW Gold- Kaye- Dlll- ITER- DTEM Dlll Alc all Gott L Gold D-JET 89-P OH
Scaling Laws
2.4 Scaling of (p) and PN with R/a for P N B = ~ . ~ MW
We conclude this section on P and P-limit optimization by examining the scaling of (p) and PN with aspect ratio for fixed P N B = ~ . ~ MW and assuming Lackner-Gottardi scaling with q=qcyl. As above in the analysis of p-limit scaling with A, we fix Ro=0.62 m, Ti,=0.81p/?ra2, Ip=0.9 MA, and B~=0 .3 to 0.71 T as required for qv>3. The following graph shows that two neutral beams are adequate to achieve PN > 5.0 for A=1.2 - 2.0. PN first increases with A because the minor radius decreases, but it begins to decrease as BT is increased to keep qw>3. (P) has the same qualitative behavior, increasing with A because the plasma volume decreases, and then decreasing as B T ~ is increased. The values of p and PN are higher, or

conversely, even less neutral beam power is required if one uses a smaller
Ro. This analysis demonstrates that with two neutral beams ( P ~ ~ s 3 . 5 MW) and pessimistically using q=qcyl in Lackner-Gottardi, it is possible to reach P N = ~ and (p)=2045% for any A between 1.2 and 2.0.
Graph of (p) and PN vs. A for Lackner-Gottardi with P N B = ~ . ~ M W
z U
Achievable p and PN vs. R/a I I I I I 50 I ! I I I - - - -
- - - 30 ___..___.__._..._..__ tf ___.__.._..._____._ i ___..__....___._.._____ i ___.____.__._._..__ 'tj ..__.____.____ ~ ___... i .._____.___......____
I \ - - i n ; - - - -
- 0 I
I
- I I
I I
I I
I I
1 1.2 1.4 1.6 1.8 2 2.2 Rla
3. Confinement Degradation with Auxiliary Heating
In this section we address the issue of device optimization to study potential confinement degradation with strong auxiliary heating in a low aspect ratio device. Such confinement degradation is predicted by all of the "L-mode" scaling laws having an inverse dependence on Ptot. A basic measure of this confinement degradation is the ratio of Ohmic confinement time to that with strong auxiliary heating ZE OH / ZE N B . This is maximized by starting with a background plasma with reduced Ohmic heating and then injecting maximum beam power (chosen here to be

P N B = ~ . ~ MW). Ohmic power is minimized by reducing Ip and adjusting other parameters for the highest Te to reduce the plasma resistivity. For most scaling laws this involves reducing Ro to minimize the plasma volume, lowering ne and increasing BT. We have restricted ourselves to Ip=0.75 MA, R=O.6 m, AI1.6, 1.45KIKfit, &20=0.38, PNp3 .5 MW. AS is evident in the following chart, it is possible to optimize the plasma conditions even within these constraints to achieve significant confinement degradation ranging from a factor of 2.66 for DIII-D-JET scaling to 11.1 for RLW with 3.5 MW of neutral beam power. RLW which is probably not valid with PNB=O, predicts a very high 2~=200 ms, and hence a high Te, resulting in a low POH with Ip=0.75 MA. In light of the fact that confinement changes on the order of 10% are now considered significant on TFTR, a factor of 2.6 should not be difficult to discern. Goldston- quadrature, which is not strictly speaking an L-mode scaling, predicts a very modest reduction in ZE, approximately 17%, but even this should be detectable. Note also that these optimized cases are strongly into the auxiliary heated regime with 5.6 c PNB/POH c 13. This ratio could be increased further by using non-inductive current drive to replace POH. While Ohmic power has been reduced, these plasma conditions are not extremely far from nominal conditions for this device. This is another example of how careful parameter optimization can yield significant improvement in physics performance.
16

Chart of ZE OH /ZE NB for each of the scaling laws
12-
Qp 10- 2
I 8-
6-
4.
Kaye- Lack- RLW Gold- Kaye- 0111- ITER- DTEM all Gott L Gold D-JET 89-P
Scaling Laws
As before, we also investigate the scaling of confinement degradation with aspect ratio for a single scaling law. For Lackner-Gottardi with Ro=0.7 m, Ip=0.75 MA, B ~ = 0 . 7 T fixed, Ee20=0.38, and P N B = ~ . ~ MW, the ratio of Ohmic to auxiliary heated confinement time versus A is shown in the following graph. As A increases, both a and qcyl drop causing the confinement time = ao.4 qcy10.4 to decrease. However since the plasma volume is decreasing with a2 the temperature increases slightly. Despite the increase in Te, plasma resistance and POH increase slightly with A because the plasma cross section is decreasing with a? The net result is that ZE OH /ZE NB only decreases from 4 to 3.46 as A increases from 1.2 to 2.0. Thus it should be easy to measure confinement degradation due to auxiliary heating at any aspect ratio. We caution that our estimates of the plasma resistance at low A are rather uncertain. If the plasma is much more resistive than we estimate, POH will be increased. However the large predicted confinement reduction makes it extremely likely that confinement degradation will be easily observable. This along with dependencies on

other parameters will make it possible to distinguish between the various scaling laws.
Graph of ZE OH / ZE NB vs. A for Lackner-Gottardi
Confinement Degradation with Auxiliary Heating
Scaling vs. Wa with PNB=3.5 MW
m z W P \ I 0 W
- - - - 3.4 1 I 1 1 I
1 1.2 , 1.4 1.6 1.8 2 2.2 R/a
18
4. Is it Necessary or Desirable to Run DO D+ ?
In this section we consider the merits of running deuterium or hydrogen plasmas and neutral beams. The draft whitepaper states that it is necessary for the proposed mega-ampere ST to be able to run deuterium neutral beams into a deuterium plasma. Here we ask if this is really the case and consider the relative advantages and disadvantages of running D+D+ vs. H+H+ or H+D+.
This question has 4 facets: 1) How does the H-mode power threshold vary for the different plasma and beam species? 2) How does the H-mode confinement time vary for the three cases due to the isotope effect,

19
variation in the H factor, and beam dilution? 3) Do the neutral beams produce more power with D?, and 4) What are the implications of the extra shielding required and operational restrictions incurred by neutron production from D+D+?
First let's examine the data pertaining to confinement issues. DIII-D data [Carlstrom A P S '91 and K.H. Burrell, et al., Plasma Phys. and Contr. Fusion 31 (1989) 1649 3 indicate the following: The power threshold for H+D is about the same as D-D. The power threshold for H+H (or H+He, D+He, He+He) is about twice that of H-D. The energy confinement time for D+D vs. Ip is roughly 1.4 times that for H+D, but the overall scaling with effective mass in DIII-D has been reported to be Ai0.3 [O. Kardaun, Proc. 14th Int. Conf. on Plasma Phys. and Contr. Nucl. Fusion Res., IAEA, Wurzburg, Oct. 1992, IAEA Vienna, 1993, p. 2511 which corresponds to a 25% improvement going from an H to a D plasma. However, GA spent $3 M on neutron shielding to allow them to run D+D. This was necessary in part because the arcs for the long pulse beams must be turned on very early causing a large plasma dilution just from cold gas (not from beam atoms).
ASDEX data [Ryter EPS '94, ASDEX Team, Nucl. Fusion 29 (1989) 19591 indicate that the global confinement time for H+D or H+H is about 0.8 of that for D+D. The H factor was about 2 for D+D and about 1.6 for the other cases. This result is thought to be due partially to the isotope effect and partially to beam species since, unlike in DIII-D, the global confinement time for H+D is about the same as H+H. The L-H power threshold for H plasmas is about twice that of D plasmas. This depends only on target gas, not on beam species.
This data can be summarized by saying that both ASDEX and DIII-D find that the L-H power threshold for H plasmas is roughly twice that for D, and that the threshold is independent of beam species. Hence H+D has the same threshold has D+D. The H-mode energy confinement time on various machines is found to scale with effective mass Ai0.45 (elm-free) or Ai0.4 (elmy) [O. Kardaun, op. cit.] and to be better with D+D than H+D by roughly 25%.

20
Regarding beam operation in D vs. H; because the neutralizer cell efficiency is cross-section (velocity) dependent, it is possible to achieve higher beam energy E >lo0 keV with D. This is important for larger machines, but the proposed ST will experience shine through for E>60 keV. According to Jim Tsai, the ORNL injectors were operated reliably in D during PDX injector development. Injector performance was somewhat more efficient and reliable in D, but the difference in injector operation was insignificant. Shielding was required, however, due to high energy neutrons produced in the beam tanks. At the same energy, D-ion beam current is lower, but the higher neutralization efficiency tends to increase injected neutral power. All things considered, there is very little advantage to running the beams with deuterium.
The following observations also impact our four questions: based on the ASDEX (or C-MOD) H-mode power threshold scaling law discussed below (which might or might not apply to low aspect ratio), the proposed ST will always be in H-mode for reasonable parameters; hence the power threshold issue is moot. Note also that the H factor really only applies to ITER89 scaling (not to other scaling laws). The present H-mode database has essentially no a/R scaling. The bottom line is we might lose up to 25% in confinement time using H+D, but the neutron production will be about a factor of 10 lower. This difference in confinement time is irrelevant compared to the huge uncertainty in confinement time due to variation from one scaling law to another and to extrapolation to low aspect ratio.
Now we address the 4th facet of our question, which is the primary disadvantage of running D+ D; neutron production. Neutrons are produced both by thermal fusion reactions and beam-plasma reactions. The summary of neutron considerations given here relies heavily on GA Report GA-C19537 "Radiation Aspects of DIII-D", Feb. 1989. All sites must comply with NRC lOCFR20 guidelines which dictate a maximum dose rate for the general public of less than 2 mRem/hour and less than 100 mRem/year. Some labs have even stricter requirements. Neutron shielding typically consists of borated concrete or water ranging from 1 to 2 feet in thickness. Due to the phenomenon of skyshine (neutron scattering from air molecules) no gap is permitted between the ceiling and walls, making crane access problematic.
21
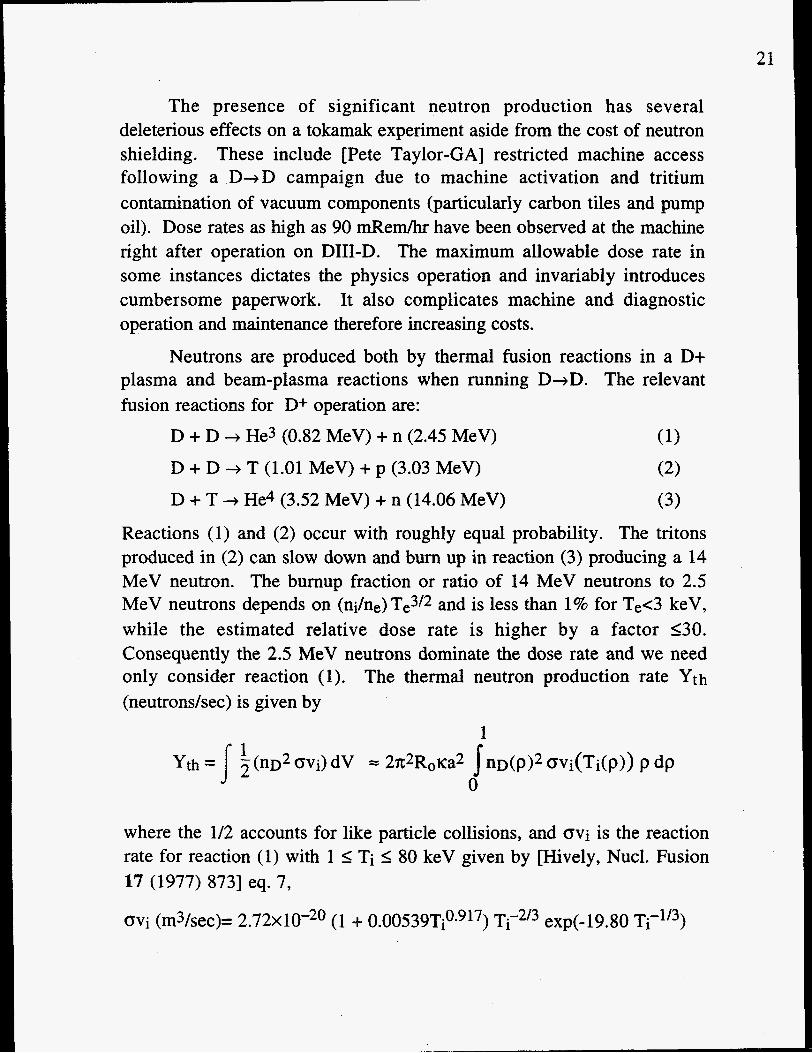
The presence of significant neutron production has several deleterious effects on a tokamak experiment aside from the cost of neutron shielding. These include [Pete Taylor-GA] restricted machine access following a D+D campaign due to machine activation and tritium contamination of vacuum components (particularly carbon tiles and pump oil). Dose rates as high as 90 mRem/hr have been observed at the machine right after operation on DIII-D. The maximum allowable dose rate in some instances dictates the physics operation and invariably introduces cumbersome paperwork. It also complicates machine and diagnostic operation and maintenance therefore increasing costs.
Neutrons are produced both by thermal fusion reactions in a D+ plasma and beam-plasma reactions when running D+D. The relevant fusion reactions for D+ operation are:
D + D + He3 (0.82 MeV) + n (2.45 MeV)
D + T + He4 (3.52 MeV) + n (14.06 MeV)
(1)
(2)
(3)
D + D T (1.01 MeV) + p (3.03 MeV)
Reactions (1) and (2) occur with roughly equal probability. The tritons produced in (2) can slow down and burn up in reaction (3) producing a 14 MeV neutron. The burnup fraction or ratio of 14 MeV neutrons to 2.5 MeV neutrons depends on (ni/ne) Te3/2 and is less than 1% for Tee3 keV, while the estimated relative dose rate is higher by a factor 530. Consequently the 2.5 MeV neutrons dominate the dose rate and we need only consider reaction (1). The thermal neutron production rate Yth
(neutrons/sec) is given by
1
where the 1/2 accounts for like particle collisions, and Ovi is the reaction rate for reaction (1) with 1 I Ti I 80 keV given by [Hively, Nucl. Fusion 17 (1977) 8731 eq. 7,
B V i (m3/sec)= 2.72~10-*' (1 + 0.00539Ti**9'7) Ti-2'3 exp(-19.80

I
22
4.0 - - a cy 3.0
0
>
lil F
2.0 - 2 - - .I 0 1 . 0 v) - -
0.0 1 1 1 1
0.0 1 .o 2.0 3.0 4.0
T (keV) To calculate the production of neutrons by beam-plasma interactions,
a detailed slowing-down calculation is required. We instead use the empirical observation from DIII-D that the beam-plasma neutron production rate for D+D operation was,
where W (MJ)=Ptot ZE is the plasma stored energy.
Having determined the neutron source, one must model neutron transport to determine the neutron flux exposure for personnel and the general public. This is typically done [Fiore, MIT] using the ANISN 1D Boltzman code to analyze thick shielding materials and skyshine, and the MCNP 3D Monte-Carlo code to analyze shield penetrations. The dose rate is then calculated from the absorbed dose in rads times the relative biological efficiency RBE [Attix, Radiation Dosimetry, Vol. I and 11, Academic Press 19681. The conversion factors in mRem/(neutron-cm*) are 5 . 8 ~ 1 0 ~ ~ for 14 MeV and 3 . 5 ~ 1 0 - ~ for 2.5 MeV neutrons. Again we estimate this by assuming the same shielding effectiveness as DIII-D prior to their neutron shield installation and using their measured radial fall-off = 1-1-26 (due to a mixture of isotropic fall-off = r-2 and skyshine = r-1). DIII-D measured a dose rate of 1 mRem per 7 . 5 ~ 1 0 ' ~ neutrons at the site

23
boundary at r=83 m. If one assumes that the site boundary for the proposed ST is at r=10 m, one would estimate a dose rate of
1 mRem 83 1.26 = 1 mRem / 5 . 2 ~ 1 0 ' ~ neutrons 7 . 5 ~ 1 0 ' ~ neutrons (31
Using these formulas we can estimate the thermal and beam-plasma neutron production for a specific case, 'a full parameter D+ discharge with Ro=0.80 m, Az1.5, K=Kfit, Ip=l.O MA, B ~ z 0 . 5 T, &20=OSO which for ni/ne=0.7 corresponds to a deuteron density profile ni 20~0.48 (l-p2)0.7. For consistency, we consider Lackner-Gottardi scaling which yields a confinement time of 79 ms for PNB=O assuming H=1.6. With our simple model, this implies an ion temperature profile of Ti (keV)=0.54 (I-@). By numerically integrating the reaction rate over the profiles, we estimate a thermal neutron production rate Y ~ ~ = I . O X I Q ~ neutrons/sec. If we now turn on 3.5 MW of HO neutral beams, the confinement time predicted by STOP decreases to 28 ms, the ion temperature increases to Ti0=2.3 keV, and Yth jumps to 6 . 5 ~ 1 0 ' ~ neutrons/sec. If instead we inject 3.5 MW of DO beams and assume the H factor increases to 2.0, we estimate ~ = 3 6 ms, Tio4.O keV, and Yth=2.0x10¹³ neutrons/sec. However, we now produce beam-plasma neutrons at an estimated rate of 5 . 6 ~ 1 0 ~ ~ neutrons/sec. The simple empirical relation for Ybeam-pl from DIII-D doesn't include any dependence on beam power. More sophisticated analysis will be required to accurately predict the neutron flux for moderate beam power cases. However, because the reaction rate is such a strong function of Ti, any parameter change that decreases Ti will lower Yth. This is true even for a density increase despite the ni2 dependence of Yth on ni. As a result, for the high density plasmas needed to study high beta, Yth is low, and DO beam-plasma neutrons will dominate at very low PNB.
Using the dose conversion factor given above, and assuming an effective plasma pulse length of 0.3 seconds and a beam pulse length of 0.2 seconds, we estimate dose rates of 6 ~ 1 0 - ~ , 0.025, and 0.29 mRem/shot for the 3 cases described above. The NRC guidelines would limit us to only a few hundred D-.D shots per year, several thousand high flux H-D shots, and millions of low beam power shots per year. Although additional

24
neutron shielding would of course substantially increase the allowed number of high neutron yield shots, that isn't really desirable for the reasons outlined above. The bottom line is that running D+ plasmas or H+D is not a problem for the physics experiments discussed here, but running D+D is a major headache and very costly regardless of site considerations. All of this for a 25% increase in confinement time already uncertain by a factor of 2 to 3 seems unjustified at this point.
To summarize this section, we answer the 4 questions we posed at the outset. The L-H power threshold for H plasmas is roughly twice that for D, and that the threshold is independent of beam species. Hence H+D has the same threshold has D+D. The H-mode energy confinement time on various machines is found to scale with effective mass =Ai**'' and to be better with D+D than H+D by roughly 25%. There is little operational advantage of running Do beams versus Ho. However, there are significant costs and complications associated with running D+D. Since the machine we have described can achieve the relevant physics goals without relying on D+D, it would seem to be counter-productive to insist on the use of Do beams.
5. H-mode and Studying the L-H Transition
One of the significant unknown issues involving Confinement in small aspect-ratio tokamaks concerns the possibility of attaining H-mode like performance. In this section we discuss the implications of the existing large aspect ratio H-mode database for the proposed device. First we discuss the empirical scaling law for the L-H transition power threshold, [ASDEWC-MOD H-mode scaling, Ryter EPS, '941
PL-H ( M W ) = 0.045 (1020 m-3) BT (T) S(m2)
for deuterium plasmas, with S the plasma surface area,
As a fairly extreme case, for R=0.9, A=1.33, tc=1.7, &20=l.O, and B~=0.7 T, then S=30 m2 and pL-~=0.94 MW. This compares with POH >1.1 MW with Ip=0.75 MA and Vloop = 1.5V. Therefore this machine should always

be in H mode with just Ohmic heating for normal parameters. To emphasize this point, we have used STOP to optimize plasma parameters to maximize the ratio of Ptot/PL-H. For this study we have used the parameter
range given in the preceding table except ne20 = 0.50 and P N B = ~ . ~ MW. As the following chart shows, the L-H power threshold can be exceeded by a factor ranging from 24 to 44 for the various scaling laws. More neutral beam power or lower density would push this even higher.
Chart of attainable Ptot/PL-H for the various scaling laws.
N e e Kaye- Lack- RLW Gold- Kaye- Dlll- ITER- DTEM Dlll Alc all Gott L Gold D-JET 89-P OH
Scaling Laws
5.1 scaling of Ptot/PLIH with Aspect Ratio
We have also considered scaling of Ptot/PL-H with aspect ratio for the
Lackner-Gottardi scaling law. For this example we use the following

26
5
0
parameters: Ro=0.7 m, 1,=0.75 MA, B~=0.61 T, Ee20=o.50, and P N B = ~ . ~ MW. The following graph shows that the L-H power threshold for H+D
is exceeded by a factor ranging from 11 to 20 increasing with aspect ratio as the surface area decreases. Both ASDEX and DIII-D found that the L-H power threshold for H plasmas was roughly twice that for D, and that the threshold is independent of beam species. However, obviously even H+ plasmas should be well into H-mode.
- - - - - - - - ______..____________.. i .____............___.. .........._...........: ....................... i ....................... i ........ - ...........--
- - - -+ - - - - - - - - - i j H + H - I I I 1 I I
- L - H Threshold
- - - - i H + D -
I
Graph of Ptot/PL-H vs. A for Lackner-Gottardi
Ptot / PLmH Scaling with R/a
\ c 0
&
5.2 Optimization to Access L-Mode
While most small aspect-ratio tokamak plasmas are predicted to be well into H-mode even with just Ohmic heating, it may be possible to force the machine into L-mode if one really "optimizes" parameters for that purpose. The strategy here is to run either a hydrogen or helium plasma which has a higher PL-H by as much as a factor of two [K.H. Burrell, et al,

Plasma Phys. and Contr. Fusion 31 (1989) 16491. Then maximize ne, BT and S while minimizing POH. Since POH = Ip2/(a2Te3/2), a low I, and small aspect ratio is best. For an H+ plasma, Pt,t/PL-H ratios ranging from
0.29 to 1.4 can be achieved, with only the Goldston-L mode, D-111-JET,
and ITER89-P scaling laws predicting an inevitable H-mode plasma. By going to helium, the favorable mass scaling of many of the scaling laws predicts a higher central temperature which reduces Ohmic heating. In this case, only the D-111-JET scaling law stubbornly resists a transition into L- mode. Since the empirical L-H threshold scaling law represents an optimum, it should be possible to further increase the power threshold and force the plasma into L-mode for any of the scaling laws in order to study the L-H transition.
6. Long Pulse Operation and Relevant Time Scales
In the draft whitepaper it is implied that the proposed device should allow for a very long pulse -10-100 second upgrade. In this section we discuss the relevant time scales which should dictate the pulse length capability of the proposed machine. The time scales to consider include the thermal and particle confinement times, the current relaxation time, and the thermal equilibration time for plasma facing components. The thermal confinement time has been extensively modeled by a large variety of empirical scaling laws in the course of the present study. Only the DIII-D- OH (ignoring the saturated confinement regime) and l U W (with Ohmic heating only, though derived from L-mode data) laws ever exceed 100 ms. Considering also the confinement results from START, it is unlikely that the proposed device will significantly exceed 100 ms confinement. While the particle confinement time is even less certain, on present tokamaks, the particle confinement time rarely exceeds the thermal confinement time by more than a factor of two [Wootton, Plasma Phys. and Contr. Fusion 30 (1988) 14791, and is more typically comparable to the thermal confinement time [Ongena, Nucl. Fusion 33 (1993) 2831.
The issue of current relaxation time scales has been studied extensively by Mikkelsen [Phys. Fluids B 1 (1989) 333.1. He derives an

28
expression representing the most slowly decaying normal mode of the current diffusion equation,
with Vs is the equilibrium surface voltage. This expression agrees adequately with TITR, JET, and DITE although it fails to account for the current mixing effect of sawteeth. It is also is consistent with the plasma current recovery time, =2 ms, following internal reconnection events in START [A. Sykes, et al., Plasma Phys. Control. Fusion 35 (1993) 10511. This expression, however, is really only valid for large aspect ratio and a circular cross section, but we have not identified any references which extend this work to low-A elongated plasmas. While noting these limitations, we make use of this expression taking Ip=l MA, Ro=0.8 m, and Vs = 1.0 V to find an approximate current relaxation time of 160 ms. We note that this time scale is also the relevant time scale for demonstration of long pulse non-inductive current drive techniques.
The thermal equilibration time for plasma facing components is the longest time scale under consideration [Van Houtte, Nucl. Fusion 33 (1993) 1371 reaching in some cases tens of seconds. To study these issues, it would be necessary to implement active cooling in most of the coil systems and plasma facing components as well as pumped limiters. Obtaining ultra- long pulse TF pulses from the slender normal-conducting center column, already very difficult from 'an engineering perspective, will be extremely costly. While it is certainly of interest to study issues pertaining to steady- state heat flux handling by the plasma facing components, we maintain that it is not appropriate to constrain or complicate the present machine design to allow for these studies in the proposed device.
To insist on studying steady-state heat flux handling of plasma facing components in the upgrade of this particular experiment is an unnecessary and possibly costly mistake. We point out that these issues are not specific to low aspect ratio and are already being addressed by Tore-Supra and will be addressed by TPX, ITER, and possibly a volume neutron source. This experiment is not a volume neutron source. It is a physics experiment. From the above discussion, we conclude that a pulse length of a 2 to 3 times the current relaxation time scale, i.e. = 500 ms will be adequate to study all of the relevant physics proposed for this device.
zc (sec) == 0.21 I, (MA) & (m) / Vs (volts)

29 I Limitations of the present work:
The natural scaling of K with Ro is very approximate.
The loop voltage and ion temperature models are fairly crude, the latter is mainly important for neutron calculations which are a sensitive function of Ti, whereas the P-limit studies will not be strongly affected.
Profile effects are treated only in an average sense. Profile effects will be important in determining stability and in calculating the neoclassical resistivity.
Almost none of these configurations have been demonstrated as achievable with an equilibrium code.
The coupling between engineering and physics optimization is much tighter than assumed here. To do this optimization properly will require finite element analysis of various critical coil systems.
Summary:
While the assumptions used in this optimization study are plausible, they have not yet been confirmed by careful engineering or equilibrium analysis. This study represents a first cut at a physics optimization and merely demonstrates the importance of carrying out this study properly to minimize the cost of this device. This preliminary study indicates that by careful parameter optimization, all of the physics goals can be achieved with two or fewer neutral beams (~3.5 MW) without the necessity of running DO + D+ with the associated neutron production. We also maintain that it is inappropriate to constrain in any way the design of the next-step device to allow for quasi-steady-state operation. These experiments are not specific to low aspect ratio and are best left to other devices.
The cost savings resulting from the optimization discussed in this note are not insignificant. Given the extremely restricted funding environment at present, such cost savings may make the difference between building or not building a mega-ampere spherical tokamak in the U.S. in the foreseeable future. Given the unusually exciting physics and promising

30
potential of ST's, we hope this work will increase the likelihood of building such a device.

31
Appendix Confinement Scaling Laws and Related Formulae
(MKS unless otherwise noted)
W The confinement time is ZE = -
Ptot ' where the stored energy W = Wthemd + Wbem
3 3k Z(nekTe+nikTi) = 5 I (ne> (Te>n + (ni> (Ti>n I v Wthermd =
and Wbem is the energy stored in fast NB ions
and the volume average and density weighted volume average Te are
and V = 2 $a2 lQ, K is the plasma volume.
The expression for ZE is rewritten as
ZE = 24 V(1 + ni& Time) (ne20) (Teh 1 Rot
where (ne20) = (ne) /lo2' and the total input power 1s taken to
2 Ptot = Poh + Paux, where Poh = I p V ~ = I, Rp
with Rp the plasma resistance and the loop voltage VL = Ip Rp. resistance is taken as a Spitzer-like Rp scaled to START:
The plasma
Ro 312 Rp = 0.08 Zeff 2 / (Te ) .
The volume average Te3/2 needed to compute average resistivity is: m

1.22 - 0.68 E qv = qcyl f(&), where f(&) =
(1 - &2)2 Peng, Strickler,
Nucl. Fusion 26 (1986) 769,
Post, et al., IAEA/ITER/DS/21 ITER Doc. Series, IAEA, Vienna (1991)
or (1.17 - 0.65 E) in ITER Physics, D.E.
a2 BTO 1 + ~2 g(S) qcy1= 5 RJP 2 9
where g(6) = 1 + 2S2 - 1.2 S3 ,
Uckan, Fus. Tech. 15 (1989) 391.
with I, (MA)
Some of the scaling laws and the density limits are written in terms of the
chord average density ne. Fitting a 3rd order polynomial to the Gamma
function resulting from integrating neo (l-p2>"n from o to 1:
TEe = GO (0.9631 - 0.3918 a n + 0.1116 - 0.01226 an3)
Neo-Alcator (Ohmic), Uckan, Fus. Tech. 15 (1989) 391 - ZE = 0.070 a ~0~ (ne20) qcyl
DIII-D-OH (Ohmic), Nevins' spreadsheet, TPX DOC#93-9305 12-
PPPL/G.Neilson-0 1 - ZE = MIN( 0.066 a R 2 K ~ * ~ (ne20) qv , 0.064 a & B I@* ), where
we have neglected the 2nd (density saturation) term in our analysis
33
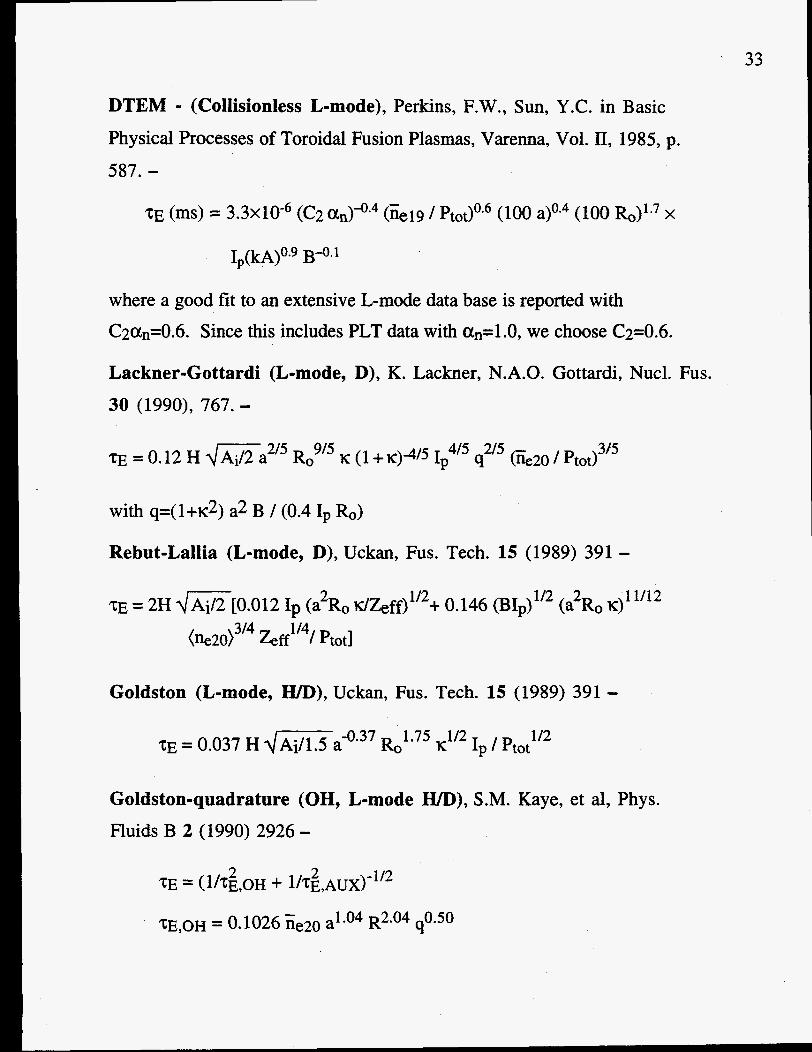
DTEM - (Collisionless L-mode), Perkins, F.W., Sun, Y.C. in Basic
Physical Processes of Toroidal Fusion Plasmas, Varenna, Vol. 11, 1985, p.
587. - ZE (ms) = 3 . 3 ~ 1 0 ~ ~ (C2 C X ~ ) ~ . ~ (Gig / Pt0t)Oa6 (100 (100 &)'e7 x
where a good fit to an extensive L-mode data base is reported with
C2an=0.6. Since this includes PLT data with CXnz1.0, we choose C2=O.6.
Lackner-Gottardi (L-mode, D), K. Lackner, N.A.O. Gottardi, Nucl. Fus.
30 (1990), 767. - 4f5 215 3/5
ZE = 0.12 H 4-a2l5 R2I5 IC (1 + 1~)-4/5 I, q (ne20 / Ptot)
with q=( 1+$) a2 B / (0.4 I, b)
Rebut-Lallia (L-mode, D), Uckan, Fus. Tech. 15 (1989) 391 - ZE = 2H 4=[0.012 Ip (a2R, K/Zeff)1/2+ 0.146 (BIp)'12 (a2R0 K) 11/12
( w o ) ~ / ~ ptOti
Goldston (L-mode, H/D), Uckan, Fus. Tech. 15 (1989) 391 - 1 /2
I, / Ptot -0.37 b1.75 ,1/2
ZE = 0.037 H dAi / l s a
Goldston-quadrature (OH, L-mode IUD), S.M. Kaye, et al, Phys.
Fluids B 2 (1990) 2926 -
1 /2 Ip / Ptot
-0.37 1.75 K1/2 R,AUX = 0.037 H 1JAi/l.Sa Ro
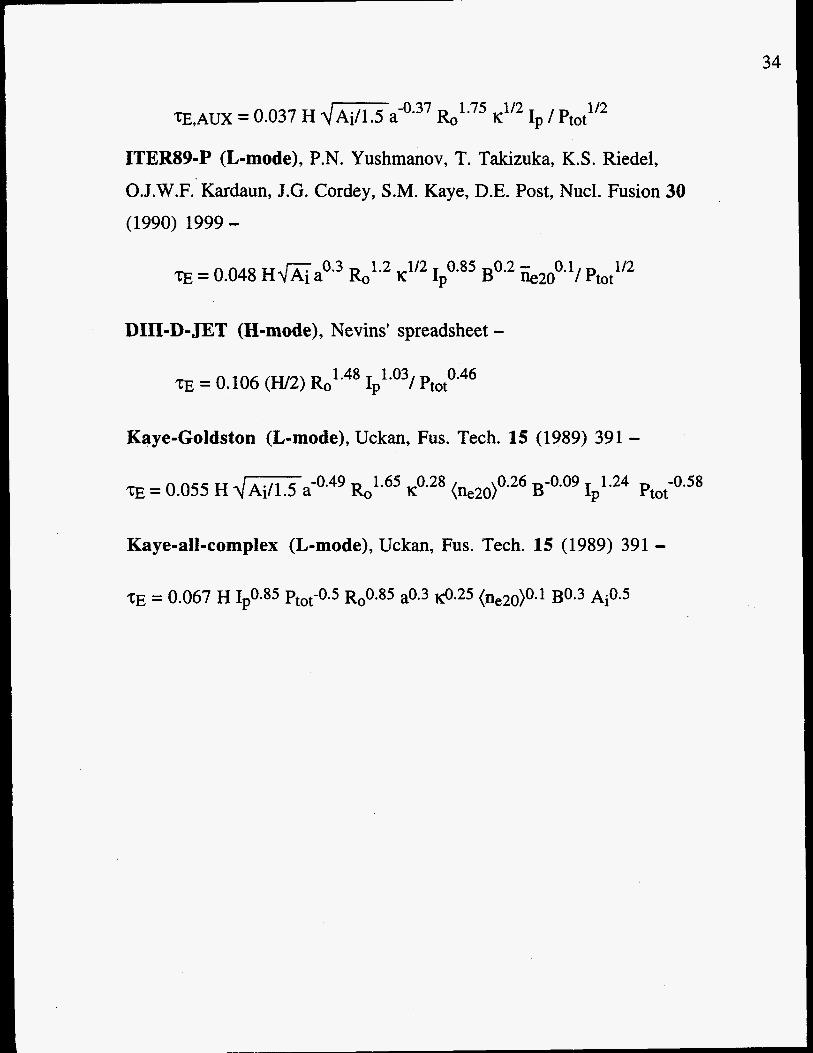
ITER89-P (L-mode), P.N. Yushmanov, T. Takizuka, K.S. Riedel,
O.J.W.F. Kardaun, J.G. Cordey, S.M. Kaye, D.E. Post, Nucl. Fusion 30
(1990) 1999-
12 112 0.85 0.2 - 112 TE = 0.048 ' IC I, B ~ 2 o ~ ' ~ / Ptot
DIII-D- JET (H-mode), Nevins' spreadsheet - ZE = 0.106 (W2) & Ip / Ptot 1.48 1.03 0.46
Kaye-Goldston (L-mode), Uckan, Fus. Tech. 15 (1989) 391 -
ZE = 0.055 H d m a
Kaye-all-complex (L-mode), Uckan, Fus. Tech. 15 (1989) 391 -
0.26 B-0.09 1.24 -0.58 be20) IP h o t
-0.49 b 1 . 6 5 K0.28
ZE = 0.067 H 1 0.85 ptOt-0.5 b0.85 a0.3 fl.25 (ne20)0.1 B0.3 ~ i 0 . 5 P
34