funds analysis of nationalized banks in india dr. n.p...
TRANSCRIPT
International Journal of Research in Economics and Social Sciences (IJRESS) Available online at: http://euroasiapub.org
Vol. 7 Issue 11, November- 2017
ISSN(o): 2249-7382 | Impact Factor: 6.939 |
International Journal of Research in Economics & Social Sciences
Email:- [email protected], http://www.euroasiapub.org
(An open access scholarly, peer-reviewed, interdisciplinary, monthly, and fully refereed journals.)
769
Funds Analysis of Nationalized Banks in India
Dr. N.P Yadav
Associate Professor of Commerce,
Ahir College, Rewari, Haryana, INDIA
Alpna Yadav
Assistnt. Professor of Economics,
Ahir College, Rewari, Haryana, INDIA
Abstract
The present study attempts to examine the funds analysis of nationalized banks in India. The study
is based on secondary data of the selected banks for the periods 2007-08 to 2016-17. The results
reveal that the rising index of equity share capital, reserve and surplus and deposits of all the banks
under study and industry as a whole reflect on the sound financial position. All the banks under study
have high proportion of deposits in capital structure i.e. 89.25 percent in BOB, 86.43 percent in PNB,
88.28 percent in CB and 88.16 percent in industry as a whole and low proportion to equity share
capital of .11 percent in BOB, .09 percent in PNB, .12 percent in CB and .10 percent in industry as a
whole. The reserve and surplus and borrowing proportion have been fluctuating over the periods of
the study. Thus, the banks depend heavily on external sources of funds than internal sources. The
study of funds analysis is very important aspect to design polices regarding bank’s finance.
Keywords: Equity Share Capital, Reserve and Surplus, Deposits and Borrowing.
Introduction:
Banking sector is the most vibrant and dominant sector in India. Indian financial sector
is treated as to be the backbone of the economy. Ever sense the nationalization of banks in India,
this sector has been growing without leaps and bounces and catering to the need of various
segments of the society. The success of the bank depends in mobilizing the funds in the economy
which leads to economic growth and developments. Proper mix of funds provides energy to the
business enterprise, without which the total investment will collapse. Thus, proper mix of funds
is primary measure of success of a bank. Therefore, funds are the pivot around which the entire
business activities rotate.
Finance is one of the most important determinants in the growth of banks. Finance
provides base to all the business activities. Without finance neither any business can be started
nor successfully run. Provision of sufficient funds at the required time is the key of success of a
business. As a matter of fact, finance may be said to be circulatory system of economic body.
Finance is the agent that produces this result.

International Journal of Research in Economics and Social Sciences (IJRESS) Vol. 7 Issue 11, November- 2017, ISSN(o): 2249-7382 | Impact Factor: 6.939
International Journal of Research in Economics & Social Sciences
Email:- [email protected], http://www.euroasiapub.org
(An open access scholarly, peer-reviewed, interdisciplinary, monthly, and fully refereed journal)
770
The funds include share capital, reserve and surplus, deposits, borrowings and refinance
liabilities and provisions. It is computed on the basis of long term financial sources of funds. The
long term sources of funds include share capital, reserve and surplus, deposits and borrowing. It
means owned funds and borrowed funds are included in the capital structure of the banks.
Generally, the bank (RBI) has the power to decide the capital mix for its business organization.
It is very easy to speak about proper mix of funds i.e. debt and equity, but in practice, it is
very difficult to design it. Therefore, framing a proper capital mix becomes a never ending
continuous exercise. All the times financial manager has to review the situations and
circumstances and take the corrective decisions. While framing a proper mix of funds various
factors like cost, control, risk etc. are to be kept in mind.
As discussed above, it is a very delicate phenomenon and should be handled with care. An
unplanned mix of funds may after lead to failure and bankruptcy of a bank. Thus, capital mix is a
critical issue to any finance manager and proper handling of the issue will pave way to success of
an organization.
Objectives of the Study
The objectives of present study are:
1. To examine the growth of various sources of funds.
2. To assess the composition of various sources of funds.
Scope of the study
Keeping in view of the objectives of the study it has been decided to choose the banks on
random sampling basis. The sample consists of three nationalized banks namely Bank of Baroda
(BOB), Punjab National Bank (PNB) and Corporation Bank (CB). The study is an attempt to
examine the funds analysis of nationalized banks in India. The periods of study is ten years i.e.
from 2007-08 to 2016-17.
Methodology
The present study is based on secondary data. The data have been taken from the
published annual reports of the respective banks. The collected data have been analyzed through
the use of various accounting and statistical techniques such as ratio, percentage, mean, co-
efficient of variation (C.V.), Index, trend values and test significance (‘t’ test of mean) have been
applied to fulfill the objectives of the study.
Analysis and Discussion
The data analyzed have been presented in different tables (seven in numbers), reflecting
upon the various objectives of the study.

International Journal of Research in Economics and Social Sciences (IJRESS) Vol. 7 Issue 11, November- 2017, ISSN(o): 2249-7382 | Impact Factor: 6.939
International Journal of Research in Economics & Social Sciences
Email:- [email protected], http://www.euroasiapub.org
(An open access scholarly, peer-reviewed, interdisciplinary, monthly, and fully refereed journal)
771
Objective 1: Growth analysis of various sources of funds. The growth analysis of equity share
capital, reserve and surplus, deposits and borrowing have been shown in tables 1 to 4 numbers.
Table No.1
Growth of Equity Capital of Nationalized Banks in India
(In Crores)
Year BOB PNB CB Industry
Equity
Capital
Index Equity
Capital
Index Equity
Capital
Index Equity
Capital
Index
2007-
08
366 100.00 315 100.00 143 100.00 275 100.00
2008-
09
366 100.00 315 100.00 143 100.00 275 100.00
2009-
10
366 100.00 315 100.00 143 100.00 275 100.00
2010-
11
393 107.38 317 100.63 148 103.50 286 104.00
2011-
12
412 112.57 339 107.62 148 103.50 300 109.09
2012-
13
423 115.57 353 112.06 153 106.99 310 112.73
2013-
14
431 117.76 362 114.92 168 117.48 320 116.36
2014-
15
444 121.31 371 117.78 168 117.48 328 119.27
2015-
16
462 126.23 393 124.76 205 143.36 353 128.36
2016-
17
462 126.23 426 135.24 229 160.14 372 135.27
Mean 412.5 350.6 164.8 309.4
C.V. .09 .10 .17 .11
Source: Calculated from the annual reports of the respective banks.
Table No. 1 Portrays that equity share capital has grown 1.26 times with C.V. value .09 in BOB over
ten years period of the study. The value of C.V. value .09 negligible. The equity share capital of PNB
has risen 1.35 times with C.V. value .10. The value of co-efficient of variation .10 is nominal. The
equity share capital of CB has grown 1.60 times with C.V. value .17. This shows that there is a slight
variation in the rise in equity share capital of CB. The industry figure shows that share capital has
risen 1.35 times with C.V. value .11. It can be said that leaving the CB, the growth in equity share
capital in banks namely PNB and BOB is not considerable. It means the banks in this industry are
not depending too much on equity share capital base for their financial requirements
International Journal of Research in Economics and Social Sciences (IJRESS) Vol. 7 Issue 11, November- 2017, ISSN(o): 2249-7382 | Impact Factor: 6.939
International Journal of Research in Economics & Social Sciences
Email:- [email protected], http://www.euroasiapub.org
(An open access scholarly, peer-reviewed, interdisciplinary, monthly, and fully refereed journal)
772
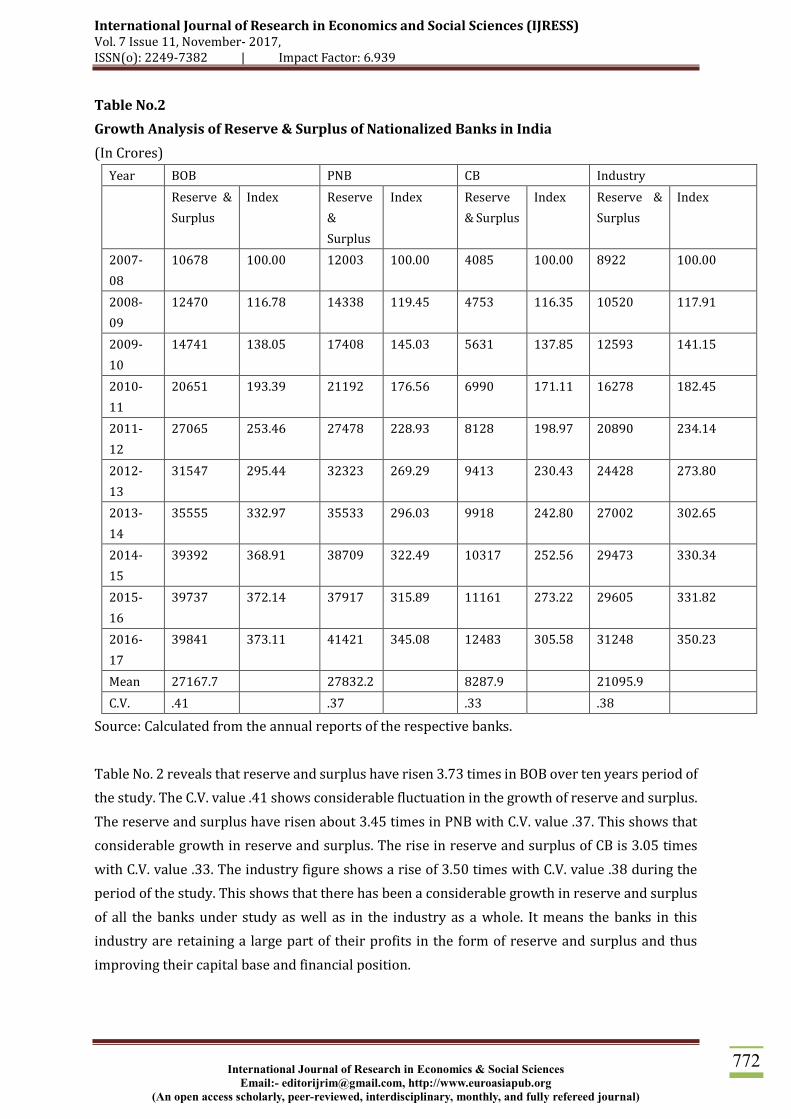
Table No.2
Growth Analysis of Reserve & Surplus of Nationalized Banks in India
(In Crores)
Year BOB PNB CB Industry
Reserve &
Surplus
Index Reserve
&
Surplus
Index Reserve
& Surplus
Index Reserve &
Surplus
Index
2007-
08
10678 100.00 12003 100.00 4085 100.00 8922 100.00
2008-
09
12470 116.78 14338 119.45 4753 116.35 10520 117.91
2009-
10
14741 138.05 17408 145.03 5631 137.85 12593 141.15
2010-
11
20651 193.39 21192 176.56 6990 171.11 16278 182.45
2011-
12
27065 253.46 27478 228.93 8128 198.97 20890 234.14
2012-
13
31547 295.44 32323 269.29 9413 230.43 24428 273.80
2013-
14
35555 332.97 35533 296.03 9918 242.80 27002 302.65
2014-
15
39392 368.91 38709 322.49 10317 252.56 29473 330.34
2015-
16
39737 372.14 37917 315.89 11161 273.22 29605 331.82
2016-
17
39841 373.11 41421 345.08 12483 305.58 31248 350.23
Mean 27167.7 27832.2 8287.9 21095.9
C.V. .41 .37 .33 .38
Source: Calculated from the annual reports of the respective banks.
Table No. 2 reveals that reserve and surplus have risen 3.73 times in BOB over ten years period of
the study. The C.V. value .41 shows considerable fluctuation in the growth of reserve and surplus.
The reserve and surplus have risen about 3.45 times in PNB with C.V. value .37. This shows that
considerable growth in reserve and surplus. The rise in reserve and surplus of CB is 3.05 times
with C.V. value .33. The industry figure shows a rise of 3.50 times with C.V. value .38 during the
period of the study. This shows that there has been a considerable growth in reserve and surplus
of all the banks under study as well as in the industry as a whole. It means the banks in this
industry are retaining a large part of their profits in the form of reserve and surplus and thus
improving their capital base and financial position.
International Journal of Research in Economics and Social Sciences (IJRESS) Vol. 7 Issue 11, November- 2017, ISSN(o): 2249-7382 | Impact Factor: 6.939
International Journal of Research in Economics & Social Sciences
Email:- [email protected], http://www.euroasiapub.org
(An open access scholarly, peer-reviewed, interdisciplinary, monthly, and fully refereed journal)
773
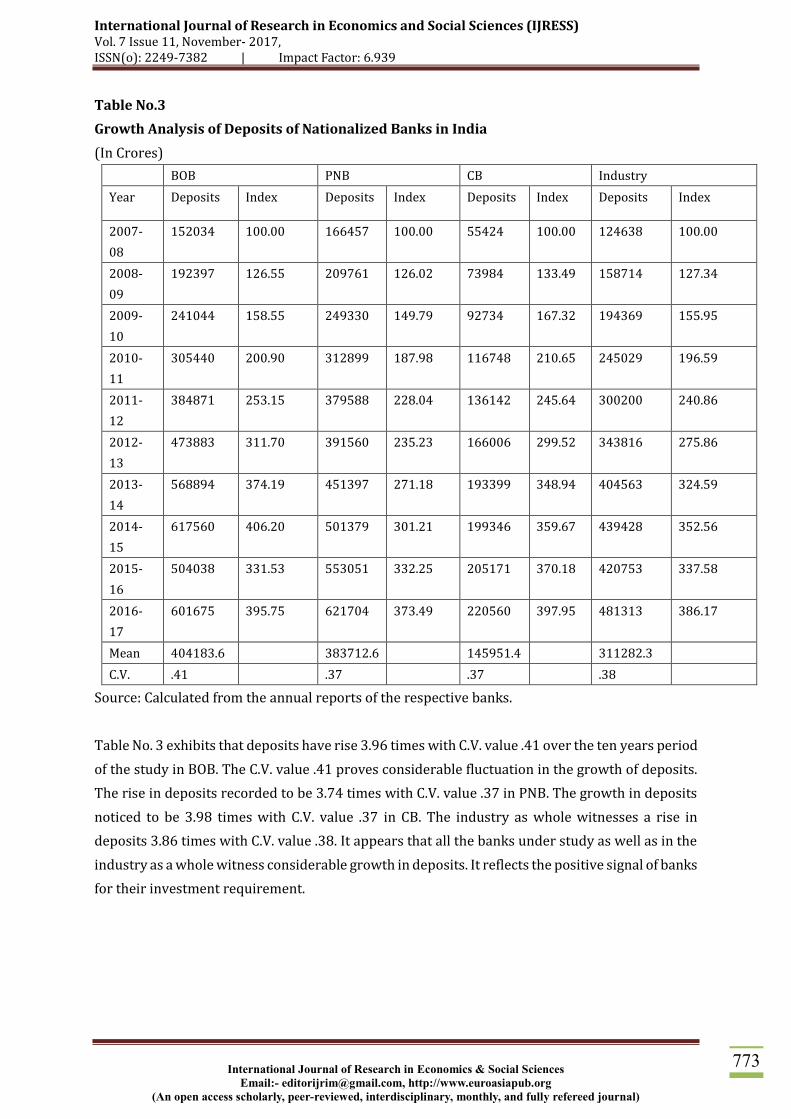
Table No.3
Growth Analysis of Deposits of Nationalized Banks in India
(In Crores)
BOB PNB CB Industry
Year Deposits Index Deposits Index Deposits Index Deposits Index
2007-
08
152034 100.00 166457 100.00 55424 100.00 124638 100.00
2008-
09
192397 126.55 209761 126.02 73984 133.49 158714 127.34
2009-
10
241044 158.55 249330 149.79 92734 167.32 194369 155.95
2010-
11
305440 200.90 312899 187.98 116748 210.65 245029 196.59
2011-
12
384871 253.15 379588 228.04 136142 245.64 300200 240.86
2012-
13
473883 311.70 391560 235.23 166006 299.52 343816 275.86
2013-
14
568894 374.19 451397 271.18 193399 348.94 404563 324.59
2014-
15
617560 406.20 501379 301.21 199346 359.67 439428 352.56
2015-
16
504038 331.53 553051 332.25 205171 370.18 420753 337.58
2016-
17
601675 395.75 621704 373.49 220560 397.95 481313 386.17
Mean 404183.6 383712.6 145951.4 311282.3
C.V. .41 .37 .37 .38
Source: Calculated from the annual reports of the respective banks.
Table No. 3 exhibits that deposits have rise 3.96 times with C.V. value .41 over the ten years period
of the study in BOB. The C.V. value .41 proves considerable fluctuation in the growth of deposits.
The rise in deposits recorded to be 3.74 times with C.V. value .37 in PNB. The growth in deposits
noticed to be 3.98 times with C.V. value .37 in CB. The industry as whole witnesses a rise in
deposits 3.86 times with C.V. value .38. It appears that all the banks under study as well as in the
industry as a whole witness considerable growth in deposits. It reflects the positive signal of banks
for their investment requirement.

International Journal of Research in Economics and Social Sciences (IJRESS) Vol. 7 Issue 11, November- 2017, ISSN(o): 2249-7382 | Impact Factor: 6.939
International Journal of Research in Economics & Social Sciences
Email:- [email protected], http://www.euroasiapub.org
(An open access scholarly, peer-reviewed, interdisciplinary, monthly, and fully refereed journal)
774
Table No.4
Growth Analysis of Borrowings of Nationalized Banks in India
(In Crores)
BOB PNB CB Industry
Year Borrowings Index Borrowings Index Borrowings Index Borrowings Index
2007-
08
3927 100.00 5467 100.00 2138 100.00 3844 100.00
2008-
09
5636 143.52 12460 227.91 4810 224.98 7635 198.62
2009-
10
8816 224.49 19262 352.33 9078 424.60 12385 322.19
2010-
11
9606 244.61 31590 577.83 15965 746.73 19054 495.68
2011-
12
11400 290.30 37264 681.62 14248 666.42 20971 545.55
2012-
13
26579 676.82 39621 724.73 12899 603.32 26366 685.90
2013-
14
36813 937.43 48034 878.62 13021 609.03 32623 848.67
2014-
15
35264 897.99 45671 835.39 10415 487.14 30450 792.14
2015-
16
33472 852.35 59755 1093.01 13113 613.33 35447 922.14
2016-
17
30611 779.50 40763 745.62 6448 301.59 25941 674.84
Mean 20212.4 33988.7 10213.5 21471.6
C.V. .63 .47 .42 .77
Source: Calculated from the annual reports of the respective banks.
Table No. 4 highlights that borrowings have risen about 7.80 times in BOB over ten years periods
of the study with C.V. value .63. This proves a high variation in the growth of borrowings. This is
about 7.46 times rise in borrowings of PNB during the same periods with C.V. value .47. The value
of C.V. .47 proves considerable fluctuation in the growth of borrowings. The borrowings have
grown about 3.02 times with C.V. value .42 in CB. The C.V. value .42 shows considerable fluctuation
in borrowings over the period of the study. The industry as a whole witnesses a growth 6.75 times
with C.V. value .77. The high C.V. value witnesses sharp fluctuation in the growth of borrowings.
It is difficult to conclude for the industry as a whole due to much variation in the figure of three
banks under consideration. But this can be safely concluded that there has been extra ordinary
increase in borrowings capital of BOB while the borrowings capital of other two banks has
increased reasonably.
International Journal of Research in Economics and Social Sciences (IJRESS) Vol. 7 Issue 11, November- 2017, ISSN(o): 2249-7382 | Impact Factor: 6.939
International Journal of Research in Economics & Social Sciences
Email:- [email protected], http://www.euroasiapub.org
(An open access scholarly, peer-reviewed, interdisciplinary, monthly, and fully refereed journal)
775
Objective 2: Analysis of composition of various sources of funds. The composition analysis of the
banks selected for the study has been shown in the following tables 5 to 7 numbers.
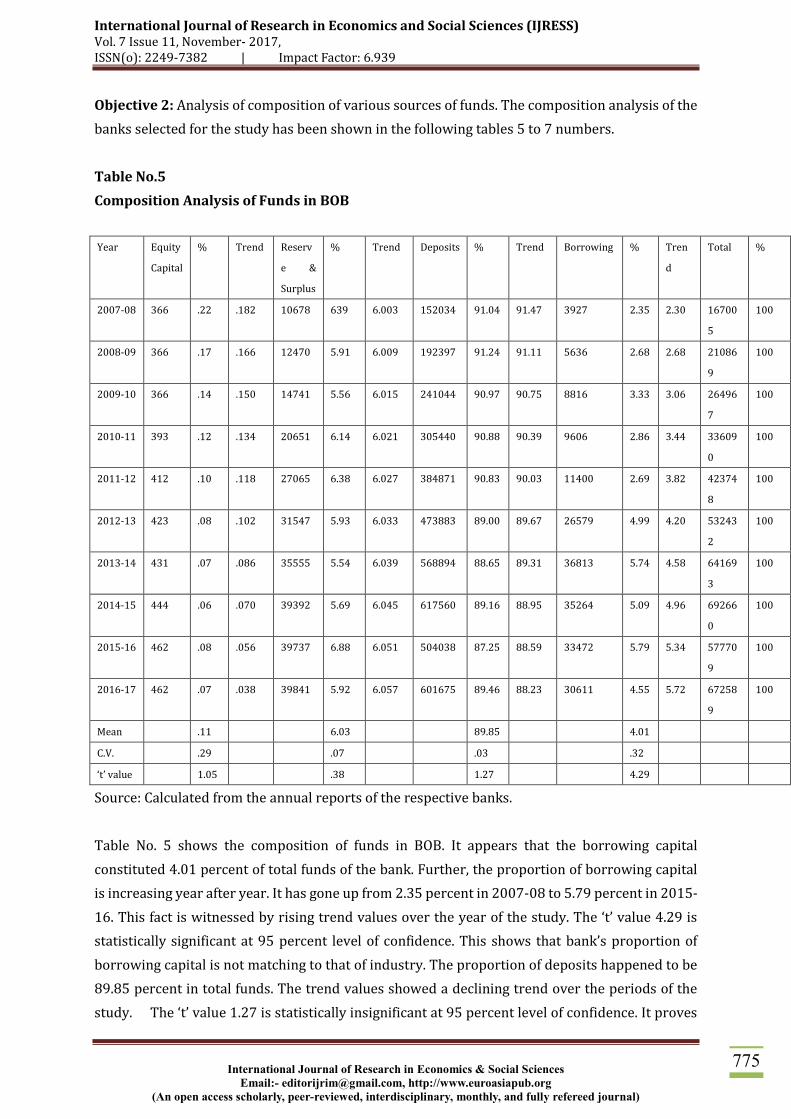
Table No.5
Composition Analysis of Funds in BOB
Year Equity
Capital
% Trend Reserv
e &
Surplus
% Trend Deposits % Trend Borrowing % Tren
d
Total %
2007-08 366 .22 .182 10678 639 6.003 152034 91.04 91.47 3927 2.35 2.30 16700
5
100
2008-09 366 .17 .166 12470 5.91 6.009 192397 91.24 91.11 5636 2.68 2.68 21086
9
100
2009-10 366 .14 .150 14741 5.56 6.015 241044 90.97 90.75 8816 3.33 3.06 26496
7
100
2010-11 393 .12 .134 20651 6.14 6.021 305440 90.88 90.39 9606 2.86 3.44 33609
0
100
2011-12 412 .10 .118 27065 6.38 6.027 384871 90.83 90.03 11400 2.69 3.82 42374
8
100
2012-13 423 .08 .102 31547 5.93 6.033 473883 89.00 89.67 26579 4.99 4.20 53243
2
100
2013-14 431 .07 .086 35555 5.54 6.039 568894 88.65 89.31 36813 5.74 4.58 64169
3
100
2014-15 444 .06 .070 39392 5.69 6.045 617560 89.16 88.95 35264 5.09 4.96 69266
0
100
2015-16 462 .08 .056 39737 6.88 6.051 504038 87.25 88.59 33472 5.79 5.34 57770
9
100
2016-17 462 .07 .038 39841 5.92 6.057 601675 89.46 88.23 30611 4.55 5.72 67258
9
100
Mean .11 6.03 89.85 4.01
C.V. .29 .07 .03 .32
‘t’ value 1.05 .38 1.27 4.29
Source: Calculated from the annual reports of the respective banks.
Table No. 5 shows the composition of funds in BOB. It appears that the borrowing capital
constituted 4.01 percent of total funds of the bank. Further, the proportion of borrowing capital
is increasing year after year. It has gone up from 2.35 percent in 2007-08 to 5.79 percent in 2015-
16. This fact is witnessed by rising trend values over the year of the study. The ‘t’ value 4.29 is
statistically significant at 95 percent level of confidence. This shows that bank’s proportion of
borrowing capital is not matching to that of industry. The proportion of deposits happened to be
89.85 percent in total funds. The trend values showed a declining trend over the periods of the
study. The ‘t’ value 1.27 is statistically insignificant at 95 percent level of confidence. It proves

International Journal of Research in Economics and Social Sciences (IJRESS) Vol. 7 Issue 11, November- 2017, ISSN(o): 2249-7382 | Impact Factor: 6.939
International Journal of Research in Economics & Social Sciences
Email:- [email protected], http://www.euroasiapub.org
(An open access scholarly, peer-reviewed, interdisciplinary, monthly, and fully refereed journal)
776
that bank’s proportion of deposits is similar to that of industry (i.e. 88.16 percent). The proportion
of reserve and surplus observed to be 6.03 percent in total funds. The trend values witness a
slightly rising trend over the period of the study. The ‘t’ value .38 is statistically insignificant at
95 percent level of confidence. It means bank’s proportion is similar to that of industry. The
proportion of equity capital is noticed to be .11 percent in total funds. The trend values showed a
declining trend over the periods of study. The ‘t’ value 1.05 is statistically insignificant at 95
percent level of confidence which proves that bank’s proportion is matching to that of industry. It
can be said that bank is giving more priority to reserve and surplus and borrowing capital and low
importance to equity capital and deposits in its capital structure.
Table No.6
Composition Analysis of Funds in PNB
Year Equity
Capital
% Tren
d
Reserve
&
Surplus
% Tren
d
Deposits % Tren
d
Borrowing % Tren
d
Total %
2007-08 315 .17 .135 12003 6.51 6.286 166457 90.35 87.96 5467 2.97 5.61 18424
2
100
2008-09 315 .13 .125 14338 6.05 6.278 209761 88.56 87.62 12460 5.26 5.97 23687
4
100
2009-10 315 .11 .115 17408 6.08 6.270 249330 87.08 87.28 19262 6.73 6.33 28631
5
100
2010-11 317 .09 .105 21192 5.79 6.262 312899 85.49 86.94 31590 8.63 6.69 36599
8
100
2011-12 339 .08 .095 27478 6.18 6.254 379588 85.36 86.90 37264 8.38 7.05 44466
9
100
2012-13 353 .08 .085 32323 6.97 6.246 391560 84.41 86.26 39621 8.54 7.41 46385
7
100
2013-14 362 .07 .075 35533 6.64 6.238 451397 84.32 85.92 48034 8.97 7.77 53532
6
100
2014-15 371 .06 .065 38709 6.61 6.230 501379 85.54 85.58 45671 7.79 8.13 58613
0
100
2015-16 393 .06 .055 37917 5.82 6.222 553051 84.94 85.24 59755 9.18 8.49 65111
6
100
2016-17 426 .06 .045 41421 5.88 6.214 621704 88.27 84.90 40763 5.79 8.85 74431
4
100
Mean .09 6.25 86.43 7.23
C.V. .40 .06 .02 .26
‘t’ value .88 2.27 3.16 2.48
Source: Calculated from the annual reports of the respective banks.
Table No.6 presents the composition analysis of funds in PNB. It appears that the proportion of
funds i.e. 7.23 percent was obtained thorough borrowing capital. The proportion of borrowing

International Journal of Research in Economics and Social Sciences (IJRESS) Vol. 7 Issue 11, November- 2017, ISSN(o): 2249-7382 | Impact Factor: 6.939
International Journal of Research in Economics & Social Sciences
Email:- [email protected], http://www.euroasiapub.org
(An open access scholarly, peer-reviewed, interdisciplinary, monthly, and fully refereed journal)
777
remained fluctuating throughout the periods of the study. However, the trend values witnessed
an increasing trend over the periods of the study. The ‘t’ value 2.48 is statistically significant at 95
percent level of confidence which proves that bank’s proportion differs to that of aggregate mean
value i.e. 5.75 percent. The proportion of deposits contributed to be 86.43 percent in total funds.
The trend values witness a slightly declining trend over the periods of the study. The ‘t’ value 3.16
is statistically significant 95 percent level of confidence. It means bank’s proportion of deposits is
not similar to that of industry. The proportion of reserve and surplus amounted 6.25 percent in
total funds. The trend values witness a declining trend over the periods of the study. The ‘t’ value
2.27 is statistically significant at 95 percent level of confidence. This shows that bank’s proportion
(i.e. 6.25 percent) is higher as compared to the industry (i.e. 5.98 percent). The equity capital
contributes .09 percent of total funds of the bank. The trend values showed a declining trend over
the periods of the study. The ‘t’ value .88 is statistically insignificant at 95 percent level of
confidence which proves that bank’s proportion of equity share capital (i.e. .09 percent) is lower
in comparison to industry (i.e. .10 percent). It can be inferred that bank is giving more important
to borrowing and low important to equity and reserve and surplus in its capital mix.
International Journal of Research in Economics and Social Sciences (IJRESS) Vol. 7 Issue 11, November- 2017, ISSN(o): 2249-7382 | Impact Factor: 6.939
International Journal of Research in Economics & Social Sciences
Email:- [email protected], http://www.euroasiapub.org
(An open access scholarly, peer-reviewed, interdisciplinary, monthly, and fully refereed journal)
778
Table No.7
Composition Analysis of Funds in CB
Year Equity
Capita
l
% Tren
d
Reserv
e &
Surplus
% Tren
d
Deposit
s
% Tren
d
Borrowin
g
% Tren
d
Total %
2007-
08
143 .23 .174 4085 6.6
1
5.83 55424 89.7
0
86.4
8
2138 3.46 7.66 61790 100
2008-
09
143 .17 .162 4753 5.6
8
5.69 73984 88.4
0
86.8
8
4810 5.75 7.38 83690 100
2009-
10
143 .13 .150 5631 5.2
3
5.55 92734 86.2
0
87.2
8
9078 8.44 7.10 10758
6
100
2010-
11
148 .11 .138 6990 5.0
0
5.41 11674
8
83.4
8
87.6
8
15965 11.4
1
6.82 13985
1
100
2011-
12
148 .09 .126 8128 5.1
3
5.27 13614
2
85.8
0
88.0
8
14248 8.98 6.54 15866
6
100
2012-
13
153 .08 .114 9413 4.9
9
5.13 16600
6
88.0
8
88.4
8
12899 6.85 6.26 18847
1
100
2013-
14
168 .08 .102 9918 4.5
8
4.99 19339
9
89.3
3
88.8
8
13021 6.01 5.98 21650
6
100
2014-
15
168 .08 .090 10317 4.6
8
4.85 19934
6
90.5
1
89.2
8
10415 4.73 5.70 22024
6
100
2015-
16
205 .09 .078 11161 4.8
6
4.71 20517
1
89.3
4
89.6
8
13113 5.71 5.42 22965
0
100
2016-
17
229 .10 .066 12483 5.2
1
4.57 22056
0
92.0
1
90.0
8
6448 2.68 5.14 21972
0
100
Mean .12 5.2
0
88.2
8
6.40
C.V. .38 .11 .06 .39
‘t’ value 1.26 4.3
2
.07 .82
Source: Calculated from the annual reports of the respective banks.
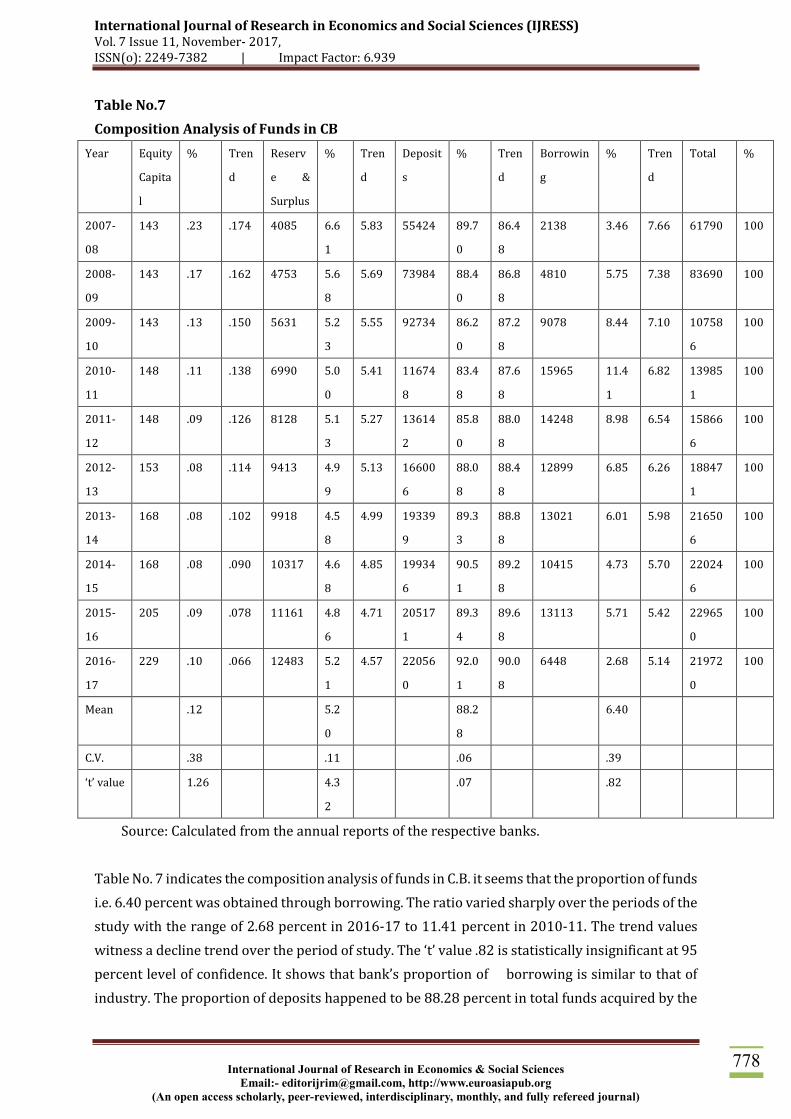
Table No. 7 indicates the composition analysis of funds in C.B. it seems that the proportion of funds
i.e. 6.40 percent was obtained through borrowing. The ratio varied sharply over the periods of the
study with the range of 2.68 percent in 2016-17 to 11.41 percent in 2010-11. The trend values
witness a decline trend over the period of study. The ‘t’ value .82 is statistically insignificant at 95
percent level of confidence. It shows that bank’s proportion of borrowing is similar to that of
industry. The proportion of deposits happened to be 88.28 percent in total funds acquired by the
International Journal of Research in Economics and Social Sciences (IJRESS) Vol. 7 Issue 11, November- 2017, ISSN(o): 2249-7382 | Impact Factor: 6.939
International Journal of Research in Economics & Social Sciences
Email:- [email protected], http://www.euroasiapub.org
(An open access scholarly, peer-reviewed, interdisciplinary, monthly, and fully refereed journal)
779
bank. The trend values showed an increasing trend over the period to the study. The ‘t’ value .07
is statistically insignificant at 95 percent level of confidence which proves that bank’s proportion
is matching to that of industry. The proportion of reserve and surplus observed to be 5.20 percent
in total funds. The trend values witnessed a declining trend over the period of the study. The ‘t’
value 4.32 is statistically significant at 95 percent level of confidence. It proves that banks
proportion i.e. 5.20 percent is lower in comparison to industry i.e. 5.98 percent. The proportion
of equity capital noticed to be .12 percent in total funds. The trend values showed a declining trend
over the period of the study. The ‘t’ value 1.26 is statistically insignificant at 95 percent level of
confidence which proves that bank’s proportion is similar to that of industry. It can be concluded
that bank is giving more importance to deposits and least important to equity capital in its funds.
Findings and Suggestions
The growth in equity share capital is about 1.26 times in BOB, 1.35 times in PNB, 1.60 times
in CB and 1.35 times in industry as a whole with C.V. value .09 in BOB, .10 in PNB, .17 in CB and
.11 in industry as a whole. It appears that leaving the CB, the growth in equity share capital in
bank namely PNB and BOB is not considerable. It means the banks in this industry are not
depending too much on equity share capital base for their financial requirements.
The growth in reserve and surplus is about 3.73 times in BOB, 3.45 times in PNB, 3.06 times
in CB and 3.50 times in industry as whole with C.V value .41 in BOB, .37 in PNB, .33 in CB and .38
industry as whole. It means that there has been a considerable growth in reserve and surplus of
all the banks under study as well as in industry as whole.
The deposits have risen about 3.96 times in BOB, 3.74 times in PNB, 3.98 times in CB and 3.86
times in the industry as a whole with C.V. value .41 in BOB, .37 in PNB, .37 in CB and .38 in the
industry as whole. It proves that all the banks under study as well as the industry as a whole
witness considerable growth in deposits. It reflects the positive signal of banks for their
investment requirements.
The growth in borrowing is about 7.80 times in BOB, 7.46 times in PNB, 3.02 times in CB and
6.75 times in the industry as whole with C.V. value .63 in BOB, .47 in PNB, .42 in CB and .77 in the
industry as whole. The high C.V values witness a sharp fluctuation in the growth of borrowing. It
seems that there has been extra ordinary increase in borrowing in BOB while the borrowing of
other two banks has increased reasonably.
In BOB, the constitution of borrowing is about 4.01 percent, deposits 89.25 percent, reserve
and surplus 6.03 percent and equity share capital .11 percent with C.V. values .32, .03, .07 and .29
respectively. The ‘t’ values are insignificant in regards to equity share capital, reserve and surplus
and deposits pointing out that bank’s performance is matching to that of industry. The ‘t’ value is
significant in regard to borrowing pointing out that bank’s performance differs from industry.
Further, the proportion of borrowing and reserve and surplus are showing increasing trend
values while that of equity share capital and deposits are witnessing declining trend values. It

International Journal of Research in Economics and Social Sciences (IJRESS) Vol. 7 Issue 11, November- 2017, ISSN(o): 2249-7382 | Impact Factor: 6.939
International Journal of Research in Economics & Social Sciences
Email:- [email protected], http://www.euroasiapub.org
(An open access scholarly, peer-reviewed, interdisciplinary, monthly, and fully refereed journal)
780
seems that bank is giving more priority to reserve and surplus and borrowing and low importance
to equity share capital and deposit in its capital structure.
In PNB, the proportion of borrowing is about 7.23 percent, deposits 86.43 percent, reserve
and surplus 6.25 percent and equity share capital .09 percent with C.V values .26, .02, .06 and .40
respectively. The ‘t’ values are significant in regard to borrowing, deposits and reserve and
surplus signifying that bank’s performance differs from industry mean value. The ‘t’ value is
insignificant in regards to equity share capital pointing out that bank’s performance is matching
that of industry. Further, the proportion of borrowing is showing increasing trend values while
that of equity share capital, reserve and surplus and deposits are witnessing a declining trend
values. It proves that bank is giving more importance to borrowing and low importance to equity
share capital and reserve and surplus in its capital mix.
In CB, the proportion of borrowing is 6.40 percent, deposits 88.28 percent, reserve and
surplus 5.20 percent and equity share capital .12 percent with C.V values .39, .06, .11 and .38
respectively. The ‘t’ values are insignificant in regard to equity share capital, deposits and
borrowing pointing out that bank’s performance is matching to that of industry. The ‘t’ value is
significant in regard to reserve and surplus pointing out that bank’s performance differs from
industry. Further, the proportion of deposits is showing increasing trend values while equity
share capital, reserve and surplus and borrowing are witnessing declining the trend values. It
seems that bank is giving more important to deposits and least importance to equity capital in its
financing pattern of funds.
On the whole it may be concluded that the banks depend heavily on external sources of funds
than internal sources. The extended use of borrowed funds always added to profits. The present
study suggests that it helps the financial manager to judge the capital mix and to assess the
leverage position of the banks. The study may be useful to the bank’s manager in planning the
efficient financial strategy and to design the capital mix.
Scope for Further Research
There is vast scope for further research on various aspects, viz., cost of funds, customer
satisfaction perspective and inter business process perspective etc.
References
1. Aggarwal, N.P, Analysis of Financial statements, National Publishing House, 1981.
2. Banerjee, A. and Singh, S.K, (2002), Banking and Financial sector Reforms in India, Deep
and Deep publication, New Delhi.
3. Bhalla, V.K, Investment Management, S. Chand & Company Ltd., New Delhi, 13th Ed.
4. Gupta, S.P., Statistical Mathods, Sulthan Chand & Sons, New Delhi, 2005.
5. Kumar Pramod, Analysis of financial statements of Indian industries, Kanishka Publishing
House Delhi, 1991.
6. Mathur, B.L, Elements of Finance, RBSA, Jaipur, 2001.
International Journal of Research in Economics and Social Sciences (IJRESS) Vol. 7 Issue 11, November- 2017, ISSN(o): 2249-7382 | Impact Factor: 6.939
International Journal of Research in Economics & Social Sciences
Email:- [email protected], http://www.euroasiapub.org
(An open access scholarly, peer-reviewed, interdisciplinary, monthly, and fully refereed journal)
781
7. Pandey, I.M., Capital Structure and Cost of Capital, Vikas Publishing House Pvt Ltd., New
Delhi, 1981.
8. Robinson, Roland, Management of Bank funds, New york, MC Graw Hill Inc., 1962.
9. Saravanvel, P., Modern Banking, Marcham Publishers, Chennai, 1988.
10. Verma, H.L., Malhotra, A.K, Funds Management in Commercial Bank, Deep & Deep
Publication, 1993.