functional and genomic analyses of klebsiella pneumoniae
TRANSCRIPT

Functional and Genomic Analyses of Klebsiella Pneumoniae Population Dynamics in the Gastrointestinal Tract
CitationWardwell-Scott, Leslie Hansen. 2016. Functional and Genomic Analyses of Klebsiella Pneumoniae Population Dynamics in the Gastrointestinal Tract. Doctoral dissertation, Harvard University, Graduate School of Arts & Sciences.
Permanent linkhttp://nrs.harvard.edu/urn-3:HUL.InstRepos:26718724
Terms of UseThis article was downloaded from Harvard University’s DASH repository, and is made available under the terms and conditions applicable to Other Posted Material, as set forth at http://nrs.harvard.edu/urn-3:HUL.InstRepos:dash.current.terms-of-use#LAA
Share Your StoryThe Harvard community has made this article openly available.Please share how this access benefits you. Submit a story .
Accessibility

!
Functional and Genomic Analyses of Klebsiella pneumoniae Population Dynamics in the Gastrointestinal Tract
A dissertation presented
by
Leslie Hansen Wardwell-Scott
to
The Division of Medical Sciences
In partial fulfillment of the requirements for the degree of
Doctor of Philosophy
in the subject of
Biological and Biomedical Sciences
Harvard University
Cambridge, Massachusetts
November 2015

!
© 2015 Leslie Hansen Wardwell-Scott
!
Dissertation Advisor: Dr. Wendy Garrett Leslie Hansen Wardwell-Scott
Functional and Genomic Analyses of Klebsiella pneumoniae
Population Dynamics in the Gastrointestinal Tract
ABSTRACT
The gastrointestinal tract is home to trillions of bacteria that interact with each
other and with the host’s mucosal immune system. Obligate and facultative anaerobes
thrive in the small and large intestine. While many of these bacteria have beneficial
relationships with their host, opportunistic pathogens can bloom in times of inflammation
and prolong disease. Klebsiella pneumoniae is an opportunistic pathogen that is part of
the gut microbiota in many healthy individuals. Here we explore the population dynamics
of K. pneumoniae in the gastrointestinal tract in mouse models of health and disease.
To assess the role of intra-species genomic diversity in interactions with the host,
a mouse K. pneumoniae isolate and three human clinical isolates from human stool,
sputum, and urine were studied in the T-bet-/- Rag2-/- and dextran sodium sulfate models
of ulcerative colitis and in a mouse model of systemic neonatal infection. Regardless of
host origin, isolate site source, or genomic differences, all four K. pneumoniae isolates
were able to stimulate colonic inflammation. However, only exposure to the murine K.
pneumoniae isolate, and not human clinical isolates, led to neonatal death. In addition,
this murine isolate correlated with differential shifts in levels of other Enterobacteriaceae
species in the colon. Murine K. pneumoniae was found in higher amounts in host
mesenteric lymph nodes compared to human isolates, suggesting subtle strain-based
differences that affect response to K. pneumoniae in the gastrointestinal tract.
iii

!
A defining feature of K. pneumoniae is its mucoid capsular polysaccharide coat.
To begin investigating a role for K. pneumoniae’s capsule in the gastrointestinal tract, K.
pneumoniae biogeography was assessed in gnotobiotic mice. Encapsulated K.
pneumoniae were outcompeted by naturally arising variants with reduced capsule
throughout the gastrointestinal tract of gnotobiotic mice, except in the distal small
intestine. This portion of the small intestine was also the region with the highest host
Paneth cell antimicrobial peptide expression. Micro-injection of K. pneumoniae into
small intestinal organoids revealed increased growth of encapsulated K. pneumoniae in
the presence of α-defensins and decreased survival of K. pneumoniae with reduced
capsule production. Capsule also conferred an advantage when K. pneumoniae was part
of a diverse microbiota. Competition assays between K. pneumoniae and Escherichia coli
showed enhanced survival of encapsulated K. pneumoniae compared to isolates with
reduced capsule production. These data suggest that host AMPs, in combination with
bacterial-bacterial interactions, shape population dynamics of K. pneumoniae and select
for encapsulated K. pneumoniae throughout the gastrointestinal tract. Overall, these
studies provide a foundation for understanding interactions between K. pneumoniae, the
host, and other bacteria in the gastrointestinal tract.
iv
!
TABLE OF CONTENTS Preface'......................................................................................................................................................'iii'Abstract(....................................................................................................................................................................(iii(
Acknowledgements(..............................................................................................................................................(v(
List(of(Figures(.......................................................................................................................................................(vii(
List(of(Tables(..........................................................................................................................................................(ix(
List(of(Abbreviations(..........................................................................................................................................(ix(
Chapter 1: Introduction'...........................................................................................................'1(I.(Copyright(Disclosure(.......................................................................................................................................(2(
II.(Overview(.............................................................................................................................................................(2(
III.(Gastrointestinal(microbiota(and(the(intestinal(epithelium(..........................................................(2(
IV.(Mouse(models(and(molecular(tools(used(to(study(microbial(communities(.......................(15(
V.(Klebsiella(pneumoniae(epidemiology,(taxonomy,(and(environments(....................................(21(
Chapter 2: Klebsiella pneumoniae and disease: assessing strain-dependent virulence and defining the minimal microbial community necessary for disease induction'...'30(I.(Attributions(......................................................................................................................................................(31(
II.(Abstract(.............................................................................................................................................................(31(
III.(Introduction(..................................................................................................................................................(32(
IV.(Results(..............................................................................................................................................................(35(
V.(Discussion(........................................................................................................................................................(54(
VI.(Materials(and(Methods(.............................................................................................................................(57(
Chapter 3: The gut microbiota and host antimicrobial peptides influence Klebsiella pneumoniae capsular polysaccharide population dynamics'.........................................'62(I.(Attributions(......................................................................................................................................................(63(
II.(Abstract(.............................................................................................................................................................(63(
III.(Introduction(..................................................................................................................................................(64(
IV.(Results(..............................................................................................................................................................(66(
V.(Discussion(........................................................................................................................................................(90(
VI.(Materials(and(Methods(.............................................................................................................................(95(
Chapter 4: Conclusions and Future Directions'.............................................................'105(I.(Conclusions(.....................................................................................................................................................(106(
II.(Limitations(and(future(directions(........................................................................................................(107(
Appendix I'..............................................................................................................................'112(Supplementary(Materials(.............................................................................................................................(112(
References'..............................................................................................................................'121(!
v

!
ACKNOWLEDGEMENTS
There is a small village worth of people who I need to thank for their support,
guidance, and contributions to my graduate school years. First and foremost, I would like
to thank my PhD advisor, Wendy Garrett. I am extremely grateful for the numerous
opportunities Wendy has presented me with, many of which fall well outside the realm of
typical student experiences. I have learned so much from Wendy as a scientist and she
has challenged me to think independently, continuously question results, and find
alternative solutions to complex problems. Her office door is always open and she has
supported me on a winding path that has included two internships and numerous life
discussions as I transition towards a career in the commercialization of science.
I would also like to thank members of my dissertation advisory committee John
Mekalanos, Jerry Pier, and Colleen Cavanaugh for their guidance over the years. Their
thoughtful discussions and feedback have helped my project progress and develop. Thank
you also to my defense committee members John Mekalanos, John Leong, Cammie
Lesser, and Laurie Comstock for taking the time to read and discuss my work.
While in the Garrett lab, I have been surrounded by a fabulous group of scientists
and I would like to thank them all. Their support has been immeasurable and their humor
has carried me through many failed experiments. Special thank you to the original
members with whom I’ve shared these 5 ½ years. I would like to thank Carey Ann
Gallini for keeping the lab running, the music pumping, and for her friendship; Michael
Howitt for being a phenomenal baymate, but more importantly, for being an unofficial
PhD mentor. His future trainees will be lucky to have his support. Monia Michaud’s
experienced bench hands and knowledge have helped me though many protocols. I have
vi

!
been fortunate to share my time in the lab with fellow student, Michelle Rooks- thank
you for being a friend and for teaching us all balance. Thank you to Sonia Ballal for her
deep discussions, genuine care, and for showing us how to combine the titles of
physician, scientist, and mother into a single sentence every day. To Eunyoung Chun for
her unwavering smile and for sharing her immense knowledge of immunology. To
Sydney Lavoie, who makes me laugh on a constant basis. And finally, thank you to the
more recent additions, Caitlin Brennan, Kathrin Fenn, and Nora Ou for helping make lab
feel less like work and more like family.
Thank you to my mother Kristina, father Stephen, and sister Annie. This thesis
would not be possible without their constant support over the past 29 years. I am grateful
that they bought me my first microscope and forced me to look at magnified bug wings
after I told them I wanted to grow up to be an artist. I have learned invaluable lessons
about persistence, hard work, and thoughtful decision making from all three of them.
Finally, I would like to thank my husband Jonathan who has been the center of
my support system since before I even declared biology as a major in college. His
constant belief in me has pushed me academically and professionally to heights that I
never thought possible (and also to ski faster than what is generally considered safe).
Thank you for pretending to understand the devastation of contaminated germ-free mice
and for distracting me from it with home cooked meals.
!
!
vii

!
LIST OF FIGURES !Figure 2.1. Mouse and human clinical K. pneumoniae isolates on MacConkey agar………36 Figure 2.2. K. pneumoniae isolates do not significantly differ in their ability to initiate colonic inflammation……………………………………………………………………………37 Figure 2.3. TRUC K. pneumoniae WGLW5 induces systemic neonatal infection and stably colonizes survivors.……………………………………………………………………………...39 Figure 2.4. Relationships between 9 K. pneumoniae isolates based on comparative genomics from whole genome sequence…………………………………………………………………...42 Figure 2.5. OrthoMCL gene clusters of 9 K. pneumoniae isolates……………………………43 !Figure 2.6. Sexual dimorphism of colitis severity in gnotobiotic Tbet-/- Rag2-/- mice associated with stool from sick SPF-Tbet-/- Rag2-/- mice …………………………………………………..47 Figure 2.7. Microbial signatures in the gut correlate with severity of intestinal inflammation and mouse sex……………………………………………………………………………………49 Figure 2.8. Discriminate bacterial taxa between female mice and a subset of male mice…..50 Figure 2.9. Generation of gnotobiotic ASF colonies…………………………………………..52 Figure 2.10. K. pneumoniae and P. mirabilis do not induce colitis in ASF-Tbet-/- Rag2-/- mice. …………………………………………………………………………………………………….53 Figure 3.1. K. pneumoniae CPS population shift following GI colonization of gnotobiotic mice……………………………………………………………………………………………….68 Figure 3.2. Plasmid profiles of mucoid (MUC) and NMV K. pneumoniae…………………..71 Figure 3.3. K. pneumoniae populations do not shift after 24 hours in desiccated stool……..72 Figure 3.4. Fitness advantage of NMV K. pneumoniae in response to Gastrointestinal tract environmental features………………………………………………………………………….74 Figure 3.5. NMV K. pneumoniae colonization is not adversely affected by DSS-induced inflammation in the colon……………………………………………………………………….76 Figure 3.6. CPS affords K. pneumoniae a competitive advantage in the presence of a diverse microbiota………………………………………………………………………………………..78 Figure 3.7. Mauve alignment of the TRUC E. coli genome to other gastrointestinal E. coli isolates……………………………………………………………………………………………81 Figure 3.8. BLAST ring image of TRUC E. coli genome compared to 8 human gastrointestinal E. coli isolates………………………………………………………………….82
viii

!
Figure 3.9. Genomic island content of TRUC E. coli………………………………………….83 Figure 3.10. T6SS1 and T6SS2 of TRUC E. coli………………………………………………85 Figure 3.11. Biogeography of mucoid (MUC) K. pneumoniae populations correlate with regions of high Paneth cell AMP expression in the Gastrointestinal tract…………………..87 Figure 3.12. CPS protects K. pneumoniae against killing by Paneth cell AMPs…………….89 Supplemental Figure 3.1. Reduced glucuronic acid content of NMV K. pneumoniae isolates.. …………………………………………………………………………………………………...113 Supplemental Figure 3.2. Comparative genomic analyses of K. pneumoniae variants……114 Supplemental Figure 3.3. Growth curve of K. pneumoniae variants in LB broth…………115 Supplemental Figure 3.4. Biogeography of K. pneumoniae and host AMP expression throughout the Gastrointestinal tract………………………………………………………...116 Supplemental Figure 3.5. β-defensin killing of K. pneumoniae variants……………………117 !
!
ix

!
LIST OF TABLES !Table 1.1. Defined microbial communities used in gnotobiotic mouse studies……………...18 Table 1.2 Sequencing technologies and platforms used for 16S rRNA amplicon surveys….20 Table 2.1. K. pneumoniae genome details for comparative genomics study…………………41 Table 2.2. Differential predicted proteins identified by OrthoMCL between K. pneumoniae isolates………………………………………………………………………………………...44-45 Table 2.3. K. pneumoniae 28S RT-qPCR primers……………………………………………..59 Table 2.4. 16S primers used for microbial survey assessment………………………………..60 Table 2.5. Primers for PCR confirmation of the 8 ASF flora in stool from gnotobiotic mice... …………………………………………………………………………………………………….61 Table 3.1. In vitro culture conditions and in vivo gnotobiotic associations with K. pneumoniae WGLW5 and corresponding shifts in CPS phenotype…………………………70 Table 3.2. Predicted genomic island content of TRUC E. coli………………………………..84 Table 3.3. K. pneumoniae whole-genome sequence submissions……………………………..99 Table 3.4. Primer sequences used in RT-qPCR expression studies………………………...103 Supplemental Table 3.1. Average log10CFU/g stool and SD of K. pneumoniae in stool from gnotobiotic and specified pathogen free associations………………………………………..118 Supplemental Table 3.2. Samtools SNP output of K. pneumoniae variant whole-genome sequences aligned to reference genome WGLW5……………………………………………119 !Supplemental Table 3.3. Gene coverage similarity between K. pneumoniae variants……..120!!
x

!
LIST OF ABBREVIATIONS !AAD antibiotic-associated diarrhea AIEC adherent and invasive Escherichia coli AMP antimicrobial peptide ASF altered Schaedler flora CPS capsular polysaccharides DC dendritic cell DSS dextran sodium sulfate GF germ-free GI gastrointestinal tract HGT horizontal gene transfer KPC Klebsiella pneumoniae carbapenemase LCB local collinear block LDA linear discriminant analysis LPS lipopolysaccharide MUC mucoid NDM-1 New Delhi metallo-β-lactamase 1 NEC necrotizing enterocolitis NOD nucleotide-binding oligomerization domain NMV non-mucoid variant OTU operational taxonomic unit SFB segmented filamentous bacteria SPF specified pathogen-free T6SS type VI secretion system TLR toll-like receptor TNFα tumor necrosis factor α TRUC Tbet-/- Rag2-/- ulcerative colitis mouse model WGS whole genome sequence WT wild-type
xi

1
!
!
CHAPTER 1
INTRODUCTION !
!
!
!
!
!
!
!
!
!
!
!
!
!

2
I. COPYRIGHT DISCLOSURE
Adapted in part from Wardwell L, Huttenhower C, Garrett W. Current concepts
of the intestinal microbiota and the pathogenesis of infection. Current Infectious Disease
Reports 13(1), 28-34 (2011).
II. OVERVIEW
The intestinal microbiome is the collection of bacteria, viruses, archaea, fungi,
and parasites that reside in the gastrointestinal tract. Microbiome composition plays an
important role in gut immune homeostasis and disruption of the microbiome can lead to
dysbiosis and disease. Depending on host genetics and environmental factors, individual
bacteria can be both beneficial and antagonistic to their host. For example, Klebsiella
pneumoniae is an opportunistic pathogen found in the microbiome of healthy humans that
can also cause pneumonia, urinary tract infections, diabetic liver abscesses, and
bacteremia in susceptible individuals. Adding to K. pneumoniae’s clinical burden is the
global spread of highly antibiotic-resistant strains. While several metabolic genes are
known to be necessary for K. pneumoniae colonization of the gastrointestinal tract, an
awareness of colonization factors and behavior in the gut is incomplete. Since K.
pneumoniae colonization of the gastrointestinal tract predisposes patients for K.
pneumoniae infection, understanding this bacterium in its disease reservoir is of the
utmost importance.
III. GASTROINTESTINAL MICROBIOTA AND THE INTESTINAL EPITHELIUM
Bacterial cells outnumber eukaryotic cells in the human body by greater than ten-
fold. In the gastrointestinal tract alone, there are up to 1012 microbes per gram of stool,
corresponding to up to 100 trillion bacteria in the human gut and representing several

3
hundred distinct bacterial species. These bacteria, known collectively as the intestinal
microbiota, play an important role in a multitude of host functions including energy
extractions from food, production of microbial metabolites, development of the host’s
immune system, and protection from and response to systemic and gastrointestinal
infectious diseases (1, 2). These communities are in turn shaped by host genetics, diet,
and the environment and thus exhibit substantial inter-individual variation (3). Advances
in sequencing technology and the computational methodology to interpret these data have
resulted in an increased appreciation for the role of gut microbiomes in the pathogenesis
of obesity (4), inflammatory bowel disease (5), type 1 diabetes (6), and metabolic
syndrome (7).
Intestinal epithelium
The gastrointestinal tract is divided into the small intestine (duodenum, jejunum
and ileum), and the large intestine (colon). The intestinal epithelium is a single layer of
cells separated from the microbial-rich lumen by a layer of mucus. Stem cells residing in
the crypts of Lieberkuhn give rise to a variety of intestinal epithelial cells that are
renewed every 4-5 days (8). Intestinal epithelial cells include enterocytes, mucus
producing Goblet cells, enteroendocrine cells, antimicrobial producing Paneth cells, and
Tuft cells. Intestinal epithelial cells are connected by tight junctions and form a barrier
between the mucosal immune system and microbes within the lumen (9).
Paneth cells are specialized secretory epithelial cells. Primarily found within the
small intestine, Paneth cell concentrations increase in a descending manner and reach
their height in the distal ileum (10). Paneth cells produce and granocytose antimicrobial
peptides (AMPs) into the lumen to aide in pathogen defense and in shaping composition

4
of the microbiome (11, 12). In humans these antimicrobial peptides include two small,
cationic α-defensins (α-defensin 5 and α-defensin 6), lysozyme, phospholipase A2, and
RegIII α (13). In addition to these AMPs, murine Paneth cells produce many a-defensins,
termed cryptdins, and angiogenin, an antimicrobial Rnase. Paneth cells constitutively
produce AMPs with the exception of RegIIIγ (the mouse isoform of RegIIIα) and
angiogenin, which are induced in the presence of symbiotic bacteria (13). Defects in
Paneth cell function are associated with ileal Crohn’s disease, highlighting the
importance of this cell in gastrointestinal immune homeostasis (14).
Biogeography of gastrointestinal bacteria
Many bacteria of the upper digestive tract are killed by the harsh acidic pH of the
stomach (pH<4) (15). Consequently, the duodenum, or proximal small intestine, is the
area of the small and large bowel with the lowest concentration of luminal and mucosal
bacteria. In addition to reducing numbers, selective pressures encountered in the stomach
also affect diversity of bacterial communities. Large decreases in both phylogenetic and
Shannon alpha diversity have been seen in the stomach and lower gastrointestinal
bacterial communities as compared to those of the mouth (16). As bacteria move along
the small intestine, total numbers and Shannon alpha diversity recover and reach a
maximum in the cecum and throughout the colon.
Early studies on the microbiome have revealed phylum level differences in
community composition according to gastrointestinal biogeography. The mouth
microbiome is marked by a high relative abundance of Fusobacteria; Proteobacteria
predominate in the stomach and retain a high representation in the proximal small
intestine for some individuals (16). In contrast, the colon microbiome is dominated by
5
Gram-negative Bacteroidetes and Gram-positive Firmicutes, followed by less abundant
gram-negative Proteobacteria (17). Rounding out the highly represented phyla of the
colon microbiome are the Actinobacteria and Deferribacteres. In healthy individuals, the
resident intestinal microbiota exists in dynamic balance with the host immune system; the
intestinal epithelium provides an essential barrier that ensures a separate peace between
host and microbe. However, there is constant crosstalk across this barrier between the
immune system and microbiota that is equally important for homeostasis in the gut. The
epithelium, innate and adaptive immune systems, and the intestinal mucus are all active
participants in host defense from infectious diseases that target the gastrointestinal
mucosa as their portal to invading their human hosts. Gut bacteria also provide an
important line of defense for their hosts against invading pathogens, a process known as
colonization resistance.
Colonization resistance
Colonization resistance is the process by which the indigenous gut microbiota
protects a host from infectious microbes. Several mechanisms underpin colonization
resistance, the foremost of which is competition for space and nutrients along the mucus
layer and within the lumen (18). In addition, bacteria employ a number of mechanisms
for direct competition with their microbial neighbors. Short-chain fatty acids, which are
products of commensal bacterial metabolism, are also bactericidal for some enteric
pathogens!(19). Certain Lactobacilli, in particular members of the acidophilus
subgroup, generate reactive oxygen species that are inhibitory to other bacteria in the
gastrointestinal tract (20). Numerous commensals produce antimicrobial peptides, called
bacteriocins, as defensive strategies. Bacteriocins fall into three general categories (I,
6
IIa/b/c, and III) and have distinct activities: nucleases, DNAses, cell wall component (eg,
peptidoglycan) production inhibitors, and pore formers (21). Studies using mouse models
suggest that the composition of a host’s microbiota may influence susceptibility to
enteropathogens (22). Furthermore, particular members of gut microbial communities
impact the ability of pathogens to invade and beneficial microbes to colonize. Hosts with
high Escherichia coli densities are more susceptible to Salmonella enterica infection,
whereas hosts with high Lactobacilli counts are more easily colonized with other
probiotic strains of Lactobacilli (22).
As a third mechanism of colonization resistance, bacteria can influence the host’s
immune system in a way that precludes invasion by pathogens. Presence of bacteria in
the gastrointestinal tract induces Paneth cells in the small intestine to produce REGIIIγ,
an antimicrobial peptide that limits invasion of Gram-positive bacteria across the
epithelial mucus layer (23). Additionally, engagement of host toll like receptors (TLRs)
by bacterial ligands ultimately leads to IgA production by B cells for defense at the
mucosal barrier!(24).
Symbiotic bacteria and the immune response
Symbiotic enteric bacteria are required for immune cell development and function
within the gastrointestinal tract and systemically. Studies from germ-free (GF) and
gnotobiotic mice (mice lacking endogenous microbes) demonstrate abnormal Peyer’s
patches, lymph nodes, and spleen; decreased numbers of mucosal and systemic innate
and adaptive immune cells; and markedly reduced levels of immunoglobulins and other
host defense molecules (25). Susceptibility to numerous bacterial, viral, and parasitic

7
infections is also increased in GF mice, resulting from loss of colonization resistance and
impaired immune system responses.
Several studies have identified that select species or specific bacterial products
play a critical role in the proper functioning of the immune system. Although
Bacteroides fragilis is well known for its opportunistic role in intraperitoneal abscesses,
it also bestows benefits to the host regarding the development of adaptive immunity in
the gut and system-wide. A zwitterionic polysaccharide, polysaccharide A, expressed by
B. fragilis is responsible for these beneficial effects on host immune cell development
and homeostasis (26). In addition, polysaccharide A also appears to protect mice from
experimentally induced inflammatory bowel disease and central nervous system
inflammation (27,!28). T helper 17 cells (Th17), a subset of CD4+ T cells named for its
production of the proinflammatory cytokine IL-17, function in host defense against fungi
and extracellular bacteria and have been implicated in the pathogenesis of numerous
autoimmune diseases (29). In mice, the induction of intestinal Th17 cells requires that the
small intestine is colonized with segmented filamentous bacteria (SFB), a group of
anaerobic, spore-forming, gram-positive bacteria (30). SFB stimulate the expression of
several genes involved in antimicrobial defenses and inflammation. The bacterial
molecules, host sensors, and signaling pathways involved in this SFB-mediated Th17
development remain to be defined.
Both immune and non-immune system cells express a diverse repertoire of pattern
recognition receptors that bind molecular patterns shared among microbes. The TLRs are
one family of pattern recognition receptors. Flagellin, the TLR5 ligand, recently was
shown to restore innate immune defenses against and decrease colonization levels of

8
vancomycin-resistant Enterococcus (31). The nucleotide-binding domain, leucine rich
repeat containing proteins, are another family of microbial recognition receptors.
Nucleotide-binding oligomerization domain protein (NOD) 2 has a broad specificity for
peptidoglycan and NOD1 senses diaminopimelic acid-type peptidoglycan. Intestinal
commensal bacterial-derived diaminopimelic acid-type peptidoglycan plays an important
role in priming systemic innate immunity. Specifically, studies of NOD1-deficient and
wild-type (WT) mice demonstrated that importance of NOD1 signaling for neutrophil
killing of Streptococcus pneumoniae and Staphylococcus aureus (32). Thus, humans
and our ancestors evolved a dual-purpose system for sensing microbes—a system that not
only senses endogenous microbes for the proper development and functioning of the
immune system, but also senses pathogenic invaders to initiate host defense programs.
Antibiotics and the Commensal Microbiota
Antibiotics can have several disruptive effects on the endogenous flora, the most
familiar of which are the antibiotic-associated diarrheas. Recent genomic studies of the
intestinal microbiota, both in human populations and mouse models, have revealed that
antibiotics have unexpectedly widespread and enduring effects on endogenous gut
microbes. Duration of treatment, type of antibiotic, and individual differences all
influence antibiotic-induced changes in the composition of the gut bacterial community
and the resiliency of gut community members to antibiotic treatment. 16S rDNA
enumerations from human stool before and 4 weeks after ciprofloxacin treatment
revealed that although the majority of gut microbes eventually returned to their pre-
treatment relative abundance levels, taxa belonging to the Clostridiales order did not
recover during the observation period (33). A common theme illuminated by studies of

9
the antibiotic effects on gut microbial composition is a reduction in relative abundance of
members of the Firmicutes phylum and specifically several Lactobacillus species, many
of which are considered beneficial microbes (34, 35). Broad-spectrum antibiotic
treatment of mice revealed large proportional increases in the Bacteroidales order. After
only 1 day of antibiotics, representation of this order increased to 95%, from basal levels
of 60% to 70% of the total bacterial population (34). These perturbations have the
potential to be significant in light of recent studies demonstrating a link between diabetes
(36) and obesity (4) and decreased gut microbial diversity and altered Bacteroidetes to
Firmicutes ratios.
Antibiotic-induced alterations of the composition or function of gut microbial
communities are key effectors in susceptibility to several gastrointestinal bacterial
diseases. Antibiotic-associated diarrhea (AAD) is a common complication of antibiotic
use, and Clostridium difficile is the most frequent cause of AAD, colitis, and
pseudomembranous colitis (37). Klebsiella oxytoca, Clostridium perfringens,
Salmonella spp, Candida spp, and Staphylococcus aureus are far less common causes
of AAD. Both the incidence and death rates of C. difficile–associated colitis have
increased at an alarming rate over the past decade (117% increase in incidence between
2000 and 2006 and a 35% increase in mortality rates) (37). Estimates of asymptomatic
carriage of C. difficile range between 1% and 55.4%, based on the population observed
(38). A few studies have begun to delve into how the composition of the fecal microbiota
affects susceptibility and risk of recurrence of C. difficile–associated diarrhea. A
correlation between C. difficile–associated diarrhea and the extent and duration of
decreased diversity in response to antibiotics is emerging (38). A recent study by Giel et

10
al. (39) provides mechanistic insight into how antibiotic treatment may result in C.
difficile sporulation and subsequent AAD. Bile salt metabolism by the commensal
microbiota appears to be a key effector. A cholestyramine-sensitive factor in cecal or
intestinal extracts of antibiotic-treated mice stimulated C. difficile colony formation
from spores much more efficiently than samples from untreated mice (39).
Antibiotics also increase susceptibility to invading microbes of the
gastrointestinal tract. Treatment of mice with streptomycin or vancomycin lowered the
inoculum dose required to cause morbidity with Salmonella enterica Serovar
Typhimurium (40). The doses of antibiotics used in this study did not reduce total
bacteria numbers in the gut, a finding emphasizing that composition and function of the
community are important factors in mediating host resistance to invading pathogens.
Beyond shifting relative abundances of gut bacteria, antibiotics also have the ability to
influence the genomic potential and expression of the gut microbial community.
Treatment with high doses of antibiotics selects for bacteria with antibiotic resistance
genes on mobile genetic elements. Even though the typical members of the gut microbial
community may re-colonize the gut over time, horizontal gene transfer of antibiotic
resistance may irrevocably alter the intestinal microbiota.
Gut microbiota as reservoirs of resistance
The existence of lag times between when widespread clinical use of an antibiotic
begins and when resistance becomes a problem—a few years for penicillin and more than
30 years for vancomycin (41)—suggests that gut bacteria living without exposure to
antibiotics do not typically harbor resistance genes. However, bacteria in the soil, an
ancient antibiotic resistance reservoir, have spent millions of years evolving in the
11
presence of natural antimicrobials, resulting in the expression and spread of many
resistance genes via horizontal gene transfer (HGT) (42). The gut represents an
environment that, like soil, is highly conducive for HGT—a dense population of bacterial
cells, often found organized similar to a biofilm (41). Once in the gut, antibiotic
resistance genes can disseminate throughout the bacterial population, especially under
selection pressure from clinically administered antibiotics, and these effects of HGT can
endure after selection is removed. After combined antibiotic treatment for Helicobacter
pylori gastritis (with a clarithromycin and metronidazole regimen), gut enterococci
exhibited high macrolide resistance for 1 year after treatment; for one patient, resistance
remained even after 3 years (43). A study of the gut microbiotas of two healthy
individuals with no antibiotic exposure in the preceding year found antibiotic resistance
genes in both commensal and opportunistic fecal bacteria (44). Almost half of the
antibiotic resistance genes identified from the sub-cultured fecal isolates were genetically
identical to antibiotic resistance genes found in known human pathogens (44). Thus, the
commensal gut microbiome represents a reservoir of antibiotic-resistance genes. Through
HGT, otherwise harmless commensals have the potential to transfer antibiotic resistance
determinants to pathogens, which may lead to the emergence of clinically problematic
strains.
Viruses and gut bacterial communities
Viral gastroenteritis
Viruses are frequently the causative agent of gastroenteritis, one of the most
common infectious diseases worldwide (45). Specifically, noroviruses were found to be
responsible for 93% of viral gastroenteritis outbreaks in the United States during a 3-year

12
study period between 1997 and 2000 (46). Although viral gastroenteritis in adults is most
commonly linked to noroviruses, gastroenteritis in children is caused by a broader group
of viruses that, along with noroviruses, includes rotaviruses, astroviruses, and sapoviruses
(47). Both astroviruses and rotaviruses have been shown to directly increase gut mucosal
permeability (48). Loss of gut barrier integrity alters the delicate balance between the
immune system and commensal microbiota, and thus compromises defenses against a
broad range of gastrointestinal pathogens.
The variable attack rates of enteric viruses bring into question the role of the gut
microbiota in shaping susceptibility. Undertaking prospective studies of the gut
microbiota that follow populations over time may illuminate characteristics of microbial
communities associated with resistance to viral gastroenteritis. Although it is not well
understood if or how gut microbial populations affect infection with enteric viruses,
rehydration therapy in conjunction with supplementation with multiple Lactobacilli
spp. (reuteri, acidophilus, delbrueckii bulgaricus, and casei) and Saccharomyces
boulardii reduced the duration of rotavirus-associated diarrhea and significantly reduced
viral shedding (49, 50). Further research into how certain bacteria are able to aid the host
in clearance of viral infections could be beneficial not only in understanding viral
pathogenesis, but also in understanding relationships between viruses and bacteria in the
gut.
Noroviruses and inflammatory bowel disease susceptibility
Commensal gut bacteria are important contributors to the pathophysiology of
inflammatory bowel disease, and evidence suggests that the gastrointestinal microbiota of
inflammatory bowel disease patients differ from healthy controls (5), with reduced

13
relative abundances of members of the Bacteroidaceae and Lachnospiraceae families
(51). Recent evidence suggests that the contribution of microbes to inflammatory bowel
disease extends beyond commensal bacteria to include enteric viruses. About 50% of
individuals of European descent carry a mutant allele of the autophagy gene Atg16L1,
which is a Crohn’s disease susceptibility allele (52). A recent study using a mouse model
with reduced Atg16L1 function begins to explain the contributions of both viruses and
bacteria to Crohn’s disease susceptibility. Infection with a specific norovirus along with a
full complement of gut bacteria was required for eliciting Crohn’s disease-like pathology
after intestinal injury was triggered in mice with reduced Atg16L1 (53). In the absence of
viral exposure or if the commensal bacteria were depleted with antibiotics, Crohn’s
disease-like inflammation did not develop, thus demonstrating that a complex web of
microbial (viral and bacterial) and host factors underlie Crohn’s disease. Although enteric
viruses may not cause inflammatory bowel disease single-handedly, they have the
potential to shape the host immune response and intestinal environment in a manner that
promotes dysfunctional host-commensal interactions.
Gut bacterial viruses
Studies of human gut microbiota have revealed that coliphages (enteric bacterial
viruses) infect many Enterobacteriaceae (E. coli, Salmonella spp, Klebsiella spp)
and other Bacteroidetes and Firmicutes (54). Despite overwhelming evidence of viral-
bacterial interactions in the human gut, the consequences of such interactions in the
context of gastrointestinal disease have not been fully explored. Classical phage-bacterial
host interactions are characterized by an evolutionary struggle for and against viral
invasion. However, in the fecal microbial community of healthy humans, viral life cycles

14
tend to be temperate (non-lytic) with low variation over time, and with little genomic
evidence of bacteria evolving mechanisms to prevent phage attachment and invasion
(55). Enteric phages that are in constant contact with commensal bacteria in the gut have
the potential to act in a commensal manner of their own and may confer growth
advantages to their hosts (54). Several viral-like particles found in healthy human feces
encode proteins involved in peptidoglycan synthesis, pyruvate and folate metabolism, and
oxidative stress response (55). By introducing new genes and associated functions,
viruses have the ability to change the microbiome of the gut. In light of recent findings
that recognize associations between bacteria and human diseases, and between bacteria
and viruses in the gut, future attention should be focused on the ways in which coliphages
are able to shape the composition and function of commensal bacterial communities in
the gastrointestinal tract.
Inflammatory bowel disease
Ulcerative colitis and Crohn’s disease are the two main forms of inflammatory
bowel disease and both are attributed to a combination of an individual’s genetic
susceptibilities, microbiota, and environment (56, 57). Ulcerative colitis and Crohn’s
disease are seen at higher rates in westernized countries and have been linked to factors
such as stress, diet, medication and socioeconomic status (58). Despite some similarities,
ulcerative colitis and Crohn’s disease differ in several significant characteristics. In
ulcerative colitis, inflammation occurs exclusively in the colon, while Crohn’s disease
can present throughout the gastrointestinal tract. Furthermore, ulcerative colitis and
Crohn’s disease differ in tissue pathology, genetic susceptibilities and therapeutic

15
treatment approaches (59). Ulcerative colitis has a greater incidence rate than Crohn’s
disease in the United States (60), with an estimated 15,000 new cases per year (61).
Currently there are 47 known risk loci associated with ulcerative colitis (62).
Several mouse models have been used to recapitulate disease (56), including the acute
dextran sulfate sodium (DSS) model, a sulfated polysaccharide that chemically induces
barrier damage (63), and IL-10-/- or IL-10R-/- mice (64) that are missing gene products
necessary for CD4+ T-regulatory cell maintenance of gut homeostasis (65). In the TRUC
(T-bet-/- Rag2-/- ulcerative colitis) mouse model (66), Rag2 (recombination activating 2)
gene deletion leads to the loss of an adaptive immune response through disruption of VDJ
recombination (67), which is necessary for the generation of B and T lymphocytes.
Absence of T-bet, a transcription factor important for regulation of innate and adaptive
proinflammatory responses (68), results in innate immune defects. In dendritic cells
(DCs), T-bet binds the promoter of mouse TNFα (tumor-necrosis factor α) to repress
TNFα transcription (66), and a consequence of T-bet loss is un-regulated production of
TNFα by bone-marrow derived DCs.
IV. MOUSE MODELS AND MOLECULAR TOOLS USED TO STUDY MICROBIAL COMMUNITIES Gnotobiotic mice and defined microbial communities
Understanding the role that individual bacteria play in the gastrointestinal tract,
both in terms of host interactions and microbial community relationships, is difficult due
to the complexity of the microbiota and redundancy in members and function. Tool
advancements in the form of GF mice have revolutionized the way researchers can study
16
interactions between defined microbial communities and their hosts (69). GF mice are
bred and maintained inside microisolators in a sterile environment. Modern GF facilities
use a combination of techniques to ensure sterility of all equipment, food, and supplies
including chlorine dioxide dunks, autoclaving, and ethylene oxide gas. Absence of
microbes is confirmed with regular conventional culture and molecular tests on
equipment swabs and mouse stool. Mouse lines can be derived GF via C-section of SPF
females, dunking of the uterus into chlorine dioxide, and rearing of pups by a GF foster
female.
While GF mice represent an ideal animal model for understanding interactions
between single microbes and their host, animal development in a sterile environment
leads to physiological deficiencies. GF mice gain weight more slowly than mice reared in
the presence of microbes (specified pathogen-free, SPF) and increased calorie intake is
required to maintain normal weight!(70). These mice have abnormal Peyer’s patches,
lymph nodes, and spleens and their ceca are markedly larger in size. Development of the
immune system is also impaired in GF mice with decreased numbers of mucosal and
systemic immune cells and markedly reduced immunoglobulin-A levels in the colon (25).
In order to correct some of the defects observed in GF mice while maintaining an
experimentally tractable microbiome, research groups have turned to the use of
gnotobiotic mice with specific and defined bacterial inputs. In the 1960’s, Russell
Schaedler was the first to report colonizing gnotobiotic mice with a defined and reduced
gut microbiota (71). A variation of the original flora, known commonly as the Altered
Schaedler Flora (ASF), is used by many investigators to standardize gnotobiotic studies,
allowing for environmental continuity between facilities and a reduction in community

17
complexity!(72). ASF members are representative of abundant and functionally important
gut bacteria in the healthy mouse microbiome, and are able to stimulate normal immune
responses!(73). Specifically, ASF mice show normal IgA secretion into the gut lumen and
restoration of colonic T-regulatory cell populations. A practical advantage of an ASF
microbiota is that all strains are culturable under anaerobic conditions. The ASF include
the following bacterial species: Clostridium spp. (ASF356), Lactobacillus spp. (ASF360),
Lactobacillus murinus (ASF361), Mucispirillum schaedleri
(ASF457), Eubacterium plexicaudatum (ASF492), Firmicutes bacterium (ASF500),
Clostridium spp. (ASF502), and Parabacteroides spp. (ASF519).
While the ASF has been used for many years, this community has a noted
deficiency in Bacteroidetes and Proteobacteria in comparison to the human gut
microbiota. Recently, groups have begun to refine defined consortia of bacteria for
gnotobiotic colonization. Jeffrey Gordon and Andrew Goodman developed a defined
gnotobiotic community composed of 14-bacteria to model the human colon; 6
Bacteroidetes spp., 7 Firmicutes, and an Actinobacteria (74) (Table 1.1). Koji Atarashi
and Kenya Honda focused on the Firmicutes, and specifically the class Clostridia, in
devising a human-derived microbial consortia (75).
16S rRNA gene survey for microbial community assessment
One of the biggest challenges of studying mixed microbial communities is
defining which bacterial species are present. Before the advent of molecular techniques,
standard culturing methods were needed to ask questions about microbial community
composition. Despite hundreds of years of optimization of culturing methods, it is widely
estimated that 99% of bacteria in a given environment remain unculturable. For the gut

18
Table 1.1. Defined microbial communities used in gnotobiotic mouse studies. ASF Goodman/Cordon
Consortium Clostridia cocktail
Representing Mouse gut microbiome
Human gut microbiome Human Clostridia compartment
Firmicutes Clostridium spp Lactobacillus spp Lactobacillus murinus Eubacterium plexicaudatum Firmicutes bacterium Clostridium spp
Ruminococcus obeum Eubacterium rectale Dorea longicatena Clostridium symbiosum Clostridium spiroforme Clostridium scindens Ruminococcus torques
Clostridium asparagiforme Anaerotruncus colihominis Clostridiaceae JC13 Clostridium bolteae Clostridiales 1_7_47FAA Lachnospiraceae 7 1 58FAA Clostridium scindens Clostridium 7 3 54FAA Ruminococcus sp. ID8 Clostridium indolis Eubacterium fissicatena Clostridium ramosum Lachnospiraceae 3_1_57FAA (2 isolates) Clostridium sp. 14774 Blautia producta Clostridium hathewayi
Bacteroidetes Parabacteroides spp Parabacteroides distasonis Bacteroides WH2 Bacteroides vulgatus Bacteroides uniformis Bacteroides thetaiotamicron Bacteroides ovatus Bacteroides caccae
None
Proteobacteria None None None Actinobacteria None Collinsella aerofaciens None Deferribacteres Mucispirillum
schaedleri None None

19
microbiome, this number greatly decreases to 10% unculturability when anaerobic
culturing techniques are combined with passage of human fecal communities through
gnotobiotic mice (76), but the cost and time required for this dual approach can be
prohibitive. In vitro culturing alone leaves 55% of species unclulturable.
In 1991 work from Norman Pace and colleagues demonstrated that PCR cloning
and sequencing of the bacterial 16S ribosomal RNA (16S rRNA) gene from DNA
extracted from bulk environmental samples could reveal phylogenetic diversity of mixed
bacterial communities (77). The discriminative power of this approach is two-fold. First,
ribosomal building blocks differ between Prokaryotes and Eukaryotes, allowing for
selective amplification of conserved bacterial sequences in samples with Eukaryotic
contamination, a principle pioneered by Carl Woese in 1977 (78). Second, the 16S rRNA
component of the Prokaryotic 30S ribosomal subunit contains regions of discriminately
significant variability between bacterial species (79). For analysis of bacterial community
membership, PCR primers are designed to recognize a conserved region of the 16S rRNA
gene and amplify across one or more of the nine hypervariable and discriminative
regions. Depending on the hypervariable regions amplified, this approach can reveal
genus level identification for all sequence reads within certain populations, and
identification to the species level for a subset of sequences (79).
The sequencing technologies and platforms that have been used for 16S rRNA
surveys are summarized in Table 1.2. Illumina, Life Technologies, and Roche all
manufacture high throughput and benchtop machines that differ in read length, run
capacity, and molecular technologies. While most early 16S surveys were performed
using Roche’s 454 Pyrosequencing platform, Illumina machines have captured the

20
majority market share in recent years due to their lower run costs, high accuracy, and
large amount of data generated (80). Moving forward, Illumina machines will continue to
gain market usage as Roche phases their 454 platform out of production.
Table 1.2. Sequencing technologies and platforms used for 16S rRNA amplicon surveys.
Company Sequencing
Platform Technology Details Notes
Illumina
HiSeq (high throughput) __
Has generated 90% of the world’s high throughput
sequenced genetic material
MiSeq (benchtop)
Read length: 300bp GB per run: 15
Reads per run: 30M
>50% market share in bench top sequencers; first FDA
approved sequencing machine
Life Technologies
Ion Torrent PGM
(benchtop)
Read length: 400bp GB per run: 2
Reads per run: 5M
FDA approved sequencing machine
Ion Proton (benchtop)
Semiconductor chips to detect protons given off during nucleotide
addition __
SOLiD (high throughput) Sequencing by ligation Overtaken by Illumina HiSeq
Roche
454 Pyrosequencing Long read Being phased out- production
will stop by the end of 2015
GS FLX (benchtop)
Read length: 700bp GB per run: 0.07
Reads per run: 0.1M __
Computation tools for analysis of 16S rRNA amplicons
Depending on sequencing depth, 16S rRNA surveys can generate tens of
thousands of reads per sample. Many computational analysis tools have been developed
for processing and analyzing these large sequence datasets including QIIME
(Quantitative Insights Into Microbial Ecology) to process sequences (81), PICRUSt
(Phylogenetic Investigation of Communities by Reconstruction of Unobserved States) to
predict metagenome and function from 16S sequences (82), and LefSe (Linear
discriminant analysis Effect Size) to identify operational taxonomic units that are most
likely to explain differences between classes (83). These tools have aided in a greater

21
understanding of microbial community membership and function across a diverse range
of environments.
V. KLEBSIELLA PNEUMONIAE EPIDEMIOLOGY, TAXONOMY, AND ENVIRONMENTS !
Klebsiella pneumoniae is a rod-shaped, Gram-negative species of Proteobacteria
from the family Enterobacteriaceae. K. pneumoniae is a facultative anaerobe that was
first observed by Edwin Klebs in 1875, and officially described in 1882 by Carl
Friedlander as a bacterial cause of pneumonia (84). Since then, K. pneumoniae has been
isolated from a diverse array of environments including water, soil, plants, and mucosal
surfaces of mammals such as the skin, nasopharynx, lungs, mouth, urinary tract, and
gastrointestinal (GI) tract (85). In the soil and in association with plants, K. pneumoniae
is considered a plant growth promoting bacteria due to it’s ability to fix nitrogen for
uptake by plant roots (86). Conversely, K. pneumoniae is considered an opportunistic
pathogen when associated with human hosts and is a common cause of pneumonia,
urinary tract infections, bacteremia, liver abscesses and nosocomial infections (87).
K. pneumoniae virulence factors
K. pneumoniae has classically been studied from the context of virulence given
this bacterium’s role in disease. Several factors have been identified as virulence factors
that aide in K. pneumoniae’s colonization of the host and evasion of immune defenses.
These virulence factors include lipopolysaccharides (LPS), capsular polysaccharides
(CPS), fimbriae, and siderophores (85).

22
LPS
LPS is common feature of Gram-negative bacteria and is the layer of extracellular
polysaccharides anchored in the bacterial outer membrane by lipid A. A core
oligosaccharide is covalently bound to lipid A on one side and the O-antigen on the other
(88). Also known as endotoxin, LPS is a microbe-associated molecular pattern (MAMP)
that is bound by toll-like receptor 4 (TLR4) on host immune cells including monocytes,
dendritic cells, and macrophages. LPS can initiate a pro-inflammatory cascade and fever
in mammalian hosts (89).
CPS
In addition to LPS, K. pneumoniae has another layer of extracellular
polysaccharides known as CPS, or capsule. Over 80 capsule serotypes have been
identified from K. pneumoniae isolates with several displaying increased virulence.
Capsule serotypes K1 and K2 are especially virulent and cause severe liver abscesses in
diabetic and immune compromised patients (90, 91). K. pneumoniae capsule consists of
glucose, glucuronic acid, and 1 to 4 variable sugars (92). Variable sugars found within K.
pneumoniae capsule include, mannose, rhamnose, and fucose (93). The presence of a
capsule has been shown to protect K. pneumoniae from phagocytosis and complement
opsonization, allowing evasion of the host’s immune system (94). Non-mucoid variants
(NMVs) of K. pneumoniae, which have reduced production of CPS, have been observed
at low frequency in vitro (95) and at least once in vivo from a patient with a urinary tract
infection (96). However, a role for these K. pneumoniae NMVs has not been defined in
vivo. Since the majority of K. pneumoniae isolates recovered from both infected and

23
healthy humans are mucoid, there are likely advantages to capsule production outside of a
virulence context.
K. pneumoniae capsule is encoded on single copy loci within the bacterial
chromosome that ranges from 16-25 ORFs (93). The K. pneumoniae CPS locus is divided
into three regions. Starting at the 5’ end are a group of conserved genes, including galF,
orf2, wzi- an outer membrane protein, wza- which forms a multimeric translocation
channel, and wzc- a tyrosine autokinase. Protein products of these genes are involved in
capsule polymer translocation from the inner membrane to the outer membrane. 6-10
isolate specific glycosyltransferases lie in the middle of the loci, along with the conserved
glycosyltransferases wbaP and wcaJ. WbaP and wcaJ are responsible for transfer of
sugar nucleotides to lipid receptors (97). Serotype specific glycosyltransferases are
thought to connect repeating nucleotide sugar subunits to each other (97) and are a major
source of variation between the many K. pneumoniae serotypes (93), although the exact
role that each glycosyltransferase plays in capsule synthesis is undefined for K.
pneumoniae. On the 3’ end of the capsule loci are a set of genes whose protein products
participate in modification of the nucleotide linked sugars. Conserved genes in this region
include ugd and uge, which are involved in the synthesis of UDP-glucuronic acid from
UDP-glucose (98). Variable genes in this region could include manC/B for synthesis of
GDP-D-mannose, or rmlA/C/D for synthesis of dTDP-L-rhamnose (99).
Regulation of capsule production is complex and incompletely defined. Several
master transcriptional regulators have been shown to influence CPS production in K.
pneumoniae, including Fur. Fur activates CPS synthesis in environments with ample iron
and represses synthesis in times of iron stress (100). In addition to Fur, K. pneumoniae

24
CPS production is also regulated by RcsBCD, a two-component phosphorylation cascade
that leads to transcriptional activation at the CPS promoter in response to environmental
stimuli. The RcsBCD two-component system can also be activated by RmpA, the protein
product of rmpA, which is carried on the 180-kb virulence plasmid, pKP100 (101).
Plasmid pKP100 is typically found in isolates of the virulent K1 and K2 serotypes. A
second virulence plasmid, pLVPK contains both rmpA and rmpA2. RmpA2 is a
transcriptional activator of the LuxR family and can bind with RcsB or directly to the
CPS promoter to stimulate capsule production (101). While diverse capsule regulation
mechanisms have been detailed, it is not clear how these multiple inputs are integrated by
K. pneumoniae.
Fimbriae K. pneumoniae are non-motile and lack flagella. However, they do have fimbriae,
projections composed of curlin protein, extending from their outer membrane. These
projections measure approximately 4.2 nanometers in diameter and 1.5um in length
(102). Fimbriae contain adhesins that aide in the attachment of bacteria to each other and
to host cells. Two fimbriae types have been observed in the K. pneumoniae genus, type 1
and type 3 (103). Type 1 fimbriae have been identified in many species of
Enterobacteriaceae and are used by bacteria to adhere to the urogenital epithelium in a
mannose dependent manner (104). Type 3 fimbriae have been found to agglutinate
erythrocytes, are thought to play an important role in biofilm formation, and are mannose
insensitive (105).
The presence of a capsule impedes the ability of fimbriae to adhere to neighboring
cells. Several reports suggest that fimbriae and capsule may be opositionally regulated
25
and coordinated to both the anatomical location and stage of infection (106). Fimbriae are
especially important in establishing urinary tract infections, but do not influence K.
pneumoniae’s ability to colonize the gastrointestinal tract or nasopharynx (107).
Siderophores While essential for bacterial growth, iron is limited under normal conditions in
mammalian hosts and sequestered by host proteins including hemoglobin, transferrin,
lactoferrin, and ferritin. For this reason, many bacteria produce siderophores- compounds
with a strong affinity for iron that are released by bacteria and taken back up after they
have acquired ferric iron and formed soluble Fe3+ compounds (108). K. pneumoniae
produces several known siderophores, the most common being enterobactin (109).
Hypervirulent isolates have been found to produce additional siderophores including
yersiniabactin, salmochelin, and aerobactein. Aerobactin is particulary important in
supporting both ex vivo growth and virulence of hypervirulent K. pneumoniae (110).
Klebsiella genome and plasmids
The advent of whole genome sequencing and analysis tools has significantly
contributed to an understanding of genome structure and diversity with the K.
pneumoniae species. On average, the K. pneumoniae genome is 5.3 mega base pairs. Of
the 5,705 genes per genome (median), 1,743 are conserved across 328 isolates and are
considered part of the core K. pneumoniae genome (111). Much of the large accessory
genome shows evidence of acquisition through horizontal gene transfer due to altered
G+C content relative to the core genome. These transfer events likely occurred with other
bacterial species such as Vibrio and Acinetobacter (111).

26
Comparative genomics pipelines have been used to identify strain based virulence
determinants in K. pneumoniae strains (112). A popular tool for comparative genomics is
OrthoMCL(113), a graph-based Markov-clustering algorithm that allows parsing of
proteomes into protein groups representing orthologs, paralogs and co-orthologs. A
comparative genomics analysis of K. pneumoniae plasmids revealed similarities across
isolate types that suggest a strong role for horizontal gene transfer in the genomic
evolution of the species!(114). Many of K. pneumoiae’s plasmids carry important
virulence determinants, including the previously mentioned plasmids pkP100 and
pLVPK, which are involved in regulation of capsule production.
Antibiotic resistance of K. pneumoniae
Antibiotic resistant K. pneumoniae represents a large and recent threat to human
health. The first K. pneumoniae isolate with resistance to a broad range of antibiotics was
discovered in 1996 in a patient from North Carolina (115). This isolate produced
Klebsiella pneumoniae carbapenemase (KPC), conferring weak resistance to
carbapenems, which are beta lactam antibiotics widely used to treat bacterial infections.
Enterobacteriaceae carrying plasmid-encoded New Delhi metallo-β-lactamase 1 (NDM-
1) were later observed in 2010 in Taiwan (116). Unlike KPC, NDM-1 producing K.
pneumoniae are strongly resistant to carbapenems. While Asian countries remain the
hotbed of NDM-1 producing isolates (top three: Indonesia, Vietnam, and Philippines),
resistance has spread rapidly world-wide and infections are now reported throughout
North America, South America, and Europe.
While carbapenem resistance can be transferred between and among many species
of Enterobacteriaceae, K. pneumoniae represents the largest reservoir and accounts for
27
39% of carbapenem-resistant Enterobacteriaceae in Asia, followed by E. coli with 22%
(117). In 2013, the US Centers for Disease Control classified carbapenem-resistant K.
pneumoniae as an urgent threat, giving it the highest threat level amongst drug-resistant
bacteria (115). Recent epidemiology studies suggest an incidence rate of carbapenem-
resistant K. pneumoniae infections in 2.93 out of 100,000 people in the US (118) and
clusters of infections are beginning to manifest in clinical settings. In the most well
documented outbreak in the US, 18 infections and 6 deaths were attributed to
carbapenem-resistant K. pneumoniae at the US National Institutes of Health Clinical
Center (119). Genomic comparisons from infected patients suggested a single patient
origin with 3 independent transmission events between patients. Complicating
transmission of antibiotic resistant K. pneumoniae further is the fact that this bacteria is
carried by healthy humans in the gastrointestinal tract. Recently it was found that gut
colonization by KPC producing K. pneumoniae is a risk factor with an odds ratio of 13.33
for mortality in diabetic patients with foot infections (120).
K. pneumoniae in the gastrointestinal tract
An estimated 5-38% of the general population carries K. pneumoniae in their
gastrointestinal tract and these numbers increase in hospital settings where up to 77% of
caregivers and patients are K. pneumoniae positive (85). Regions of East Asia, such as
Taiwan, also report these higher GI carriage rates in healthy populations (121).
Epidemiological work following diabetic patients with liver abscesses and foot infections
suggest that GI carriage predisposes people to infection and serves as a general reservoir
for K. pneumoniae disease (122, 120). Similarly, gut colonization by K. pneumoniae has
been shown to precede bloodstream infections in patients undergoing stem cell

28
transplantation (123). While K. pneumoniae has not been implicated in driving
inflammatory bowel disease or other infections in the gastrointestinal tract, patients with
Crohn’s disease have high antibody responses against K pneumoniae (124).
Signature tagged mutagenesis identified several genes that are necessary for
colonization of the gastrointestinal tract by K. pneumoniae (125). Of particular
importance are genes involved in metabolism, including glucose and nitrogen metabolism
and urea utilization. Mutation of an uncharacterized adhesion attenuates both
colonization and attachment to human epithelial cells in vitro (125). In mice, K.
pneumoniae can be found in increasing numbers descending the small intestine and into
the colon (126). Regardless of intestinal geography, K. pneumoniae is most abundant in
the luminal content adjacent to the intestinal epithelium (126).
Gaps in understanding and rationale for this work
A murine isolate of K. pneumoniae is able to drive colonic inflammation in mice
(127), but a role for this bacterium in driving inflammatory bowel disease in humans is
undefined. Chapter 2 details our aim to further investigate the inflammatory potential of
K. pneumoniae in the gastrointestinal tract with a diverse panel of murine and human
clinical isolates.
In addition, while several studies have attempted to define K. pneumoniae
colonization factors in the gastrointestinal tract, screens have not been saturating and the
role of bacterial competition with other members of the microbiome have been
overlooked. For example, there have been contradictory data on the role of capsule when
K. pneumoniae colonizes the gastrointestinal tract (128-130). Most recently, encapsulated
K. pneumoniae and mutants with decreased capsule production were found to have
29
equivalent gastrointestinal colonization levels as measured by fecal bacterial counts in
streptomycin treated mice (129). Streptomycin treated mice harbor a microbiota reduced
in complexity and diversity, presenting less colonization resistance than a healthy
microbiota. This suggests that capsule may play a role in successful and competitive
interactions with other bacteria in the gut. Chapter 3 investigates the role of both host
factors and bacterial competition on capsule population dynamics of K. pneumoniae
throughout the gastrointestinal tract.

30
CHAPTER 2 !
KLEBSIELLA PNEUMONIAE AND DISEASE: ASSESSING STRAIN-DEPENDENT
VIRULENCE AND DEFINING THE MINIMAL MICROBIAL COMMUNITY
NECESSARY FOR DISEASE INDUCTION

31
I. ATTRIBUTIONS
Leslie Wardwell-Scott performed all experiments and analyses, except as follows: the
Klebseilla sequencing group at the Broad Institute performed whole genome sequencing
of K. pneumoniae strains. Qiandong Zeng of the Broad Institute annotated whole
genomes. Comparative genomic analyses (Figure 2.5, 2.5) were performed in
collaboration with Ashlee Earl and Abigail McGuire of the Broad Institute. 16S rRNA
amplicon sequencing was undertaken by Research and Testing in Lubbock, Texas
(Figures 2.7, 2.8). Tissue samples were sectioned and stained by the Histopathology
Core at Harvard Medical School and sections were analyzed for inflammation by
pathologists Jonathan Glickman and Roderick Bronson (Figure 2.2).
II. ABSTRACT
Klebsiella pneumoniae is an opportunistic pathogen that causes several human
diseases including pneumonia, urinary tract infections, bacteremia, and liver abscesses.
There is a high degree of genetic diversity within the K. pneumoniae species, and many
of these differences relate to an isolate’s virulence potential in certain infection models.
In this chapter, we characterized four isolates of K. pneumoniae taken from both mouse
and human host environments. Whole genome sequencing and comparative genomics
revealed genome level differences in K. pneumoniae depending on host organism (human
or mouse) and host anatomical location (stool, sputum, or urine).
To assess the role of intra-species genomic diversity on interactions with the host,
these K. pneumoniae isolates were studied in the T-bet-/- Rag2-/- and dextran sodium
sulfate models of ulcerative colitis and in a mouse model of systemic neonatal infection.

32
Despite genome diversity, K. pneumoniae isolates did not differ in their ability to
stimulate colonic inflammation. Additionally, K. pneumoniae was unable to drive
ulcerative colitis in germ-free mice or in gnotobiotic mice stably colonized with 8
bacterial species, suggesting importance of a full microbiota for K. pneumoniae driven
virulence in the gastrointestinal tract.
While there was no differential virulence of K. pneumoniae isolates in the adult
mouse colon, exposure to murine K. pneumoniae, but not human clinical isolates, led to
neonatal death. In addition, this isolate induced differential shifts in levels of other
Enterobacteriaceae species in the colon. More murine K. pneumoniae was found in host
mesenteric lymph nodes compared to human isolates, suggesting subtle strain-based
differences that affect response to K. pneumoniae in the gastrointestinal tract.!
!
!
III. INTRODUCTION
The recovery of K. pneumoniae from many environmental and host sites suggests
a significant degree of diversity within the species. For example, the genomic content
necessary for successful colonization of the gastrointestinal tract is likely to be distinct
from functions necessary for bacterial interactions and nitrogen fixing abilities in the
plant rhizosphere. Many studies have attempted to reveal genome level K. pneumoniae
strain-based differences with the use of unbiased comparative genomic approaches (111,
112, 131). Hybridization techniques comparing 15 clinical K. pneumoniae strains
identified genomic signatures of putative virulence factors that correlated with severity of
infection in vivo (112). In the largest K. pneumoniae comparative genomics endeavor to
33
date, analysis of 288 strains revealed such a high level of diversity that the species could
be divided into three distinct phylotypes (111).
While comparative genomics has revealed strain based virulence determinants in
liver abscess and meningitis causing K. pneumoniae strains (112), comparative virulence
potential has not been assessed in models of ulcerative colitis or neonatal infection. In
this work we interrogate the role of K. pneumoniae isolated from inflamed T-bet-/- Rag2-/-
mice in the context of ulcerative colitis and neonatal infection with comparative
genomics of 4 K. pneumoniae isolates taken from diverse host environments. In vivo
differential virulence studies were conducted using T-bet-/- Rag2-/- and Rag2-/- mouse
models of ulcerative colitis and neonatal infection.
Necrotizing enterocolitis (NEC) is a gastrointestinal disorder affecting preterm
infants and causing death in 16-42% of those afflicted (132). Inflammation is thought to
result following translocation of intestinal bacteria across the epithelium in preterm
infants with an underdeveloped gastrointestinal tract and compromised mucosal
immunity (133, 134). K. pneumoniae has been associated with NEC in human infants
(135) and is also known to drive NEC-like intestinal inflammation in neonatal mouse
models (136). In this work we devise a model of neonatal infection mimicking the
underdeveloped immune system of preterm infants by inoculating Rag2-/- pups at birth.
To study gastrointestinal inflammation in adult mice, we employed the T-bet-/-
Rag2-/- mouse model, which is an applicable tool for studying ulcerative colitis due to its
high disease penetrance and features resembling human ulcerative colitis, such as mono-
and polymophonuclear cell infiltrates of the lamina propria, neutrophil infiltration of
crypts, and epithelial injury restricted to the colon!(66). Furthermore, increased colonic
34
tumor necrosis factor α (TNFα) levels are typical of human and T-bet-/- Rag2-/- colitis and
both forms of the disease can be ameliorated by anti-TNFα therapy. In T-bet-/- Rag2-/-
mice, increased TNFα is driven by the absence of T-bet, which normally acts as a
transcriptional activator of cytokine expression.
Another similarity between T-bet-/- Rag2-/- and human ulcerative colitis is the
importance of bacteria in perpetuating aberrant immune responses. Conventional culture
from stool identified 7 bacterial strains unique to T-bet-/- Rag2-/- compared to Rag2-/- and
wild-type (WT) mice!(127). Of these seven, K. pneumoniae and Proteus mirabilis
showed identical sensitivity profiles to antibiotics able to ameliorate colitis in vivo. K.
pneumoniae and P. mirabilis, individually and in combination, were able to induce colitis
in Rag2-/- and WT mice (127). Although to date no published studies link K. pneumoniae
to human ulcerative colitis, subsets of patients with Crohn’s disease show increased
antibody responses against K. pneumoniae compared to healthy controls!(124), and 16S
profiling from biopsies of Crohn’s disease patients indicate the presence of K.
pneumoniae!(137). While not specifically focused on ulcerative colitis, these studies
justify examining K. pneumoniae in the setting of inflammatory bowel disease.
Although able to colonize the colon, a combination of K. pneumoniae and P.
mirabilis is unable to cause colitis in gnotobiotic T-bet-/- Rag2-/- mice!(127), highlighting
the importance of interactions between these Enterobacteriaceae, other resident members
of the microbiota, and the host immune system. Based on reports suggesting that
gnotobiotic mice associated with the Altered Schaedler Flora (ASF) display active
immune responses!(73), we hypothesized that a combination of ASF strains plus K.
pneumoniae and P. mirabilis would cause colitis in gnotobiotic T-bet-/- Rag2-/- mice.

35
Alternatively, the ASF may represent too minimalistic a gut microbiota, and other
features not represented in this consortium may be needed for K. pneumoniae and P.
mirabilis to induce inflammation.
IV. RESULTS
K. pneumoniae isolates do not vary in their ability to incite inflammation in the colons of specified pathogen-free Rag2-/- mice.
K. pneumoniae is enriched in the gastrointestinal tract of TRUC mice compared to
Rag2-/- and WT mice (127). However, when K. pneumoniae WGLW5, isolated from T-
bet-/- Rag2-/- mice, is fed regularly to specified pathogen-free (SPF) Rag2-/- and WT mice,
colitis develops (127). In order to assess the contribution of K. pneumoniae to colonic
inflammation, we obtained three human clinical isolates of K. pneumoniae taken from
patient urine, sputum, and stool (three independent patients). All patients were sick at
time of culture. Culture of K. pneumoniae WGLW5 and these three human clinical
isolates on MacConkey agar revealed a shared mucoid phenotype with varying degrees of
mucoviscosity as assessed by the sting test (138) (Figure 2.1). Hypermucoviscosity is
defined by the formation of a viscous capsule string, at least 10mm in length, when a
bacteriological loop is lifted away from a colony on agar (139). While all four isolates
produced a thick, visible capsule, WGLW2 was the only isolate that did not display a
hypermucoviscosity capsule phenotype. WGLW5 consistently produced the longest
string throughout all experiments and manipulations.
K. pneumoniae isolates resuspended in PBS were fed from pipette tips to 4-week
old SPF Rag2-/- mice every third day for 8 weeks (Figure 2.2A). Upon sacrifice, colons
were fixed in paraformaldehyde, paraffin embedded, sectioned, and stained with

36
Figure 2.1. Mouse and human clinical K. pneumoniae isolates on MacConkey agar. Overnight growth at 37°C. Right panel, string test showing hypermucoviscosity phenotype (arrows).
WGLW1
(human urine)
WGLW2
(human sputum)
WGLW3
(human stool)
WGLW5
(TRUC
mouse stool)
1cm
1cm
1cm
1cm
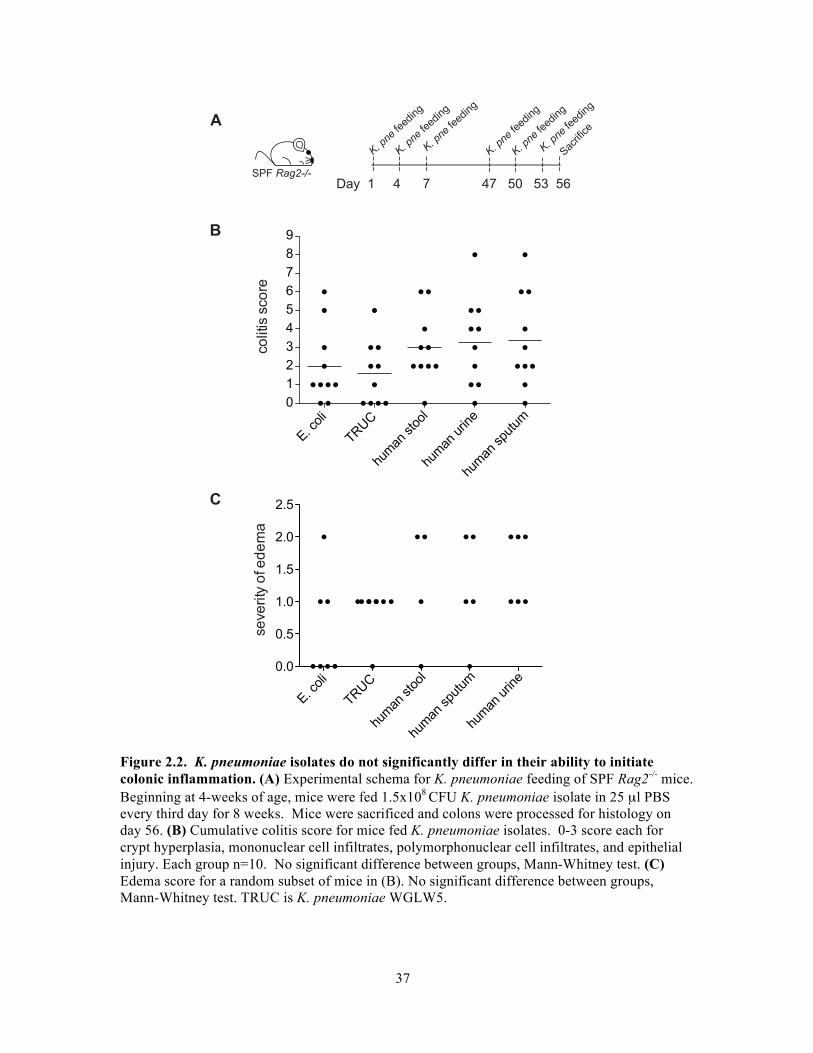
37
Figure 2.2. K. pneumoniae isolates do not significantly differ in their ability to initiate colonic inflammation. (A) Experimental schema for K. pneumoniae feeding of SPF Rag2-/- mice. Beginning at 4-weeks of age, mice were fed 1.5x10⁸ CFU K. pneumoniae isolate in 25 µl PBS every third day for 8 weeks. Mice were sacrificed and colons were processed for histology on day 56. (B) Cumulative colitis score for mice fed K. pneumoniae isolates. 0-3 score each for crypt hyperplasia, mononuclear cell infiltrates, polymorphonuclear cell infiltrates, and epithelial injury. Each group n=10. No significant difference between groups, Mann-Whitney test. (C) Edema score for a random subset of mice in (B). No significant difference between groups, Mann-Whitney test. TRUC is K. pneumoniae WGLW5.
SPF Rag2-/-
K. pne
feed
ing
A
B
K. pne
feed
ing
K. pne
feed
ing
K. pne
feed
ing
K. pne
feed
ing
K. pne
feed
ing
Day 1 4 7 47 50 53 56
Sac
rifice
C
E. coli
TRUC
hum
an sto
ol
hum
an u
rine
hum
an spu
tum
0
1
2
3
4
5
6
7
8
9
co
litis
sco
re
E. coli
TRUC
hum
an sto
ol
hum
an spu
tum
hum
an u
rine
0.0
0.5
1.0
1.5
2.0
2.5
se
ve
rity
of e
de
ma
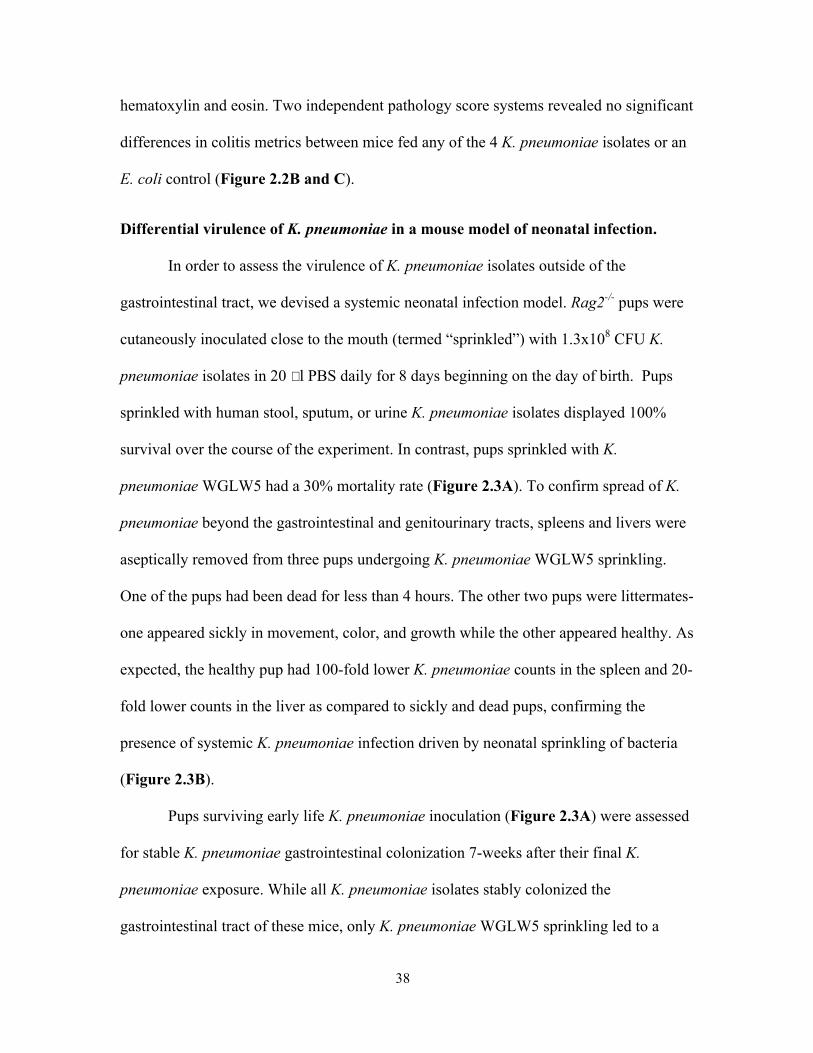
38
hematoxylin and eosin. Two independent pathology score systems revealed no significant
differences in colitis metrics between mice fed any of the 4 K. pneumoniae isolates or an
E. coli control (Figure 2.2B and C).
Differential virulence of K. pneumoniae in a mouse model of neonatal infection.
In order to assess the virulence of K. pneumoniae isolates outside of the
gastrointestinal tract, we devised a systemic neonatal infection model. Rag2-/- pups were
cutaneously inoculated close to the mouth (termed “sprinkled”) with 1.3x10⁸ CFU K.
pneumoniae isolates in 20 μl PBS daily for 8 days beginning on the day of birth. Pups
sprinkled with human stool, sputum, or urine K. pneumoniae isolates displayed 100%
survival over the course of the experiment. In contrast, pups sprinkled with K.
pneumoniae WGLW5 had a 30% mortality rate (Figure 2.3A). To confirm spread of K.
pneumoniae beyond the gastrointestinal and genitourinary tracts, spleens and livers were
aseptically removed from three pups undergoing K. pneumoniae WGLW5 sprinkling.
One of the pups had been dead for less than 4 hours. The other two pups were littermates-
one appeared sickly in movement, color, and growth while the other appeared healthy. As
expected, the healthy pup had 100-fold lower K. pneumoniae counts in the spleen and 20-
fold lower counts in the liver as compared to sickly and dead pups, confirming the
presence of systemic K. pneumoniae infection driven by neonatal sprinkling of bacteria
(Figure 2.3B).
Pups surviving early life K. pneumoniae inoculation (Figure 2.3A) were assessed
for stable K. pneumoniae gastrointestinal colonization 7-weeks after their final K.
pneumoniae exposure. While all K. pneumoniae isolates stably colonized the
gastrointestinal tract of these mice, only K. pneumoniae WGLW5 sprinkling led to a
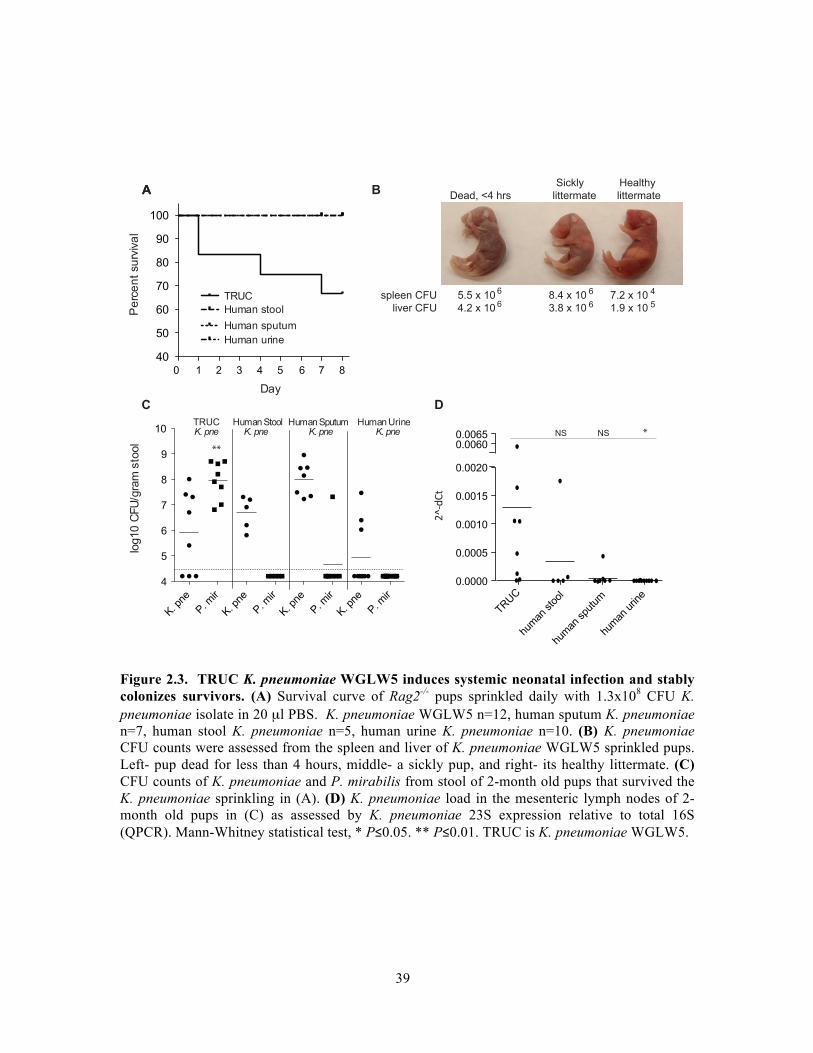
39
Figure 2.3. TRUC K. pneumoniae WGLW5 induces systemic neonatal infection and stably colonizes survivors. (A) Survival curve of Rag2-/- pups sprinkled daily with 1.3x10⁸ CFU K. pneumoniae isolate in 20 µl PBS. K. pneumoniae WGLW5 n=12, human sputum K. pneumoniae n=7, human stool K. pneumoniae n=5, human urine K. pneumoniae n=10. (B) K. pneumoniae CFU counts were assessed from the spleen and liver of K. pneumoniae WGLW5 sprinkled pups. Left- pup dead for less than 4 hours, middle- a sickly pup, and right- its healthy littermate. (C) CFU counts of K. pneumoniae and P. mirabilis from stool of 2-month old pups that survived the K. pneumoniae sprinkling in (A). (D) K. pneumoniae load in the mesenteric lymph nodes of 2-month old pups in (C) as assessed by K. pneumoniae 23S expression relative to total 16S (QPCR). Mann-Whitney statistical test, * P≤0.05. ** P≤0.01. TRUC is K. pneumoniae WGLW5.
AA
spleen CFU 5.5 x 10 8.4 x 10 7.2 x 10
liver CFU 4.2 x 10 3.8 x 10 1.9 x 10
Sickly Healthy
Dead, <4 hrs littermate littermateB
0 1 2 3 4 5 6 7 8
40
50
60
70
80
90
100
TRUC
Human stool
Human sputum
Human urine
Day
Pe
rce
nt
su
rviv
al
TRUC
hum
an sto
ol
hum
an spu
tum
hum
an u
rine
0.0000
0.0005
0.0010
0.0015
0.0020
0.00600.0065
2^-dCt
K. pne
P. mir
K. pne
P. mir
K. pne
P. mir
K. pne
P. mir
4
5
6
7
8
9
10 TRUC Human Stool Human Sputum Human Urine
K. pne K. pne K. pne K. pne
log10 C
FU
/gra
m s
tool
C D
NS NS *
**
6
6
6
6
4
5
40
concurrent colonic bloom of P. mirabilis as measured by CFU counts on MacConkey
agar (Figure 2.3C), suggesting strain based differences between mouse and human
derived isolates of the same bacterial species, with the caveat of small samples sizes of K.
pneumoniae isolates in these experiments. In addition, only K. pneumoniae WGLW5
sprinkled mice had detectable levels of K. pneumoniae in their mesenteric lymph nodes
by real-time quantitative PCR (Figure 2.3D).
Comparative genomics of K. pneumoniae isolates reveals genome level differences.
Based on the differential virulence capacity of K. pneumoniae WGLW5 in the
neonatal infection model and long-term gastrointestinal colonization dynamics compared
to human clinical isolates (Figure 2.3), we sought to assess the genomic diversity
amongst K. pneumoniae strains. Whole genome sequences were generated for our 4 K.
pneumoniae isolates on an Illumina MiSeq by the Broad Institute through the Klebsiella
group Sequencing Project. Genomes were annotated with Prodigal (140). For comparison
to a broad range of K. pneumoniae isolates, 5 published genomes were re-annotated with
Prodigal. The final group of K. pneumoniae genomes consisted of 7 human isolates, an
environmental isolate, and a mouse isolate (Table 2.1). Genome size fell between 5.33
and 5.92 Mb, corresponding to 5,069 - 5,448 predicted genes (Table 2.1).
Following annotation, genomes were translated to proteomes and matched to
protein databases using BLASTP (http://blast.ncbi.nlm.nih.gov). OrthoMCL, a graph-
based Markov-clustering algorithm (113), was then used to parse proteomes into protein
groups representing orthologs, paralogs, and co-orthologs (141). By default, proteins that
did not fall into clusters of orthologs represented the auxiliary genome of each K.
pneumoniae isolate. Based upon the presence and absence of predicted proteins called by

41
Table 2.1. K. pneumoniae genome details for comparative genomics study. K. pneumoniae Genome
Source Site
Location
Size (Mb)
GC%
Predicted Genes (#)
WGLW1 human urine Boston, MA 5.55 57.3 5,170 WGLW2 human sputum Boston, MA 5.75 56.9 5,292 WGLW3 human stool Boston, MA 5.55 57.3 5,159 WGLW5 TRUC stool Boston, MA 5.82 56.8 5,448 342 Zea mays root UK 5.92 56.9 5,936 HS11286 human sputum China 5.33 57.5 5,404 NTUH-K2044 human liver abscess Taiwan 5.47 57.4 5,386 1084 human liver abscess Taiwan 5.39 57.4 5.069 MGH78578 human sputum Boston, MA 5.69 57.2 5,305
orthoMCL, a heatmap was constructed to visualize relationships between isolates (Figure
2.4A). Unexpectedly, K. pneumoniae WGLW5 was most closely related to human
sputum isolates, and more distantly related to those from stool or urine. An independent
maximum likelihood phylogeny tool, RAxML (Randomized Axelerated Maximum
Likelihood (142)), confirmed the relationship between WGLW5 and human sputum K.
pneumoniae (Figure 2.4B).
OrthoMCL revealed that the majority of predicted proteins were shared by
K.pneumoniae isolates from diverse environments (core proteome in blue, Figure 2.5). K.
pneumoniae WGLW5 had the largest auxiliary proteome with 886 non-core proteins and
445 unique predicted proteins. Venny (http://omictools.com/venny-s6319.html) was used
to compare orthoMCL clusters between K. pneumoniae WGLW5 and the 3 human
clinical isolates from Figure 2.2 and 2.3. This analysis revealed 74 proteins with
annotated KEGG gene pathways or Pfam protein domains that were unique to K.
pneumoniae WGLW5 and 44 unique to the human clinical isolates (Table 2.2). Included
among the cluster unique to WGLW5 were proteins involved in conjugation, toxin anti-
toxin systems, phage, heavy metal resistance, secretion systems, and metabolism. The
presence of genes encoding these predicted proteins may contribute to the differential
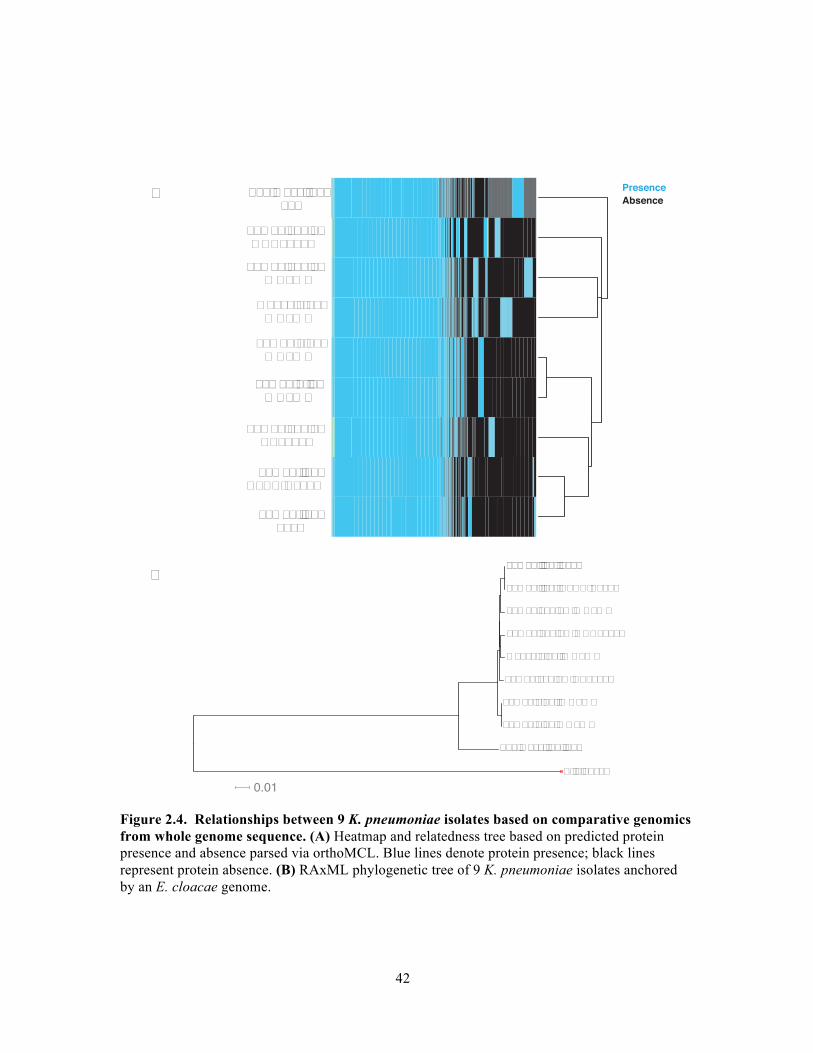
42
Figure 2.4. Relationships between 9 K. pneumoniae isolates based on comparative genomics from whole genome sequence. (A) Heatmap and relatedness tree based on predicted protein presence and absence parsed via orthoMCL. Blue lines denote protein presence; black lines represent protein absence. (B) RAxML phylogenetic tree of 9 K. pneumoniae isolates anchored by an E. cloacae genome.
Zea mays root342
human sputumMGH78578
human sputumWGLW2
mouse stoolWGLW5
human stoolWGLW3
human urineWGLW1
human sputumHS11286
human liverNTUH-K2044
human liver1084
B
A
human liver 1084
human liver NTUH-K2044
human sputum WGLW2
human sputum MGH78578
mouse stool WGLW5
human sputum HS11286
human stool WGLW3
human uine WGLW1
Zea mays root 342
E. cloacae
0.01
PresenceAbsence

43
virulence and gastrointestinal colonization potential observed for K. pneumoniae
WGLW5 in comparison to human clinical isolates in specified pathogen-free (SPF)
mouse models. It is also likely that the 494 predicted hypothetical proteins unique to
TRUC contribute to these behaviors. Further analysis of these uncharacterized proteins is
necessary to fully understand the unique activity of K. pneumoniae WGLW5 in mouse
models.
Figure 2.5. OrthoMCL gene clusters of 9 K. pneumoniae isolates. Core genome in blue, auxiliary genome in purple, and unique genome in yellow.

44
Table 2.2. Differential predicted proteins identified by OrthoMCL between K. pneumoniae isolates.
Predicted proteins present in WGLW5 and absent from WGLW1, 2, 3 Predicted proteins present in WGLW1, 2, 3 and absent from WGLW5
acetaldehyde_dehydrogenase__acetylating_
major_tail_sheath_protein aromatic_amino_acid_aminotransferase
acetate_CoA_transferase_subunit_alpha
major_tail_tube_protein aromatic_amino_acid_transporter_AroP
acetate_CoA_transferase_subunit_beta
membrane_fusion_protein_RaxA betaine_carnitine_choline_transporter__BCCT__family_transporter
acetoacetate_metabolism_regulatory_protein_AtoC
mercuric_resistence_transcriptional_repressor_protein_MerD
D_3_phosphoglycerate_dehydrogenase
altronate_oxidoreductase molybdenum_pterin_binding_domain_containing_protein
diguanylate_cyclase__GGDEF__domain_containing_protein
aminoglycoside_3__phosphotransferase
mRNA_interferase_PemK dihydrolipoyl_dehydrogenase
antitoxin_PemI NodT_family_efflux_transporter__outer_membrane_factor__OMF
fructose_bisphosphate_aldolase__class_I
arsenate_reductase P_type_conjugative_transfer_ATPase_TrbB glutathione_S_transferase chlorophyll_synthesis_pathway_protein_BchC
P_type_conjugative_transfer_protein_TrbG glycerol_uptake_operon_antiterminator
chromate_ion_transporter__CHR__family_chromate_transporter
P_type_conjugative_transfer_protein_TrbJ IS605_OrfB_family_transposase
conjugative_transfer_signal_peptidase_TraF
P_type_conjugative_transfer_protein_TrbL L_xylulokinase
DGQHR_domain_containing_protein
PBSX_family_phage_portal_protein LacI_family_transcriptional_regulator
diguanylate_cyclase__GGDEF__domain_containing_protein
PFL2_glycerol_dehydratase_family_glycyl_radical_enzyme
low_calcium_response_locus_protein_S
dihydrofolate_reductase_type_A13 phage_baseplate_assembly_protein_V LuxR_family_transcriptional_regulator__maltose_regulon_positive_regulatory_protein
dihydropteroate_synthase_type_1 phage_tail_tape_measure_protein__TP901_family__core_region
lysozyme
DNA__cytosine_5___methyltransferase
phage_virion_morphogenesis_protein MFS_transporter__ACS_family__glucarate_transporter
DNA_adenine_methylase plasmid_transfer_ATPase_TraJ O_antigen_export_system_ATP_binding_protein_RfbB
DNA_adenine_methylase portal_protein O_antigen_export_system_permease_rfbA DNA_repair_protein_RadC quaternary_ammonium_compound_resistan
ce_protein_qacE outer_membrane_usher_protein
DNA_repair_protein_RadC RelB_DinJ_family_addiction_module_antitoxin
ParB_like_partition_protein
efflux_transporter__RND_family__MFP_subunit
RelB_DinJ_family_addiction_module_antitoxin
phosphoglycerate_dehydrogenase
general_secretion_pathway_protein_S
replication_A_protein protein_samA
glycyl_radical_enzyme_activating_protein_family
short_chain_fatty_acids_transporter protein_TolA
His_Glu_Gln_Arg_opine_family_amino_ABC_transporter
signal_transduction_histidine_protein_kinase_AtoS
PTS_system__galactitol_specific_IIC_component
His_Xaa_Ser_repeat_protein_HxsA single_stranded_DNA_binding_protein pyruvate_dehydrogenase_complex_dihydrolipoamide_acetyltransferase
His_Xaa_Ser_system_radical_SAM_maturase_HxsB
small_GTP_binding_protein_domain pyruvate_dehydrogenase_E1_component_subunit_alpha
His_Xaa_Ser_system_radical_SAM_maturase_HxsC
sugar_porter__SP__family_MFS_transporter
pyruvate_dehydrogenase_E1_component_subunit_beta
HK97_family_phage_major_capsid_protein
toxin_YkfI ribokinase
HK97_family_phage_prohead_protease
transposase ribose_transport_system_substrate_binding_protein
HK97_gp10_family_phage_protein transposase_insC_for_insertion_element_IS2H
simple_sugar_transport_system_ATP_binding_protein
inner_membrane_protein_yagU transposase_insD_for_insertion_element_IS2A_D_F_H_I_K
simple_sugar_transport_system_ATP_binding_protein
insertion_element_IS1_8_protein_insB
transposase_insF_for_insertion_sequence_IS3C
simple_sugar_transport_system_permease

45
Table 2.2. Continued. integrase_recombinase transposase_insH_for_insertion_sequence_e
lement_IS5Y simple_sugar_transport_system_permease
L_galactonate_transporter transposon_Tn3_resolvase simple_sugar_transport_system_permease lambda_family_phage_tail_tape_measure_protein
type_I_restriction_enzyme_EcoprrI simple_sugar_transport_system_substrate_binding_protein
lambda_family_phage_tail_tape_measure_protein
type_I_restriction_enzyme_EcoprrI_M_protein
single_stranded_DNA_binding_protein
major_capsid_protein VirB4_family_type_IV_secretion_conjugal_transfer_ATPase
stable_plasmid_inheritance_protein
succinyl_diaminopimelate_desuccinylase thiaminase__transcriptional_activator_TenA
_ transposase_insC_for_insertion_element TraR_family_phage_conjugal_plasmid_C_4_
type_zinc_finger_protein UDP_galactopyranose_mutase UPF0380_protein_yubP UPF0401_protein_yubL X_polypeptide
Defining the minimal microbial community necessary for K. pneumoniae induced colitis in gnotobiotic Tbet-/- Rag2-/- mice.
K. pneumoniae and P. mirabilis were sufficient to induce colitis in SPF-WT and
SPF-Rag2-/- mice. However, neither bacterium alone or in combination was sufficient to
induce inflammation in gnotobiotic Tbet-/- Rag2-/- mice despite successful colonization of
the colon (127). This points to the necessity of an endogenous microbiota for K.
pneumoniae and P. mirabilis to cause inflammation. To confirm that GF-Tbet-/- Rag2-/-
mice are able to develop colitis, GF-Tbet-/- Rag2-/- mice were associated with stool from a
prolapsed Tbet-/- Rag2-/- female with a SPF microbiota. Mice were sacrificed after a 4-
week (n=4) or 8-week (n=17) incubation, colons were processed for histology, and stool
was processed for 16S rRNA amplicon sequencing. Colonic inflammation developed in
the presence of a complex microbial community in these gnotobiotic mice (Figure 2.6A).
The large distribution of colitis scores in gnotobiotic Tbet-/- Rag2-/- mice receiving fecal
transplants prompted a further analysis of the associated metadata. While colitis score
spread was not explained by caging effects, age, or length of fecal association, sex was a
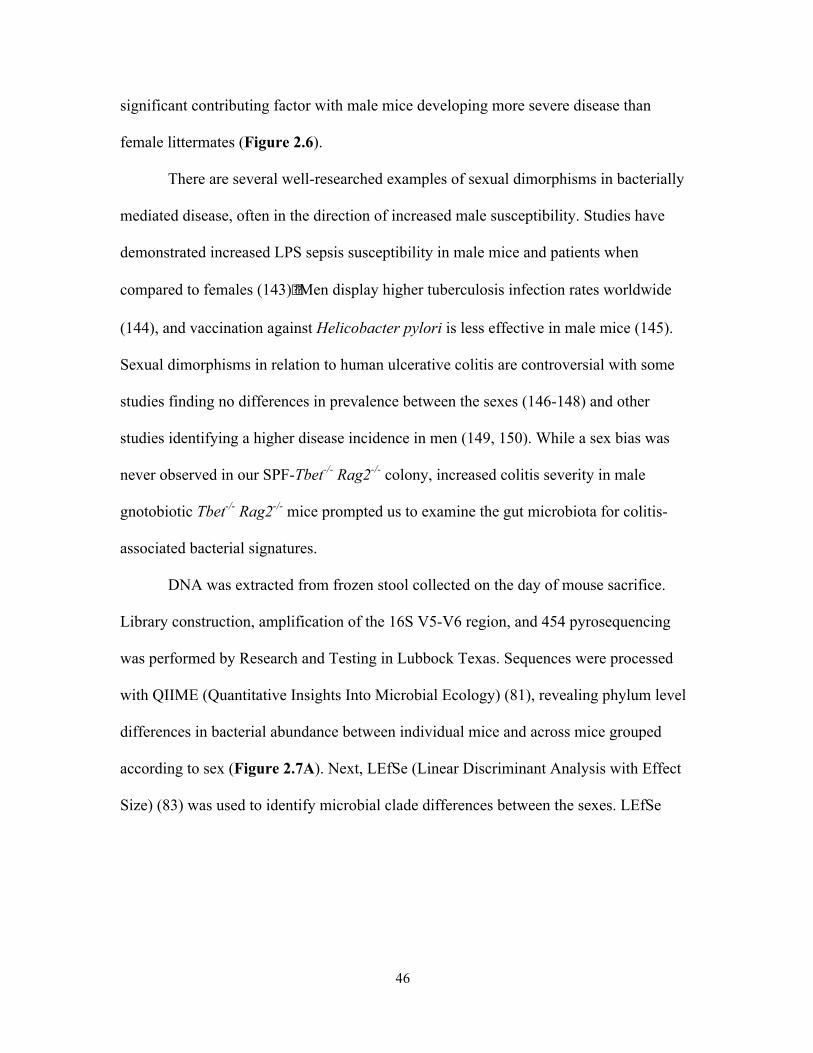
46
significant contributing factor with male mice developing more severe disease than
female littermates (Figure 2.6).
There are several well-researched examples of sexual dimorphisms in bacterially
mediated disease, often in the direction of increased male susceptibility. Studies have
demonstrated increased LPS sepsis susceptibility in male mice and patients when
compared to females (143).!Men display higher tuberculosis infection rates worldwide
(144), and vaccination against Helicobacter pylori is less effective in male mice (145).
Sexual dimorphisms in relation to human ulcerative colitis are controversial with some
studies finding no differences in prevalence between the sexes (146-148) and other
studies identifying a higher disease incidence in men (149, 150). While a sex bias was
never observed in our SPF-Tbet-/- Rag2-/- colony, increased colitis severity in male
gnotobiotic Tbet-/- Rag2-/- mice prompted us to examine the gut microbiota for colitis-
associated bacterial signatures.
DNA was extracted from frozen stool collected on the day of mouse sacrifice.
Library construction, amplification of the 16S V5-V6 region, and 454 pyrosequencing
was performed by Research and Testing in Lubbock Texas. Sequences were processed
with QIIME (Quantitative Insights Into Microbial Ecology) (81), revealing phylum level
differences in bacterial abundance between individual mice and across mice grouped
according to sex (Figure 2.7A). Next, LEfSe (Linear Discriminant Analysis with Effect
Size) (83) was used to identify microbial clade differences between the sexes. LEfSe

47
Figure 2.6. Sexual dimorphism of colitis severity in gnotobiotic Tbet-/- Rag2-/- mice associated with stool from sick SPF-Tbet-/- Rag2-/- mice. (A) Histologic colitis scores from GF Tbet-/- Rag2-
/- mice associated with SPF-Tbet-/- Rag2-/- stool for 8 or 4 weeks. (B) Histologic colitis scores for the same mice as in (A), separated by sex. Symbols represent cages. The 4 males with the lowest colitis scores were associated for 4 weeks, all other mice were associated for 8 weeks. Mann-Whitney statistical test, * P≤0.05. ** P≤0.01.
A
GF SPF-stool
**
female female male012345678910
colitis score
GF associated with SPF stool
B
012345678910
colitis score
**
**

48
revealed an enrichment of Bacteroidetes in stool from sick male mice and an enrichment
of Firmicutes in their healthier female littermates (Figure 2.7B). Specifically, OTUs
from the families Rikenellaceae and Porphyromonadaceae were discriminate for male
mice, and Bacilli and Clostridia for female mice. When comparing mice with low
histologic score (0-4) to mice with severe colitis (5-8) regardless of sex, the Bacteroidetes
and Firmicutes difference held (Figure 2.7C). Interestingly, Bacteroidetes species have
been shown to induce colitis in mouse models, however, their abundance in diseased
mice was not increased compared to healthy controls (151). In human 16S surveys,
Rikenellaceae and Porphyromonadaceae are more abundant in control groups compared
to IBD subjects (152), however mouse studies have identified enrichment of these
families in disease groups of colitis induced by IL-22 deficiency!(153), in dextran sodium
sulfate-induced colitis(154), and for Type I diabetes (6).
Comparing females to male mice housed in cage4 revealed a greater number of
differential OTUs (Figure 2.8). In addition to the associations presented in Figure 2.7,
male mice from cage4 had enrichments in the Actinobacteria and Proteobacteria (both
beta and delta) phyla. Specifically, Desulfovibriaceae was associated with sick male mice
in cage4. Desulfovibrio spp. have been identified at higher abundance in human patients
with both acute and chronic ulcerative colitis (155).
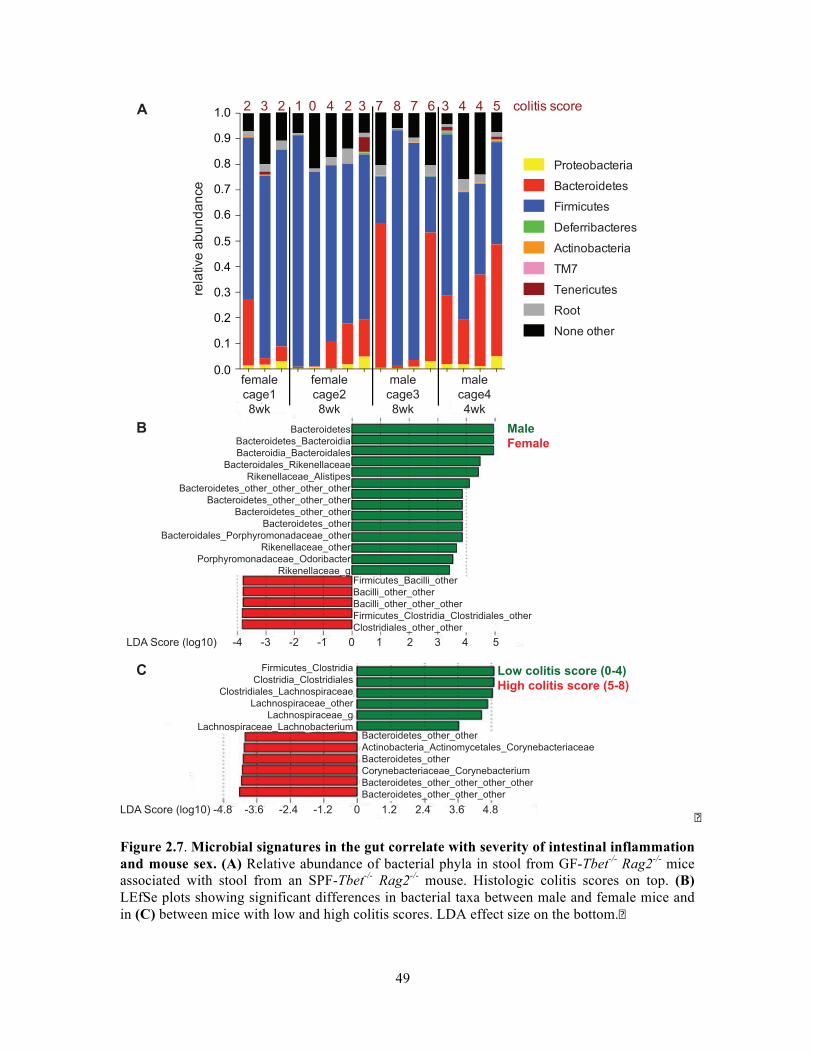
49
!
Figure 2.7. Microbial signatures in the gut correlate with severity of intestinal inflammation and mouse sex. (A) Relative abundance of bacterial phyla in stool from GF-Tbet-/- Rag2-/- mice associated with stool from an SPF-Tbet-/- Rag2-/- mouse. Histologic colitis scores on top. (B) LEfSe plots showing significant differences in bacterial taxa between male and female mice and in (C) between mice with low and high colitis scores. LDA effect size on the bottom.!

50
!
Figure 2.8. Discriminate bacterial taxa between female mice and a subset of male mice. Significant differences in bacterial phyla in stool from GF-Tbet-/- Rag2-/- mice associated with stool from an SPF-Tbet-/- Rag2-/- mouse LEfSe plot with LDA effect size along the bottom.!!
!
!

51
Establishing a gnotobiotic ASF-Tbet-/- Rag2-/- and ASF-WT mouse colony.
Having established that colonic inflammation can be recapitulated by a
consortium of colonic bacteria in GF-Tbet-/- Rag2-/- mice, we sought to identify the
minimal microbial community necessary to incite colitis. For these experiments, we
established breeding colonies of gnotobiotic mice with a defined microbiota consisting of
the 8 bacterial strains of the Altered Schaedler Flora (ASF) and housed in sterile
isolators. GF-Tbet-/- Rag2-/- and GF-WT mice were orally inoculated with cecal contents
of C3H/HeN:Tac gnotobiotic ASF mice obtained from Dr. Michael Wannemuehler of
Iowa State University (156). Following a second inoculation one week later, ASF mice
were bred. PCR confirmed that all pups of ASF associated breeders were positive for the
8 ASF bacterial strains (Figure 2.9A). Presence of 7 of the ASF strains can be confirmed
from DNA extracted from stool. Presence of ASF 361, an esophageal colonizer, was
confirmed with a PCR on DNA extracted from cecal contents. Colonization with the ASF
partially reversed the enlarged cecum phenotype observed in GF animals (Figure 2.9B),
although ceca were still large in comparison to Balb/C SPF mice.
In order to assess whether the ASF is a sufficient microbial community for K.
pneumoniae driven colonic inflammation, F1 ASF-Tbet-/- Rag2-/- and ASF-WT mice were
orally inoculated with K. pneumoniae WGLW5. While this isolate induces colitis in SPF
mice (127), there were no signs of histologic colitis in ASF gnotobiotic mice after an 8-
week association with K. pneumoniae WGLW5 alone or in combination with P. mirabilis
(Figure 2.10). Given the significantly reduced diversity of the ASF compared to SPF
microbial communities, perhaps the ASF is too minimal of a community for K.
pneumoniae induced colitis. Specifically, the absence of Bacteroidetes from the ASF is

52
Figure 2.9. Generation of gnotobiotic ASF colonies. (A) PCR confirmation of 8 ASF species in the F1 generation of ASF-Tbet-/- Rag2-/- breeders. DNA extracted from ceca upon sacrifice. (B) Enlarged cecum from an ASF-Tbet-/- Rag2-/- breeder associated in adulthood (left) and smaller cecum in her pup colonized with the ASF via parental transfer at birth (right).
GF-TRUC ASF-TRUC
A
B
ASF-TRUC stool ASF-TRUC cecum
356360361457492
500502519
360 control360
ASF primer set
500bp
100bp200bp300bp
1kb
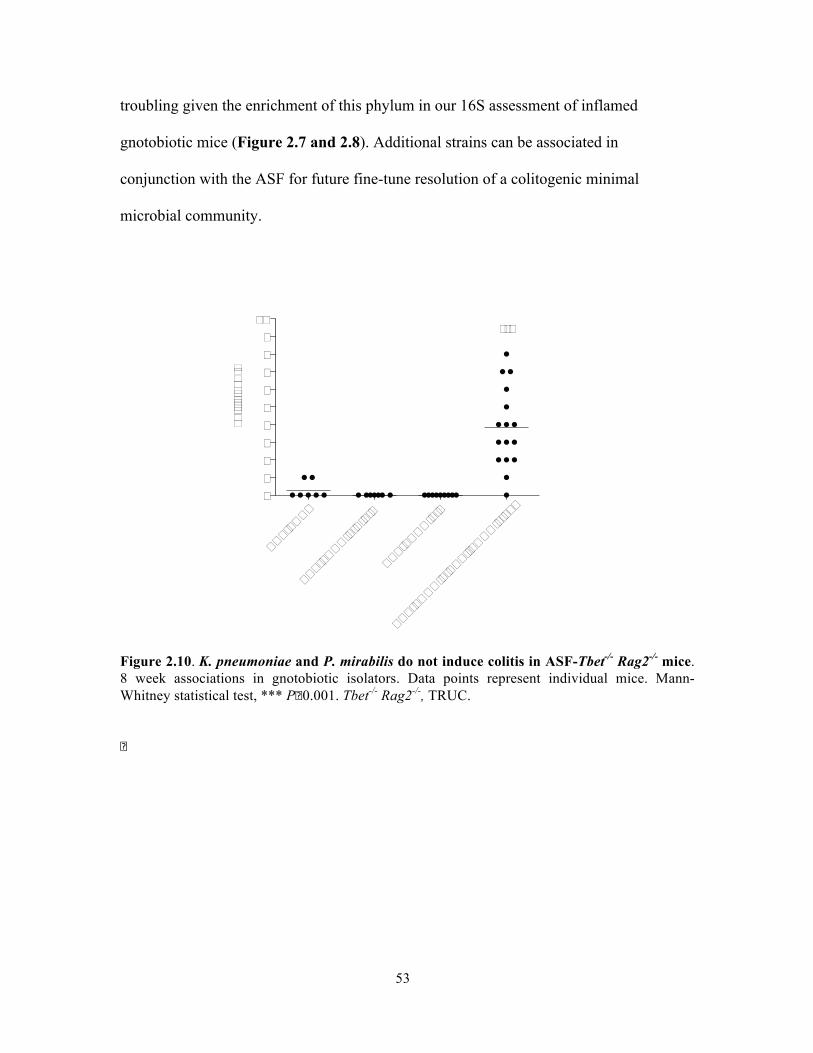
53
troubling given the enrichment of this phylum in our 16S assessment of inflamed
gnotobiotic mice (Figure 2.7 and 2.8). Additional strains can be associated in
conjunction with the ASF for future fine-tune resolution of a colitogenic minimal
microbial community.
Figure 2.10. K. pneumoniae and P. mirabilis do not induce colitis in ASF-Tbet-/- Rag2-/- mice. 8 week associations in gnotobiotic isolators. Data points represent individual mice. Mann-Whitney statistical test, *** P≤0.001. Tbet-/- Rag2-/-, TRUC.
!
ASF-TRUC
ASF-TRUC + K + P
ASF-TRUC + K
ASF-TRUC + SPF -TRUC stool
012345678910
colitis score
***

54
V. DISCUSSION
As an opportunistic pathogen, K. pneumoniae thrives in an inflamed host
environment and may participate in the initiation of an inflammatory state. While K.
pneumoniae’s role in driving pneumonia and urinary tract infections is well defined, it is
not widely accepted as a driver of inflammatory bowel disease. Several studies have
identified an association between Crohn’s disease and Klebsiella in stool (157), but
Klebsiella has not been implicated as a causative agent of disease.
Previous studies in mouse models of inflammatory bowel disease, specifically
ulcerative colitis, revealed that a strain of K. pneumoniae isolated from mouse stool was
able to induce colonic inflammation (127). The work of this thesis aimed to discover
whether this effect was strain specific or a shared ability of human clinical K.
pneumoniae isolates. Despite genomic diversity, 4 strains of K. pneumoniae, including 3
isolates from humans, were able to drive ulcerative colitis in mice (Figure 2.2). These
finding have implications for human health since K. pneumoniae is carried as part of the
normal gut microbiota in 5-38% of the general population (85). Given the complex,
multi-factorial nature of inflammatory bowel disease, it is attractive to speculate that
carriage of K. pneumoniae in the gastrointestinal tract predisposes people to
inflammatory bowel disease or puts inflammatory bowel disease patients at increased risk
for flares. Even if not the initial cause of inflammation, native K. pneumoniae populations
could presumably bloom and potentiate colitis in carriers.
Interestingly, we found that not all K. pneumoniae isolates are equally virulent in
mouse models of systemic neonatal infection. The most important factor for the ability to
incite severe infection was found to be the original host species and not anatomical
55
location since human stool K. pneumoniae did not lead to neonatal death but a murine
stool isolate did (Figure 2.3). The differential ability of WGLW5 to cross epithelial
barriers was confirmed by the finding of higher WGLW5 levels in mesenteric lymph
nodes than any of the other K. pneumoniae isolates. Not only does the host seem to
respond differently to K. pneumoniae WGLW5, but so does the gut microbiota. Fecal
blooms of closely related P. mirabilis only in the presence of WGLW5 suggests that, 1)
K. pneumoniae WGLW5 may indirectly change a colonic niche to make it more
favorable to P. mirabilis growth, or that, 2) presence of K. pneumoniae WGLW5 may
provide P. mirabilis with clues about the colonic environment. Further investigation of
the genomic differences between K. pneumoniae WGLW2, 3, and 5 may reveal gene
signatures associated with these observations.
A surprising finding of the studies presented in this chapter was evidence of
sexual dimorphism in colitis severity when an SPF microbiota was transferred to
genetically susceptible GF mice (Figure 2.6). As mentioned in the results section, while
males are more susceptible to several bacterial-driven diseases, we had not previously
observed increased male colitis severity in our SPF-Tbet-/- Rag2-/- colony. This suggests
complexity in sexual dimorphism that may be mirrored in susceptibility of mice to
diabetes. Non-obese diabetic (NOD) mice develop type I diabetes, with increased female
susceptibility compared to males. However, when maintained under GF conditions,
diabetes incidence is equivalent in male and female mice (158). Importantly, both host
hormone and glycerophospholipid metabolite levels were different between SPF-NOD
and GF-NOD mice. Perhaps the altered sex hormone milieu of male GF mice compared
56
to SPF controls could contribute to increased susceptibility to colitis in our GF-Tbet-/-
Rag2-/- model.
Interestingly, the microbial abundance profile of the colitis-associated sexual
dimorphism (Figure 2.7) was atypical in comparison to other microbiota-associated
disease states. In both obese mouse models (159) and human populations (160), obesity is
associated with an increased relative abundance of Firmicutes. The same pattern holds
true for children with type I diabetes (161). In inflammatory bowel disease, a larger
emphasis has been placed on an expanded Proteobacteria population in driving disease,
however relative abundances of entire gut communities do show a decrease in
Bacteroidetes in sick patients compared to controls!(162). Our 16S rRNA amplicon
survey showed the opposite, with an enrichment of Bacteroidetes and depletion of
Firmicutes in male mice with more severe colitis. These conflicting results may be due to
microbiota composition changes driven by the altered development state of GF mice.
Alternatively, studies have shown that almost every step in the 16S rRNA sequencing
pipeline, from DNA prep, 16S amplification, and sequencing protocol, can significantly
affect study output (163-165). Based on these findings, caution should taken when
comparing results from 16S surveys across different methodologies, and with current
knowledge, we may not be able to speculate on the biological relevance of the increased
Bacteroidetes to Firmicutes ratio observed in our study.
57
VI. MATERIALS AND METHODS
Bacterial strains and conventional culture
K. pneumoniae WGLW5 (BEI HM-749) was previously cultured from the stool of
BALB/c T-bet-/- Rag2-/- mice (127). K. pneumoniae WGLW1 (BEI HM-750), WGLW2
(BEI HM-751) and WGLW3 (BEI HM-748) are clinical isolates cultured from human
urine, sputum, and stool respectively. Bacteria were cultured in Luria-Bertani (LB) broth
shaking aerobically at 37°C overnight or on MacConkey agar. For culturable K.
pneumoniae CFU counts from stool, stool was collected from individual mice and
serially diluted 10-fold using sterile PBS onto MacConkey agar and incubated for 24 h at
37° C. Colonies were counted on plates with bacterial densities of 30-300 CFU. Log10
CFU/ g stool bacteria were calculated after accounting for dry and wet fecal weights.
ASF strains- Clostridium sp. (ASF356), Lactobacillus sp. (ASF360),
Lactobacillus murinus (ASF361), Mucispirillum schaedleri (ASF457), Eubacterium
plexicaudatum (ASF492), Firmicutes bacterium (ASF500), Clostridium sp. (ASF502),
and Parabacteroides sp. (ASF519) were received from Iowa State University (156).
SPF K. pneumoniae colonic inflammation model
4-week old SPF BALB/c Rag2-/- mice (Charles River, strain 028) were fed
1.5x10⁸ CFU K. pneumoniae isolate in 25 µl PBS from P200 pipette tips every third day
for 8 weeks. Mice were sacrificed and colons were processed for histology on day 56.
Histology
At the time of sacrifice, colons were harvested, removed of colonic contents, and
fixed in a solution of PBS with 4% paraformaldehyde. Tissue was paraffin embedded, cut
into 0.5 um thick sections and stained with hematoxylin and eosin. Slides were scored by

58
pathologists in a blinded manner. Dr. Jonathan Glickman assigned colitis scores based on
the cumulative sum of four criteria with a severity ranking between 0-4: mononuclear cell
infiltration, polymorphonuclear cell infiltration, epithelial crypt hyperplasia, and
epithelial injury. 0-absent, 1-mild, 2-moderate, 3-severe as described previously (166).
Dr. Roderick Bronson assessed a subset of slides for edema and ranked samples
according to severity. 1-low, 2-medium, 3-high.
SPF K. pneumoniae neonatal infection model
Beginning on the day of birth, SPF BALB/c Rag2-/- pups were sprinkled
(cutaneous inoculation around the mouth) with 1.3 x 10⁸ CFU K. pneumoniae in 20 µl
PBS daily for 7 days. To confirm systemic K. pneumoniae infection in pups dying in this
7-day window, K. pneumoniae CFU counts were assessed from the spleen and liver of a
K. pneumoniae WGLW5 sprinkled pup dead for less than 4 hours, a sickly sprinkled pup,
and its healthy sprinkled littermate. Tissue was treated similar to stool and assessed for K.
pneumoniae CFU as explained previously. 7-weeks after the final K. pneumoniae
inoculation, stool was assessed from surviving pups for culturable counts of K.
pneumoniae and P. mirabilis as above.
Real-time (RT)-qPCR
Mesenteric lymph nodes were harvested at the time of mouse sacrifice and stored
in RNAlater (Ambion) at -80° C. Tissue was washed with PBS prior to physical
homogenization in QIAzol lysis reagent (Qiagen). RNA was extracted (Qiagan RNeasy
Mini Kit), DNase treated, and reverse transcribed into cDNA (Bio-Rad iScript cDNA
Synthesis Kit). RT-qPCR was performed using the SYBR FAST Universal qPCR Kit
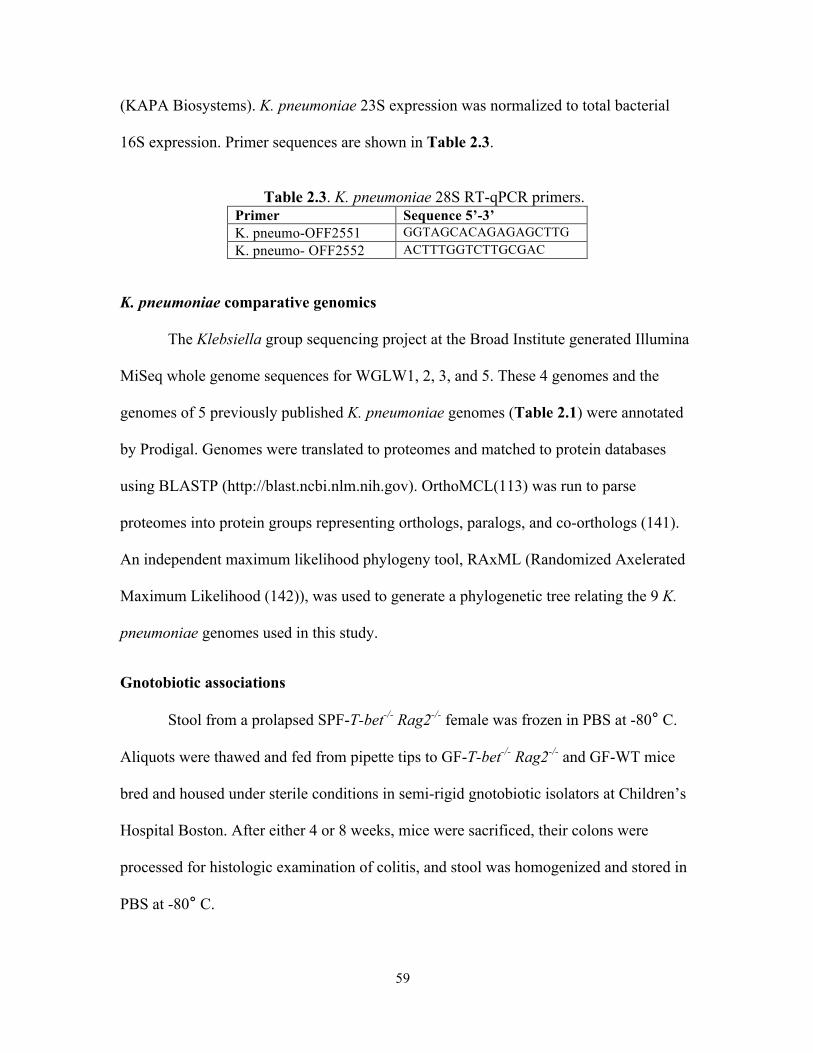
59
(KAPA Biosystems). K. pneumoniae 23S expression was normalized to total bacterial
16S expression. Primer sequences are shown in Table 2.3.
Table 2.3. K. pneumoniae 28S RT-qPCR primers.
Primer Sequence 5’-3’ K. pneumo-OFF2551 GGTAGCACAGAGAGCTTG K. pneumo- OFF2552 ACTTTGGTCTTGCGAC
K. pneumoniae comparative genomics
The Klebsiella group sequencing project at the Broad Institute generated Illumina
MiSeq whole genome sequences for WGLW1, 2, 3, and 5. These 4 genomes and the
genomes of 5 previously published K. pneumoniae genomes (Table 2.1) were annotated
by Prodigal. Genomes were translated to proteomes and matched to protein databases
using BLASTP (http://blast.ncbi.nlm.nih.gov). OrthoMCL(113) was run to parse
proteomes into protein groups representing orthologs, paralogs, and co-orthologs (141).
An independent maximum likelihood phylogeny tool, RAxML (Randomized Axelerated
Maximum Likelihood (142)), was used to generate a phylogenetic tree relating the 9 K.
pneumoniae genomes used in this study.
Gnotobiotic associations
Stool from a prolapsed SPF-T-bet-/- Rag2-/- female was frozen in PBS at -80° C.
Aliquots were thawed and fed from pipette tips to GF-T-bet-/- Rag2-/- and GF-WT mice
bred and housed under sterile conditions in semi-rigid gnotobiotic isolators at Children’s
Hospital Boston. After either 4 or 8 weeks, mice were sacrificed, their colons were
processed for histologic examination of colitis, and stool was homogenized and stored in
PBS at -80° C.
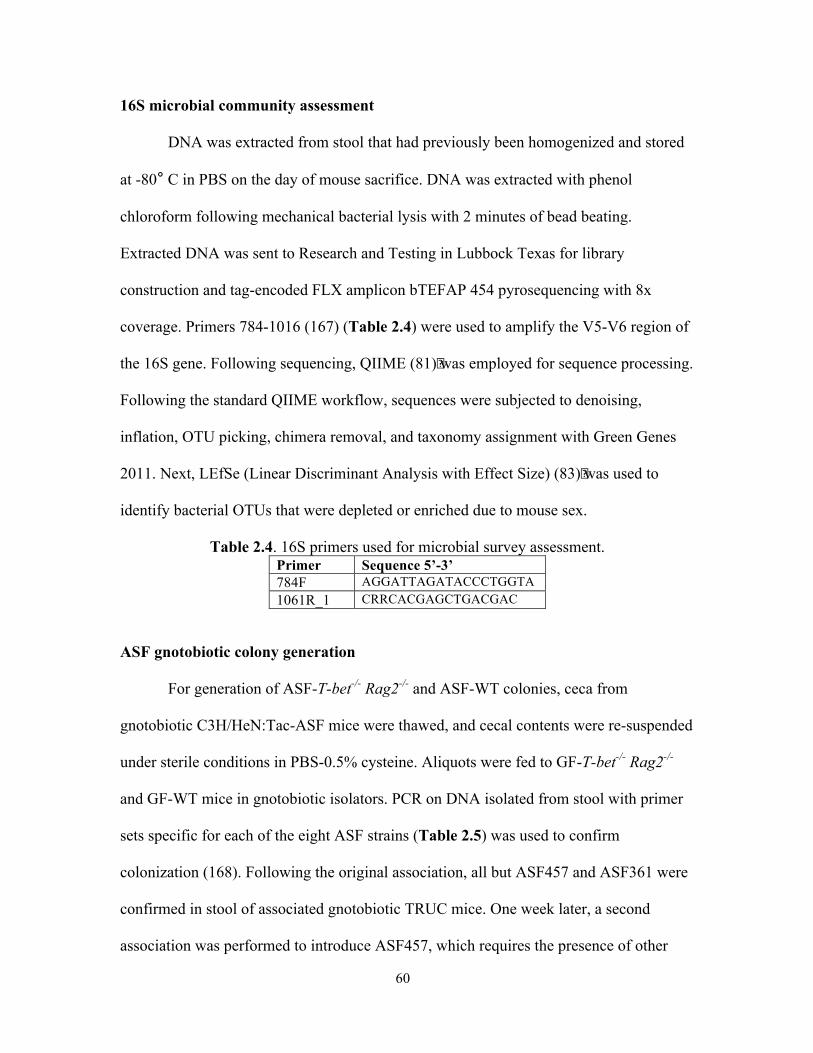
60
16S microbial community assessment
DNA was extracted from stool that had previously been homogenized and stored
at -80° C in PBS on the day of mouse sacrifice. DNA was extracted with phenol
chloroform following mechanical bacterial lysis with 2 minutes of bead beating.
Extracted DNA was sent to Research and Testing in Lubbock Texas for library
construction and tag-encoded FLX amplicon bTEFAP 454 pyrosequencing with 8x
coverage. Primers 784-1016 (167) (Table 2.4) were used to amplify the V5-V6 region of
the 16S gene. Following sequencing, QIIME (81)!was employed for sequence processing.
Following the standard QIIME workflow, sequences were subjected to denoising,
inflation, OTU picking, chimera removal, and taxonomy assignment with Green Genes
2011. Next, LEfSe (Linear Discriminant Analysis with Effect Size) (83)!was used to
identify bacterial OTUs that were depleted or enriched due to mouse sex.
Table 2.4. 16S primers used for microbial survey assessment. Primer Sequence 5’-3’ 784F AGGATTAGATACCCTGGTA 1061R_1 CRRCACGAGCTGACGAC
ASF gnotobiotic colony generation
For generation of ASF-T-bet-/- Rag2-/- and ASF-WT colonies, ceca from
gnotobiotic C3H/HeN:Tac-ASF mice were thawed, and cecal contents were re-suspended
under sterile conditions in PBS-0.5% cysteine. Aliquots were fed to GF-T-bet-/- Rag2-/-
and GF-WT mice in gnotobiotic isolators. PCR on DNA isolated from stool with primer
sets specific for each of the eight ASF strains (Table 2.5) was used to confirm
colonization (168). Following the original association, all but ASF457 and ASF361 were
confirmed in stool of associated gnotobiotic TRUC mice. One week later, a second
association was performed to introduce ASF457, which requires the presence of other

61
microbes to reduce redox-potential of the host before successful colonization can occur.
ASF361, an esophageal colonizer was confirmed vie PCR on DNA extracted from cecal
contents upon sacrifice.
Table 2.5. Primers for PCR confirmation of the 8 ASF flora in stool from gnotobiotic mice.
ASF strain Forward Primer 5’-3’ Reverse Primer 5’-3’ ASF356 CGGTGACTAATACCGCATACGG CCTTGCCGCCTACTCTCCC ASF360 CTTCGGTGATGACGCTGG GCAATAGCCATGCAGCTATTGTTG ASF361 GCAATGATGCGTAGCCGAAC GCACTTTCTTCTCTAACAACAGGG ASF457 CCGAAAGGTGAGCTAATGCCGG GGGACGCGAGTCCATCTTTC ASF492 CTGCGGAATTCCTTCGGGG CCCATACCACCGGAGTTTTC ASF500 GTCGCATGGCACTGGACATC CCTCAGGTACCGTCACTTGCTTC ASF502 CGGTACCGCATGGTACAGAGG CAATGCAATTCCGGGGTTGG ASF519 CACAGTAAGCGGCACAGCG CCGCTCACACGGTAGCTG
!
!
Statistical analyses
Statistical calculations were performed using GraphPad Prism® software. Utilized
tests include Mann-Whitney and one-way ANOVA with Dunnett’s post-test.

62
CHAPTER 3 !
THE GUT MICROBIOTA AND HOST ANTIMICROBIAL PEPTIDES INFLUENCE
KLEBSIELLA PNEUMONIAE CAPSULAR POLYSACCHARIDE POPULATION
DYNAMICS !

63
I. ATTRIBUTIONS
This chapter is adapted from a manuscript in preparation with the following authorship:
Leslie Wardwell-Scott1, Sarah S. Wilson2, Xochitl C. Morgan3, Curtis Huttenhower3,
Jason G. Smith2, Wendy S. Garrett1,4,5
1 Departments of Immunology and Infectious Diseases and Genetics and Complex Diseases, Harvard T.H. Chan School of Public Health, Boston, MA, USA 2 Department of Microbiology, University of Washington, Seattle, WA, USA
3 Biostatistics Department, Harvard T. H. Chan School of Public Health, Boston, MA, USA 4 The Broad Institute of MIT and Harvard, Cambridge, MA, USA
5 Department of Medical Oncology, Dana-Farber Cancer Institute, Boston, MA, USA
Leslie Wardwell-Scott performed all experiments and analyses, except as follows: the
Klebseilla sequencing group at the Broad Institute performed whole genome sequencing
of K. pneumoniae WGLW2, 3, 5. The Biopolymers Core of Harvard Medical School
sequenced variants of K. pneumoniae WGLW5. Xochitl Morgan of Harvard T.H. Chan
School of Public Health assembled and annotated the K. pneumoniae CPS variant
genomes. Sarah Wilson of the University of Washington performed organoid
experiments.
!
II. ABSTRACT
Klebsiella pneumoniae is a member of the gut microbiota of healthy individuals.
Whether K. pneumoniae’s mucoid capsular polysaccharide (CPS) coat helps or hinders
gastrointestinal tract colonization is unclear. To define a role for CPS in gastrointestinal
colonization dynamics, K. pneumoniae biogeography was assessed in gnotobiotic mice.
Naturally-arising K. pneumoniae variants with reduced CPS, which displayed enhanced
64
survival in response to bile salts and low pH, outcompeted mucoid populations
throughout the gastrointestinal tract, except in the distal small intestine. Mucoid
population levels correlated with regions of high Paneth cell antimicrobial peptide (AMP)
expression and use of small intestinal organoid cultures revealed increased mucoid K.
pneumoniae growth in the presence of Paneth cell α-defensins and decreased survival of
non-mucoid variants. CPS also conferred an advantage when K. pneumoniae was part of
a diverse microbiota. Introduction of a diverse microbiota to gnotobiotic mice colonized
with K. pneumoniae resulted in a decline of non-mucoid variants, while mucoid
populations remained stable. Inoculation of conventionally-reared mice with CPS
variants revealed selective maintenance of mucoid K. pneumoniae populations,
supporting that a CPS coat provides a competitive advantage against other bacteria in the
densely populated, polymicrobial environment of the gastrointestinal tract. Enhanced
survival of mucoid compared to non-mucoid variants in competition assays between K.
pneumoniae and Escherichia coli in vitro reinforced this concept. Collectively, these data
suggest that host AMPs, in combination with bacterial-bacterial interactions, shape
population dynamics of K. pneumoniae and select for mucoid K. pneumoniae throughout
the gastrointestinal tract.
III. INTRODUCTION
Klebsiella pneumoniae are species of Enterobacteriaceae that are responsible for
nosocomial and opportunistic infections of the lungs, urinary tract, liver, and blood (169).
Despite the clinical challenges K. pneumoniae presents, it coexists with other bacterial
members of the gut microbiota in healthy human hosts. An estimated 5-38% of the
65
general population carries K. pneumoniae in their gastrointestinal tract; however these
carriage numbers increase in hospital settings where up to 77% of caregivers and patients
are K. pneumoniae positive (85). Regions of East Asia, such as Taiwan, also report these
higher gastrointestinal carriage rates in healthy populations (121). Patient populations
with K. pneumoniae liver abscesses have shown 100% co-colonization of the
gastrointestinal tract, prompting the hypothesis that gastrointestinal carriage represents a
predisposition for liver abscesses and serves as a general reservoir for K. pneumoniae
disease (122).
A defining feature of K. pneumoniae is its mucoid capsular polysaccharide (CPS)
coat, which consists of glucuronic acid, glucose, variable additional sugars- typically
mannose, rhamnose, or fucose (92). There are upwards of 80 K. pneumoniae CPS
serotypes, which differ in composition of the CPS glycosyltransferase core and in
incorporated sugars (93). Sequenced CPS gene clusters range in size from 21 to 30 kb
with 16-25 open reading frames (93). K. pneumoniae capsule has been studied as a
virulence factor (169), as CPS protects bacteria from phagocytosis (170, 171) and
complement opsonization (172), facilitating evasion of host immune defenses (94). The
majority of clinical isolates are mucoid, but variation resulting in loss of CPS production
has been reported during in vitro culture (95, 173).
Since the gastrointestinal tract is K. pneumoniae’s reservoir for disease (174),
understanding K. pneumoniae population dynamics in mammalian gastrointestinal tracts
in homeostatic states may inform studies of transmission and pathogenicity. A few
studies have attempted to address the importance of CPS for gastrointestinal colonization
with conflicting results that may be explained by use of different colonization
66
environments including germ-free (GF) chicken intestine (128) and antibiotic treated
mice (129, 175). Experiments to deconstruct K. pneumoniae’s behavior in the
gastrointestinal tract are challenging. In this environment K. pneumoniae must compete
for space and nutrients with a multitude of bacterial species, while participating in a
delicate balance with the host immune system. By mapping K. pneumoniae’s intestinal
colonization biogeography, assessing colonization dynamics in GF and gnotobiotic
mouse models, and using a small intestinal organoid culture system, we implicate CPS in
inter-species bacterial interactions and protection against antimicrobial peptides produced
by host Paneth cells in the small intestine. While CPS has been shown to be protective for
K. pneumoniae during in vitro culture with antimicrobial peptides (176, 177), we
elucidate factors shaping capsular variation in vivo. Herein, we define a role for K.
pneumoniae CPS outside of the traditional virulence context and highlight the effect of
bacterial interactions with other members of the microbiota on shaping populations of
individual bacterial species.
IV. RESULTS
K. pneumoniae CPS loss following colonization of gnotobiotic mice.
To assess K. pneumoniae colonization in the gastrointestinal tract, GF BALB/c
mice were orally inoculated with murine K. pneumoniae strain WGLW5 (Figure 3.1A).
K. pneumoniae WGLW5 has a mucoid CPS coat that is maintained in vitro. Beginning
48h after inoculation, K. pneumoniae fecal isolates displayed diverse colony phenotypes
distinguishable on MacConkey agar, a differential media for selective culture of

67
Enterobacteriaceae (Figure 3.1B, 4-wks post inoculation). 16S rRNA amplicon
sequencing and a negative indole test confirmed that all isolates were K. pneumoniae.
These K. pneumoniae isolates appeared to have reduced CPS (Figure 3.1B). To
confirm decreased CPS production, we performed glucuronic acid measurement of
bacterial membranes from five colonies representative of the diverse colony phenotypes
isolated from K. pneumoniae mono-colonized mice. Glucuronic acid measurement
demonstrated that K. pneumoniae isolates lacking a parent mucoid phenotype had
significantly reduced CPS production (P ≤ 0.001) both on agar plates (Figure 3.1C) and
in liquid culture (Supplemental Figure 3.1). We termed low CPS producing isolates
non-mucoid variants (NMVs).
An 8-wk K. pneumoniae colonization time course in GF mice (Figure 3.1A)
revealed that the majority of recovered fecal K. pneumoniae isolates were NMVs as
assessed by colony phenotype on MacConkey agar (Figure 3.1D). Although GF mice
represent a model system for evaluating the behavior of single microorganisms in a host,
GF mice have significant immune alterations compared to conventionally colonized mice
(26). To address this issue, K. pneumoniae associations were repeated in gnotobiotic mice
colonized with the Altered Schaedler Flora (ASF), a microbial community comprised of
8 bacterial species found in the gut of healthy mice (168, 72). Although a simplified
microbiota, the ASF in gnotobiotic mice promotes expansion of gut mucosal T-regulatory
cell populations (73) and restores luminal IgA secretion (178). The absence of
Proteobacteria and direct niche competition in the ASF led us to hypothesize that K.
pneumoniae would readily colonize the gastrointestinal tract. While total K. pneumoniae
fecal CFU were slightly reduced in ASF compared to GF mice (Supplemental Table

68
Figure 3.1. K. pneumoniae CPS population shift following GI colonization of gnotobiotic mice. (A) Gnotobiotic mouse K. pneumoniae association experimental chema. Dashed lines represent time points for stool sampling and CFU enumeration. (B) Fecal K. pneumoniae colonies on MacConkey agar after 4-week colonization of a germ-free (GF) mouse with WGLW5. Stars indicate mucoid (MUC) colonies, all others colonies are NMVs. (C) Glucuronic acid content of the membrane fraction of overnight K. pneumoniae variants grown on MacConkey agar. Data
24 hrs 1.5 wk 4 wk 8 wk
0
10
20
30
40
50
60
70
80
90
100
murine stool WGLW5
human stool WGLW3
human sputum WGLW2
time after association
% t
ota
l K
. p
ne
um
on
iae
NMV K. pneumoniae
MUC K. pneumoniae
Germfree BALB/c
24 hrs
1.5 wks 4 wks
8 wks
K. pneumoniae
association
1kb
galF orf2 wzi wza wzc wcaJ gt1 gt2 gt3 gt4 gt5 gt6 gnd ugd uge manC manB
5’ 3’
galF orf2 wzi wza wzc wbaP gt14 gt15 gt16 wzy gt17 gt18 gt19 wzx gnd insB,A orf3 rmlB rmlA rmlD rmlC ugd uge
galF orf2 wzi wza wzc gt7 gt8 gt9 gt10 gt11 gt12 gt13 wcaJ gnd manC manB ugd uge
murine
stoolWGLW5
human
stoolWGLW3
human
sputumWGLW2
A B
C
E
F
D
% t
ota
l K.
pn
eu
mo
nia
etime after association
ASF
GF
NMV K. pneumoniae
MUC K. pneumoniae
MUC parent MUC 1 NMV 1 NMV 2 NMV 3 NMV 4
glu
curo
nic
acid
(fg
/CF
U)
0
15
30
250
300
350
400
450
500
*** *** *** ***
24 hrs 1.5 wk 4 wk 8 wk0
10
20
30
40
50
60
70
80
90
100
0.5cm
conserved variable not usually found in CPS cluster
1cm
NS

69
(Figure 3.1 Continued ) reflect mean ± SD of 3 experiments. (D) 8-wk association of GF (squares) and ASF (circles) mice with WGLW5. MUC population (gray); NMV population (black). (E) Scale representation of CPS gene clusters of isolates assembled from WGSs. (F) 8-wk association of ASF mice with the 3 isolates from (E). MUC population (gray); NMV population (black). For (D) and (F), data points represent mean population percentages ± SD for n=6 mice. ***, P ≤ 0.001, one-way ANOVA with Dunnett’s post-test. ________________________________________________________________________
3.1), loss of CPS and out-competition of parental mucoid K. pneumoniae by NMVs were
similar (Figure 3.1D).
CPS gene clusters of murine K. pneumoniae (WGLW5) and two human clinical
isolates (WGLW2- from human sputum, WGLW3- from human stool) were assembled
from whole genome sequences (WGSs) (Figure 3.1E). Serotype identity was assigned
using the wzc gene sequencing method, a recently described alternative to serum
serotyping based on strain based differences in genomic sequences (179). K. pneumoniae
WGLW5 was identified as serotype K25, WGLW3 was indeterminate, and WGLW2 was
serotype K2. Despite diversity in CPS serotype, all three isolates displayed CPS variation
when introduced into gnotobiotic ASF mice (Figure 3.1F), suggesting that reduction of
K. pneumoniae CPS in a gnotobiotic host harboring a simplified gut microbial
community is a shared feature of the species.
CPS reduction is not likely caused by genetic mutation or plasmid loss.
NMV K. pneumoniae does not revert to producing capsule under varied in vitro
culture conditions or upon passage through mice (Table 3.1). To investigate if the NMV
phenotype was driven by genetic mutation, WGSs were generated for 4 NMV and 2
mucoid variants. After alignment to K. pneumoniae WGLW5, single nucleotide
polymorphisms (SNPs) were identified between each CPS variant and the reference
(Supplemental Table 3.2). There were no SNPs shared among NMV K. pneumoniae in

70
any single gene or in any predicated pathway across the sequenced genome, including
within the CPS gene cluster. Additionally, plasmid profiles of all variants looked similar
(Figure 3.2) arguing against plasmid loss leading to reduced CPS.
Table 3.1. In vitro culture conditions and in vivo gnotobiotic associations with K. pneumoniae WGLW5 and corresponding shifts in CPS phenotype. Y indicates appearance of a different CPS phenotype from the starting population. N indicates no shift in CPS phenotype. MUC, mucoid; NA, non-applicable. !!!!!!
!
!
!
!
!
!
!
!
!
!
!
!
!
!
!
!
!!! !!!!!!!!!!!in!vitro!Culture!Conditions!(24!and!48hr)!
! Phenotype!Switch!! MUC!!!NMV! NMV!!!MUC!
MacConkey!agar/broth! N! N!LB!agar/broth! N! N!BHI!agar/broth! N! N!
M9!minimal!agar/broth! N! N!Fecal!extract!broth! N! N!30°C!(all!media)! N! N!37°C!(all!media)! N! N!39°C!(all!media)! N! N!H2O2!(LB)! N! N!pH!3.0!(LB)! N! N!
pH!6.8!(all!media)! N! N!Aerobic!(all!media)! N! N!Anaerobic!(all!media)! N! N!
Microaerophilic!(all!media)! N! N!SubLinhibitory!rifampicin!(LB)! N! N!SubLinhibitory!ampicillin!(LB)! N! N!
SubLinhibitory!streptomycin!(LB)! N! N!1%!bile!salts!(LB)! N! N!
Mucin!coated!wells!(LB)! N! N!10%!SDS!(LB)! Y! N!
CoLculture!with!E.#coli#(LB)! N! N!
in!vivo!
Associations!
GF!association! Y! NA!ASF!association! Y! NA!
E.#coli#coLassociation! Y! N!P.#mirabilis#coLassociation! Y! NA!Dextran!sodium!sulfate!!
in!drinking!water!Y! N!
Mice!fed!NIHL31M!diet! Y! NA!Mice!fed!RMH3000!diet! Y! NA!

71
Figure 3.2. Plasmid profiles of mucoid (MUC) and NMV K. pneumoniae. Plasmids were isolated from overnight LB cultures using a Qiagen miniprep kit and visualized on a 1% agarose gel.
We investigated whether the mucoid phenotype was driven by major genomic
rearrangements by assembling genomes, aligning contigs to the WGLW5 scaffold, and
aligning variant genomes with Progressive Mauve (180). Only NMV4 showed a
significant chromosomal rearrangement (Supplemental Figure 3.2A). In agreement with
the Progressive Mauve alignment, when reads were aligned to the WGLW5 reference
genome, there were no disagreements in gaps between mucoid variants (Supplemental
Figure 3.2B). Differences in genomic content were assessed by aligning assembly reads
to each annotated gene. After filtering proteins with poor sequencing coverage (median
coverage > 2 IQR below 25th percentile), total divergence in genomic content was < 1.2%
between variants, indicating low genomic loss (Supplemental Table 3.3). No genes were
uniquely gained or lost between mucoid and NMV variants.
48.510
3
2
KB
MUC parent
MUC 1
NMV 1
NMV 2
NMV 3
NMV 4

72
NMV K. pneumoniae display fitness advantages in response to environmental features of the gastrointestinal tract.
Given that mice are coprophagic, mice in our gnotobiotic model are constantly re-
inoculating themselves with K. pneumoniae, sourced either from their littermates’ or their
own stool. In this model of self-inoculation, K. pneumoniae would need to survive in the
dry, aerobic environment of a desiccating stool pellet for several hours in between hosts.
To assess whether mucoid K. pneumoniae is less fit outside the gut, we compared
culturable counts of NMV and mucoid K. pneumoniae in stool pellets over a 24-hr air-dry
desiccation period. Populations of mucoid vs. NMV K. pneumoniae did not change in this
desiccation time period (Figure 3.3), suggesting that NMV population increases are
driven by host factors and not by time spent ex vivo.
Figure 3.3. K. pneumoniae populations do not shift after 24 hours in desiccated stool. Stool from ASF-WT mice associated for 5 days with K. pneumoniae WGLW5 was assessed for culturable K. pneumoniae counts following collection and after 24 hours of desiccation at room temperature. Data points represent a stool pellet from individual mice (n=6). Lines connect stool from the same mouse.
freshstool
24 hrdry stool
0102030405060708090100
% total K. pne
MUC NMV
freshstool
24 hrdry stool

73
To identify host selective pressures contributing to K. pneumoniae CPS loss, we
investigated the response of CPS variants to gastrointestinal tract environmental
conditions. A barrier to gastrointestinal colonization is the stomach’s low pH. When
challenged with low pH (pH 3.2; murine stomach pH is 3.0-4.0 (181)) more NMV K.
pneumoniae survived than mucoid variants (P ≤ 0.05 - P ≤ 0.001) (Figure 3.4A). Also,
NMVs population numbers recovered more quickly than mucoid K. pneumoniae
following transfer from low pH to a neutral pH (Figure 3.4B). As an important control,
in an absence of pH stress, NMV and MUC K. pneumoniae display similar growth
dynamics, suggesting that MUC K. pneumoniae is able to grow as fast as NMVs in vitro
(Supplemental Figure 3.3).
Bile salts are another host selective pressure in the gastrointestinal tract. Bile salts
are present throughout the small intestine at concentrations between 0.2-2% (182, 183).
In the presence of physiological bile salt concentrations (1%), NMV K. pneumoniae grew
faster than mucoid variants (Figure 3.4C). More mucoid K. pneumoniae died during
incubation in 2% bile acid than NMVs (P ≤ 0.05 - P ≤ 0.001) (Figure 3.4D). The
superior survival and growth of NMV K. pneumoniae in environmental conditions
encountered along the gastrointestinal tract help explain how NMVs may outcompete
mucoid variants during gastrointestinal colonization over the course of several weeks.
CPS does not confer an advantage to K. pneumoniae in inflamed colons.
A CPS coat has been shown to protect K. pneumoniae from the host immune
response, for example, from phagocytosis by macrophages (170, 171) and complement
opsonization (172). For this reason, and given that our gnotobiotic mice were free from
histologic signs of colonic inflammation, we hypothesized that NMV K. pneumoniae

74
Figure 3.4. Fitness advantage of NMV K. pneumoniae in response to gastrointestinal tract environmental features. (A) Variant survival following incubation of overnight cultures in LB pH 3.2 for 2 h. Percentage survival compared to CFU counts prior to low pH. MUC- mucoid K. pneumoniae. (B) Recovery of variant CFU numbers following 2 h in LB pH 3.0 and resuspension in LB pH 6.8. (C) CFU growth curve of variants in the presence of 1% bile salts. (D) Variant survival following incubation of overnight cultures in 2% bile salts. Percentage survival compared to CFU counts prior to bile salt addition. Bars and data points represent mean ± SD of 3 biological replicates. *** P ≤ 0.001, ** P ≤ 0.01, * P ≤ 0.05, one-way ANOVA with Dunnett’s post-test in (A), (D), and two-way ANOVA with Bonferroni post-tests in comparison to MUC parent in (B) and (C).
pre post 1hr 2hr 3hr 4hr 5hr3
4
5
6
7
8
9
10
MUC parentMUC 1 NSNMV 1 ***4, 5 hrNMV 2 *4hr, ***5 hrNMV 3 ***4, 5 hrNMV 4 ***4, 5 hr
A B
MUC parent
MUC 1
NMV 1
NMV 2
NMV 3
NMV 4
0
2
4
6
8
10
12
% survival (pH 3.2)
* ** *** *
% survival (2% bile salts)
C D
MUC parent
MUC 1
NMV 1
NMV 2
NMV 3
NMV 4
40
50
60
70
80
90
100
*** *** * **
pH 3.0 pH 6.8
hrs in 1% bile salts
log 10 CFU/mL
MUC parentMUC 1 NSNMV 1 *5hr, ***6-9hrNMV 2 ***6-9 hrNMV 3 ***6-9 hrNMV 4 ***6-9 hr
NS
1 2 3 4 5 6 7 8 96
7
8
9
10
log 10 CFU/mL NS
75
would be less fit in an inflamed colon. To test this hypothesis, ASF-Tbet-/- Rag2-/- and
GF-Tbet-/- Rag2-/- mice were colonized with K. pneumoniae WGLW5 for 4-weeks. At
this time point, the fecal K. pneumoniae population is dominated by NMV variants
(Figure 3.1D). Mice were then administered either 1.5% or 3% dextran sodium sulfate
(DSS) in their drinking water for 9 days to induce epithelial injury and inflammation.
Histology revealed that in the gnotobiotic ASF setting, 3% DSS induced colitis and 1.5%
did not (Figure 3.5A). Fecal K. pneumoniae counts measured prior to and after DSS
administration revealed an increase in fecal K. pneumoniae in the presence of DSS.
Mucoid K. pneumoniae populations significantly increased in mice treated with both
1.5% and 3% DSS (Figure 3.5B), despite an absence of histologic colitis in mice
receiving the lower dose. While mucoid K. pneumoniae increased in an inflamed colon,
numbers of NMV K. pneumoniae did not significantly change.
Despite pre-established NMV K. pneumoniae populations being unaffected by the
onset of inflammation in a pre-colonized colon, we asked whether inflammation prior to
colonization would confer a competitive advantage to mucoid K. pneumoniae
populations. ASF-WT mice were treated with 3% DSS for 5 days prior to inoculation
with mucoid WGLW5. Counts of fecal K. pneumoniae over the course of 8 days on DSS
revealed that inflammation did not stop the appearance of NMV K. pneumoniae (Figure
3.5C). Rather, the mucoid K. pneumoniae population slightly decreased by the end of the
experiment compared to control mice. All mice had signs of histologic colitis (Figure
3.5D). Take together, these DSS experiments suggest that inflammation does not confer a
competitive advantage to mucoid K. pneumoniae in the setting of the colon. These

76
Figure 3.5. NMV K. pneumoniae colonization is not adversely affected by DSS-induced inflammation in the colon. (A) Histologic colitis score of colons from gnotobiotic ASF-TRUC mice associated with K. pneumoniae WGLW5 and administered 1.5% (n=6) or 3% DSS (n=8) in drinking water for 9 days. Control- DSS-free drinking water (n=8). (B) Log10 CFU/gram stool K. pneumoniae counts from stool before (pre) and after (d9) DSS administration in drinking water. Same mice as in (A), with the addition of WGLW5 colonized GF-TRUC receiving 3% DSS (n=8). (C) ASF-TRUC mice administered 3% DSS for 5 days, followed by colonization with mucoid (MUC) WGLW5. Counts of fecal K. pneumoniae were collected for 8 days following colonization and recorded as MUC colonies as a percentage of the whole K. pneumoniae population. 3% DSS continued for full length of experiment. n=6 for each group. (D) Histologic colitis score from mice from (C). Date points represent individual mice in (A), (C), (D). *** P ≤ 0.001, ** P ≤ 0.01, * P ≤ 0.05, Mann-Whitney U test.
pre d9 pre d9 pre d9 pre d9 pre d9 pre d9
MUCK. pneumoniae
NMVK. pneumoniae
log10 CFU/gram stool
10
9
8
7
6
5
4
1.5% DSS, ASF-TRUC3% DSS, ASF-TRUC3% DSS, GF-TRUC
*
**
***
BA
C
control DSS012345678910
Histologic Colitis Score
**
D
control DSS control DSS control DSS control DSS control DSS0102030405060708090100110
day 1 day 2 day 3 day 4 day 8
MUC (% total K. pne)
*
control 1.5% DSS 3% DSS012345678910
treatment
Histologic Colitis Score
**
***

77
experiments also suggest that an absence of inflammation does not explain appearance of
a large NMV population in our gnotobiotic mice.
CPS confers a competitive advantage to K. pneumoniae in the presence of a diverse microbiota.
Although we identified gastrointestinal tract selective pressures favoring NMV
population expansion, emergence of spontaneous NMVs was not observed in our
specified pathogen free (SPF) mice. To determine whether a more diverse microbiota
could affect K. pneumoniae CPS shifts, ASF mice were colonized with K. pneumoniae
for 4-wks and then inoculated with the colonic contents of SPF mice with no prior K.
pneumoniae exposure. 8-wks after diverse microbiota inoculation, culturable counts of
fecal K. pneumoniae decreased by several logs (Figure 3.6A). Fecal mucoid K.
pneumoniae decreased by an average of 0.11 log10 CFU/g stool. In contrast, there was a
large decline in NMV K. pneumoniae (average decrease of 2.3 log10 CFU/g stool; P ≤
0.01) (Figure 3.6B), suggesting that NMV K. pneumoniae is less fit when part of a
diverse microbial community.
During host colonization and transmission, K. pneumoniae does not have the
colonization advantage seen in our gnotobiotic model and must establish itself in the
presence of many microbes. To address this, we developed a colonization model that
introduced K. pneumoniae to mice concurrently with other symbionts. SPF pups were
sprinkled with either mucoid or NMV K. pneumoniae daily for 7d beginning on their date
of birth (Figure 3.6C)). 3-weeks after the final K. pneumoniae exposure, stool CFUs
were quantified. Mucoid K. pneumoniae stably colonized SPF pups, whereas NMV K.
pneumoniae were below the limit of fecal culture-based detection (3.7 log10 CFU/g stool,
P ≤ 0.01) (Figure 3.6C) and did not revert to producing CPS. Mucoid K. pneumoniae did

78
Figure 3.6. CPS affords K. pneumoniae a competitive advantage in the presence of a diverse microbiota. (A) ASF-WT mice (n=6) with a 4-wk established K. pneumoniae population were associated with stool from SPF mice. Total K. pneumoniae log10 CFU/g stool decline over 8-wks in the presence of SPF microbiota. Lines follow individual mice. (B) Change in mucoid (MUC) and NMV populations after 8-wks with a SPF-stool microbiota (from mice in A). (C) K. pneumoniae stool counts from 4-wk old SPF mice sprinkled with K. pneumoniae variants for 7d following birth (MUCparent, NMV3, and PBS n=9; MUC1 and NMV2 n=12). Counts were taken 3 wks after cessation of K. pneumoniae sprinkling. Limit of detection (LOD), 3.7 log10 CFU/g stool (dashed line). (D) E. coli stool counts from mice in (C). MUC group includes E. coli counts from pups sprinkled with MUCparent and MUC1; NMV group includes NMV2 and NMV3. Symbols in (C) and (D) represent individual mice. (E) in vitro competition between K. pneumoniae variants and E. coli. Each symbol represents survival of a K. pneumoniae isolate compared to growth in the absence of E. coli. *** P ≤ 0.001, ** P ≤ 0.01, Mann Whitney test. In (C), undetectable samples were given a value of the LOD for statistical analysis.
pre
24 h
rs1
wk
2 wk
3 wk
5 wk
6 wk
7 wk
8 w
k3
4
5
6
7
8
9
10lo
g10 C
FU
/gra
m s
tool
MUC NMV-4
-3
-2
-1
0
1
2
3
4
**
log
10 C
FU
/gra
m s
too
l
(8 w
k p
ost
- p
re S
PF
asso
cia
tio
n)
4 wks 8 wks
K. pneumoniae
association
ASFSPF stool
inoculation
weekly stool counts
SPF7 days 3 wks
day of birth end sprinkling
daily K. pneumoniae
sprinkling
K. pneumoniae
stool counts
A B
C
*** *** ***
MUC parent MUC 1 NMV 2 NMV 3 PBS
4
5
6
7
K. pneum
onia
e
log
10 C
FU
/gra
m s
too
l
E. coli
log
10 C
FU
/gra
m s
too
l
D
MUC NMV PBS2
4
6
8
10
E
MUC NMV0
2
4
6
8
10
12
% r
ela
tive s
urv
ival
E
. coli
com
petition
*
time after SPF microbiota association
*** ***
***
NS

79
not give rise to NMVs in SPF mice, unlike the results of GF and gnotobiotic associations.
These experiments also revealed that fecal E. coli levels differed between groups
receiving a PBS control or CPS variants. Mucoid-sprinkled pups showed the lowest E.
coli levels, whereas pups receiving PBS were colonized at much higher levels (P ≤ 0.001)
(Figure 3.6D).
While colonization resistance and niche fulfillment may play a role in balancing
related bacteria in the gastrointestinal tract, direct inter-bacterial warfare is also possible
(184, 185). To determine if E. coli and K. pneumoniae have an antagonistic relationship,
competition assays were performed against an E. coli isolated from stool of a SPF-Tbet-/-
Rag2-/- mouse (termed TRUC E. coli from here on). Since the K. pneumoniae variants
described above had adapted to a GF environment in the absence of bacterial competition
for 4-wks prior to isolation, competition experiments utilized 4 mucoid and 4 NMV K.
pneumoniae isolates cultured from stool of GF mice colonized for only 1.5 wks with K.
pneumoniae. Although all K. pneumoniae isolates were adversely affected by the
presence of E. coli, mucoid K. pneumoniae displayed enhanced survival compared to
NMVs (Figure 3.6E).
The TRUC E. coli genome contains multiple anti-bacterial systems that may contribute towards K. pneumoniae killing.
To investigate the antagonistic relationship observed between TRUC E.
coli and K. pneumoniae, we performed a genomic analysis of our TRUC E. coli isolate.
The TRUC E. coli genome was sequenced on an Illumina MiSeq by the Biopolymers
Core of Harvard Medical School. After adapter trimming and removal of low quality
reads, the Velvet assembler (186) was used for genome assembly, leading to a genome
with 86 contigs. Genome annotation was performed with PROKKA (187).
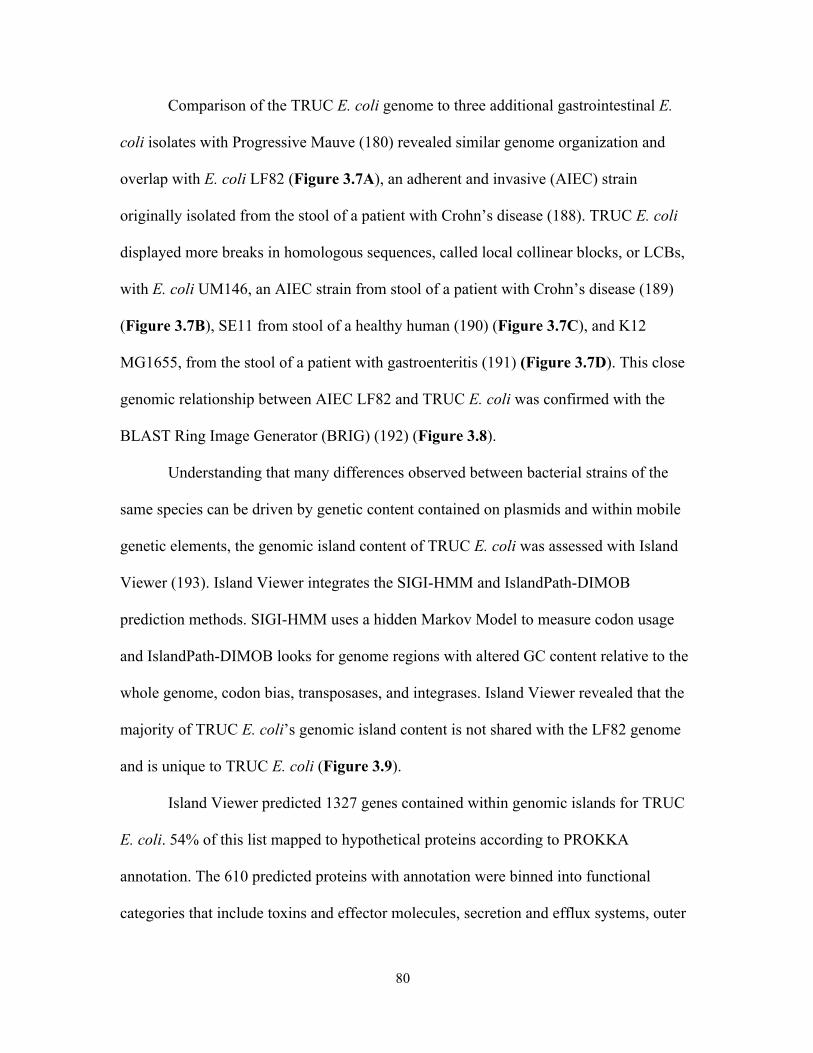
80
Comparison of the TRUC E. coli genome to three additional gastrointestinal E.
coli isolates with Progressive Mauve (180) revealed similar genome organization and
overlap with E. coli LF82 (Figure 3.7A), an adherent and invasive (AIEC) strain
originally isolated from the stool of a patient with Crohn’s disease (188). TRUC E. coli
displayed more breaks in homologous sequences, called local collinear blocks, or LCBs,
with E. coli UM146, an AIEC strain from stool of a patient with Crohn’s disease (189)
(Figure 3.7B), SE11 from stool of a healthy human (190) (Figure 3.7C), and K12
MG1655, from the stool of a patient with gastroenteritis (191) (Figure 3.7D). This close
genomic relationship between AIEC LF82 and TRUC E. coli was confirmed with the
BLAST Ring Image Generator (BRIG) (192) (Figure 3.8).
Understanding that many differences observed between bacterial strains of the
same species can be driven by genetic content contained on plasmids and within mobile
genetic elements, the genomic island content of TRUC E. coli was assessed with Island
Viewer (193). Island Viewer integrates the SIGI-HMM and IslandPath-DIMOB
prediction methods. SIGI-HMM uses a hidden Markov Model to measure codon usage
and IslandPath-DIMOB looks for genome regions with altered GC content relative to the
whole genome, codon bias, transposases, and integrases. Island Viewer revealed that the
majority of TRUC E. coli’s genomic island content is not shared with the LF82 genome
and is unique to TRUC E. coli (Figure 3.9).
Island Viewer predicted 1327 genes contained within genomic islands for TRUC
E. coli. 54% of this list mapped to hypothetical proteins according to PROKKA
annotation. The 610 predicted proteins with annotation were binned into functional
categories that include toxins and effector molecules, secretion and efflux systems, outer
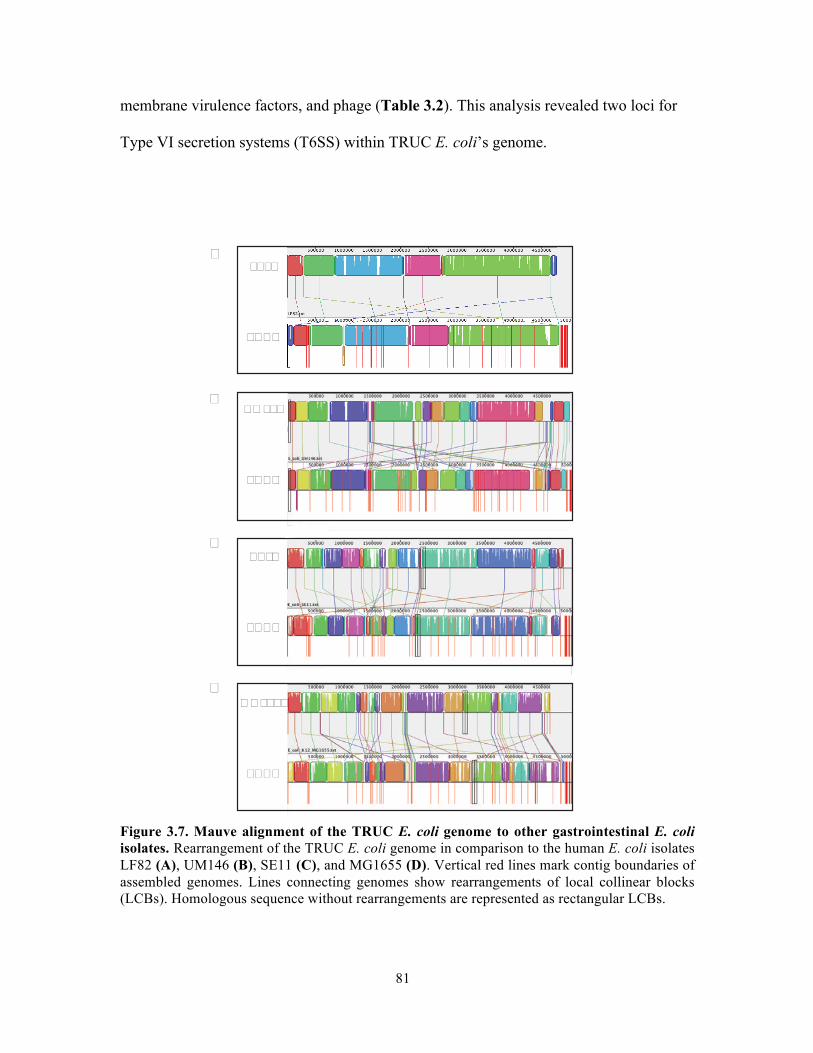
81
membrane virulence factors, and phage (Table 3.2). This analysis revealed two loci for
Type VI secretion systems (T6SS) within TRUC E. coli’s genome.
Figure 3.7. Mauve alignment of the TRUC E. coli genome to other gastrointestinal E. coli isolates. Rearrangement of the TRUC E. coli genome in comparison to the human E. coli isolates LF82 (A), UM146 (B), SE11 (C), and MG1655 (D). Vertical red lines mark contig boundaries of assembled genomes. Lines connecting genomes show rearrangements of local collinear blocks (LCBs). Homologous sequence without rearrangements are represented as rectangular LCBs.
A
B
C
D
LF82
TRUC
UM146
TRUC
SE11
TRUC
MG1655
TRUC
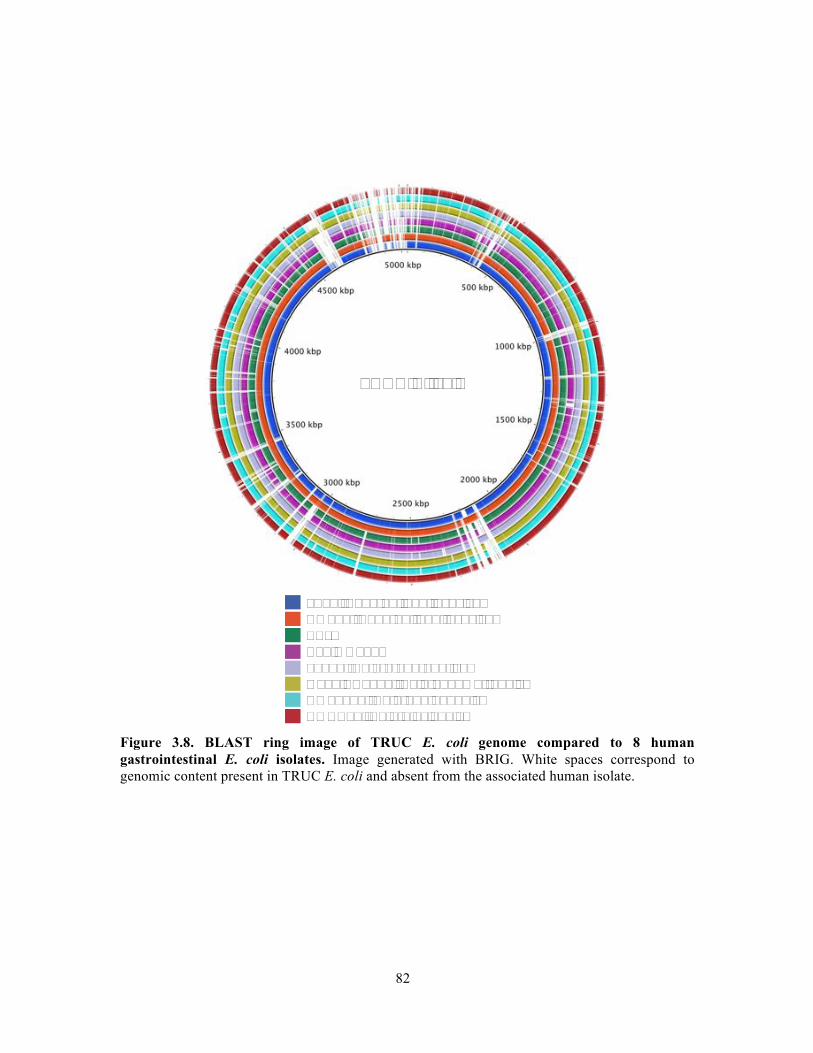
82
Figure 3.8. BLAST ring image of TRUC E. coli genome compared to 8 human gastrointestinal E. coli isolates. Image generated with BRIG. White spaces correspond to genomic content present in TRUC E. coli and absent from the associated human isolate.
TRUC E. coli
LF82 (Adherent and Invasive)UM146 (Adherent and Invasive)SE11K12 MG165555989 (Entero-aggregative)O157 EDL933 (Enterohaemorrhagic)RM12579 (Enteropathogenic)UMNK88 (Enterotoxigenic)
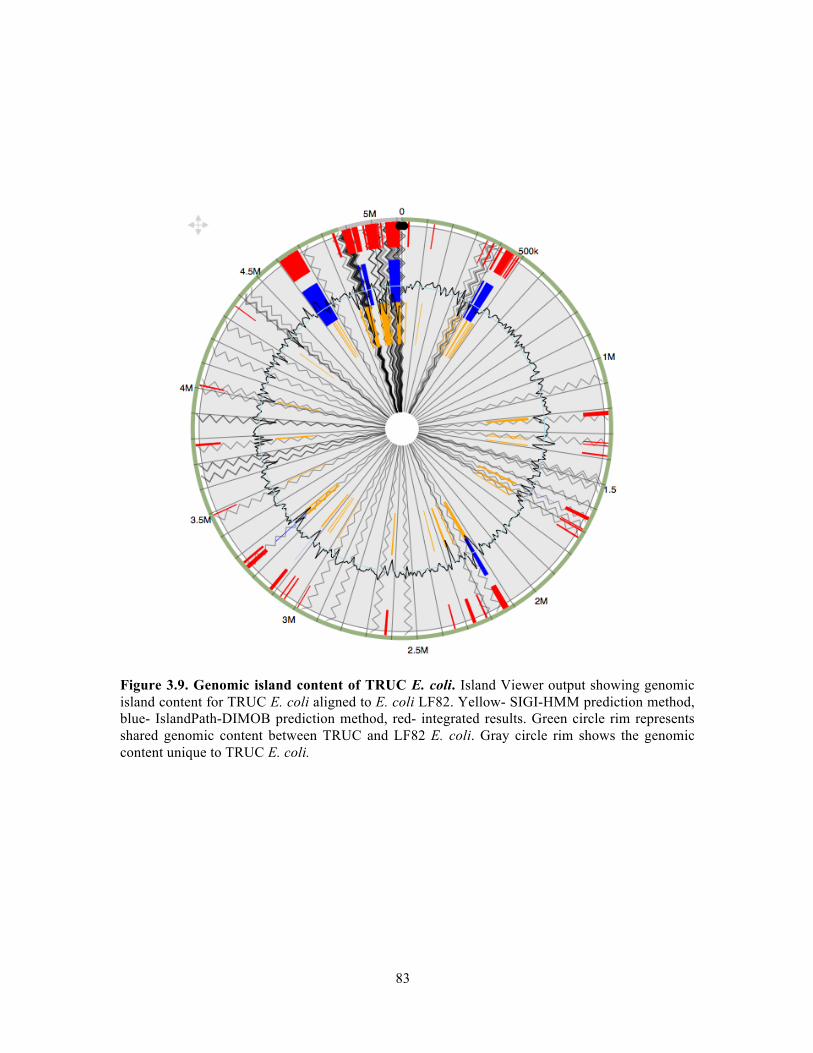
83
Figure 3.9. Genomic island content of TRUC E. coli. Island Viewer output showing genomic island content for TRUC E. coli aligned to E. coli LF82. Yellow- SIGI-HMM prediction method, blue- IslandPath-DIMOB prediction method, red- integrated results. Green circle rim represents shared genomic content between TRUC and LF82 E. coli. Gray circle rim shows the genomic content unique to TRUC E. coli.
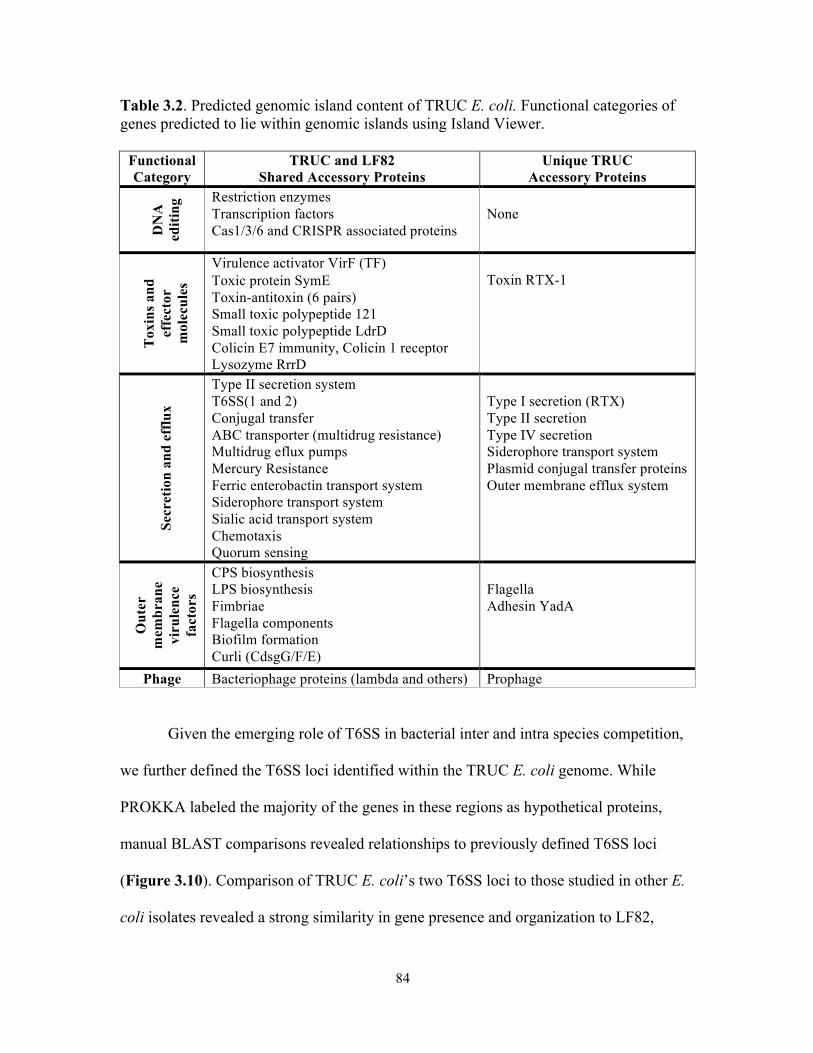
84
Table 3.2. Predicted genomic island content of TRUC E. coli. Functional categories of genes predicted to lie within genomic islands using Island Viewer.
Functional Category
TRUC and LF82 Shared Accessory Proteins
Unique TRUC Accessory Proteins
DN
A
editi
ng Restriction enzymes
Transcription factors None Cas1/3/6 and CRISPR associated proteins
Tox
ins a
nd
effe
ctor
m
olec
ules
Virulence activator VirF (TF) Toxin RTX-1 Toxic protein SymE
Toxin-antitoxin (6 pairs) Small toxic polypeptide 121 Small toxic polypeptide LdrD Colicin E7 immunity, Colicin 1 receptor Lysozyme RrrD
Secr
etio
n an
d ef
flux
Type II secretion system T6SS(1 and 2) Conjugal transfer ABC transporter (multidrug resistance) Multidrug eflux pumps Mercury Resistance Ferric enterobactin transport system Siderophore transport system Sialic acid transport system Chemotaxis Quorum sensing
Type I secretion (RTX) Type II secretion Type IV secretion Siderophore transport system Plasmid conjugal transfer proteins Outer membrane efflux system
Out
er
mem
bran
e vi
rule
nce
fact
ors
CPS biosynthesis LPS biosynthesis Fimbriae Flagella components Biofilm formation Curli (CdsgG/F/E)
Flagella Adhesin YadA
Phage Bacteriophage proteins (lambda and others) Prophage
Given the emerging role of T6SS in bacterial inter and intra species competition,
we further defined the T6SS loci identified within the TRUC E. coli genome. While
PROKKA labeled the majority of the genes in these regions as hypothetical proteins,
manual BLAST comparisons revealed relationships to previously defined T6SS loci
(Figure 3.10). Comparison of TRUC E. coli’s two T6SS loci to those studied in other E.
coli isolates revealed a strong similarity in gene presence and organization to LF82,

85
uropathogenic, and avian pathogenic E. coli (194). Of the two loci identified, T6SS1 is
thought to contribute to bacterial competition while T6SS2 has been implicated in the
pathogenesis of meningitis (194). The strain specific regions of T6SS loci (light gray
region in Figure 3.10) typically contain effector proteins. BLAST did not reveal
annotated matches for TRUC-specific T6SS genes, however PGAP1-like protein domains
have been found in effector proteins from other T6SS loci (195, 194) and it is possible
that this protein in TRUC E. coliÕs T6SS1 loci plays a role in bacterial killing.
Experiments with E. coli T6SS1 mutants should be performed to confirm a role for T6SS
in interactions with K. pneumoniae.
Figure 3.10. T6SS1 and T6SS2 of TRUC E. coli. T6SS were defined using a combination of PROKKA annotation and manual BLAST comparisons. Gene labeling according to the scheme used by Ma, et al. 2014. Predicted protein family, domain, or motif recorded below gene label. Loci shown to scale. Genes shaded light gray represent regions unique to TRUC E. coliÕs T6SS loci as assessed by BLAST. All other genes are found in previously identified E. coli T6SS loci.
2Kb
yafT A B C D E clpB G H I J K L M N O P Q yhhI
5Õ 3Õ
Hcp2 ImpA IcmF ClpV1-ATP VasF VasD FHA VasB VasA gp25 VipB VipA Hcp1 Vgr PAAR transposase related DotU domain motif
T6SS core TRUC borders conserved specific
TRUC E. coli T6SS2 22 ORFs, 28,456 Kb
5Õ 3Õ 2Kb
O N M G ompA A clpB Q C D L K I M B tRNA VipA VipB gp25 VasF Hcp2 Vgr PGAP1 IcmF PAAR VasA VasB /D GP25 ImpA
DotU related like motif
TRUC E. coli T6SS1 21 ORFs, 29,310 Kb

86
Biogeography of mucoid K. pneumoniae populations correlate with regions of high Paneth cell antimicrobial expression in the gastrointestinal tract.
Despite NMV K. pneumoniae’s fitness advantages over mucoid variants in the
absence of bacterial competition, a small population of mucoid K. pneumoniae was
maintained in gnotobiotic animals throughout an 8-wk colonization (Figure 3.1D, F). To
investigate maintenance of mucoid populations, we explored K. pneumoniae’s
biogeography throughout the gastrointestinal tract. The gastrointestinal tracts of ASF
mice were divided into 7 sample sites (Supplemental Figure 3.4A). Culturable counts of
K. pneumoniae were taken from the luminal contents and associated mucosa at each site.
Total K. pneumoniae in luminal contents increased sequentially along the gastrointestinal
tract (Figure 3.11A). NMV K. pneumoniae predominated throughout most of the
gastrointestinal tract in both luminal and mucosal sites with the exception of the distal
small intestine, where the proportion of mucoid K. pneumoniae spiked (Figure 3.11B).
The distal small intestine also had the highest gene expression of lysozyme 1 (Figure
3.11C) and cryptdins, mouse enteric α-defensins (Figure 3.11D), which are antimicrobial
peptides (AMPs) released by Paneth cells (196). There was a direct relationship between
high mucoid K. pneumoniae populations and high host cryptdin expression (Spearman
correlation, r=0.39, P=0.015) (Figure 3.11E). Mucoid K. pneumoniae levels did not
follow the expression pattern of AMPs produced by colonic epithelial cells (mouse β-
defensin3, Supplemental Figure 3.4B), suggesting that AMPs produced specifically by
Paneth cells may shape K. pneumoniae CPS population distribution in the gut.
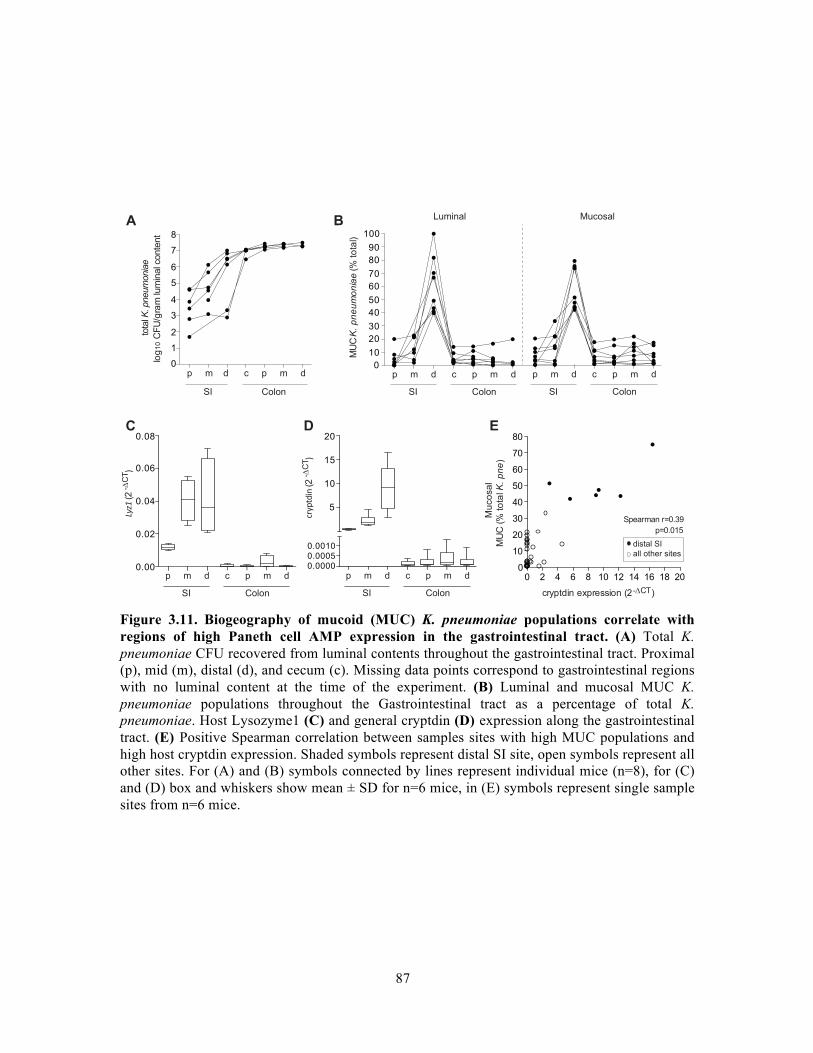
87
Figure 3.11. Biogeography of mucoid (MUC) K. pneumoniae populations correlate with regions of high Paneth cell AMP expression in the gastrointestinal tract. (A) Total K. pneumoniae CFU recovered from luminal contents throughout the gastrointestinal tract. Proximal (p), mid (m), distal (d), and cecum (c). Missing data points correspond to gastrointestinal regions with no luminal content at the time of the experiment. (B) Luminal and mucosal MUC K. pneumoniae populations throughout the Gastrointestinal tract as a percentage of total K. pneumoniae. Host Lysozyme1 (C) and general cryptdin (D) expression along the gastrointestinal tract. (E) Positive Spearman correlation between samples sites with high MUC populations and high host cryptdin expression. Shaded symbols represent distal SI site, open symbols represent all other sites. For (A) and (B) symbols connected by lines represent individual mice (n=8), for (C) and (D) box and whiskers show mean ± SD for n=6 mice, in (E) symbols represent single sample sites from n=6 mice.
log
10 C
FU
/gra
m lum
inal c
onte
nt
0.00
0.02
0.04
0.06
0.08
Lyz1
(2
)
0.00000.00050.0010
5
10
15
20
Spearman r=0.39
p=0.015
cryptdin expression (2 )
MU
C (
% t
ota
l K.
pn
e)
A
C
B
D E
Mu
co
sa
l
tota
l K. pneum
onia
e
distal SI
all other sites
0 2 4 6 8 10 12 14 16 18 200
10
20
30
40
50
60
70
80
0
1
2
3
4
5
6
7
8
0
10
20
30
40
50
60
70
80
90
100
MU
C K
. p
ne
um
on
iae (
% t
ota
l)
Luminal Mucosal
SI Colon
p m d c p m d
SI Colon
p m d c p m d
SI Colon
p m d c p m d
SI Colon
p m d c p m d
SI Colon
p m d c p m d
- CT
-C
T
cryp
tdin
(2
)
-C
T

88
CPS protects K. pneumoniae from killing by Paneth cell α-defensins.
Based on the correlation between mucoid K. pneumoniae and high host cryptdin
expression, we hypothesized that CPS provides K. pneumoniae with an advantage in the
presence of α-defensins in vivo. We tested the sensitivity of K. pneumoniae to α-
defensins and found increased killing activity against NMVs compared to mucoid K.
pneumoniae with cryptdin 23 (Crp23, produced by mouse Paneth cells, Figure 3.12A), α-
defensin 1 (HNP1, produced by human neutrophils, Figure 3.12B), and α-defensin 5
(HD5, produced by human Paneth cells, Figure 3.12C) (P ≤ 0.05 - P ≤ 0.001),
supporting the conclusion that CPS protects K. pneumoniae from host α-defensins.
Mucoid K. pneumoniae is also protected from killing by β-defensins (Supplemental
Figure 3.5), but as the geography of expression does match mucoid K. pneumoniae
colonization (Supplemental Figure 3.4B), these AMPs may be less of a selective
pressure or be present at too low concentrations in the colons of healthy mice to impact
K. pneumoniae population dynamics.
Small intestinal organoids can be cultured from primary stem cells present in
intestinal crypts. They model the complex small intestinal epithelium and contain its full
complement of differentiated cells types (196). Using microinjection into organoids to
model luminal bacterial exposure within the gastrointestinal tract, Paneth cell α-defensins
have been shown to restrict bacterial growth in organoids (197). However, bacterial
growth was not restricted in organoids produced from Mmp7-/- mice, which lack active
Paneth cell α-defensins but are otherwise physiologically normal (198). To address the
effects of CPS on K. pneumoniae exposed to naturally secreted Paneth cell α-defensins,
we compared the growth of mucoid and NMVs after microinjection into wild-type (WT)

89
!
!Figure 3.12. CPS protects K. pneumoniae against killing by Paneth cell AMPs. Relative survival of mucoid (MUC) and NMV variants in the presence of murine Crp23 (A), human HNP1 (B), and human HD5 (C). Relative survival as compared to untreated samples. (D) Image of a small intestinal organoid in culture (top). Relative survival of CPS variants in organoids with Paneth cell cryptdin production (WT) compared with organoids defective in cryptdin production (Mmp7-/-). *** P ≤ 0.001, ** P ≤ 0.01, * P ≤ 0.05, one-way ANOVA with Dunnett’s posttest.
% relative growth in organoids
(WT/Mmp7-/-)
MUC parent
MUC 1
NMV 1
NMV 2
NMV 3
NMV 4
% relative survival
A B
C D
7.5 ȝM Crp23
*** *** **
MUC parent
MUC 1
NMV 1
NMV 2
NMV 3
NMV 4
% relative survival
7.5 ȝM HNP1
MUC parent
MUC 1
NMV 1
NMV 2
NMV 3
NMV 4
% relative survival
7.5 ȝM HD5
0.0
0.5
1.0
1.5
2.0
2.5
0
2
4
6
8
10
12
14
*** *** ** ***
02468101214161820 ** ** ** *
MUC parent
MUC 1
NMV 1
NMV 2
NMV 3
NMV 4
0
50
100
150
200
250
300 ** ** ** * *
10 ȝm
NS
NS
NS NS
90
and Mmp7-/- small intestinal organoids. A significant (2-4 fold; P ≤ 0.05 - P ≤ 0.001)
growth inhibition was seen with all NMVs in the WT organoids compared to growth in
Mmp7-/- organoids (Figure 3.12D). In contrast, mucoid K. pneumoniae growth actually
increased in WT organoids (Figure 3.12D). These data support that increased sensitivity
of NMVs to AMPs, specifically α-defensins, imposes selective pressure in the mouse
small intestine during colonization.
V. DISCUSSION !
The diverse and dense microbial environment of the mammalian gastrointestinal
tract has made understanding the response of bacterial populations to individual features
of the gastrointestinal environment challenging. GF and gnotobiotic mouse models with
minimal microbial communities allowed us to disentangle contributions from the host
and microbiota in shaping spatial population dynamics of the gut symbiont, K.
pneumoniae, along the gastrointestinal tract. While the presence of a mucoid CPS coat
was a handicap for K. pneumoniae when subjected to the harsh gastrointestinal conditions
of bile salts and a low pH in vitro (Figure 3.4), maintenance of mucoid populations in the
distal small intestine, and more importantly, absence of NMV populations in the
gastrointestinal tracts of conventionally colonized mice, suggested the presence of other
significant selective pressures.
In tracing the biogeography of K. pneumoniae CPS populations along the
gastrointestinal tract, Paneth cells emerged as selective pressure favoring mucoid K.
pneumoniae. While prior work has demonstrated in vitro resistance to cationic AMPs by
K. pneumoniae and other encapsulated bacteria (176, 177), determining if and how this

91
shapes K. pneumoniae CPS populations in vivo has remained elusive. Not only did
mucoid K. pneumoniae tolerate direct exposure to physiologic levels of purified AMPs
better than NMVs (Figure 3.12A-C), but mucoid K. pneumoniae also displayed
enhanced growth in the presence of naturally secreted Paneth cell AMPs in small
intestinal organoids (Figure 3.12D). This finding speaks to a growing body of research
suggesting that microbes actively sense and respond to host immune molecules, with one
of the most striking examples being activation of quorum sensing and virulence pathways
in Pseudomonas aeruginosa upon binding of host interferon γ to the bacterial outer
membrane porin OprF (199). With respect to AMPs, polymixin B or neutrophil defensin
1 exposure has been hypothesized to increase K. pneumoniae CPS production (176) and
to globally alter K. pneumoniae gene expression (200). A recent report on the influence
of AMPs on gastrointestinal bacterial communities found that several common gut
symbiotic bacteria share high levels of resistance to AMPs (201). Additionally,
differential α-defensin expression influences the composition of symbiotic bacterial
populations in SPF mice (202). Collectively, these studies support the importance of
Paneth cells in influencing bacterial colonization of the host (203).
In this study, we also identified an advantage conferred by CPS when K.
pneumoniae is part of a complex gastrointestinal microbiota (Figure 3.6). The selective
pressure of a diverse microbiota was best exemplified during K. pneumoniae colonization
of SPF mice inoculated as neonates (Figure 3.6C). Neonatal Paneth cell numbers remain
low until post-natal day 28 (204), suggesting that the selective pressure of Paneth cell α-
defensins was minimal in these mice and highlighting the strong influence of the
microbiota. There have been contradictory data on the role of capsule when K.

92
pneumoniae colonizes the gastrointestinal tract (128, 175). The most recent direct
investigation of this question reported equivalent gastrointestinal colonization between
mucoid and non-mucoid mutants as measured by fecal bacterial counts in streptomycin
treated mice (175), which harbor a markedly perturbed gut microbiota. Streptomycin
depletes the gastrointestinal tract of many potential K. pneumoniae competitors, such as
other members of the γ-Proteobacteria (34), including E. coli, which we found had an
antagonistic relationship with K. pneumoniae (Figure 3.6E). Additionally, fecal CFU
counts of K. pneumoniae recovered from streptomycin treated mice in Struve et al. are
several logs higher than those that we observed in SPF mice and are equivalent to
colonization levels we observed in gnotobiotic associations (Supplemental Table 3.1).
Thus, the data of Struve et al. are not in conflict with our observations, but rather, support
our findings on NMV expansion in gnotobiotic ASF associations (Figure 3.1) and that
gut microbial community diversity is a selective pressure for K. pneumoniae CPS
maintenance.
Further studies are needed to define the precise role that CPS plays in K.
pneumoniae’s interactions with other bacteria. We hypothesize that CPS may aide K.
pneumoniae in several ways. Unfortunately, the mechanism of CPS loss in NMVs
remains indeterminate. Genomic analyses did not reveal SNPs or large deletions shared
among NMVs that could explain CPS loss (Supplemental Table 3.2). Genes regulating
CPS production, such as rmpA, are often carried on plasmids (101); however, NMV
plasmid profiles were similar to mucoid profiles (Figure 3.2). K. pneumoniae with CPS
coats grow faster as a biofilm as compared to engineered NMVs (205). Biofilms in the
gut have been found attached to food particles, and bacteria residing in gut biofilms are

93
known to digest complex carbohydrates at different rates than non-aggregated bacteria
(206). Perhaps CPS, by aiding in the establishment of a fast-growing biofilm, help K.
pneumoniae sequester and utilize resources more efficiently than NMV K. pneumoniae
when competing with many other bacteria for the same pool of resources.
Alternatively CPS may afford K. pneumoniae a competitive advantage in a
complex microbiota through physical protection from direct bacterial interactions. Given
the mechanistic similarities between host AMPs and bacterially produced antimicrobials
(207), CPS may protect K. pneumoniae against bacterially produced antimicrobials. In
support of this concept, we observed increased survival of mucoid K. pneumoniae as
compared to NMVs during in vitro competition experiments with a murine E. coli isolate
(Figure 3.6E). While little research to date has focused on competition between K.
pneumoniae and E. coli specifically, antagonistic relationships can exist between bacteria
of the same phylum, family, and often species in polymicrobial environments such as the
Gastrointestinal tract (208).
The cache of antimicrobial weaponry employed by bacteria against other bacteria
includes microcins, contact-dependent inhibition (CDI), and type VI secretion of protein
effectors. Gram-negative bacteria produce many AMPs. For example, the E. coli AMP,
microcin7, exhibits antimicrobial activity against K. pneumoniae (209). In addition to
released bacterial toxins such as microcins and colicins, E. coli can deliver toxins using
methods that require cell-to-cell contact with a targeted bacterium. While type VI
secretion (T6SS) were initially described in relation to host-pathogen interactions (210),
extensive work in Vibrio cholera and Pseudomonas aeruginosa has established a role for
this system in intra- and inter-species bacterial warfare (211, 212). T6SS loci have been

94
reported in many species of Proteobacteria, including E. coli (213). Investigation of the
genome of the E. coli used in our studies revealed presence of two T6SS loci and a
predicted microcin, which may contribute to the inhibitory interaction we observed
against K. pneumoniae. Just as CPS can physically protect K. pneumoniae from
antimicrobials in solution, CPS may restrict access of CDI or T6SS machinery to the cell
surface proteins required for CDI, or to the bacterial periplasm necessary for T6SS.
Collectively our data suggest that CPS is an important defense mechanism against attack
from both host and bacterial cells. In the gastrointestinal tract of conventional mice, the
host and the gut microbiota likely act in tandem to select for a mucoid K. pneumoniae
population. This begins with Paneth cell AMPs in the distal small intestine and is
followed by increased microbial density and diversity throughout the colon. By
maintaining a mucoid K. pneumoniae population in the ileum, the host has selected K.
pneumoniae to be a more effective competitor in the lower gastrointestinal tract. This
host-microbiota co-maintenance of mucoid K. pneumoniae populations, which represent
the most virulent clinical isolates, may explain why the gastrointestinal tract is a
significant reservoir for human K. pneumoniae disease. While CPS has classically been
studied as a means to evade the host immune system, we define the importance of mucoid
CPS for when K. pneumoniae becomes part of the polymicrobial environment of the
colon. Overall, our study suggests that bacterial-bacterial interactions may be equally, if
not more important than host factors in influencing the population dynamics of a single
bacterial species within the gastrointestinal tract.

95
VI. MATERIALS AND METHODS
Bacterial strains and culture conditions
K. pneumoniae WGLW5 (mucoid parent; BEI HM-749) and the murine E. coli
strain were previously cultured from stool of BALB/c T-bet-/- x Rag2-/- (TRUC) mice
(127). MUC1, NMV1, NMV2, NMV3, and NMV4 are WGLW5 derivatives isolated
from stool after a 4-week passage of WGLW5 through a GF mouse. K. pneumoniae
strains used in competition with E. coli were isolated after 1.5-week passage of WGLW5
through a GF mouse. K. pneumoniae WGLW2 (BEI HM-751) and WGLW3 (BEI HM-
748) are clinical isolates cultured from human sputum and stool respectively. Bacteria
were cultured in Luria-Bertani (LB) broth shaking aerobically at 37°C overnight or on
MacConkey agar. Growth curves (Fig. 2c) were conducted in 6 mL LB with overnight
bacteria diluted 1:500.
ASF strains- Clostridium sp. (ASF356), Lactobacillus sp. (ASF360),
Lactobacillus murinus (ASF361), Mucispirillum schaedleri (ASF457), Eubacterium
plexicaudatum (ASF492), Firmicutes bacterium (ASF500), Clostridium sp. (ASF502),
and Parabacteroides sp. (ASF519) were obtained from Iowa State University (214).
Animal husbandry
SPF mice were housed in microisolator cages in the Harvard T. H. Chan School
of Public Health barrier facility. Mouse studies were approved and carried out in
accordance with Harvard Medical School’s (HMS) Standing Committee on Animals and
the N.I.H. guidelines for animal use and care. GF and gnotobiotic mice were bred and
maintained under sterile conditions in gnotobiotic isolators at Children’s Hospital Boston.

96
Female and male BALB/c mice aged 6-12 weeks were used for GF, gnotobiotic, and SPF
experiments unless noted. Mice were bred in house unless noted.
Culture-based studies of fecal and mucosal K. pneumoniae populations
GF and gnotobiotic-ASF mice we orally inoculated with ~1x10⁸ K. pneumoniae
suspended in PBS (or 50 µl of feces resuspended in PBS). An equal amount was spread
on their fur and anus. At indicated time points, stool was collected from individual mice
and serially diluted 10-fold using sterile PBS onto MacConkey agar for K. pneumoniae
culturable counts after 24 h at 37° C. Colonies were counted on plates with bacterial
densities of 30-300 CFU. Log10 CFU/ g stool bacteria were calculated after accounting
for dry and wet fecal weights. Mucoid and NMV populations are presented as
percentages of total K. pneumoniae CFU.
For the stool desiccation study, pellets were collected from individual mice and
half of each sample was plated for CFU enumeration after weight measurements. The
remaining stool sample was allowed to dry for 24 hours at room temperature. Following
this desiccation period, samples were weighed and serial diluted onto MacConkey agar
for the final CFU count.
SPF pup inoculation
Beginning on the day of birth, SPF BALB/c pups (Charles River) were sprinkled
with 1.5 x 10⁸ CFU K. pneumoniae in PBS daily for 7 days. 3-weeks after the final K.
pneumoniae inoculation, stool was assessed for culturable counts of K. pneumoniae and
E. coli. Individual colonies were re-streaked onto Tryptic Soy Agar (TSA) for 18 h at
37°C and screened for indole production (BD DMACA Indole reagent). Indole (-) K.
pneumoniae stained pink; indole (+) E. coli stained blue.

97
Gnotobiotic DSS colitis model
ASF-TRUC mice were associated with K. pneumoniae WGLW5 for 4 weeks.
Stool was collected and plated for culturable K. pneumoniae counts on MacConkey agar.
Drinking water was amended with 1.5% or 3% DSS (Affymetrix), filter sterilized. After 8
days on DSS, stool was plated and mice were sacrificed. Colons were harvested and
processed for histology.
In a second experiment, ASF-TRUC mice were administered 3% DSS in drinking
water for 5 days, followed by colonization with K. pneumoniae WGLW5. Counts of fecal
K. pneumoniae were collected for 8 days following colonization. 3% DSS continued for
full length of experiment
Histology
At the time of sacrifice, colons were harvested, colonic contents were removed,
and tissues were fixed in a solution of PBS with 4% paraformaldehyde. Tissue was
paraffin embedded, sectioned into 0.5 um thick sections and stained with hematoxylin
and eosin. Blinded slides were scored by Dr. Jonathan Glickman. Colitis scores were
assigned based on the cumulative sum of four criteria with a severity ranking between 0-
4: mononuclear cell infiltration, polymorphonuclear cell infiltration, epithelial crypt
hyperplasia, and epithelial injury. 0-absent, 1-mild, 2-moderate, 3-severe as described
previously (166).
Glucuronic acid measurement
K. pneumoniae CPS production was assessed by measuring the glucuronic acid
content (215, 216) of extracted bacterial CPS (217). 100 µl of 1% Zwittergent 3-14
(Sigma) in 100 mM citric acid was added to 500 µl of a washed overnight K. pneumoniae

98
culture re-suspended in PBS or to a PBS solution containing an overnight K. pneumoniae
colony from agar. Following incubation for 30 min at 50° C and centrifugation, 250 µl
supernatant was added to 1 mL ethanol. After precipitation at 4° C for 30 min, samples
were spun, supernatants were removed, pellets were dried for 20 min on ice, and capsular
material was resuspended in 200 µl H2O. Glucuronic acid was measured by adding 1.2
mL 12.5 mm tetraborate in concentrated H2SO4 to 200 µl aliquots of D-glucuronic acid
standards (Sigma) and extracted K. pneumoniae CPS. Samples were heated at 70° C for 5
min. 20 µl of a 0.15% 3-phenylphenol (Sigma) in 0.5% NaOH were added to cooled
tubes. Samples were vortexed, and 520nm absorbances were recorded after 10 min. CPS
concentrations were reported as fg glucuronic acid per CFU based on initial culture
concentrations.
K. pneumoniae genomic analyses
CPS gene clusters for WGLW2, 3, and 5 were defined by BLAST comparisons of
genes in the known vicinity of CPS clusters using whole-genome sequences (WGSs)
generated by the Klebsiella group Sequencing Project, Broad Institute of Harvard and
MIT.
MiSeq WGSs of MUCparent, MUC1, NMV1, NMV2, NMV3, and NMV4 were
generated by the HMS Biopolymers Core. Burrows-Wheeler Aligner (BWA) was used to
align variant reads to the WGLW5 reference genome. SNPs were identified using
Samtools (http://samtools.sourceforge.net). Raw sequence reads have been deposited in
NCBI’s SRA. Table 3.3 lists accession IDs.

99
Table 3.3. K. pneumoniae whole-genome sequence submissions.
Isolate Source Capsule
Phenotype
WGS Sequence
Data Database Accession
WGLW2 human sputum mucoid assembled and annotated
NCBI GenBank GCA_000300675.1
WGLW3 human stool mucoid assembled and annotated
NCBI GenBank GCA_000300935.1
WGLW5 murine stool mucoid assembled and annotated
NCBI GenBank GCA_000300955.1
MUC parent passaged WGLW5 mucoid raw .fastq reads
NCBI SRA SRR1743357
MUC 1 MUC parent derivative after passage through
GF mouse mucoid raw .fastq
reads NCBI SRA SRR1743361
MUC 1 resequenced
MUC parent derivative after passage through
GF mouse mucoid raw .fastq
reads NCBI SRA SRR1743377
NMV 1 MUC parent derivative after passage through
GF mouse
non-mucoid
raw .fastq reads
NCBI SRA SRR1743362
NMV 2 MUC parent derivative after passage through
GF mouse
non-mucoid
raw .fastq reads
NCBI SRA SRR1743364
NMV 3 MUC parent derivative after passage through
GF mouse
non-mucoid
raw .fastq reads
NCBI SRA SRR1743365
NMV 4 MUC parent derivative after passage through
GF mouse
non-mucoid
raw .fastq reads
NCBI SRA SRR1743366
NMV 4 resequenced
MUC parent derivative after passage through
GF mouse
non-mucoid
raw .fastq reads
NCBI SRA SRR1743379
Assembly and annotation of strains
150 bp paired-end Illumina reads from each strain (Parent, MUC1, NMV1, NMV2,
NMV3, and NMV4) were assembled with SPAdes assembler v 3-5-0 (218). Scaffolds for
each strain were annotated with Prokka (187), using the flag “–kingdom Bacteria.” All
scaffolds, gene annotations, and code are available for download at
http://huttenhower.sph.harvard.edu/klebsiella2015/

100
Ordering of scaffolds
The WGLW5 reference genome (GenBank; GCF_000300955.1) contains 10
scaffolds. To determine their putative placement, we used Contiguator (219) to align
them to chromosome 1 of the completed genome K. pneumoniae strain MGH78578
(gi|150953431|gb|CP000647.1). In this manner, we partitioned the scaffolds of the
WGLW5 genome into four ordered genomic scaffolds and six plasmids (lengths 337582,
139159, 40758, 26040, 24319, and 4470 bp). We used this ordered WGLW5 scaffold
created by Contiguator as a reference to order the scaffolds of all other assemblies, then
used ProgressiveMauve (180) to assess genomic rearrangement on chromosome 1.
Determination of assembly gaps
For each assembly, bowtie2 (220) was used to align reads to chromosome 1 of the
reference genome WGLW5. Bedtools (221) was used to calculate coverage for each
alignment, as detailed in the script “bed.sh”. The resulting tracks were visualized with
Integrative Genome Viewer (7).
Conservation of genomic content
In order to assess whether gene content was conserved between strains, for each
gene, we used bowtie2 (220) to align reads from each strain. We then calculated median
coverage across all bases for each gene using bedtools (222). We removed low-coverage
outlier genes, defined as ( coverage < (25th percentile - (2 * interquartile range))) for
each genome. !

101
TRUC E. coli genomic analyses
The TRUC E. coli genome was sequenced on an Illumina MiSeq by the
Biopolymers Core of Harvard Medical School. Adapter trimming was performed with
Trimmomatic (223). Low quality bases were removed with a trailing score of 20 and a
sliding window of 20. Velvet (186) was used for genome assembly with a Kmer of 85
and minmum contig length of 200 base pairs, and PROKKA (187) was used for genome
annotation.
Comparison of the TRUC E. coli genome to three additional gastrointestinal E.
coli isolates was undertaken using Progressive Mauve (180). The BLAST Ring Image
Generator (BRIG) (192) confirmed genomic relationships between TRUC E. coli and 8
additional E. coli isolates.
Island Viewer (193) identified genes predicted to fall on genomic islands, and
BLAST was used to more fully define and annotate the T6SS loci of TRUC E. coli.
K. pneumoniae survival assays
Altered pH and bile acid
Overnight cultures of K. pneumoniae were washed in PBS and re-suspended in an
equal volume of LB pH 3.0 (amended with hydrochloric acid) or LB with 2% Difco Bile
Salts No. 3 (BD). Surviving CFU were enumerated after shaking at 37°C for 2 h.
Percentage survival compared to initial bacterial concentrations.
Human and mouse α-defensins
Overnight K. pneumoniae cultures were diluted 20x into fresh LB and incubated
at 37°C for 1 h with shaking. Cultures were diluted to OD600 0.5 with 10 mM PIPES and

102
1% tryptic soy broth (PIPES-TSB). Bacteria were washed 2x and resuspended in 1 mL
PIPES-TSB. After a 1:10 dilution in PIPES-TSB, 25 µl bacteria were mixed with 7.5 µM
HNP1 (Abcam), HD5 (Hycult Biotech), or Crp23 (purified by reverse-phase high-
pressure liquid chromatography from oxidative refolding of partially purified linear
peptides (224)). Samples were incubated at 37°C for 2 h with shaking before CFU
enumeration. Percentage relative survival in comparison to untreated bacterial samples.
E. coli competition killing
Competition assays were performed as previously described (211). Briefly,
overnight cultures of E. coli and K. pneumoniae were washed and diluted 100x into LB.
After 2.5 h at 37°C with shaking (OD600 of ~0.8), bacteria were centrifuged at 10,000 X
g and resuspended to an OD600 of ~10. K. pneumoniae and E. coli were mixed 1:1, 5 µl
were spotted onto LB agar, and plates were incubated at 37°C for 2 h. Agar spots were
resuspended in 1 mL PBS. CFU were enumerated on MacConkey agar. Percent relative
survival in comparison to K. pneumoniae spotted in the absence of E. coli.
Biogeography of K. pneumoniae in the gastrointestinal tract
The Gastrointestinal tracts of gnotobiotic mice associated with K. pneumoniae
WGLW5 for 4-weeks were divided into 7 sections: equal thirds of the small intestine
representing the proximal, middle, and distal small intestine; the cecum; and equal thirds
of the colon representing the proximal, middle, and distal colon. Luminal contents and
host tissue were taken at each site for K. pneumoniae counts and RNA extraction (tissues
preserved in RNAlater, Ambion). A PBS wash removed residual luminal content from
tissue samples. Luminal and washed mucosal samples were homogenized in PBS and
plated for enumeration.

103
Real-time (RT)-qPCR
Tissue in RNAlater was washed with PBS prior to physical homogenization in
Qiazol. RNA was extracted (Qiagan RNeasy Mini Kit), DNase treated, and reverse
transcribed into cDNA (Bio-Rad iScript cDNA Synthesis Kit). RT-qPCR was performed
using the SYBR FAST Universal qPCR Kit (KAPA Biosystems). Gene expression was
normalized to β–actin expression. Primer sequences are shown in Table 3.4.
!
Table 3.4. Primer sequences used in RT-qPCR expression studies. Primer Sequence 5’-3’
ActB 987 (forward)1 TACCACCATGTACCCAGGCA ActB 1083 (reverse)
{Martinon:2010kt} CTCAGGAGGAGCAATGATCTTGAT
Cryptdina (forward)!{Hashimoto:2012bx}
TCCTCCTCTCTGCCCTYGTCCTG
Cryptdina (reverse)!{Hashimoto:2012bx}
CTCTTCTCCTGGCTGCTCCTC
LYZ1 (forward)!{Hashimoto:2012bx}
GCCAAGGTCTACAATCGTTGTGAGTTG
LYZ1 (reverse)!{Hashimoto:2012bx}
CAGTCAGCCAGCTTGACACCACG
mBD3 (forward)!{RivasSantiago:2006fd}
TCTGTTTGCATTTCTCCTGGTG
mBD3 (reverse)
{RivasSantiago:2006fd} TAAACTTCCAACAGCTGGAGTGG
a These primers are labeled DEFA1!(225); however, because they recognize many Crp isoforms, we consider them a general measure of Crp expression.
Small intestinal organoid production, maintenance, and microinjection
Organoids from WT and Mmp7-/- mice, both on a C57BL/6NHsd background
(224), were cultured in growth factor reduced Matrigel (BD Biosciences) and Complete
Crypt Culture Medium (CCCM) and microinjected as previously described (197). 3 days
prior to microinjection, organoids were subcultured, deposited in 30 µl Matrigel on glass
coverslips in 12-well tissue culture dishes, and overlaid with 1 mL CCCM without

104
antibiotics. On the day of the experiment, overnight cultures in LB were diluted 1:20 to a
final volume of 10 mL in LB. After 1 h at 37°C with shaking, 1 mL was washed 2x and
resuspended in 100 µl of PBS. One needle was used to microinject 20 organoids of each
genotype, which comprised a single sample. Each organoid received ~5x10² CFU.
Samples were incubated in CCCM without antibiotics for 1 h, followed by 1 h with 100
µg/mL gentamicin. Organoids were washed 2x with Advanced DMEM/F12 and grown in
CCCM without antibiotics. At 9 h post-injection, organoids were removed from Matrigel
using Cell Dissociation Solution (BD Biosciences) at 4° C for 30 min, pelleted at 300 x g
for 5 min, and resuspended in 100 µl sterile water for 5 min to lyse eukaryotic cells.
Samples were vortexed for 15 sec before serial dilution onto LB agar. Relative survival
as a percentage of CFU recovered from WT organoids divided by Mmp7-/- organoids.
Statistical Analyses
Statistical calculations were performed using GraphPad Prism® software. Utilized
tests include Mann-Whitney, one-way ANOVA with Dunnett’s post-test, two-way
ANOVA with Bonferroni post-tests, and Spearman correlation.

105
CHAPTER 4 !
CONCLUSIONS AND FUTURE DIRECTIONS !

106
I. CONCLUSIONS
Klebsiella pneumoniae is a clinically important bacterium that causes many
infections in susceptible patients and is a growing cause for concern for patients and
infectious disease specialists because of its ever-increasing antibiotic resistance. One of
the reasons K. pneumoniae can spread so quickly in hospital and community settings is
because this bacterium can be carried as part of the gastrointestinal microbiota of healthy
individuals. This thesis explores K. pneumoniae in the setting of its principal reservoir for
human disease- the gastrointestinal tract.
Expanding on previous work with murine-derived K. pneumoniae (127), we find
that human clinical isolates are also able to drive colonic inflammation in mice regardless
of their original organ of isolation. Although all isolates could drive inflammation, only
WGLW5, an isolate of mouse origin, was able to move beyond the gastrointestinal tract,
as reflected by presence of this bacterium in mesenteric lymph nodes. Through
gnotobiotic associations we also observed a previously unidentified sexual dimorphism in
colitis severity in the Tbet-/- Rag2-/- mouse model of ulcerative colitis. Colitis was found
to be more severe in male mice.
Many virulent K. pneumoniae isolates possess a mucoid capsule. This thesis
assesses the importance of capsule for K. pneumoniae survival in the gastrointestinal
tract. Our data suggest that Paneth cell antimicrobial peptides exert selective pressure that
favors mucoid K. pneumoniae populations. In addition to defining host factors that
influence K. pneumoniae populations, this study reveals that K. pneumoniae’s capsule
provides it with a competitive advantage against other bacteria in the gastrointestinal
107
tract, providing compelling evidence for biological relevance of capsule beyond
traditional virulence functions.
II. LIMITATIONS AND FUTURE DIRECTIONS
Small panel of K. pneumoniae isolates
One limitation of these studies is the small panel of K. pneumoniae isolates tested
(Chapter 2). Ideally, comparative genomic approaches should reveal genome signatures
of virulence depending on host adaptation and original site of K. pneumoniae isolation.
However, with only 1 murine isolate, it is difficult to draw conclusions about gene
selection specific to host species. Additionally, since our isolates were taken from diverse
tissue sites, we could not relate auxiliary genome content to selection for specific
environments (eg. colon vs. nasopharynx vs. urinary tract). This issue was further
complicated by the finding the K. pneumoniae WGLW5, taken from murine stool, is
more genetically similar to the human sputum isolate than the human stool isolate. Future
studies would benefit from inclusions of larger pool of K. pneumoniae isolates collected
from different hospitals and diverse organ sites.
Minimal microbial community necessary for K. pneumoniae driven inflammation
Another limitation of this work lies in the inability to define the minimal
microbial community necessary for K. pneumoniae to drive colonic inflammation
(Chapter 2). As addressed previously, the ASF likely represents too minimal of a
gnotobiotic microbial community to recapitulate the results of feeding K. pneumoniae to
SPF mice. This could be due to lack of essential interactions between K. pneumoniae and
108
other bacteria in the microbiome, or due to a deficiency in immune development and
response driven by gnotobiotic communities.
Moving forward, several approaches could be utilized to further define microbial
community requirements for K. pneumoniae driven disease. Continuing to leverage
gnotobiotics, individual bacterial species can be added to the ASF. Taking inspiration
from Andrew Goodman’s consortium (74) and from a lack of Bacteroidetes in the ASF,
Bacteroides thetaiotamicron and Bacteroides vulgatus represent promising initial
candidates. Observations from this thesis suggest that K. pneumoniae interacts with
closely related species of Proteobacteria in the gastrointestinal tract (Figure 2.3C,
Figure 3.6D, E). For this reason, inclusion of another Proteobacteria, such as E. coli, to
gnotobiotic ASF mice may change K. pneumoniae’s behavior in the gastrointestinal tract
in a way that promotes inflammation of host tissue.
Conversely, instead of building a microbiota from scratch in gnotobiotic mice, a
full microbiota can be systematically depleted of bacterial groups with antibiotics in vivo.
After identifying differential combinations of antibiotics that allow or prevent K.
pneumoniae associated colonic inflammation, 16S rRNA amplicon sequencing of DNA
from stool will help identify necessary strains.
Method of CPS variation
A significant limitation of the work presented in Chapter 3 is an incomplete
understanding of the nature of capsule loss in NMVs of K. pneumoniae. While stability of
the NMV phenotype both in vitro and in vivo argues for a genetic basis of decreased
capsule production, comparison of genome sequences in a SNP analysis, gene presence
and absence screen, and an assessment of genome rearrangements did not reveal any

109
shared or likely mechanisms that could explain the NMV phenotype. Given that NMVs
appear gradually over time in gnotobiotic mice and that the NMV phenotype manifests in
heterogeneous colony morphology, one interpretation of our results is that there are likely
many genomic events that could lead to capsule loss. If each of the 4 NMV isolates is
producing less capsule due to independent mutations, our approach of using comparative
genomics and looking for shared genome changes will not provide answers. While we
attempted to account for this by expanding our analysis to search for mutations in shared
functional pathways, this was not an exhaustive strategy.
Another interpretation of our findings is that the NMV phenotype is driven by
changes in gene expression rather than gene loss or mutation. While stability of the NMV
phenotype seems to argue against phase variation or expression changes, it is possible
that with complex regulation we have not been able to mimic the environment necessary
to induce capsule re-expression in CPS variants. Several experimental procedures could
be attempted in the future to assess the contribution of gene expression to capsule loss in
NMV K. pneumoniae.
RNAseq could be used on capsule variants to measure differential gene
expression and look for commonalities among NMV variants. A caveat to this approach
is that the regulatory network involved in capsule production for K. pneumoniae is not
fully worked out. While well studied transcription factors such as rmpA and rmpA2 are
known to increase capsule expression, most K. pneumoniae isolates do not carry the
plasmids containing these regulatory elements and, yet, still maintain high CPS
expression (101). Coupled with the heterogeneity of the NMV phenotype and possibility

110
of several mechanisms contributing to CPS loss, RNAseq results have the potential to be
difficult to interpret.
In order to assess epigenetic control of capsule production in NMV K.
pneumoniae, the methylation status of the genome could also be addressed. Sequencing
with the Pacific Bioscience (PacBio) SMRT sequencing technology can identify modified
pieces of bacterial DNA (226). PacBio sequencing reveals carbon-5-methylated
cytosines, nitrogen-6-mehtylated adenines, and nitrogen-4-methylated cytosines (227).
Methylation has been shown to be involved in the regulation of pili expression in E. coli
(228), LPS expression in Legionella pneumophila (229), and could represent an as yet
unidentified regulatory mechanism for CPS expression in K. pneumoniae.
An important control to use in studies of K. pneumoniae CPS moving forward is
an isogenic isolate with CPS deficiency resulting from a defined mutation. Deletion of
highly conserved genes in the CPS gene cluster, such as gnd or galF, using the lambda
Red recombination system (230) may generate such a strain.
Paneth cell deficient mice
In Chapter 3, we use small intestinal organoids from mice that either lack or
produce mature cryptdins to show that MUC K. pneumoniae has a growth advantage in
the presence of physiological concentrations of host antimicrobial peptides. While a
better experimental system than in vitro killing assays, organoids do not fully replicate
the conditions that K. pneumoniae would be experiencing in a live animal. Future
experiments would benefit from the use of gnotobiotic mouse models with Paneth cell
AMP deficiencies. These models include both the Mmp7-/- mice (198) that were used for
organoid generation in Chapter 3 and ATG16L1HM mice. These mice are hypomorphic
111
for a Crohn’s disease susceptibility risk allele and have been shown to be deficient in
Paneth cell release of AMPs (14). If capsule is truly protective against host AMPs, in an
absence of functional Paneth cells NMV K. pneumoniae would be expected to fully
overtake MUC K. pneumoniae in the small intestine of GF or gnotobiotic ASF mice.
Summary
This thesis explores the relationship between the capsule of K. pneumoniae, other
bacteria, and the host throughout the gastrointestinal tract. We implicate capsule in
protecting K. pneumoniae from direct killing by antimicrobial peptides produced by
Paneth cells in the small intestine and from killing by E. coli. Studies diving deeper into
the mechanism of antagonism between K. pneumoniae and E. coli will further define the
importance of capsule in interactions between bacteria. Given the clinical burden of K.
pneumoniae, complete knowledge of this bacterium’s colonization factors could aide in
novel preventative and therapeutic approaches to eliminate K. pneumoniae from the
gastrointestinal tract of carriers.
112
APPENDIX I
SUPPLEMENTARY MATERIALS !
!
!
!
!
!
!
!
!
!
!
!
!
!
!

113
!Supplemental Figure 3.1. Reduced glucuronic acid content of NMV K. pneumoniae isolates. Membrane fractions were isolated from overnight mucoid (MUC) and NMV variants in liquid LB culture and assessed for glucuronic acid concentration via acid hydrolysis. Bars represent mean ± SD of 3 biological replicates. ***, P ≤ 0.001, one-way ANOVA with Dunnett’s post-test. !
!
0
50
10
15
20
25
30
glucuronic acid (fg/CFU) *** *** *** *** NS
MUC parent MUC 1 NMV 1 NMV 2 NMV 3 NMV 4

114
!Supplemental Figure 3.2. Comparative genomic analyses of K. pneumoniae variants. (A) ProgressiveMauve alignments of the scaffolds of K. pneumoniae variants MUC1, NMV1, NMV2, NMV3, NMV4, and Parent. (B) The distribution of gaps in chromosome 1 of the genomes of K. pneumoniae variants MUC1, NMV1, NMV2, NMV3, NMV4, and Parent, relative to WGLW5 reference genome.
A""
!!!B""
"
MUC1
NMV1
NMV2
NMV3
NMV4
Parent

115
Supplemental Figure 3.3. Growth curve of K. pneumoniae variants in LB broth. Overnight cultures diluted 1:500 into 6mL fresh LB and grown shaking at 37°C. Aliquots serial diluted onto MacConkey agar for CFU counts every hour for 8 hours.
0 1 2 3 4 5 6 7 81.0×1006
1.0×1007
1.0×1008
1.0×1009
1.0×10¹⁰
MUC parentMUC 1NMV 1NMV 2NMV 3NMV 4
hrs in LB
log 1
0 C
FU/m
L

116
Supplemental Figure 3.4. Biogeography of K. pneumoniae and host AMP expression throughout the gastrointestinal tract. (A) Experimental schema for biogeography assessments. At 7 samples sites along the gastrointestinal tract of ASF mice, luminal contents and mucosal tissue were harvested for K. pneumoniae CFU counts and host tissue expression studies. (B) β-defensin3 expression throughout the gastrointestinal tract of n=6 mice.
SI proximal
SI mid
SI distal
cecum
colon proximal
colon mid
colon distal
SI proximal
SI distal
cecum
colon proximal
colon mid
colon distal
A
0.00000
0.00002
0.00004
0.00006
0.00008
(2^-CT)
B
SI Colon
p m d c p m d
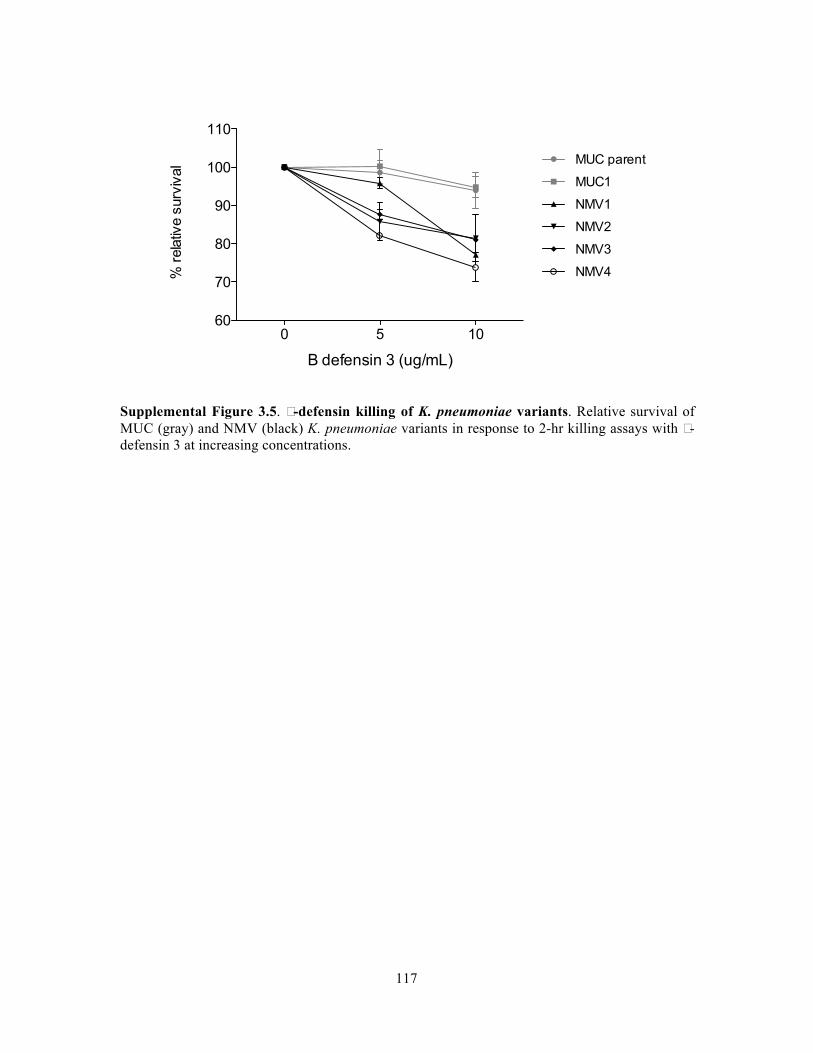
117
Supplemental Figure 3.5. β-defensin killing of K. pneumoniae variants. Relative survival of MUC (gray) and NMV (black) K. pneumoniae variants in response to 2-hr killing assays with β-defensin 3 at increasing concentrations.
0 5 1060
70
80
90
100
110
MUC parent
MUC1
NMV1
NMV2
NMV3
NMV4
B defensin 3 (ug/mL)
% re
lativ
e su
rviv
al

118
Supplemental Table 3.1. Average log10CFU/g stool and SD of K. pneumoniae in stool from gnotobiotic and specified pathogen free associations.
Microbiota
collection time point
(weeks)
corrected log10CFU/g
stool K. pneumoniae WGLW5 8 8.9 ± 0.1
ASF + K. pneumoniae WGLW5 8 7.6 ± 0.5 ASF + K. pneumoniae WGLW5 + SPF stool 8 6.3 ± 0.6
SPF + K. pneumoniae WGLW5 sprinkling 4 4.4 ± 0.5 SPF + K. pneumoniae MUC1 sprinkling 4 4.7 ± 0.7
ASF + K. pneumoniae WGLW2 8 7.6 ± 0.9 ASF + K. pneumoniae WGLW3 8 8.5 ± 0.05
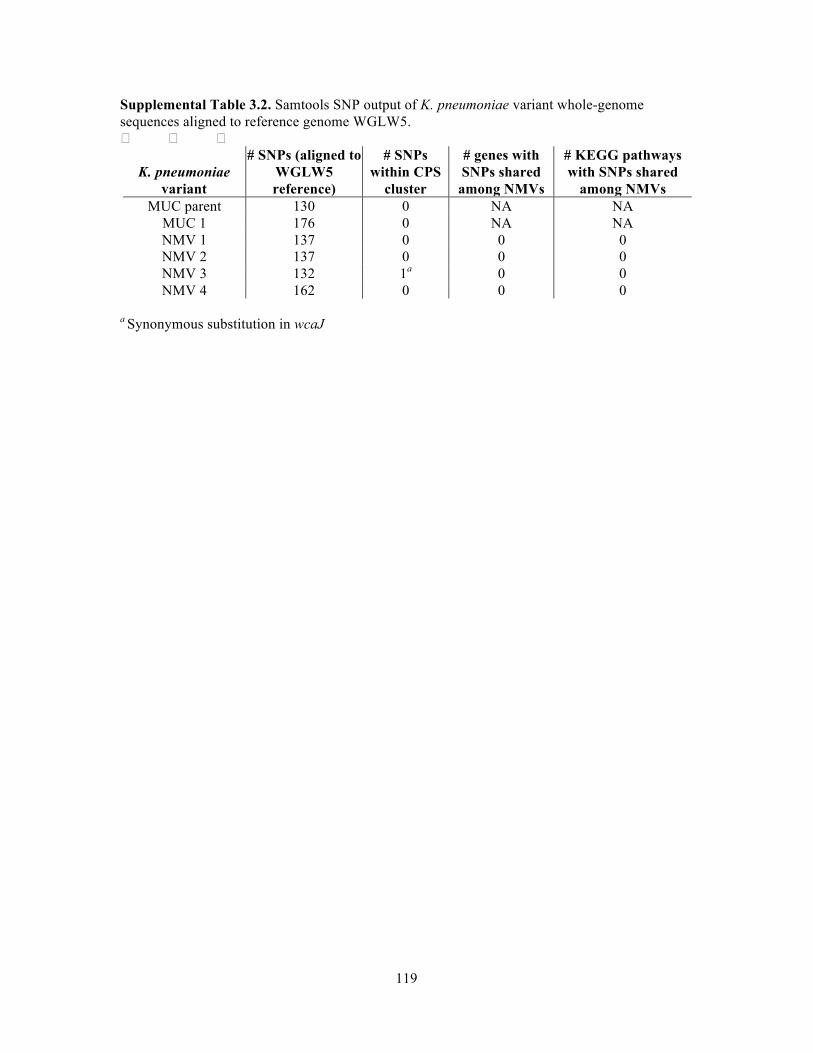
119
Supplemental Table 3.2. Samtools SNP output of K. pneumoniae variant whole-genome sequences aligned to reference genome WGLW5. ! ! !
K. pneumoniae
variant
# SNPs (aligned to WGLW5 reference)
# SNPs within CPS
cluster
# genes with SNPs shared
among NMVs
# KEGG pathways with SNPs shared
among NMVs MUC parent 130 0 NA NA
MUC 1 176 0 NA NA NMV 1 137 0 0 0 NMV 2 137 0 0 0 NMV 3 132 1a 0 0 NMV 4 162 0 0 0
a Synonymous substitution in wcaJ

120
Supplemental Table 3.3. Gene coverage similarity between K. pneumoniae variants. Each column represents one variant. Each row shows the number of genes in the column variant that are not found in the genome of the row variant. !
PARENT (5316 genes)
MUC1 (5366 genes)
NMV1 (5308 genes)
NMV2 (5388 genes)
NMV3 (5310 genes)
NMV4 (5267 genes)
notPARENT 0 14 14 25 14 13 notMUC1 0 0 4 11 4 2 notNMV1 20 28 0 31 22 22 notNMV2 2 2 2 0 2 0 notNMV3 12 14 14 21 0 15 notNMV4 54 58 57 65 60 0

121
REFERENCES 1. Venema K. 2010. Role of gut microbiota in the control of energy and carbohydrate
metabolism. Curr Opin Clin Nutr Metab Care 13:432–438.
2. Maranduba CMDC, De Castro SBR, de Souza GT, Rossato C, da Guia FC, Valente MAS, Rettore JVP, Maranduba CP, de Souza CM, do Carmo AMR, Macedo GC, Silva F de S. 2015. Intestinal microbiota as modulators of the immune system and neuroimmune system: impact on the host health and homeostasis. J Immunol Res 2015:931574–14.
3. Frank DN, Pace NR. 2008. Gastrointestinal microbiology enters the metagenomics era. Curr Opin Gastroenterol 24:4–10.
4. Turnbaugh PJ, Hamady M, Yatsunenko T, Cantarel BL, Duncan A, Ley RE, Sogin ML, Jones WJ, Roe BA, Affourtit JP, Egholm M, Henrissat B, Heath AC, Knight R, Gordon JI. 2009. A core gut microbiome in obese and lean twins. Nature 457:480–484.
5. Qin J, Li R, Raes J, Arumugam M, Burgdorf KS, Manichanh C, Nielsen T, Pons N, Levenez F, Yamada T, Mende DR, Li J, Xu J, Li S, Li D, Cao J, Wang B, Liang H, Zheng H, Xie Y, Tap J, Lepage P, Bertalan M, Batto J-M, Hansen T, Le Paslier D, Linneberg A, Nielsen HB, Pelletier E, Renault P, Sicheritz-Ponten T, Turner K, Zhu H, Yu C, Li S, Jian M, Zhou Y, Li Y, Zhang X, Li S, Qin N, Yang H, Wang J, Brunak S, Doré J, Guarner F, Kristiansen K, Pedersen O, Parkhill J, Weissenbach J, MetaHIT Consortium, Bork P, Ehrlich SD, Wang J. 2010. A human gut microbial gene catalogue established by metagenomic sequencing. Nature 464:59–65.
6. Wen L, Ley RE, Volchkov PY, Stranges PB, Avanesyan L, Stonebraker AC, Hu C, Wong FS, Szot GL, Bluestone JA, Gordon JI, Chervonsky AV. 2008. Innate immunity and intestinal microbiota in the development of Type 1 diabetes. Nature 455:1109–1113.
7. Vijay-Kumar M, Aitken JD, Carvalho FA, Cullender TC, Mwangi S, Srinivasan S, Sitaraman SV, Knight R, Ley RE, Gewirtz AT. 2010. Metabolic syndrome and altered gut microbiota in mice lacking Toll-like receptor 5. Science 328:228–231.
8. Barker N. 2014. Adult intestinal stem cells: critical drivers of epithelial homeostasis and regeneration. Nat Rev Mol Cell Biol 15:19–33.
9. Turner JR. 2009. Intestinal mucosal barrier function in health and disease. Nat Rev Immunol 9:799–809.
10. Karlsson J, Pütsep K, Chu H, Kays RJ, Bevins CL, Andersson M. 2008. Regional variations in Paneth cell antimicrobial peptide expression along the mouse intestinal tract. BMC Immunol 9:37.
11. Salzman NH. 2010. Paneth cell defensins and the regulation of the microbiome: détente at mucosal surfaces. Gut Microbes 1:401–406.

122
12. Salzman NH, Underwood MA, Bevins CL. 2007. Paneth cells, defensins, and the commensal microbiota: a hypothesis on intimate interplay at the intestinal mucosa. Seminars in Immunology 19:70–83.
13. Clevers HC, Bevins CL. 2013. Paneth Cells: Maestros of the Small Intestinal Crypts. Annu Rev Physiol 75:289–311.
14. Cadwell K, Liu JY, Brown SL, Miyoshi H, Loh J, Lennerz JK, Kishi C, Kc W, Carrero JA, Hunt S, Stone CD, Brunt EM, Xavier RJ, Sleckman BP, Li E, Mizushima N, Stappenbeck TS, Virgin HW IV. 2008. A key role for autophagy and the autophagy gene Atg16l1 in mouse and human intestinal Paneth cells. Nature 456:259–263.
15. Wu WM, Yang YS, Peng LH. 2014. Microbiota in the stomach: new insights. J Dig Dis 15:54–61.
16. Stearns JC, Lynch MDJ, Senadheera DB, Tenenbaum HC, Goldberg MB, Cvitkovitch DG, Croitoru K, Moreno-Hagelsieb G, Neufeld JD. 2011. Bacterial biogeography of the human digestive tract. Sci Rep 1:170.
17. Salzman NH. 2011. Microbiota-immune system interaction: an uneasy alliance. Curr Opin Microbiol 14:99–105.
18. Maltby R, Leatham-Jensen MP, Gibson T, Cohen PS, Conway T. 2013. Nutritional basis for colonization resistance by human commensal Escherichia coli strains HS and Nissle 1917 against E. coli O157:H7 in the mouse intestine. PLoS ONE 8:e53957.
19. Lawley TD, Walker AW. 2013. Intestinal colonization resistance. Immunology 138:1–11.
20. Hertzberger R, Arents J, Dekker HL, Pridmore RD, Gysler C, Kleerebezem M, de Mattos MJT. 2014. H(2)O(2) production in species of the Lactobacillus acidophilus group: a central role for a novel NADH-dependent flavin reductase. Applied and Environmental Microbiology 80:2229–2239.
21. Cotter PD, Ross RP, Hill C. 2013. Bacteriocins, a viable alternative to antibiotics? Nat Rev Micro 11:95–105.
22. Stecher B, Chaffron S, Käppeli R, Hapfelmeier S, Freedrich S, Weber TC, Kirundi J, Suar M, McCoy KD, Mering von C, Macpherson AJ, Hardt W-D. 2010. Like will to like: abundances of closely related species can predict susceptibility to intestinal colonization by pathogenic and commensal bacteria. PLoS Pathog 6:e1000711.
23. Cash HL, Whitham CV, Behrendt CL, Hooper LV. 2006. Symbiotic bacteria direct expression of an intestinal bactericidal lectin. Science 313:1126–1130.
24. Endt K, Stecher B, Chaffron S, Slack E, Tchitchek N, Benecke A, Van Maele L, Sirard J-C, Mueller AJ, Heikenwalder M, Macpherson AJ, Strugnell R, Mering von C, Hardt W-D. 2010. The microbiota mediates pathogen clearance from the gut lumen after non-typhoidal Salmonella diarrhea. PLoS Pathog 6:e1001097.
25. Macpherson AJ, Harris NL. 2004. Interactions between commensal intestinal bacteria and the immune system. Nat Rev Immunol 4:478–485.

123
26. Round JL, Mazmanian SK. 2009. The gut microbiota shapes intestinal immune responses during health and disease. Nat Rev Immunol 9:313–323.
27. Mazmanian SK, Round JL, Kasper DL. 2008. A microbial symbiosis factor prevents intestinal inflammatory disease. Nature 453:620–625.
28. Ochoa-Repáraz J, Mielcarz DW, Wang Y, Begum-Haque S, Dasgupta S, Kasper DL, Kasper LH. 2010. A polysaccharide from the human commensal Bacteroides fragilis protects against CNS demyelinating disease. Mucosal Immunol 3:487–495.
29. Korn T, Bettelli E, Oukka M, Kuchroo VK. 2009. IL-17 and Th17 Cells. Annu Rev Immunol 27:485–517.
30. Ivanov II, Atarashi K, Manel N, Brodie EL, Shima T, Karaoz U, Wei D, Goldfarb KC, Santee CA, Lynch SV, Tanoue T, Imaoka A, Itoh K, Takeda K, Umesaki Y, Honda K, Littman DR. 2009. Induction of intestinal Th17 cells by segmented filamentous bacteria. Cell 139:485–498.
31. Kinnebrew MA, Ubeda C, Zenewicz LA, Smith N, Flavell RA, Pamer EG. 2010. Bacterial flagellin stimulates Toll-like receptor 5-dependent defense against vancomycin-resistant Enterococcus infection. J Infect Dis 201:534–543.
32. Clarke TB, Davis KM, Lysenko ES, Zhou AY, Yu Y, Weiser JN. 2010. Recognition of peptidoglycan from the microbiota by Nod1 enhances systemic innate immunity. Nat Med 16:228–231.
33. Dethlefsen L, Huse S, Sogin ML, Relman DA. 2008. The pervasive effects of an antibiotic on the human gut microbiota, as revealed by deep 16S rRNA sequencing. PLoS Biol 6:e280.
34. Sekirov I, Tam NM, Jogova M, Robertson ML, Li Y, Lupp C, Finlay BB. 2008. Antibiotic-induced perturbations of the intestinal microbiota alter host susceptibility to enteric infection. Infection and Immunity 76:4726–4736.
35. Hill DA, Hoffmann C, Abt MC, Du Y, Kobuley D, Kirn TJ, Bushman FD, Artis D. 2010. Metagenomic analyses reveal antibiotic-induced temporal and spatial changes in intestinal microbiota with associated alterations in immune cell homeostasis. Mucosal Immunol 3:148–158.
36. Giongo A, Gano KA, Crabb DB, Mukherjee N, Novelo LL, Casella G, Drew JC, Ilonen J, Knip M, Hyöty H, Veijola R, Simell T, Simell O, Neu J, Wasserfall CH, Schatz D, Atkinson MA, Triplett EW. 2011. Toward defining the autoimmune microbiome for type 1 diabetes. The ISME Journal 5:82–91.
37. Onderdonk AB, Garrett WS. 2010. Gas Gangrene and Other Clostridium-Associated Diseases, pp. 3103–3109. In Mandell, Douglas, and Bennetts Principles and Practice of Infectious Disease, 7 ed. Philadelphia.
38. Walk ST, Young VB. 2008. Emerging Insights into Antibiotic-Associated Diarrhea and Clostridium difficile Infection through the Lens of Microbial Ecology. Interdiscip Perspect Infect Dis 2008:125081–7.
124
39. Giel JL, Sorg JA, Sonenshein AL, Zhu J. 2010. Metabolism of bile salts in mice influences spore germination in Clostridium difficile. PLoS ONE 5:e8740.
40. Sekirov I, Finlay BB. 2009. The role of the intestinal microbiota in enteric infection. J Physiol (Lond) 587:4159–4167.
41. Marshall BM, Ochieng DJ, Levy SB. 2010. Commensals: underappreciated reservoir of antibiotic resistance. Microbe Magazine.
42. Allen HK, Donato J, Wang HH, Cloud-Hansen KA, Davies J, Handelsman J. 2010. Call of the wild: antibiotic resistance genes in natural environments. Nat Rev Micro 8:251–259.
43. Sjölund M, Wreiber K, Andersson DI, Blaser MJ, Engstrand L. 2003. Long-term persistence of resistant Enterococcus species after antibiotics to eradicate Helicobacter pylori. Ann Intern Med 139:483–487.
44. Sommer MOA, Dantas G, Church GM. 2009. Functional characterization of the antibiotic resistance reservoir in the human microflora. Science 325:1128–1131.
45. Bobak DA, Guerrant RL. 2010. Nausea, Vomiting, and Noninflammatory Diarrhea, pp. 1359–1373. In Mandell GL, Bennett JE, Dolin R, editors. Mandell, Douglas, and Bennetts Principles and Practice of Infectious Disease, 7 ed. Philadelphia.
46. Fankhauser RL, Monroe SS, Noel JS, Humphrey CD, Bresee JS, Parashar UD, Ando T, Glass RI. 2002. Epidemiologic and molecular trends of “Norwalk-like viruses” associated with outbreaks of gastroenteritis in the United States. J Infect Dis 186:1–7.
47. Lyman WH, Walsh JF, Kotch JB, Weber DJ, Gunn E, Vinjé J. 2009. Prospective Study of Etiologic Agents of Acute Gastroenteritis Outbreaks in Child Care Centers. The Journal of Pediatrics 154:253–257.
48. Moser LA, Carter M, Schultz-Cherry S. 2007. Astrovirus increases epithelial barrier permeability independently of viral replication. J Virol 81:11937–11945.
49. Fang S-B, Lee H-C, Hu J-J, Hou S-Y, Liu H-L, Fang H-W. 2009. Dose-dependent effect of Lactobacillus rhamnosus on quantitative reduction of faecal rotavirus shedding in children. J Trop Pediatr 55:297–301.
50. Vandenplas Y, Salvatore S, Viera M, Devreker T, Hauser B. 2007. Probiotics in infectious diarrhoea in children: are they indicated? Eur J Pediatr 166:1211–1218.
51. Frank DN, St Amand AL, Feldman RA, Boedeker EC, Harpaz N, Pace NR. 2007. Molecular-phylogenetic characterization of microbial community imbalances in human inflammatory bowel diseases. Proc Natl Acad Sci USA 104:13780–13785.
52. Barrett JC, Hansoul S, Nicolae DL, Cho JH, Duerr RH, Rioux JD, Brant SR, Silverberg MS, Taylor KD, Barmada MM, Bitton A, Dassopoulos T, Datta LW, Green T, Griffiths AM, Kistner EO, Murtha MT, Regueiro MD, Rotter JI, Schumm LP, Steinhart AH, Targan SR, Xavier RJ, Libioulle C, Sandor C, Lathrop M, Belaiche J, Dewit O, Gut I, Heath S, Laukens D, Mni M, Rutgeerts P, Van Gossum A, Zelenika D,

125
Franchimont D, Hugot J-P, De Vos M, Vermeire S, Louis E, Cardon LR, Anderson CA, Drummond H, Nimmo E, Ahmad T, Prescott NJ, Onnie CM, Fisher SA, Marchini J, Ghori J, Bumpstead S, Gwilliam R, Tremelling M, Deloukas P, Mansfield J, Jewell D, Satsangi J, Mathew CG, Parkes M, Georges M, Daly MJ. 2008. Genome-wide association defines more than 30 distinct susceptibility loci for Crohn's disease. Nat Genet 40:955–962.
53. Cadwell K, Patel KK, Maloney NS, Liu T-C, Ng ACY, Storer CE, Head RD, Xavier R, Stappenbeck TS, Virgin HW. 2010. Virus-Plus-Susceptibility Gene Interaction Determines Crohn's Disease Gene Atg16L1 Phenotypes in Intestine. Cell 141:1135–1145.
54. Letarov A, Kulikov E. 2009. The bacteriophages in human‐ and animal body‐associated microbial communities. Journal of Applied Microbiology 107:1–13.
55. Reyes A, Haynes M, Hanson N, Angly FE, Heath AC, Rohwer F, Gordon JI. 2010. Viruses in the faecal microbiota of monozygotic twins and their mothers. Nature 466:334–338.
56. Saleh M, Elson CO. 2011. Experimental Inflammatory Bowel Disease: Insights into the Host-Microbiota Dialog. Immunity 34:293–302.
57. 2011. Key questions to guide a better understanding of host–commensal microbiota interactions in intestinal inflammation 4:127–132.
58. Danese S, Fiocchi C. 2011. Ulcerative colitis. N Engl J Med 365:1713–1725.
59. Podolsky DK. 2002. Inflammatory bowel disease. N Engl J Med 347:417–429.
60. Talley NJ, Abreu MT, Achkar J-P, Bernstein CN, Dubinsky MC, Hanauer SB, Kane SV, Sandborn WJ, Ullman TA, Moayyedi P, American College of Gastroenterology IBD Task Force. 2011. An evidence-based systematic review on medical therapies for inflammatory bowel disease. Am J Gastroenterol 106 Suppl 1:S2–25.
61. Hanauer SB. 2006. Inflammatory bowel disease: epidemiology, pathogenesis, and therapeutic opportunities. Inflammatory Bowel Diseases 12 Suppl 1:S3–9.
62. Anderson CA, Boucher G, Lees CW, Franke A, D'Amato M, Taylor KD, Lee JC, Goyette P, Imielinski M, Latiano A, Lagacé C, Scott R, Amininejad L, Bumpstead S, Baidoo L, Baldassano RN, Barclay M, Bayless TM, Brand S, Büning C, Colombel J-F, Denson LA, De Vos M, Dubinsky M, Edwards C, Ellinghaus D, Fehrmann RSN, Floyd JAB, Florin T, Franchimont D, Franke L, Georges M, Glas J, Glazer NL, Guthery SL, Haritunians T, Hayward NK, Hugot J-P, Jobin G, Laukens D, Lawrance I, Lémann M, Levine A, Libioulle C, Louis E, McGovern DP, Milla M, Montgomery GW, Morley KI, Mowat C, Ng A, Newman W, Ophoff RA, Papi L, Palmieri O, Peyrin-Biroulet L, Panés J, Phillips A, Prescott NJ, Proctor DD, Roberts R, Russell R, Rutgeerts P, Sanderson J, Sans M, Schumm P, Seibold F, Sharma Y, Simms LA, Seielstad M, Steinhart AH, Targan SR, van den Berg LH, Vatn M, Verspaget H, Walters T, Wijmenga C, Wilson DC, Westra H-J, Xavier RJ, Zhao ZZ, Ponsioen CY, Andersen V, Torkvist L, Gazouli M, Anagnou NP, Karlsen TH, Kupcinskas L, Sventoraityte J, Mansfield JC, Kugathasan S, Silverberg MS, Halfvarson J, Rotter JI, Mathew CG, Griffiths AM, Gearry R, Ahmad T, Brant SR, Chamaillard M, Satsangi

126
J, Cho JH, Schreiber S, Daly MJ, Barrett JC, Parkes M, Annese V, Hakonarson H, Radford-Smith G, Duerr RH, Vermeire S, Weersma RK, Rioux JD. 2011. Meta-analysis identifies 29 additional ulcerative colitis risk loci, increasing the number of confirmed associations to 47. Nat Genet 43:246–252.
63. Dieleman LA, Ridwan BU, Tennyson GS, Beagley KW, Bucy RP, Elson CO. 1994. Dextran sulfate sodium-induced colitis occurs in severe combined immunodeficient mice. Gastroenterology 107:1643–1652.
64. Kühn R, Löhler J, Rennick D, Rajewsky K, Müller W. 1993. Interleukin-10-deficient mice develop chronic enterocolitis. Cell 75:263–274.
65. Uhlig HH, Coombes J, Mottet C, Izcue A, Thompson C, Fanger A, Tannapfel A, Fontenot JD, Ramsdell F, Powrie F. 2006. Characterization of Foxp3+CD4+CD25+ and IL-10-secreting CD4+CD25+ T cells during cure of colitis. The Journal of Immunology 177:5852–5860.
66. Garrett WS, Lord GM, Punit S, Lugo-Villarino G, Mazmanian SK, Ito S, Glickman JN, Glimcher LH. 2007. Communicable ulcerative colitis induced by T-bet deficiency in the innate immune system. Cell 131:33–45.
67. Curry JD, Schlissel MS. 2008. RAG2's non-core domain contributes to the ordered regulation of VDJ recombination. Nucleic Acids Res 36:5750–5762.
68. Glimcher LH. 2007. Trawling for treasure: tales of T-bet. Nat Immunol 8:448–450.
69. Thompson GR, Trexler PC. 1971. Gastrointestinal structure and function in germ-free or gnotobiotic animals. Gut 12:230–235.
70. Rabot S, Membrez M, Bruneau A, Gérard P, Harach T, Moser M, Raymond F, Mansourian R, Chou CJ. 2010. Germ-free C57BL/6J mice are resistant to high-fat-diet-induced insulin resistance and have altered cholesterol metabolism. FASEB J 24:4948–4959.
71. Schaedler RW, Dubos R, Costello R. 1965. Association of germfree mice with bacteria isolated from normal mice. J Exp Med 122:77–82.
72. Dewhirst FE, Chien CC, Paster BJ, Ericson RL, Orcutt RP, Schauer DB, Fox JG. 1999. Phylogeny of the defined murine microbiota: altered Schaedler flora. Applied and Environmental Microbiology 65:3287–3292.
73. Geuking MB, Cahenzli J, Lawson MAE, Ng DCK, Slack E, Hapfelmeier S, McCoy KD, Macpherson AJ. 2011. Intestinal bacterial colonization induces mutualistic regulatory T cell responses. Immunity 34:794–806.
74. Goodman AL, McNulty NP, Zhao Y, Leip D, Mitra RD, Lozupone CA, Knight R, Gordon JI. 2009. Identifying Genetic Determinants Needed to Establish a Human Gut Symbiont in Its Habitat. Cell Host Microbe 6:279–289.
75. Atarashi K, Tanoue T, Oshima K, Suda W, Nagano Y, Nishikawa H, Fukuda S, Saito T, Narushima S, Hase K, Kim S, Fritz JV, Wilmes P, Ueha S, Matsushima K, Ohno H,

127
Olle B, Sakaguchi S, Taniguchi T, Morita H, Hattori M, Honda K. 2013. Treg induction by a rationally selected mixture of Clostridia strains from the human microbiota. Nature 500:232–236.
76. Goodman AL, Kallstrom G, Faith JJ, Reyes A, Moore A, Dantas G, Gordon JI. 2011. Extensive personal human gut microbiota culture collections characterized and manipulated in gnotobiotic mice. Proc Natl Acad Sci USA 108:6252–6257.
77. Schmidt TM, DeLong EF, Pace NR. 1991. Analysis of a marine picoplankton community by 16S rRNA gene cloning and sequencing. Journal of Bacteriology 173:4371–4378.
78. Woese CR, Fox GE. 1977. Phylogenetic structure of the prokaryotic domain: the primary kingdoms. Proc Natl Acad Sci USA 74:5088–5090.
79. Chakravorty S, Helb D, Burday M, Connell N, Alland D. 2007. A detailed analysis of 16S ribosomal RNA gene segments for the diagnosis of pathogenic bacteria. J Microbiol Methods 69:330–339.
80. Nelson MC, Morrison HG, Benjamino J, Grim SL, Graf J. 2014. Analysis, optimization and verification of Illumina-generated 16S rRNA gene amplicon surveys. PLoS ONE 9:e94249.
81. Caporaso JG, Kuczynski J, Stombaugh J, Bittinger K, Bushman FD, Costello EK, Fierer N, Peña AG, Goodrich JK, Gordon JI, Huttley GA, Kelley ST, Knights D, Koenig JE, Ley RE, Lozupone CA, McDonald D, Muegge BD, Pirrung M, Reeder J, Sevinsky JR, Turnbaugh PJ, Walters WA, Widmann J, Yatsunenko T, Zaneveld J, Knight R. 2010. QIIME allows analysis of high-throughput community sequencing data. Nat Methods 7:335–336.
82. Langille MGI, Zaneveld J, Caporaso JG, McDonald D, Knights D, Reyes JA, Clemente JC, Burkepile DE, Vega Thurber RL, Knight R, Beiko RG, Huttenhower C. 2013. Predictive functional profiling of microbial communities using 16S rRNA marker gene sequences. Nat Biotechnol 31:814–821.
83. Segata N, Izard J, Waldron L, Gevers D, Miropolsky L, Garrett WS, Huttenhower C. 2011. Metagenomic biomarker discovery and explanation. Genome Biol 12:R60.
84. Friedländer C. 1882. Ueber die Schizomyceten bei der acuten fibrösen Pneumonie. Virchows Arch pathol Anat u Physiol 87:319–324.
85. Podschun R, Ullmann U. 1998. Klebsiella spp. as nosocomial pathogens: epidemiology, taxonomy, typing methods, and pathogenicity factors. Clin Microbiol Rev 11:589–603.
86. Iniguez AL, Dong Y, Triplett EW. 2004. Nitrogen fixation in wheat provided by Klebsiella pneumoniae 342. Mol Plant Microbe Interact 17:1078–1085.
87. Li B, Zhao Y, Liu C, Chen Z, Zhou D. 2014. Molecular pathogenesis of Klebsiella pneumoniae. Future Microbiol 9:1071–1081.
88. Qiao S, Luo Q, Zhao Y, Zhang XC, Huang Y. 2014. Structural basis for lipopolysaccharide insertion in the bacterial outer membrane. Nature 511:108–111.
128
89. Kozak W, Conn CA, Kluger MJ. 1994. Lipopolysaccharide induces fever and depresses locomotor activity in unrestrained mice. Am J Physiol 266:R125–35.
90. Coutinho RL, Visconde MF, Descio FJ, Nicoletti AG, Pinto FCL, Silva ACRD, Rodrigues-Costa F, Gales AC, Furtado GHC. 2014. Community-acquired invasive liver abscess syndrome caused by a K1 serotype Klebsiella pneumoniae isolate in Brazil: a case report of hypervirulent ST23. Mem Inst Oswaldo Cruz 109:970–971.
91. Lin J-C, Koh TH, Lee N, Fung C-P, Chang F-Y, Tsai Y-K, Ip M, Siu LK. 2014. Genotypes and virulence in serotype K2 Klebsiella pneumoniae from liver abscess and non-infectious carriers in Hong Kong, Singapore and Taiwan. Gut Pathog 6:21.
92. Yang F-L, Yang Y-L, Liao P-C, Chou J-C, Tsai K-C, Yang A-S, Sheu F, Lin T-L, Hsieh P-F, Wang J-T, Hua K-F, Wu S-H. 2011. Structure and immunological characterization of the capsular polysaccharide of a pyrogenic liver abscess caused by Klebsiella pneumoniae: activation of macrophages through Toll-like receptor 4. J Biol Chem 286:21041–21051.
93. Shu H-Y, Fung C-P, Liu Y-M, Wu K-M, Chen Y-T, Li L-H, Liu T-T, Kirby R, Tsai S-F. 2009. Genetic diversity of capsular polysaccharide biosynthesis in Klebsiella pneumoniae clinical isolates. Microbiology (Reading, Engl) 155:4170–4183.
94. Cortés G, Alvarez D, Saus C, Albertí S. 2002. Role of lung epithelial cells in defense against Klebsiella pneumoniae pneumonia. Infection and Immunity 70:1075–1080.
95. Matatov R, Goldhar J, Skutelsky E, Sechter I, Perry R, Podschun R, Sahly H, Thankavel K, Abraham SN, Ofek I. 1999. Inability of encapsulated Klebsiella pneumoniae to assemble functional type 1 fimbriae on their surface. FEMS Microbiol Lett 179:123–130.
96. DeLeo FR, Chen L, Porcella SF, Martens CA, Kobayashi SD, Porter AR, Chavda KD, Jacobs MR, Mathema B, Olsen RJ, Bonomo RA, Musser JM, Kreiswirth BN. 2014. Molecular dissection of the evolution of carbapenem-resistant multilocus sequence type 258 Klebsiella pneumoniae. Proc Natl Acad Sci USA 111:4988–4993.
97. Whitfield C. 2006. Biosynthesis and Assembly of Capsular Polysaccharides in Escherichia coli. Annual Reviews Microbiology 75:39–68.
98. Ho J-Y, Lin T-L, Li C-Y, Lee A, Cheng A-N, Chen M-C, Wu S-H, Wang J-T, Li T-L, Tsai M-D. 2011. Functions of Some Capsular Polysaccharide Biosynthetic Genes in Klebsiella pneumoniae NTUH K-2044. PLoS ONE 6:e21664.
99. Fevre C, Passet V, Deletoile A, Barbe V, Frangeul L, Almeida AS, Sansonetti P, Tournebize R, Brisse S. 2011. PCR-Based Identification of Klebsiella pneumoniae subsp. rhinoscleromatis , the Agent of Rhinoscleroma. PLOS Negl Trop Dis 5:e1052.
100. Wu C-C, Wang C-K, Chen Y-C, Lin T-H, Jinn T-R, Lin C-T. 2014. IscR Regulation of Capsular Polysaccharide Biosynthesis and Iron-Acquisition Systems in Klebsiella pneumoniae CG43. PLoS ONE 9:e107812.
101. Cheng HY, Chen YS, Wu CY, Chang HY, Lai YC, Peng HL. 2010. RmpA regulation of

129
capsular polysaccharide biosynthesis in Klebsiella pneumoniae CG43. Journal of Bacteriology 192:3144–3158.
102. Chen F-J, Chan C-H, Huang Y-J, Liu K-L, Peng H-L, Chang H-Y, Liou G-G, Yew T-R, Liu C-H, Hsu KY, Hsu L. 2011. Structural and mechanical properties of Klebsiella pneumoniae type 3 Fimbriae. Journal of Bacteriology 193:1718–1725.
103. Livrelli V, De Champs C, Di Martino P, Darfeuille-Michaud A, Forestier C, Joly B. 1996. Adhesive properties and antibiotic resistance of Klebsiella, Enterobacter, and Serratia clinical isolates involved in nosocomial infections. Journal of Clinical Microbiology 34:1963–1969.
104. Klemm P, Schembri MA. 2000. Bacterial adhesins: function and structure. International Journal of Medical Microbiology 290:27–35.
105. Murphy CN, Mortensen MS, Krogfelt KA, Clegg S. 2013. Role of Klebsiella pneumoniae type 1 and type 3 fimbriae in colonizing silicone tubes implanted into the bladders of mice as a model of catheter-associated urinary tract infections. Infection and Immunity 81:3009–3017.
106. Schembri MA, Blom J, Krogfelt KA, Klemm P. 2005. Capsule and fimbria interaction in Klebsiella pneumoniae. Infection and Immunity 73:4626–4633.
107. Struve C, Bojer M, Krogfelt KA. 2008. Characterization of Klebsiella pneumoniae type 1 fimbriae by detection of phase variation during colonization and infection and impact on virulence. Infection and Immunity 76:4055–4065.
108. Miethke M, Marahiel MA. 2007. Siderophore-based iron acquisition and pathogen control. Microbiol Mol Biol Rev 71:413–451.
109. Podschun R, Fischer A, Ullmann U. 1992. Siderophore production of Klebsiella species isolated from different sources. Zentralbl Bakteriol 276:481–486.
110. Russo TA, Olson R, MacDonald U, Beanan J, Davidson BA. 2015. Aerobactin, but not yersiniabactin, salmochelin, or enterobactin, enables the growth/survival of hypervirulent (hypermucoviscous) Klebsiella pneumoniae ex vivo and in vivo. Infection and Immunity 83:3325–3333.
111. Holt KE, Wertheim H, Zadoks RN, Baker S, Whitehouse CA, Dance D, Jenney A, Connor TR, Hsu LY, Severin J, Brisse S, Cao H, Wilksch J, Gorrie C, Schultz MB, Edwards DJ, Nguyen KV, Nguyen TV, Dao TT, Mensink M, Minh VL, Nhu NTK, Schultsz C, Kuntaman K, Newton PN, Moore CE, Strugnell RA, Thomson NR. 2015. Genomic analysis of diversity, population structure, virulence, and antimicrobial resistance in Klebsiella pneumoniae, an urgent threat to public health. Proc Natl Acad Sci USA 112:E3574–81.
112. Wu K-M, Li L-H, Yan J-J, Tsao N, Liao T-L, Tsai H-C, Fung C-P, Chen H-J, Liu Y-M, Wang J-T, Fang C-T, Chang S-C, Shu H-Y, Liu T-T, Chen Y-T, Shiau Y-R, Lauderdale T-L, Su I-J, Kirby R, Tsai S-F. 2009. Genome sequencing and comparative analysis of Klebsiella pneumoniae NTUH-K2044, a strain causing liver abscess and meningitis. Journal of Bacteriology 191:4492–4501.

130
113. Li L, Stoeckert CJ, Roos DS. 2003. OrthoMCL: identification of ortholog groups for eukaryotic genomes. Genome Res 13:2178–2189.
114. Ying J, Wu S, Zhang K, Wang Z, Zhu W, Zhu M, Zhang Y, Cheng C, Wang H, Tou H, Zhu C, Li P, Ying J, Xu T, Yi H, Li J, Ni L, Xu Z, Bao Q, Lu J. 2015. Comparative genomics analysis of pKF3-94 in Klebsiella pneumoniae reveals plasmid compatibility and horizontal gene transfer. Front Microbiol 6:831.
115. McKenna M. 2013. THE LAST RESORT: Health officials are watching in horror as bacteria become resistant to powerful carbapenem antibiotics — one of the last drugs on the shelf
. Nature 499:394–396.
116. Wu H-S, Chen T-L, Chen IC-J, Huang M-S, Wang F-D, Fung C-P, Lee S-D. 2010. First identification of a patient colonized with Klebsiella pneumoniae carrying blaNDM-1 in Taiwan. J Chin Med Assoc 73:596–598.
117. Xu Y, Gu B, Huang M, Liu H, Xu T, Xia W, Wang T. 2015. Epidemiology of carbapenem resistant Enterobacteriaceae (CRE) during 2000-2012 in Asia. J Thorac Dis 7:376–385.
118. Guh AY, Bulens SN, Mu Y, Jacob JT, Reno J, Scott J, Wilson LE, Vaeth E, Lynfield R, Shaw KM, Vagnone PMS, Bamberg WM, Janelle SJ, Dumyati G, Concannon C, Beldavs Z, Cunningham M, Cassidy PM, Phipps EC, Kenslow N, Travis T, Lonsway D, Rasheed JK, Limbago BM, Kallen AJ. 2015. Epidemiology of Carbapenem-Resistant Enterobacteriaceae in 7 US Communities, 2012-2013. JAMA 314:1479–1487.
119. Snitkin ES, Zelazny AM, Thomas PJ, Stock F, NISC Comparative Sequencing Program Group, Henderson DK, Palmore TN, Segre JA. 2012. Tracking a hospital outbreak of carbapenem-resistant Klebsiella pneumoniae with whole-genome sequencing. Sci Transl Med 4:148ra116–148ra116.
120. Tascini C, Lipsky BA, Iacopi E, Ripoli A, Sbrana F, Coppelli A, Goretti C, Piaggesi A, Menichetti F. 2015. KPC-producing Klebsiella pneumoniae rectal colonization is a risk factor for mortality in patients with diabetic foot infections. Clin Microbiol Infect 21:790.e1–3.
121. Liu Y, Wang J-Y, Jiang W. 2013. An Increasing Prominent Disease of Klebsiella pneumoniae Liver Abscess: Etiology, Diagnosis, and Treatment. Gastroenterol Res Pract 2013:258514.
122. Fung C-P, Lin Y-T, Lin J-C, Chen T-L, Yeh K-M, Chang F-Y, Chuang H-C, Wu H-S, Tseng C-P, Siu LK. 2012. Klebsiella pneumoniae in gastrointestinal tract and pyogenic liver abscess. Emerging Infect Dis 18:1322–1325.
123. Taur Y, Xavier JB, Lipuma L, Ubeda C, Goldberg J, Gobourne A, Lee YJ, Dubin KA, Socci ND, Viale A, Perales M-A, Jenq RR, van den Brink MRM, Pamer EG. 2012. Intestinal domination and the risk of bacteremia in patients undergoing allogeneic hematopoietic stem cell transplantation. CLIN INFECT DIS 55:905–914.

131
124. Tiwana H, Natt RS, Benitez-Brito R, Shah S, Wilson C, Bridger S, Harbord M, Sarner M, Ebringer A. 2001. Correlation between the immune responses to collagens type I, III, IV and V and Klebsiella pneumoniae in patients with Crohn's disease and ankylosing spondylitis. Rheumatology (Oxford) 40:15–23.
125. Maroncle N, Balestrino D, Rich C, Forestier C. 2002. Identification of Klebsiella pneumoniae genes involved in intestinal colonization and adhesion using signature-tagged mutagenesis. Infection and Immunity 70:4729–4734.
126. Caballero S, Carter R, Ke X, Sušac B, Leiner IM, Kim GJ, Miller L, Ling L, Manova K, Pamer EG. 2015. Distinct but Spatially Overlapping Intestinal Niches for Vancomycin-Resistant Enterococcus faecium and Carbapenem-Resistant Klebsiella pneumoniae. PLoS Pathog 11:e1005132.
127. Garrett WS, Gallini CA, Yatsunenko T, Michaud M, DuBois A, Delaney ML, Punit S, Karlsson M, Bry L, Glickman JN, Gordon JI, Onderdonk AB, Glimcher LH. 2010. Enterobacteriaceae Act in Concert with the Gut Microbiota to Induce Spontaneous and Maternally Transmitted Colitis. Cell Host Microbe 8:292–300.
128. Camprubí S, Merino S, Guillot JF, Tomás JM. 1993. The role of the O-antigen lipopolysaccharide on the colonization in vivo of the germfree chicken gut by Klebsiella pneumoniae. Microb Pathog 14:433–440.
129. Favre-Bonté S, Licht TR, Forestier C, Krogfelt KA. 1999. Klebsiella pneumoniae capsule expression is necessary for colonization of large intestines of streptomycin-treated mice. Infection and Immunity 67:6152–6156.
130. Struve C, Forestier C, Krogfelt KA. 2003. Application of a novel multi-screening signature-tagged mutagenesis assay for identification of Klebsiella pneumoniae genes essential in colonization and infection. Microbiology (Reading, Engl) 149:167–176.
131. Kumar V, Sun P, Vamathevan J, Li Y, Ingraham K, Palmer L, Huang J, Brown JR. 2011. Comparative genomics of Klebsiella pneumoniae strains with different antibiotic resistance profiles. Antimicrob Agents Chemother 55:4267–4276.
132. Fitzgibbons SC, Ching Y, Yu D, Carpenter J, Kenny M, Weldon C, Lillehei C, Valim C, Horbar JD, Jaksic T. 2009. Mortality of necrotizing enterocolitis expressed by birth weight categories. J Pediatr Surg 44:1072–5– discussion 1075–6.
133. Nanthakumar NN, Fusunyan RD, Sanderson I, Walker WA. 2000. Inflammation in the developing human intestine: A possible pathophysiologic contribution to necrotizing enterocolitis. Proc Natl Acad Sci USA 97:6043–6048.
134. Lin PW, Nasr TR, Stoll BJ. 2008. Necrotizing enterocolitis: recent scientific advances in pathophysiology and prevention. Semin Perinatol 32:70–82.
135. Osrin D, Vergnano S, Costello A. 2004. Serious bacterial infections in newborn infants in developing countries. Curr Opin Infect Dis 17:217–224.
136. Zhang C, Sherman MP, Prince LS, Bader D, Weitkamp J-H, Slaughter JC, McElroy SJ. 2012. Paneth cell ablation in the presence of Klebsiella pneumoniae induces necrotizing

132
enterocolitis (NEC)-like injury in the small intestine of immature mice. Dis Model Mech 5:522–532.
137. Gophna U, Sommerfeld K, Gophna S, Doolittle WF, Veldhuyzen van Zanten SJO. 2006. Differences between tissue-associated intestinal microfloras of patients with Crohn's disease and ulcerative colitis. Journal of Clinical Microbiology 44:4136–4141.
138. Lederman ER, Crum NF. 2005. Pyogenic liver abscess with a focus on Klebsiella pneumoniae as a primary pathogen: an emerging disease with unique clinical characteristics. Am J Gastroenterol 100:322–331.
139. Lee C-H, Liu J-W, Su L-H, Chien C-C, Li C-C, Yang K-D. 2010. Hypermucoviscosity associated with Klebsiella pneumoniae-mediated invasive syndrome: a prospective cross-sectional study in Taiwan. Int J Infect Dis 14:e688–92.
140. Hyatt D, Chen G-L, Locascio PF, Land ML, Larimer FW, Hauser LJ. 2010. Prodigal: prokaryotic gene recognition and translation initiation site identification. BMC Bioinformatics 11:119.
141. Fischer S, Brunk BP, Chen F, Gao X, Harb OS, Iodice JB, Shanmugam D, Roos DS, Stoeckert CJ Jr. 2002. Using OrthoMCL to Assign Proteins to OrthoMCL-DB Groups or to Cluster Proteomes Into New Ortholog Groups. John Wiley & Sons, Inc., Hoboken, NJ, USA.
142. Stamatakis A. 2006. RAxML-VI-HPC: maximum likelihood-based phylogenetic analyses with thousands of taxa and mixed models. Bioinformatics 22:2688–2690.
143. García-Gómez E, González-Pedrajo B, Camacho-Arroyo I. 2013. Role of sex steroid hormones in bacterial-host interactions. Biomed Res Int 2013:928290–10.
144. Neyrolles O, Quintana-Murci L. 2009. Sexual inequality in tuberculosis. PLoS Med 6:e1000199.
145. Aebischer T, Laforsch S, Hurwitz R, Brombacher F, Meyer TF. 2001. Immunity against Helicobacter pylori: significance of interleukin-4 receptor alpha chain status and gender of infected mice. Infection and Immunity 69:556–558.
146. Zhao J, Ng SC, Lei Y, Yi F, Li J, Yu L, Zou K, Dan Z, Dai M, Ding Y, Song M, Mei Q, Fang X, Liu H, Shi Z, Zhou R, Xia M, Wu Q, Xiong Z, Zhu W, Deng L, Kamm MA, Xia B. 2013. First prospective, population-based inflammatory bowel disease incidence study in mainland of China: the emergence of “western” disease. Inflammatory Bowel Diseases 19:1839–1845.
147. Ng SC, Tang W, Ching JY, Wong M, Chow CM, Hui AJ, Wong TC, Leung VK, Tsang SW, Yu HH, Li MF, Ng KK, Kamm MA, Studd C, Bell S, Leong R, de Silva HJ, Kasturiratne A, Mufeena MNF, Ling KL, Ooi CJ, Tan PS, Ong D, Goh KL, Hilmi I, Pisespongsa P, Manatsathit S, Rerknimitr R, Aniwan S, Wang YF, Ouyang Q, Zeng Z, Zhu Z, Chen MH, Hu PJ, Wu K, Wang X, Simadibrata M, Abdullah M, Wu JC, Sung JJY, Chan FKL. 2013. Incidence and Phenotype of Inflammatory Bowel Disease Based on Results From the Asia-Pacific Crohn's and Colitis Epidemiology Study. Gastroenterology 145:158–165.e2.

133
148. Nerich V, Monnet E, Etienne A, Louafi S, Ramée C, Rican S, Weill A, Vallier N, Vanbockstael V, Auleley G-R, Allemand H, Carbonnel F. 2006. Geographical variations of inflammatory bowel disease in France: a study based on national health insurance data. Inflammatory Bowel Diseases 12:218–226.
149. Asakura K, Nishiwaki Y, Inoue N, Hibi T, Watanabe M, Takebayashi T. 2009. Prevalence of ulcerative colitis and Crohn's disease in Japan. J Gastroenterol 44:659–665.
150. Loftus EV, Silverstein MD, Sandborn WJ, Tremaine WJ, Harmsen WS, Zinsmeister AR. 2000. Ulcerative colitis in Olmsted County, Minnesota, 1940-1993: incidence, prevalence, and survival. Gut 46:336–343.
151. Bloom SM, Bijanki VN, Nava GM, Sun L, Malvin NP, Donermeyer DL, Dunne WM, Allen PM, Stappenbeck TS. 2011. Commensal Bacteroides species induce colitis in host-genotype-specific fashion in a mouse model of inflammatory bowel disease. Cell Host Microbe 9:390–403.
152. Papa E, Docktor M, Smillie C, Weber S, Preheim SP, Gevers D, Giannoukos G, Ciulla D, Tabbaa D, Ingram J, Schauer DB, Ward DV, Korzenik JR, Xavier RJ, Bousvaros A, Alm EJ. 2012. Non-invasive mapping of the gastrointestinal microbiota identifies children with inflammatory bowel disease. PLoS ONE 7:e39242.
153. Zenewicz LA, Yin X, Wang G, Elinav E, Hao L, Zhao L, Flavell RA. 2013. IL-22 deficiency alters colonic microbiota to be transmissible and colitogenic. J Immunol 190:5306–5312.
154. Schwab C, Berry D, Rauch I, Rennisch I, Ramesmayer J, Hainzl E, Heider S, Decker T, Kenner L, Müller M, Strobl B, Wagner M, Schleper C, Loy A, Urich T. 2014. Longitudinal study of murine microbiota activity and interactions with the host during acute inflammation and recovery. The ISME Journal 8:1101–1114.
155. Rowan F, Docherty NG, Murphy M, Murphy B, Calvin Coffey J, O'Connell PR. 2010. Desulfovibrio bacterial species are increased in ulcerative colitis. Dis Colon Rectum 53:1530–1536.
156. Jergens AE, Dorn A, Wilson J, Dingbaum K, Henderson A, Liu Z, Hostetter J, Evans RB, Wannemuehler MJ. 2006. Induction of differential immune reactivity to members of the flora of gnotobiotic mice following colonization with Helicobacter bilis or Brachyspira hyodysenteriae. Microbes and Infection 8:1602–1610.
157. Rashid T, Ebringer A, Wilson C. 2013. The role of Klebsiella in Crohn's disease with a potential for the use of antimicrobial measures. Int J Rheumatol 2013:610393–8.
158. Markle JGM, Frank DN, Mortin-Toth S, Robertson CE, Feazel LM, Rolle-Kampczyk U, Bergen von M, McCoy KD, Macpherson AJ, Danska JS. 2013. Sex differences in the gut microbiome drive hormone-dependent regulation of autoimmunity. Science 339:1084–1088.
159. Ussar S, Griffin NW, Bezy O, Fujisaka S, Vienberg S, Softic S, Deng L, Bry L, Gordon JI, Kahn CR. 2015. Interactions between Gut Microbiota, Host Genetics and Diet Modulate the Predisposition to Obesity and Metabolic Syndrome. Cell Metabolism 22:516–

134
530.
160. Kasai C, Sugimoto K, Moritani I, Tanaka J, Oya Y, Inoue H, Tameda M, Shiraki K, Ito M, Takei Y, Takase K. 2015. Comparison of the gut microbiota composition between obese and non-obese individuals in a Japanese population, as analyzed by terminal restriction fragment length polymorphism and next-generation sequencing. BMC Gastroenterol 15:100.
161. Murri M, Leiva I, Gomez-Zumaquero JM, Tinahones FJ, Cardona F, Soriguer F, Queipo-Ortuño MI. 2013. Gut microbiota in children with type 1 diabetes differs from that in healthy children: a case-control study. BMC Medicine 11:46.
162. Sartor RB, Mazmanian SK. 2012. Intestinal Microbes in Inflammatory Bowel Diseases. The American Journal of Gastroenterology Supplements 1:15–21.
163. Salter SJ, Cox MJ, Turek EM, Calus ST, Cookson WO, Moffatt MF, Turner P, Parkhill J, Loman NJ, Walker AW. 2014. Reagent and laboratory contamination can critically impact sequence-based microbiome analyses. BMC Biology 12:87.
164. Kennedy NA, Walker AW, Berry SH, Duncan SH, Farquarson FM, Louis P, Thomson JM. 2014. The Impact of Different DNA Extraction Kits and Laboratories upon the Assessment of Human Gut Microbiota Composition by 16S rRNA Gene Sequencing. PLoS ONE 9:e88982.
165. Cruaud P, Vigneron A, Lucchetti-Miganeh C, Ciron PE, Godfroy A, Cambon-Bonavita M-A. 2014. Influence of DNA extraction method, 16S rRNA targeted hypervariable regions, and sample origin on microbial diversity detected by 454 pyrosequencing in marine chemosynthetic ecosystems. Applied and Environmental Microbiology 80:4626–4639.
166. Neurath MF, Weigmann B, Finotto S, Glickman J, Nieuwenhuis E, Iijima H, Mizoguchi A, Mizoguchi E, Mudter J, Galle PR, Bhan A, Autschbach F, Sullivan BM, Szabo SJ, Glimcher LH, Blumberg RS. 2002. The transcription factor T-bet regulates mucosal T cell activation in experimental colitis and Crohn's disease. J Exp Med 195:1129–1143.
167. Andersson AF, Lindberg M, Jakobsson H, Bäckhed F, Nyrén P, Engstrand L. 2008. Comparative analysis of human gut microbiota by barcoded pyrosequencing. PLoS ONE 3:e2836.
168. Sarma-Rupavtarm RB, Ge Z, Schauer DB, Fox JG, Polz MF. 2004. Spatial distribution and stability of the eight microbial species of the altered schaedler flora in the mouse gastrointestinal tract. Applied and Environmental Microbiology 70:2791–2800.
169. Highsmith AK, Jarvis WR. 1985. Klebsiella pneumoniae: selected virulence factors that contribute to pathogenicity. Infect Control 6:75–77.
170. Kabha K, Nissimov L, Athamna A, Keisari Y, Parolis H, Parolis LA, Grue RM, Schlepper-Schafer J, Ezekowitz AR, Ohman DE. 1995. Relationships among Capsular Structure, Phagocytosis, and Mouse Virulence in Klebsiella pneumoniae. Infection and Immunity 63:847–852.
135
171. Ofek I, Mesika A, Kalina M, Keisari Y, Podschun R, Sahly H, Chang D, McGregor D, Crouch E. 2001. Surfactant protein D enhances phagocytosis and killing of unencapsulated phase variants of Klebsiella pneumoniae. Infection and Immunity 69:24–33.
172. Domenico P, Salo RJ, Cross AS, Cunha BA. 1994. Polysaccharide capsule-mediated resistance to opsonophagocytosis in Klebsiella pneumoniae. Infection and Immunity 62:4495–4499.
173. Keisari Y, Wang H, Mesika A, Matatov R, Nissimov L, Crouch E, Ofek I. 2001. Surfactant protein D-coated Klebsiella pneumoniae stimulates cytokine production in mononuclear phagocytes. J Leukoc Biol 70:135–141.
174. Montgomerie JZ. 1979. Epidemiology of Klebsiella and hospital-associated infections. Rev Infect Dis 1:736–753.
175. Struve C, Krogfelt KA. 2003. Role of capsule in Klebsiella pneumoniae virulence: lack of correlation between in vitro and in vivo studies. FEMS Microbiol Lett 218:149–154.
176. Campos MA, Vargas MA, Regueiro V, Llompart CM, Albertí S, Bengoechea JA. 2004. Capsule polysaccharide mediates bacterial resistance to antimicrobial peptides. Infection and Immunity 72:7107–7114.
177. Llobet E, Tomás JM, Bengoechea JA. 2008. Capsule polysaccharide is a bacterial decoy for antimicrobial peptides. Microbiology (Reading, Engl) 154:3877–3886.
178. Hapfelmeier S, Lawson MAE, Slack E, Kirundi JK, Stoel M, Heikenwalder M, Cahenzli J, Velykoredko Y, Balmer ML, Endt K, Geuking MB, Roy Curtiss 3, McCoy KD, Macpherson AJ. 2010. Reversible Microbial Colonization of Germ-Free Mice Reveals the Dynamics of IgA Immune Responses. Science 328:1705–1709.
179. Pan Y-J, Lin T-L, Chen Y-H, Hsu C-R, Hsieh P-F, Wu M-C, Wang J-T. 2013. Capsular types of Klebsiella pneumoniae revisited by wzc sequencing. PLoS ONE 8:e80670.
180. Darling AE, Mau B, Perna NT. 2010. progressiveMauve: multiple genome alignment with gene gain, loss and rearrangement. PLoS ONE 5:e11147.
181. McConnell EL, Basit AW, Murdan S. 2008. Measurements of rat and mouse gastrointestinal pH, fluid and lymphoid tissue, and implications for in-vivo experiments. J Pharm Pharmacol 60:63–70.
182. Hamner S, McInnerney K, Williamson K, Franklin MJ, Ford TE. 2013. Bile Salts Affect Expression of Escherichia coli O157:H7 Genes for Virulence and Iron Acquisition, and Promote Growth under Iron Limiting Conditions. PLoS ONE 8:e74647.
183. Gunn JS. 2000. Mechanisms of bacterial resistance and response to bile. Microbes Infect 2:907–913.
184. Eberhart LJ, Deringer JR, Brayton KA, Sawant AA, Besser TE, Call DR. 2012. Characterization of a novel microcin that kills enterohemorrhagic Escherichia coli O157:H7 and O26. Applied and Environmental Microbiology 78:6592–6599.
136
185. Russell AB, Wexler AG, Harding BN, Whitney JC, Bohn AJ, Goo YA, Tran BQ, Barry NA, Zheng H, Peterson SB, Chou S, Gonen T, Goodlett DR, Goodman AL, Mougous JD. 2014. A type VI secretion-related pathway in Bacteroidetes mediates interbacterial antagonism. Cell Host Microbe 16:227–236.
186. Zerbino DR, Birney E. 2008. Velvet: algorithms for de novo short read assembly using de Bruijn graphs. Genome Res 18:821–829.
187. Seemann T. 2014. Prokka: rapid prokaryotic genome annotation. Bioinformatics 30:2068–2069.
188. Boudeau J, Glasser AL, Masseret E, Joly B, Darfeuille-Michaud A. 1999. Invasive ability of an Escherichia coli strain isolated from the ileal mucosa of a patient with Crohn's disease. Infection and Immunity 67:4499–4509.
189. Krause DO, Little AC, Dowd SE, Bernstein CN. 2011. Complete genome sequence of adherent invasive Escherichia coli UM146 isolated from Ileal Crohn's disease biopsy tissue. Journal of Bacteriology 193:583–583.
190. Oshima K, Toh H, Ogura Y, Sasamoto H, Morita H, Park S-H, Ooka T, Iyoda S, Taylor TD, Hayashi T, Itoh K, Hattori M. 2008. Complete genome sequence and comparative analysis of the wild-type commensal Escherichia coli strain SE11 isolated from a healthy adult. DNA Res 15:375–386.
191. Riley M, Abe T, Arnaud MB, Berlyn MKB, Blattner FR, Chaudhuri RR, Glasner JD, Horiuchi T, Keseler IM, Kosuge T, Mori H, Perna NT, Plunkett G, Rudd KE, Serres MH, Thomas GH, Thomson NR, Wishart D, Wanner BL. 2006. Escherichia coli K-12: a cooperatively developed annotation snapshot--2005. Nucleic Acids Res 34:1–9.
192. Alikhan N-F, Petty NK, Ben Zakour NL, Beatson SA. 2011. BLAST Ring Image Generator (BRIG): simple prokaryote genome comparisons. BMC Genomics 12:402.
193. Dhillon BK, Laird MR, Shay JA, Winsor GL, Lo R, Nizam F, Pereira SK, Waglechner N, McArthur AG, Langille MGI, Brinkman FSL. 2015. IslandViewer 3: more flexible, interactive genomic island discovery, visualization and analysis. Nucleic Acids Res 43:W104–8.
194. Ma J, Bao Y, Sun M, Dong W, Pan Z, Zhang W, Lu C, Yao H. 2014. Two functional type VI secretion systems in avian pathogenic Escherichia coli are involved in different pathogenic pathways. Infection and Immunity 82:3867–3879.
195. Sana TG, Baumann C, Merdes A, Soscia C, Rattei T, Hachani A, Jones C, Bennett KL, Filloux A, Superti-Furga G, Voulhoux R, Bleves S. 2015. Internalization of Pseudomonas aeruginosa Strain PAO1 into Epithelial Cells Is Promoted by Interaction of a T6SS Effector with the Microtubule Network. MBio 6:e00712.
196. Clevers H. 2013. The intestinal crypt, a prototype stem cell compartment. Cell 154:274–284.
197. Wilson SS, Tocchi A, Holly MK, Parks WC, Smith JG. 2014. A small intestinal organoid model of non-invasive enteric pathogen-epithelial cell interactions. Mucosal

137
Immunol 1–10.
198. Wilson CL, Ouellette AJ, Satchell DP, Ayabe T, López-Boado YS, Stratman JL, Hultgren SJ, Matrisian LM, Parks WC. 1999. Regulation of intestinal alpha-defensin activation by the metalloproteinase matrilysin in innate host defense. Science 286:113–117.
199. Wu L, Estrada O, Zaborina O, Bains M, Shen L, Kohler JE, Patel N, Musch MW, Chang EB, Fu Y-X, Jacobs MA, Nishimura MI, Hancock REW, Turner JR, Alverdy JC. 2005. Recognition of host immune activation by Pseudomonas aeruginosa. Science 309:774–777.
200. Llobet E, Campos MA, Giménez P, Moranta D, Bengoechea JA. 2011. Analysis of the networks controlling the antimicrobial-peptide-dependent induction of Klebsiella pneumoniae virulence factors. Infection and Immunity 79:3718–3732.
201. Cullen TW, Schofield WB, Barry NA, Putnam EE, Rundell EA, Trent MS, Degnan PH, Booth CJ, Yu H, Goodman AL. 2015. Gut microbiota. Antimicrobial peptide resistance mediates resilience of prominent gut commensals during inflammation. Science 347:170–175.
202. Salzman NH, Hung K, Haribhai D, Chu H, Karlsson-Sjöberg J, Amir E, Teggatz P, Barman M, Hayward M, Eastwood D, Stoel M, Zhou Y, Sodergren E, Weinstock GM, Bevins CL, Williams CB, Bos NA. 2010. Enteric defensins are essential regulators of intestinal microbial ecology. Nat Immunol 11:76–83.
203. Mukherjee S, Hooper LV. 2015. Antimicrobial defense of the intestine. Immunity 42:28–39.
204. Bry L, Falk P, Huttner K, Ouellette A, Midtvedt T, Gordon JI. 1994. Paneth cell differentiation in the developing intestine of normal and transgenic mice. Proc Natl Acad Sci USA 91:10335–10339.
205. Dzul SP, Thornton MM, Hohne DN, Stewart EJ, Shah AA, Bortz DM, Solomon MJ, Younger JG. 2011. Contribution of the Klebsiella pneumoniae capsule to bacterial aggregate and biofilm microstructures. Applied and Environmental Microbiology 77:1777–1782.
206. Macfarlane S, Macfarlane GT. 2006. Composition and metabolic activities of bacterial biofilms colonizing food residues in the human gut. Applied and Environmental Microbiology 72:6204–6211.
207. Hancock RE, Chapple DS. 1999. Peptide antibiotics. Antimicrob Agents Chemother 43:1317–1323.
208. Hibbing ME, Fuqua C, Parsek MR, Peterson SB. 2010. Bacterial competition: surviving and thriving in the microbial jungle. Nat Rev Micro 8:15–25.
209. Garcia-Bustos JF, Pezzi N, Mendez E. 1985. Structure and mode of action of microcin 7, an antibacterial peptide produced by Escherichia coli. Antimicrob Agents Chemother 27:791–797.
138
210. Pukatzki S, Ma AT, Sturtevant D, Krastins B, Sarracino D, Nelson WC, Heidelberg JF, Mekalanos JJ. 2006. Identification of a conserved bacterial protein secretion system in Vibrio cholerae using the Dictyostelium host model system. Proc Natl Acad Sci USA 103:1528–1533.
211. Basler M, Ho BT, Mekalanos JJ. 2013. Tit-for-tat: type VI secretion system counterattack during bacterial cell-cell interactions. Cell 152:884–894.
212. Russell AB, Hood RD, Bui NK, LeRoux M, Vollmer W, Mougous JD. 2011. Type VI secretion delivers bacteriolytic effectors to target cells. Nature 475:343–347.
213. Aschtgen M-S, Bernard CS, De Bentzmann S, Lloubès R, Cascales E. 2008. SciN is an outer membrane lipoprotein required for type VI secretion in enteroaggregative Escherichia coli. Journal of Bacteriology 190:7523–7531.
214. Wannemuehler MJ, Overstreet A-M, Ward DV, Phillips GJ. 2014. Draft genome sequences of the altered schaedler flora, a defined bacterial community from gnotobiotic mice. Genome Announc 2:e00287–14–e00287–14.
215. Filisetti-Cozzi T, Carpita NC. 1991. Measurement of Uranic Acids without Interference from Neutral Sugars. Analytical Biochemistry 197:157–162.
216. Blumenkrantz N, Asboe-Hansen G. 1973. New method for quantitative determination of uronic acids. Analytical Biochemistry 54:484–489.
217. Domenico P, Landolphi DR, Cunha BA. 1991. Reduction of capsular polysaccharide and potentiation of aminoglycoside inhibition in gram-negative bacteria by bismuth subsalicylate. J Antimicrob Chemother 28:801–810.
218. Bankevich A, Nurk S, Antipov D, Gurevich AA, Dvorkin M, Kulikov AS, Lesin VM, Nikolenko SI, Pham S, Prjibelski AD, Pyshkin AV, Sirotkin AV, Vyahhi N, Tesler G, Alekseyev MA, Pevzner PA. 2012. SPAdes: a new genome assembly algorithm and its applications to single-cell sequencing. J Comput Biol 19:455–477.
219. Galardini M, Biondi EG, Bazzicalupo M, Mengoni A. 2011. CONTIGuator: a bacterial genomes finishing tool for structural insights on draft genomes. Source Code Biol Med 6:11.
220. Langmead B, Salzberg SL. 2012. Fast gapped-read alignment with Bowtie 2. Nat Methods 9:357–359.
221. Quinlan AR. 2014. BEDTools: The Swiss-Army Tool for Genome Feature Analysis. Curr Protoc Bioinformatics 47:11.12.1–11.12.34.
222. Thorvaldsdóttir H, Robinson JT, Mesirov JP. 2013. Integrative Genomics Viewer (IGV): high-performance genomics data visualization and exploration. Briefings in Bioinformatics 14:178–192.
223. Bolger AM, Lohse M, Usadel B. 2014. Trimmomatic: a flexible trimmer for Illumina sequence data. Bioinformatics 30:2114–2120.

139
224. Kassim SY, Gharib SA, Mecham BH, Birkland TP, Parks WC, McGuire JK. 2007. Individual matrix metalloproteinases control distinct transcriptional responses in airway epithelial cells infected with Pseudomonas aeruginosa. Infection and Immunity 75:5640–5650.
225. Martinon F, Chen X, Lee A-H, Glimcher LH. 2010. TLR activation of the transcription factor XBP1 regulates innate immune responses in macrophages. Nat Immunol 11:411–418.
226. Fang G, Munera D, Friedman DI, Mandlik A, Chao MC, Banerjee O, Feng Z, Losic B, Mahajan MC, Jabado OJ, Deikus G, Clark TA, Luong K, Murray IA, Davis BM, Keren-Paz A, Chess A, Roberts RJ, Korlach J, Turner SW, Kumar V, Waldor MK, Schadt EE. 2012. Genome-wide mapping of methylated adenine residues in pathogenic Escherichia coli using single-molecule real-time sequencing. Nat Biotechnol 30:1232–1239.
227. Murray IA, Clark TA, Morgan RD, Boitano M, Anton BP, Luong K, Fomenkov A, Turner SW, Korlach J, Roberts RJ. 2012. The methylomes of six bacteria. Nucleic Acids Res 40:11450–11462.
228. Braaten BA, Nou X, Kaltenbach LS, Low DA. 1994. Methylation patterns in pap regulatory DNA control pyelonephritis-associated pili phase variation in E. coli. Cell 76:577–588.
229. Kooistra O, Lüneberg E, Knirel YA, Frosch M, Zähringer U. 2002. N-Methylation in polylegionaminic acid is associated with the phase-variable epitope of Legionella pneumophila serogroup 1 lipopolysaccharide. Identification of 5-(N,N-dimethylacetimidoyl)amino and 5-acetimidoyl(N-methyl)amino-7-acetamido-3,5,7,9-tetradeoxynon-2-ulosonic acid in the O-chain polysaccharide. Eur J Biochem 269:560–572.
230. Datsenko KA, Wanner BL. 2000. One-step inactivation of chromosomal genes in Escherichia coli K-12 using PCR products. Proc Natl Acad Sci USA 97:6640–6645.