fullfat soybean meal - livestock philippines · basilisa p. reas, dvm msc technical manager ussec-...
TRANSCRIPT

Basilisa P. Reas, DVM MSc Technical Manager USSEC- SEA
FULLFAT SOYBEAN MEAL: AN OPPORTUNITY BEYOND
VEGETABLE OIL AS ENERGY SOURCE FOR ANIMAL FEEDS
Livestock & Poultry Expo
Clark, Pampanga
February 28 - March 1, 2017
2
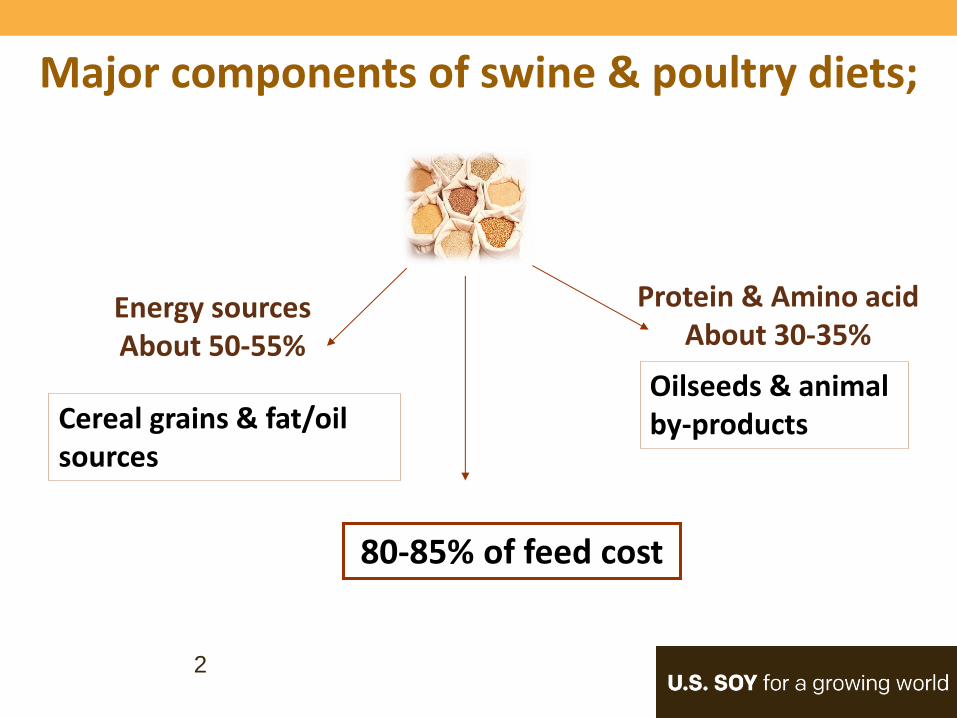
Cereal grains & fat/oil sources
Oilseeds & animal by-products
80-85% of feed cost
Protein & Amino acid About 30-35%
Energy sources About 50-55%
Major components of swine & poultry diets;

Philippine Feed wheat Imports, (PAFMI, December 2016)
0 218,000
0
330,905 305,201 63,250 0 45,000
0 0
1,172,224
0 0 0 0 0
0
110,000
1,535,000
0 0 0 0 0 0
235,950
256,500
0
557,570
0 0 0 63,969
50,340
373,892
45,000
421,584
40,395 0 154,631
146,066
293,653
407,700
394,269
259,517
0 43,000
175,000
0
500,000
1,000,000
1,500,000
2,000,000
2,500,000
3,000,000
3,500,000
4,000,000
US INDIA Australia Brazil Blacksea RUSSIAN Canadian EU
2010 2011 2012 2013 2014 2015
Year US India Aus Bra Black
Sea
RU
S/B
ul
CND EU Total amount,
MT
2011 100% 1,172,224
2012 93.31% 0.69% 1,645,000
2013 24% 26% 50% 1,050,020
2014 6% 4% 33% 4% 37% 3% 13& 1,149,811
2015 8% 17% 24% 23% 15% 2.5% 10% 1,719,205
2016 32% 31% 2,208,190
% according to origin

Philippine Yellow Corn Imports, 2011-2016* (PAFMI, December2016)
0
200,000
400,000
600,000
800,000
1,000,000
US Argentine Vietnam Thai Indonesia India mymar
2010 2011 2012 2013 2014 2015
Year US Arg Viet Thai Indo IND MYM Total amount in Mt
2011 25% 37% 74,800
2012 100% 94,000
2013 93% 4% 303,461
2014 7% 6% 5% 69% 2% 1% 637,301
2015 22
%
23% 19% 37% 215,229
2016 54% 525,109
% according to origin

Philippine Soybean meal Importation, 2011- 2016
Year US ARG India Brazil TOTAL Vol, MMT
2011 45 54 1 1,811,835
2012 67 32 1 1,800,097
2013 54 46 1,871,009
2014 52 47 1 2,489.286
2015 67 32 1 2,130.981
2016* 71 28 2,565,64
% according to Origin
Source: PAFMI, December .2017
802,595 818,723
1,211,560 1,015,164
1,296,770 1,298,104
8,216 26,015 8,591 358 1,871
739,027
967,097
579,946 855,087
1,184,005
571,240
10 400 140
1,549,848
1,811,835 1,800,097
1,871,009
2,489,286
1,869,344
0
500,000
1,000,000
1,500,000
2,000,000
2,500,000
3,000,000
2010 2011 2012 2013 2014 2015
US India Arg. China Total

ME of major ingredients
0 500 1000 1500 2000 2500 3000 3500 4000
Copra meal
Palm Kernel Meal
SBM, NDH
SBM, DH
FFSBM
Fish meal
Corn
Wheat
Cassava
DDGSME, kcal/kg
Copra meal
Palm KernelMealSBM, NDH
SBM, DH
FFSBM
Fish meal
Source: ASA-IM Tech Bull 2004

Average raw material prices &
farm gate prices as of February 15, 2017
Farm gate
prices
Price,
PhP/kg
Broiler, Integrator 82.00
Broiler,
commercial
80-84.00
DOC 30-32.00
Hog, commercial 108-112.00
Hog, backyard 98.00-103.00
Source: PAFMI, Feb 15, 2017
Raw Material Price, PhP/kg
Y corn (COD) 14.50-15.00
Feed wheat 13.00 – 13.20
US SBM 22.80 -23.50
Arg SBM NA
Fish meal, Peru 67.00
Fish meal, local 58.00
Ricebran 10.50-11.50
Pollard 11.80-12.50
Copra meal 12.50
Coco oil 85-90.00
Palm oil 48-55.00
Mollasses 11.20
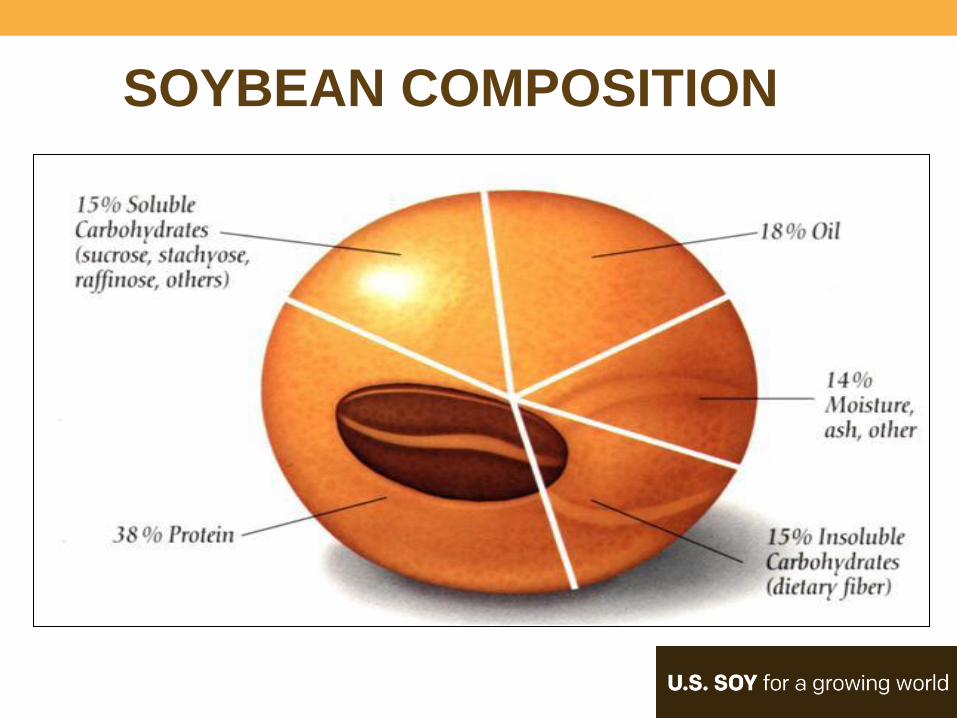
SOYBEAN COMPOSITION
Source: Nutritional and Health Benefits of Soy; The Soybean Fact Book: Nutritional and Health by ASAIM; c2007.

DH SBM – High protein, low fiber
NDH SBM – Low protein, high fiber
Fullfat SBM – High energy, high protein (high energy;high protein
Soy Protein Concentrates
Soy Isolates, etc..
All SBMs are not the same!!; Classification of SBM according to processing involved:
Desolventize, toast
Soybean
meal
Crude soy oil
White flakes
Extrude, expand or roast and cool
FFSBM
Soy protein
concentrate
Refine
RDB
Soy oil
Soy
molasses
Soy
hulls
Hexane extract
Temper, dehull, flake
Soybeans
Ethanol extract

Fatty acid sources differ
• Animal-sources
– Beef tallow – 50% Saturated
– Mutton fat /pork lard – 45% Saturated
– Poultry fat – 30% Saturated
• Plant sources – Palm oil – Saturated ; Palmitic
– Palm kernel oil – Saturated; Lauric, Myristci
– Coco oil – Saturated; Lauric, Myristic
– Soy oil, sunflower, maize – Unsatuarted; Linoleic
– Rapeseed – Unsaturated; Oleic
– Linseed – Unsaturated; Linolenic

Fatty acids in diff vegetable oil
Palm oil PKO Palm Olein Coco oil Soy oil
U/S 0.98 0.21 1.0 0.1 5.0
g/kg
0
100
200
300
400
500
600
Capric Lauric Myristic Palmitic Stearic Oleic Linoleic Linolenic
Palm oil
PKO
Soy oil
Coco oil
Palm olein
Source:

• What can we get from FFSBM?
• Which ingredients are replaced by FFSBM?
• Is FFSBM and economical alternative?
What is Fullfat SBM?
Produced by either extrusion, expansion, roasting, etc.

FFSBM production process
Soybean (start w/ good quality beans)
Processing;(Extrusion, Expansion,
Toasting, etc: (reduce TIA, ruptures oil
cells; increase digestibility of nutrient)
FFSBM (high energy, high
Linoleic acid, high protein/AA)

WHY FFSBM?
• Contains not only energy but also protein and amino acids;
• Contains good quality oil (Essential Fatty Acid content)
• Increasing prices of energy sources; (vegetable oil and grains)
• Continuous improvement in animal genetics higher nutrient requirement;
• Better uniformity in mixing
• Availability & Freshness;
• Plant base – less risk of contamination
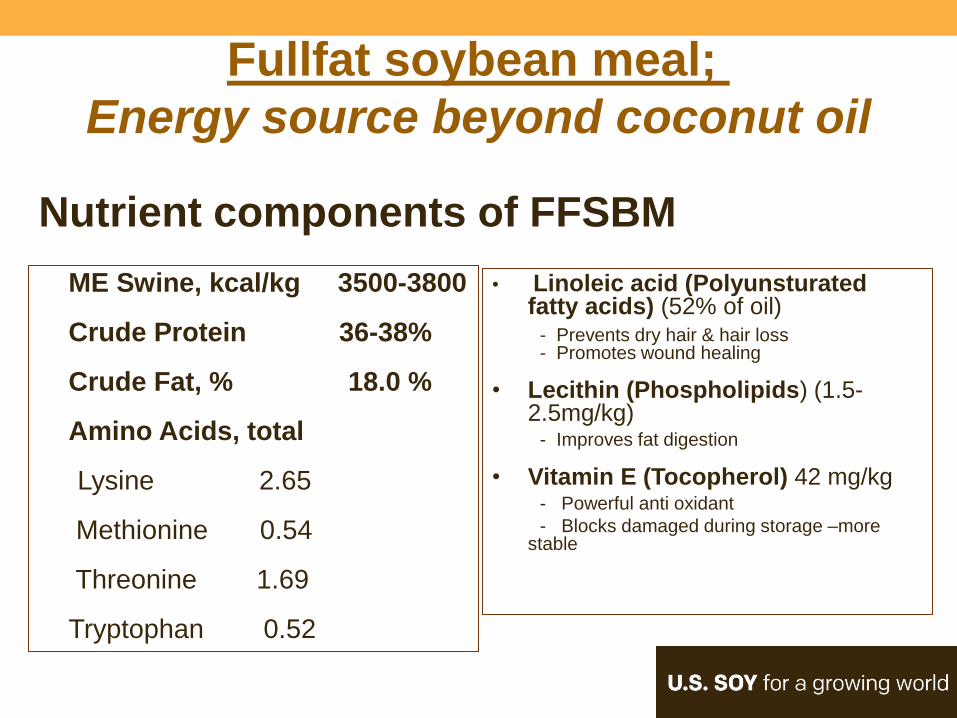
• Linoleic acid (Polyunsturated fatty acids) (52% of oil)
- Prevents dry hair & hair loss - Promotes wound healing
• Lecithin (Phospholipids) (1.5-2.5mg/kg)
- Improves fat digestion
• Vitamin E (Tocopherol) 42 mg/kg - Powerful anti oxidant
- Blocks damaged during storage –more stable
Nutrient components of FFSBM
ME Swine, kcal/kg 3500-3800
Crude Protein 36-38%
Crude Fat, % 18.0 %
Amino Acids, total
Lysine 2.65
Methionine 0.54
Threonine 1.69
Tryptophan 0.52
Fullfat soybean meal;
Energy source beyond coconut oil

FFSBM production & usage in SEA,
2016, (MT)
Thailand – 950,000 – 980,000
Vietnam – 275,000-300,000
Indonesia – 160,000 – 180,000
Philippines –110,000 -120,000

Fatty acids in diff vegetable oil
Palm oil PKO Palm Olein Coco oil Soy oil
U/S 0.98 0.21 1.0 0.1 5.0
g/kg
0
100
200
300
400
500
600
Capric Lauric Myristic Palmitic Stearic Oleic Linoleic Linolenic
Palm oil
PKO
Soy oil
Coco oil
Palm olein
Source:

• Shadow pricing; other energy sources and (regular) SBM
• Quality – less risk of contamination (ie: PED)
• Supply
• Animal performance
Economic Evaluation

Nutrient contribution of FFSBM
Diet Inc. Rate,% MEkcal/kg CP Linoleic acid
Pre-starter 10.0 356/11.0% 3.8/18.0% 0.80/49.0%
Starter 8.0 283/8.8% 3.0/16% 0.64/53.0%
Lactating 12.0 515/16.3% 5.5/34.5% 1.16/64.7%
Layers 5.0 180/6.8% 1.8/10.58% 0.40/26.7%

Animal Performance is the ultimate test!

Study 1. Different Levels of FFSBM & Coco oil in Layers Batangas, Philippines
July 2016
Production
Parameters (Egg) T1 (FarmDiet) T2 T3
(US) FFSBM, % 2.5 5.0 7.5
Coco oil, % 1.5 1.0 0
Prod'n, % 84.02 85.39 84.34
ADFI, g 112.06 113.96 111.68
FCR, g/g 2.628 2.613 2.645
Egg wt, g 51.05 51.33 50.57
Egg mass, g 42.89 43.83 42.65
Liveability, % 98.88 99.37 99.38

Economic Parameters T1 T2 T3
Total Eggs prod (pcs) 27,201 27,348 26,867
Sale Value (PhP) 118,293.10 119,172.80 116,790.00
Feeds Consumed (kg) 3398.50 3439.45 3410.05
Cost of Feed Cons (PhP) 62838.27 63354.67 62813.12
IOFC (PhP) 55,454.84 55,818.13 53,976.88
Study 1. Different Levels of FFSBM in Layers Batangas Philippines
July 2016

Study 2. Different Source of FFSBM in Layers Batangas Philippines
August 2016
Production
Parameters
T1
Fam Diet
(2.5% US FFSBM)
T2
(5.0%; US Extruded
FFSBM)
T3
(5.0%; Unknown
origin/
Unknown process)
Coconut oil 1.5 1.0 1.0
Prod'n, % 90.93 91.70 91.02
ADFI, g 113.60 115.33 115.52
FCR, g/g 2.417 2.430 2.453
Egg wt, g 50.71 50.86 50.76
Egg mass, g 46.11 46.64 46.21
Liveability, % 99.77 99.88 99.76

Economic Parameters
T1 Fam Diet
(2.5% US FFSBM)
T2 (5.0%; US Extruded FFSBM)
T3 (5.0%; Unknown
origin/ Unknown process)
Total Eggs Prod (pcs) 27,201 27,348 26,867
Sale Value (PhP) 118,293.10 119,172.80 116,790.00 Feeds Consumed (kg) 3,398.50 3,439.45 3,410.05
Cost Feed Cons. (PhP) 62,838.27 63,354.67 62,813.12
IOFC (PhP) 55,454.84 55,818.13 53,976.88
Study 2. Different Source of FFSBM in Layers Batangas Philippines
August 2016
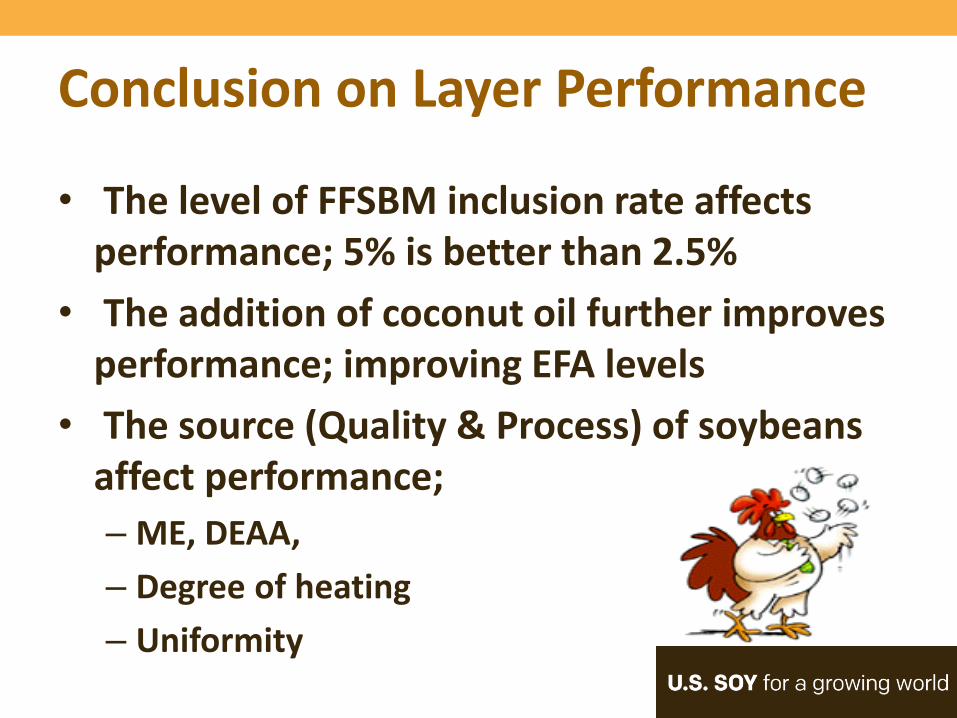
• The level of FFSBM inclusion rate affects performance; 5% is better than 2.5%
• The addition of coconut oil further improves performance; improving EFA levels
• The source (Quality & Process) of soybeans affect performance;
– ME, DEAA,
– Degree of heating
– Uniformity
Conclusion on Layer Performance

Comparison of two FFSBM sources with &
without coconut oil in piglet diets. Batangas, Philippines. May 2013.
1. T1 - EXTRUDED FFFSBM made of US soybeans #2 with COCO OIL 2. T2 - EXTRUDED FFFSBM made of US soybeans #2 without COCO OIL 3. T3 - EXTRUDED FFSBM made of Non-US soybeans, with COCO OIL 4. T4 - EXTRUDED FFSBM made of Non-US soybeans, without COCO OIL 5. T5 - CONTROL- Regular farm diet (Corn, US DHSBM, EXTRUDED FFSBM made of US soybean and COCO OIL)

TX# Ini wt,
kgs
Final
wt.kgs
Wt gain,
kg
ADG ADFI,g FCR Feed cost,
Php/lkg
Feed
cost/kg
gain, PhP
Feed cost/kg
gain, US$
T1 8.28 22.43 14.15 476.0ªᵇ 868 1.91ᵇ ͨ 24.19
($0.59)
46.20 1.127
T2 8.22 20.55 12.33 415.0ᵇ ͨ 811 2.06 ªᵇ 24.50
($0.60)
50.88 1.241
T3 8.38 20.67 12.20 421.0ᵇ ͨ 817 1.96 ᵇ ͨ 24.19
($0.59)
47.41 1.156
T4 8.27 19.37 11.10 373.0 ͨ 825 2.21 ª 24.50
($0.60
54.26 1.323
T5 Farm
diet 8.05 21.16 13.11 452.0 ᵇ 970 2.1 ͨ 23.50
($0.57)
50.64 1.235
FFSBM in Piglets. Performance summary
P-
value 0.004 0.002
9

Performance summary, day 30
0.476 0.429 0.414 0.374 0.443
0.889 0.888 0.817 0.833
0.963
1.875
2.080
1.868
2.246 2.178
0.000
0.500
1.000
1.500
2.000
2.500
+ coco oil No coco oil + coco oil No coco oil
US FFSBM ARG FFSBM Farm diet
Dietary treatment
ADG, kg ADFI, kg FCR

Quality Parameters
• Quality of beans
• Processing technique
• Handling & storage
• Soybeans
• Fullfat SBM

Effect of Soy Oil on SID of AA in SBM and SPC
50
55
60
65
70
75
80
85
90
95
100
Lys Met Thr Trp
Without oil With oil
H. H. STEIN. USSEC FTNW 2014. MANILA
a b b a b b a a

Economic comparison of FFSBM & coco oil based on ME & EAA content
Coconut oil
FFSBM L- Lysine Dl-Meth L-Threo L-Tryp
ME,Kcal/kg 8000 3800 4250 5280 3355 3355
CP, % 0 38 92.8 58.0
Lysine, % 0 2.65 78.0
Methionine 0 0.54 99.0
Threo,% 0 1.69 99.0
Tryp,% 0 0.52 98.0
US$/MT 1,800 600.00 1800.00 3500.00 2000 12000
US$/1000 KCAL ME
225.0 157.89 423.52 662.88 596.12 3576.75
US$/ % CP
US$/ % AA 2.31 3.53 2.02 12.24
Add’l value of AA in FFSBM
6.12
1.91
3.41 6.36
Additional value of FFSBM = US$ 67.11 (ME) + 17.80 (EAA)
= US$84.91
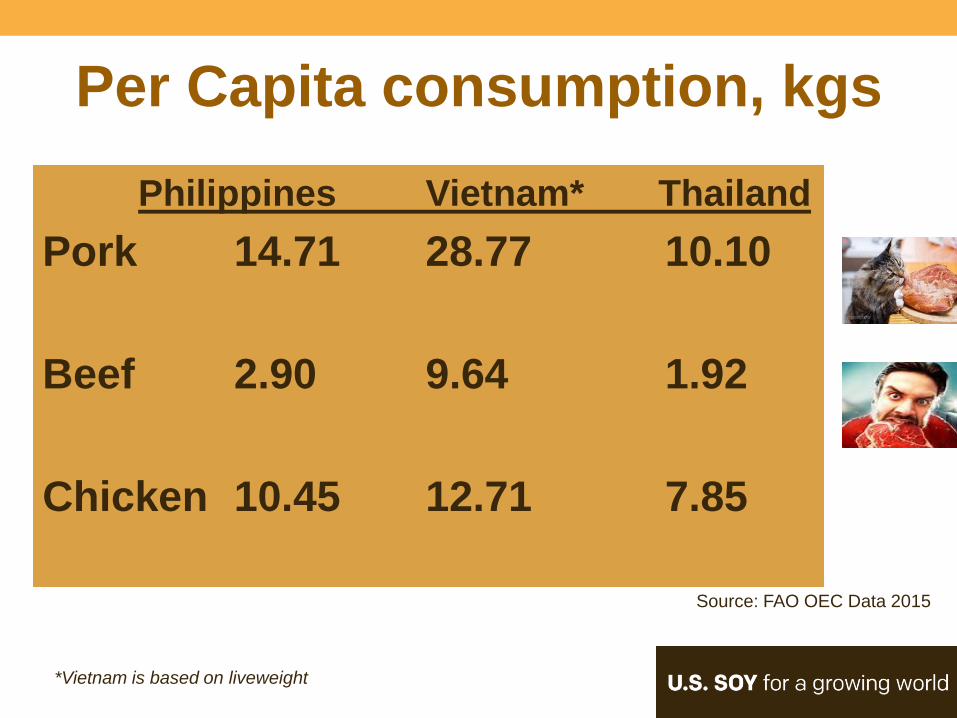
Philippines Vietnam* Thailand
Pork 14.71 28.77 10.10
Beef 2.90 9.64 1.92
Chicken 10.45 12.71 7.85
Per Capita consumption, kgs
Source: FAO OEC Data 2015
*Vietnam is based on liveweight

Per capita egg consumption of
some countries PHILIPPINES: 94
Source: G Cervantes, PCPP 2016

Raw material opportunity indicators
for the Feed industry
(For 100M people):
• An extra 100 g chicken per
year/person;
• needs 200,000 MT of feeds;
• 100,000 MT of corn
• 50,000 MT of SBM ( inc rate 25%)
• An extra egg per year/person;
• needs 100,000 MT of feed
• 50,000 MT of corn
• 10,000 MT of SBM (10% inc rate)
• An extra 200 g pork per
year/person;
• needs 625,000 MT of feeds;
• 312,500 MT of corn (inc rate 50 %)
• 125,000 MT of SBM (inc rate 20%)

• FFSBM is a great source of both energy and essential amino acids;
• Can replace vegetable oil, higher ME with better essential fatty acid profile (52% linoleic acid).
• FFSBM has other important components; phospholipids and lecithin
• Improves palatability and reduces dustiness thus increasing feed intake; fresh source of oil
• Can be used w/o limit; up to 25% - better performance
• Currently, has a premium of moretahn US$ 80,.00/MT vs coconut oil.
Conclusions

• Nutrient requirement of feeds; – Energy content- kind of feeds (others; linoleic acid req) – Other raw material available
• Quality: – Beans - protein, oil – Processing: (extrusion, expansion, roasting.. etc.)
• degree of cooking, moisture, handling & storage ( TIA, Urease activity/PSKOH, EE/acid hydrolysis)
• Price: relative to coconut or palm oil/SBM – other energy sources (grains, cassava meal, tallow, etc)
Recommendations; FFSBM utilization

THANK YOU