full wwpdb x-ray structure validation report o i · b 428 glu - expression tag unp e7fam5 b 429 alv...
TRANSCRIPT
Full wwPDB X-ray Structure Validation Report iO
Apr 30, 2018 � 02:32 PM EDT
PDB ID : 6FPTTitle : Crystal structure of Danio rerio Lin41 �lamin-NHL domains
Authors : Kumari, P.; Aeschimann, F.; Gaidatzis, D.; Keusch, J.J.; Ghosh, P.; Neagu,A.; Pachulska-Wieczorek, K.; Bujnicki, J.M.; Gut, H.; Grosshans, H.; Ciosk,R.
Deposited on : 2018-02-12Resolution : 2.60 Å(reported)
This is a Full wwPDB X-ray Structure Validation Report for a publicly released PDB entry.
We welcome your comments at [email protected]
A user guide is available athttps://www.wwpdb.org/validation/2017/XrayValidationReportHelp
with speci�c help available everywhere you see the iO symbol.
The following versions of software and data (see references iO) were used in the production of this report:
MolProbity : 4.02b-467Xtriage (Phenix) : 1.13
EDS : rb-20031021Percentile statistics : 20171227.v01 (using entries in the PDB archive December 27th 2017)
Refmac : 5.8.0158CCP4 : 7.0 (Gargrove)
Ideal geometry (proteins) : Engh & Huber (2001)Ideal geometry (DNA, RNA) : Parkinson et al. (1996)
Validation Pipeline (wwPDB-VP) : rb-20031021
Page 2 Full wwPDB X-ray Structure Validation Report 6FPT
1 Overall quality at a glance iO
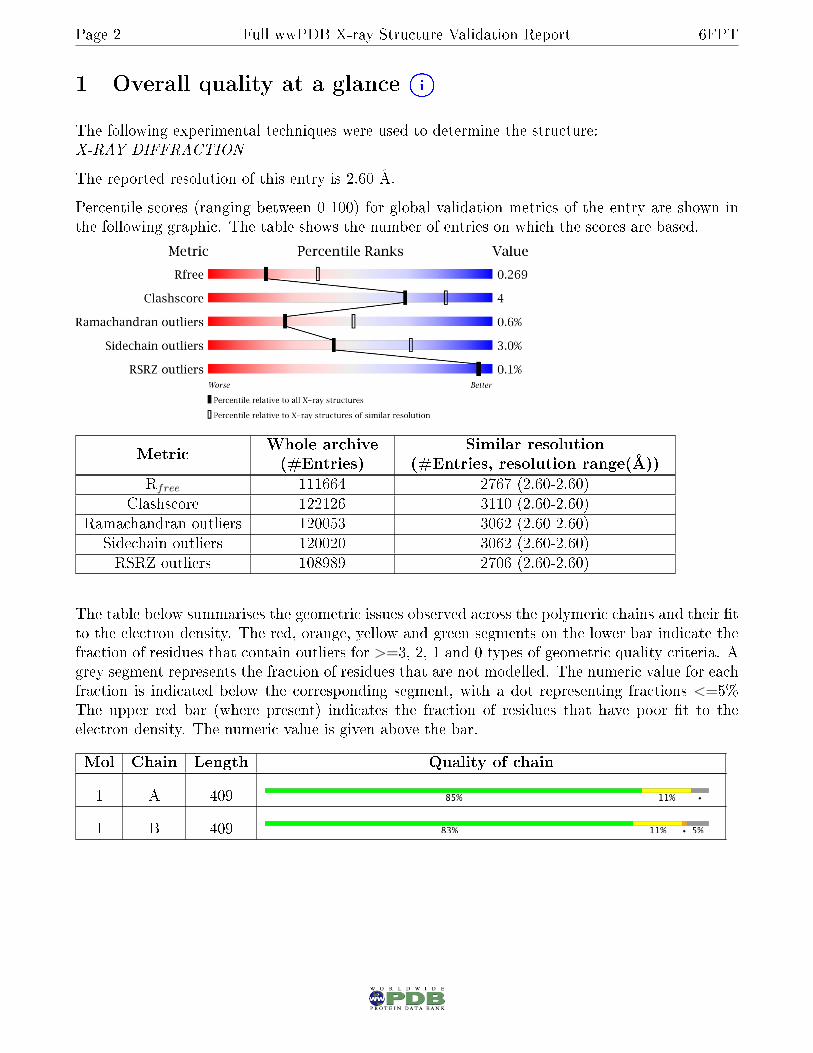
The following experimental techniques were used to determine the structure:X-RAY DIFFRACTION
The reported resolution of this entry is 2.60 Å.
Percentile scores (ranging between 0-100) for global validation metrics of the entry are shown inthe following graphic. The table shows the number of entries on which the scores are based.
MetricWhole archive(#Entries)
Similar resolution(#Entries, resolution range(Å))
Rfree 111664 2767 (2.60-2.60)Clashscore 122126 3110 (2.60-2.60)
Ramachandran outliers 120053 3062 (2.60-2.60)Sidechain outliers 120020 3062 (2.60-2.60)RSRZ outliers 108989 2706 (2.60-2.60)
The table below summarises the geometric issues observed across the polymeric chains and their �tto the electron density. The red, orange, yellow and green segments on the lower bar indicate thefraction of residues that contain outliers for >=3, 2, 1 and 0 types of geometric quality criteria. Agrey segment represents the fraction of residues that are not modelled. The numeric value for eachfraction is indicated below the corresponding segment, with a dot representing fractions <=5%The upper red bar (where present) indicates the fraction of residues that have poor �t to theelectron density. The numeric value is given above the bar.
Mol Chain Length Quality of chain
1 A 409
1 B 409

Page 3 Full wwPDB X-ray Structure Validation Report 6FPT
2 Entry composition iO
There are 2 unique types of molecules in this entry. The entry contains 6217 atoms, of which 0are hydrogens and 0 are deuteriums.
In the tables below, the ZeroOcc column contains the number of atoms modelled with zero occu-pancy, the AltConf column contains the number of residues with at least one atom in alternateconformation and the Trace column contains the number of residues modelled with at most 2atoms.
� Molecule 1 is a protein called E3 ubiquitin-protein ligase TRIM71.
Mol Chain Residues Atoms ZeroOcc AltConf Trace
1 A 391Total C N O S3012 1891 547 562 12
0 1 0
1 B 388Total C N O S2990 1878 541 559 12
0 1 0
There are 38 discrepancies between the modelled and reference sequences:
Chain Residue Modelled Actual Comment ReferenceA 416 MET - initiating methionine UNP E7FAM5A 417 ALA - expression tag UNP E7FAM5A 418 HIS - expression tag UNP E7FAM5A 419 HIS - expression tag UNP E7FAM5A 420 HIS - expression tag UNP E7FAM5A 421 HIS - expression tag UNP E7FAM5A 422 HIS - expression tag UNP E7FAM5A 423 HIS - expression tag UNP E7FAM5A 424 SER - expression tag UNP E7FAM5A 425 SER - expression tag UNP E7FAM5A 426 GLY - expression tag UNP E7FAM5A 427 LEU - expression tag UNP E7FAM5A 428 GLU - expression tag UNP E7FAM5A 429 VAL - expression tag UNP E7FAM5A 430 LEU - expression tag UNP E7FAM5A 431 PHE - expression tag UNP E7FAM5A 432 GLN - expression tag UNP E7FAM5A 433 GLY - expression tag UNP E7FAM5A 434 PRO - expression tag UNP E7FAM5B 416 MET - initiating methionine UNP E7FAM5B 417 ALA - expression tag UNP E7FAM5B 418 HIS - expression tag UNP E7FAM5B 419 HIS - expression tag UNP E7FAM5B 420 HIS - expression tag UNP E7FAM5B 421 HIS - expression tag UNP E7FAM5
Continued on next page...

Page 4 Full wwPDB X-ray Structure Validation Report 6FPT
Continued from previous page...
Chain Residue Modelled Actual Comment ReferenceB 422 HIS - expression tag UNP E7FAM5B 423 HIS - expression tag UNP E7FAM5B 424 SER - expression tag UNP E7FAM5B 425 SER - expression tag UNP E7FAM5B 426 GLY - expression tag UNP E7FAM5B 427 LEU - expression tag UNP E7FAM5B 428 GLU - expression tag UNP E7FAM5B 429 VAL - expression tag UNP E7FAM5B 430 LEU - expression tag UNP E7FAM5B 431 PHE - expression tag UNP E7FAM5B 432 GLN - expression tag UNP E7FAM5B 433 GLY - expression tag UNP E7FAM5B 434 PRO - expression tag UNP E7FAM5
� Molecule 2 is water.
Mol Chain Residues Atoms ZeroOcc AltConf
2 A 99Total O99 99
0 0
2 B 116Total O116 116
0 0

Page 5 Full wwPDB X-ray Structure Validation Report 6FPT
3 Residue-property plots iO
These plots are drawn for all protein, RNA and DNA chains in the entry. The �rst graphic fora chain summarises the proportions of the various outlier classes displayed in the second graphic.The second graphic shows the sequence view annotated by issues in geometryand electron density.Residues are color-coded according to the number of geometric quality criteria for which theycontain at least one outlier: green = 0, yellow = 1, orange = 2 and red = 3 or more. A red dotabove a residue indicates a poor �t to the electron density (RSRZ > 2). Stretches of 2 or moreconsecutive residues without any outlier are shown as a green connector. Residues present in thesample, but not in the model, are shown in grey.
• Molecule 1: E3 ubiquitin-protein ligase TRIM71
Chain A:
MET
ALA
HIS
HIS
HIS
HIS
HIS
HIS
SER
SER
GLY
LEU
GLU
VAL
LEU
PHE
GLN
GLY
P434
S435
A438
A453
R473
V480
N490
S507
L521
I522
I527
V536
R540•
G546
R564
V570
V576
R581
I588
H597
T601
V615
I624
I635
F638
L644
N657
Y658
P659
F666
S673
R676
A698
F703
N712
Q713
E714
L728
V756
A757
V758
D762
V766
H772
T789
H790
I803
T806
M823
F824
• Molecule 1: E3 ubiquitin-protein ligase TRIM71
Chain B:
MET
ALA
HIS
HIS
HIS
HIS
HIS
HIS
SER
SER
GLY
LEU
GLU
VAL
LEU
PHE
GLN
GLY
PRO
S435
A453
E471
V480
N490
T503
S507
L521
I522
I527
V536
K537
S538
GLY
ARG
S541
Y542
G546
R564
V570
V576
R581
I588
H597
T601
V615
A616
I624
D629
I635
F638
L644
E648
N657
Y658
P659
W660
D661
V664
S673
R676
A698
F703
N712
L727
L728
R731
P732
D733
R738
V758
D759
I764
H772
F777
H790
I803
P807
M823
F824

Page 6 Full wwPDB X-ray Structure Validation Report 6FPT
4 Data and re�nement statistics iO
Property Value SourceSpace group P 21 21 21 DepositorCell constantsa, b, c, α, β, γ
65.80Å 90.59Å 131.05Å90.00◦ 90.00◦ 90.00◦
Depositor
Resolution (Å)46.43 � 2.6046.43 � 2.60
DepositorEDS
% Data completeness(in resolution range)
95.3 (46.43-2.60)95.4 (46.43-2.60)
DepositorEDS
Rmerge (Not available) DepositorRsym 0.12 Depositor
< I/σ(I) > 1 2.26 (at 2.61Å) XtriageRe�nement program BUSTER 2.11.5 Depositor
R, Rfree0.181 , 0.2440.199 , 0.269
DepositorDCC
Rfree test set 1182 re�ections (5.00%) wwPDB-VPWilson B-factor (Å2) 26.2 Xtriage
Anisotropy 0.993 XtriageBulk solvent ksol(e/Å3), Bsol(Å2) 0.32 , 47.1 EDS
L-test for twinning2 < |L| > = 0.50, < L2 > = 0.33 XtriageEstimated twinning fraction No twinning to report. Xtriage
Fo,Fc correlation 0.94 EDSTotal number of atoms 6217 wwPDB-VP
Average B, all atoms (Å2) 30.0 wwPDB-VP
Xtriage's analysis on translational NCS is as follows: The analyses of the Patterson function reveals
a signi�cant o�-origin peak that is 44.78 % of the origin peak, indicating pseudo-translational
symmetry. The chance of �nding a peak of this or larger height randomly in a structure without
pseudo-translational symmetry is equal to 1.4536e-04. The detected translational NCS is most
likely also responsible for the elevated intensity ratio.
1Intensities estimated from amplitudes.2Theoretical values of < |L| >, < L2 > for acentric re�ections are 0.5, 0.333 respectively for untwinned datasets,
and 0.375, 0.2 for perfectly twinned datasets.

Page 7 Full wwPDB X-ray Structure Validation Report 6FPT
5 Model quality iO
5.1 Standard geometry iO
The Z score for a bond length (or angle) is the number of standard deviations the observed valueis removed from the expected value. A bond length (or angle) with |Z| > 5 is considered anoutlier worth inspection. RMSZ is the root-mean-square of all Z scores of the bond lengths (orangles).
Mol ChainBond lengths Bond anglesRMSZ #|Z| >5 RMSZ #|Z| >5
1 A 0.50 0/3086 0.75 0/41651 B 0.49 0/3062 0.74 0/4132All All 0.49 0/6148 0.74 0/8297
There are no bond length outliers.
There are no bond angle outliers.
There are no chirality outliers.
There are no planarity outliers.
5.2 Too-close contacts iO
In the following table, the Non-H and H(model) columns list the number of non-hydrogen atomsand hydrogen atoms in the chain respectively. The H(added) column lists the number of hydrogenatoms added and optimized by MolProbity. The Clashes column lists the number of clashes withinthe asymmetric unit, whereas Symm-Clashes lists symmetry related clashes.
Mol Chain Non-H H(model) H(added) Clashes Symm-Clashes1 A 3012 0 2890 25 01 B 2990 0 2865 27 02 A 99 0 0 0 02 B 116 0 0 2 0All All 6217 0 5755 47 0
The all-atom clashscore is de�ned as the number of clashes found per 1000 atoms (includinghydrogen atoms). The all-atom clashscore for this structure is 4.
All (47) close contacts within the same asymmetric unit are listed below, sorted by their clashmagnitude.
Atom-1 Atom-2Interatomicdistance (Å)
Clashoverlap (Å)
1:A:570:VAL:HG11 1:A:806:THR:HG22 1.64 0.78Continued on next page...

Page 8 Full wwPDB X-ray Structure Validation Report 6FPT
Continued from previous page...
Atom-1 Atom-2Interatomicdistance (Å)
Clashoverlap (Å)
1:B:490:ASN:HB2 2:B:1002:HOH:O 1.94 0.671:A:576:VAL:HG21 1:A:823:MET:HE1 1.77 0.661:B:588:ILE:HG21 1:B:638[B]:PHE:CZ 2.33 0.631:A:490:ASN:HB2 1:B:738:ARG:HE 1.63 0.631:B:576:VAL:HG21 1:B:823:MET:HE1 1.81 0.621:B:588:ILE:HD12 1:B:597:HIS:HB3 1.82 0.611:A:588:ILE:HD12 1:A:597:HIS:HB3 1.82 0.601:A:453:ALA:HB3 1:A:536:VAL:HG22 1.85 0.591:A:564:ARG:O 1:A:581:ARG:HB2 2.02 0.591:B:564:ARG:O 1:B:581:ARG:HB2 2.03 0.591:A:698:ALA:HB3 1:B:521:LEU:HD21 1.85 0.571:A:756:VAL:HG23 1:A:766:VAL:HG22 1.88 0.561:A:522:ILE:HG12 1:A:527:ILE:CG2 2.36 0.551:B:453:ALA:HB3 1:B:536:VAL:HG22 1.88 0.541:B:570:VAL:HG12 1:B:576:VAL:HG22 1.89 0.541:B:712:ASN:HA 1:B:758:VAL:HG11 1.90 0.541:A:521:LEU:HD21 1:B:698:ALA:HB3 1.90 0.531:B:659:PRO:HA 1:B:673:SER:O 2.08 0.531:A:712:ASN:HA 1:A:758:VAL:HG11 1.91 0.521:B:807:PRO:HD2 2:B:921:HOH:O 2.09 0.511:B:616:ALA:HB1 1:B:664:VAL:HG12 1.92 0.511:B:764:ILE:HG13 1:B:777:PHE:HB2 1.93 0.511:A:657:ASN:HB3 1:A:676:ARG:HB2 1.92 0.511:A:713:GLN:HB2 1:A:762:ASP:OD1 2.11 0.511:B:657:ASN:HB3 1:B:676:ARG:HB2 1.93 0.501:A:570:VAL:HG22 1:A:576:VAL:HG22 1.95 0.491:B:576:VAL:HG21 1:B:823:MET:CE 2.45 0.471:B:772:HIS:CE1 1:B:790:HIS:HD2 2.33 0.471:A:576:VAL:HG21 1:A:823:MET:CE 2.44 0.471:A:666:PHE:CE1 1:B:733:ASP:HA 2.50 0.461:B:703:PHE:HB2 1:B:728:LEU:HD21 2.01 0.431:A:624:ILE:HG23 1:A:635:ILE:CD1 2.49 0.431:A:772:HIS:CE1 1:A:790:HIS:HD2 2.36 0.431:A:703:PHE:HB2 1:A:728:LEU:HD21 2.00 0.431:A:588:ILE:HG21 1:A:638[B]:PHE:CZ 2.54 0.431:B:624:ILE:HG23 1:B:635:ILE:CD1 2.49 0.421:B:542:TYR:HE2 1:B:759:ASP:OD2 2.02 0.421:A:659:PRO:HA 1:A:673:SER:O 2.20 0.421:B:727:LEU:CD2 1:B:764:ILE:HD13 2.49 0.421:B:480:VAL:HG22 1:B:522:ILE:HD12 2.01 0.421:A:624:ILE:HG23 1:A:635:ILE:HD13 2.02 0.42
Continued on next page...

Page 9 Full wwPDB X-ray Structure Validation Report 6FPT
Continued from previous page...
Atom-1 Atom-2Interatomicdistance (Å)
Clashoverlap (Å)
1:A:480:VAL:HG22 1:A:522:ILE:HD12 2.02 0.411:A:714:GLU:CD 1:B:731:ARG:HH22 2.24 0.411:B:661:ASP:H 1:B:673:SER:HB2 1.85 0.41
1:B:522:ILE:HG12 1:B:527:ILE:CG2 2.51 0.401:A:438:ALA:N 1:A:473:ARG:HD2 2.36 0.40
There are no symmetry-related clashes.
5.3 Torsion angles iO
5.3.1 Protein backbone iO
In the following table, the Percentiles column shows the percent Ramachandran outliers of thechain as a percentile score with respect to all X-ray entries followed by that with respect to entriesof similar resolution.
The Analysed column shows the number of residues for which the backbone conformation wasanalysed, and the total number of residues.
Mol Chain Analysed Favoured Allowed Outliers Percentiles
1 A 390/409 (95%) 365 (94%) 22 (6%) 3 (1%) 21 42
1 B 385/409 (94%) 357 (93%) 26 (7%) 2 (0%) 31 56
All All 775/818 (95%) 722 (93%) 48 (6%) 5 (1%) 27 51
All (5) Ramachandran outliers are listed below:
Mol Chain Res Type1 A 435 SER1 A 581 ARG1 B 546 GLY1 B 581 ARG1 A 546 GLY
5.3.2 Protein sidechains iO
In the following table, the Percentiles column shows the percent sidechain outliers of the chain as apercentile score with respect to all X-ray entries followed by that with respect to entries of similarresolution.
The Analysed column shows the number of residues for which the sidechain conformation was

Page 10 Full wwPDB X-ray Structure Validation Report 6FPT
analysed, and the total number of residues.
Mol Chain Analysed Rotameric Outliers Percentiles
1 A 319/333 (96%) 312 (98%) 7 (2%) 55 79
1 B 317/333 (95%) 305 (96%) 12 (4%) 36 63
All All 636/666 (96%) 617 (97%) 19 (3%) 44 71
All (19) residues with a non-rotameric sidechain are listed below:
Mol Chain Res Type1 A 507 SER1 A 601 THR1 A 615 VAL1 A 644 LEU1 A 676 ARG1 A 789 THR1 A 803 ILE1 B 471 GLU1 B 503 THR1 B 507 SER1 B 542 TYR1 B 601 THR1 B 615 VAL1 B 629 ASP1 B 644 LEU1 B 648 GLU1 B 673 SER1 B 764 ILE1 B 803 ILE
Some sidechains can be �ipped to improve hydrogen bonding and reduce clashes. All (3) suchsidechains are listed below:
Mol Chain Res Type1 A 716 HIS1 A 790 HIS1 B 790 HIS
5.3.3 RNA iO
There are no RNA molecules in this entry.
Page 11 Full wwPDB X-ray Structure Validation Report 6FPT
5.4 Non-standard residues in protein, DNA, RNA chains iO
There are no non-standard protein/DNA/RNA residues in this entry.
5.5 Carbohydrates iO
There are no carbohydrates in this entry.
5.6 Ligand geometry iO
There are no ligands in this entry.
5.7 Other polymers iO
There are no such residues in this entry.
5.8 Polymer linkage issues iO
There are no chain breaks in this entry.
Page 12 Full wwPDB X-ray Structure Validation Report 6FPT
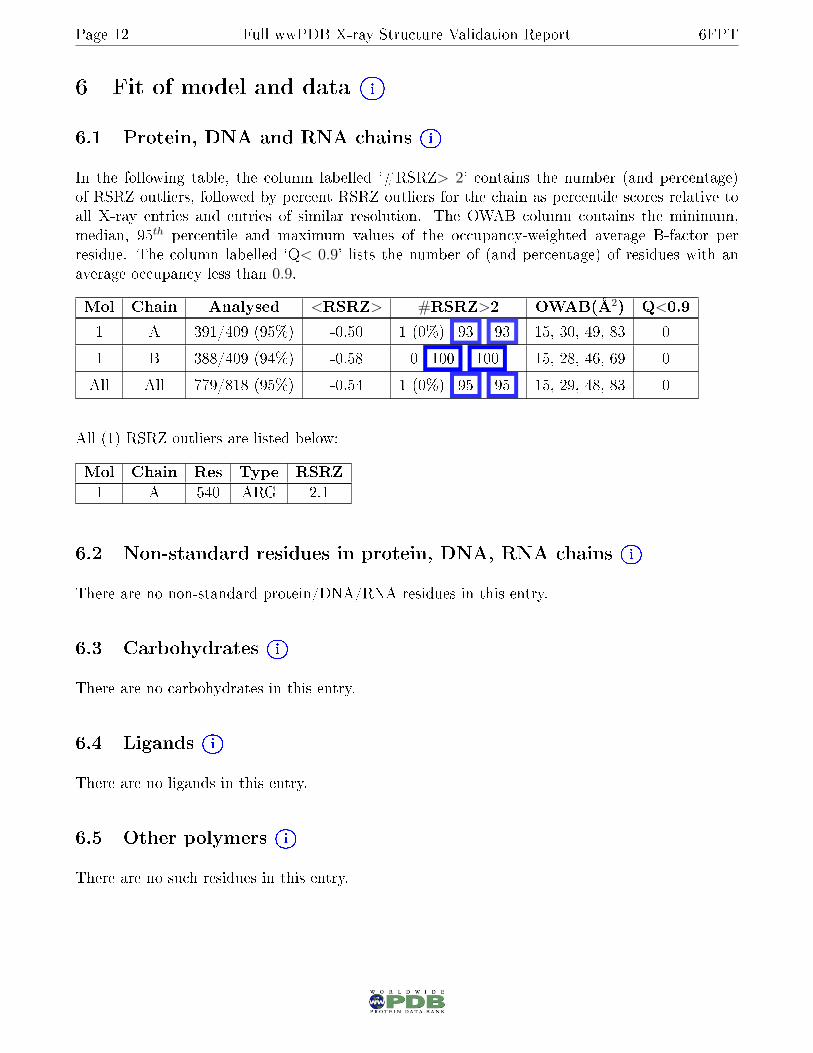
6 Fit of model and data iO
6.1 Protein, DNA and RNA chains iO
In the following table, the column labelled `#RSRZ> 2' contains the number (and percentage)of RSRZ outliers, followed by percent RSRZ outliers for the chain as percentile scores relative toall X-ray entries and entries of similar resolution. The OWAB column contains the minimum,median, 95th percentile and maximum values of the occupancy-weighted average B-factor perresidue. The column labelled `Q< 0.9' lists the number of (and percentage) of residues with anaverage occupancy less than 0.9.
Mol Chain Analysed <RSRZ> #RSRZ>2 OWAB(Å2) Q<0.9
1 A 391/409 (95%) -0.50 1 (0%) 93 93 15, 30, 49, 83 0
1 B 388/409 (94%) -0.58 0 100 100 15, 28, 46, 69 0
All All 779/818 (95%) -0.54 1 (0%) 95 95 15, 29, 48, 83 0
All (1) RSRZ outliers are listed below:
Mol Chain Res Type RSRZ1 A 540 ARG 2.1
6.2 Non-standard residues in protein, DNA, RNA chains iO
There are no non-standard protein/DNA/RNA residues in this entry.
6.3 Carbohydrates iO
There are no carbohydrates in this entry.
6.4 Ligands iO
There are no ligands in this entry.
6.5 Other polymers iO
There are no such residues in this entry.