full citation: marull, joan, joan pino, and enric tello
TRANSCRIPT

Full citation: Marull, Joan, Joan Pino, and Enric Tello. "The Loss of Territorial Efficiency:
An Ecological Analysis of Land-Use Changes in Western Mediterranean
Agriculture (Vallès County, Catalonia, 1853–2004)." Global Environment 2
(2008): 112–50. http://www.environmentandsociety.org/node/4594.
First published: http://www.globalenvironment.it.
Rights: All rights reserved. Made available on the Environment & Society Portal for
nonprofit educational purposes only, courtesy of Gabriella Corona, Consiglio
Nazionale delle Ricerche / National Research Council of Italy (CNR), and XL
edizioni s.a.s.

ur civilization is constantly conducting large-scale experiments that could be used more often than they actually are to develop the foundations of a disturbance ecology. […] Man becomes very powerful by using external energy to move materials, especially along the horizontal plane. Horizontal transport destroys the mosaic of patches that could each have its own independent development. […] Man cre-ates systems to control and amplify l ows of external energy that become more and more O
The Loss of Landscape Efficiency:
An Ecological Analysis of Land-Use
Changes in Western
Mediterranean Agriculture
(Vallès County, Catalonia, 1853-2004)*
Joan Marull, Joan Pino, Enric Tello
GE113
powerful. […] By looking at energy subsidies we can gain a better understand-ing of the role that external energy plays in ecosystems.
Ramon Margalef, Teoría de los sistemas ecológicos, 1993.
Research aims and theoretical background: Why the traditional agrarian mosaics were so suited to biodiversity
h e aim of this study is to verify, by means of a diachronic use of various landscape ecology indices, that the huge increase in external energy expended by the agrarian systems following the “green revo-lution” in the second half of the twentieth century, together with the drastic reduction in their ei ciency, are closely related to the land-use changes that have brought about the degradation of the traditional Mediterranean landscapes, characterized as they were by agricultural and forest mosaics. h e need to resort to external biophysical l ows and the abandonment of integrated land-use management has led to the loss of the ecological functionality of the whole land matrix.
Ramon Margalef, the Catalan ecologist, contributed greatly to clarifying the theoretical basis for our understanding of the fact that the sustainability of human development is a direct function of its complexity, and an inverse function of its dissipation of energy. In the biosphere an increase in entropy is associated with the acquisition of complexity, owing to the fact that living systems draw on solar radia-
* h is study is part of a wider research project entitled Hidden Sides of Economic Development. Energy, Land Use And Global Change in the Western Mediterranean Region (SEJ2006-15108-C02-01/GEOG) directed by Enric Tello at the University of Barcelona, and i nanced by the Spanish Ministry of Education and Science with ERDF funds. A preliminary version was published in J. Marull, J. Pino, E. Tello, J. M. Mallarach, “Análisis estructural y funcional de la transformación del paisaje agrario en el Vallès durante los últimos 150 años (1853-2004). Relaciones con el uso sostenible del territorio”, in Áreas, 25, 2006, pp. 59-72, where a detailed dei ni-tion of the Landscape Metrics Index and the Ecological Connectivity Index can be found, together with the methods used for assessing them with a GIS accounting of the historical cadastral maps and aerial photographs (forthcoming on line, http://digitum.um.es/dspace/handle/10201/3). We thank the reviewers of Global Environ-ment for their suggestions that have helped improve the i nal version of this article.

RESEARCH ARTICLES / MARULL, PINO, TELLO 114
tion as if – to quote Margalef – from a sort of “thermodynamic sav-ings account book”. An additional mechanism thus supplements what would otherwise be mere dissipation of energy, a mechanism “which uses this energy to increase information, add complexity to life, and write history”.1 his is how, in nature, entropy combined with in-formation increases diversity: the topological contrasts of the Earth’s surface, together with the internal hierarchy of energy lows and infor-mation within the ecosystems, generate distinct land structures where more mature and less productive spaces, which tend to be more stable and predictable, exploit the simpler ones, which tend to be more pro-ductive, luctuating and unpredictable, and in which more energy is dissipated. “Exploit” in this context should be understood to mean that energy lows from the borders of the simplest organisms to the more complex ones, where more information is accumulated.2
Human exploitation of the environment can be understood as “disturbance ecology”.3 When the increase in dissipated energy
1 Margalef developed this approach as a corollary of his principle that suc-cession in ecosystems evolves towards more mature and complex stages, where biomass production per unit of time decreases. See R. Margalef, Our biosphere, Ecology Institute, Oldendorf/Luhe 1997; K. Matsuno, “Evolution of dissipative system: a theoretical basis of Margalef ’s principle on ecosystem”, in Journal of heoretical Biology, 70, 1, 1978, pp. 23-31.
2 R. Margalef, Teoría de los sistemas ecológicos, Publicacions de la Universitat de Barcelona, Barcelona 1993, pp. 79-103; id., “Ecological heory and Prediction in the Study of the Interaction between Man and the Rest of Biosphere”, in Ökologie und Lebensschutz in Intrenationaler Sicht, H. Siolo (ed.), Rombach, Freiburg 1973, reprinted in Catalan, Spanish and English in Medi Ambient. Tecnologia i Cul-tura, 38, 2006, pp. 114-25, http://mediambient.gencat.net/cat/el_departament/revista/38/sumario_ingles.jsp).
3 he term ‘disturbance ecology’ is commonly used in a wider sense, referring to any discrete natural or anthropogenic event in time and space that might alter the structure of populations, communities, and ecosystems, and/or change resources, substrate availability, or the physical environment. Following Margalef ’s insights we apply it in a more speciic sense, and one that is increasingly being used in Long-term Socio-ecological Research (LTSER) or Sustainability Science, in relation to the forming of cultural landscapes that function as ‘frozen processes’ taking place in humanized territories. In order to maintain these ‘culturally-frozen’ landscape patterns and ecological processes, a society needs to spend certain amounts of hu-

GE115
reduces the complexity of the system, environmental degradation becomes its most tangible evidence. By contrast, the human adap-tations to the environment that have proven to be the most long-lasting are those that have been able to reproduce the basic reticular pattern of ecosystems by means of exosomatic energy and appro-priate technologies. According to Margalef, the traditional agrarian mosaics of Europe were an example of good human exploitation of nature because the productive role of the simpler and energy-dissipating spaces combined with the protective function performed by the more mature and internally diversii ed spaces.4
Fernando González Bernáldez, a pioneer of landscape ecology in Spain, also pointed out that the traditional rural world tends to maintain a certain equilibrium between exploitation and conserva-tion by applying dif erent gradients of human intervention within
man labour and/or physical work that can be accounted for as ‘external’ energy. h e impact on biodiversity of this landscape ‘disturbance ecology’ may be either positive or negative depending on its intensity and territorial shape. Owing to the ecologi-cal hypothesis regarding the role of ‘intermediate disturbance’ in ecosystems, cul-tural landscapes may increase environmental resilience. See A. Farina, “h e Cultural Landscape as a Model for the Integration of Ecology and Economics”, in BioScience, 50, 4, 2000, pp. 313-320; R.W. Kates, W.B. Clark; R. Corell, J.M. Hall, C.C. Jaeger, I. Lowe, J.J. McCarthy, H.J. Schellnhuber, B. Bolin, N.M. Dickinson, S. Faucheux, G.G. Gallopin, A. Grüber, B. Huntley, J. Jäger, N.S. Jodha, R.E. Kasper-son, A. Mabogunje, P. Matson, H. Mooney, B. Moore III, T. O’Riordan, U. Svedin, “Sustainabilty Science”, in Science, 292, 2001, pp. 641-2; T. Wrbka, K.H. Erb, N.B. Schulz, J. Peterseil, Ch. Hahn, H. Haberl, “Linking pattern and process in cultural landscapes. An empirical study based on spatially explicit indicators”, in Land Use Policy, 21, 2004, pp. 289-306; J. Peterseil, T. Wrbka, C. Plutzar, I. Schmitzberger, A. Kiss, E. Szerencsits, K. Reiter, W. Schneider, F. Suppan, H. Beissmann, “Evaluat-ing the ecological sustainability of Austrian agricultural landscapes − the SINUS approach”, in Land Use Policy, 21, 3, 2004, pp. 307-320; H. Haberl, V. Winiwarter, K. Andersson, R.U. Ayres, C. Boone, A. Castillo, G. Cunfer, M. Fischer-Kowal-ski, W.R, Freudenburg, E. Furman, R. Kaufmann, F. Krausmann, E. Langthaler, H. Lotze-Campen, M. Mirtl, C.L. Redman, A. Reenberg, A.Wardell, B. Warr, H. Zechmeister, “From LTER to LTSER: Conceptualizing the Socioeconomic Dimen-sion of Long-term Socioecological Research”, in Ecology and Society, 11, 2: 13, 2006, http://www.ecologyandsociety.org/vol11/iss2/art13/.
4 Margalef, “Ecological h eory and Prediction” cit., p. 114-125; Farina, “h e Cultural Landscape” cit., pp. 314-316.

RESEARCH ARTICLES / MARULL, PINO, TELLO 116
the land matrix.5 Now we know that “this mosaic has been proved and turned out to be a very efective instrument for conservation”.6 his discovery is signiicant, as the landscape degradation and the introduction of anthropogenic barriers are currently bringing about a topological inversion of humanized nature, where “the domesticat-ed network becomes continuous and more powerful” in the overall land matrix, whereas “the remaining part of the landscape becomes almost residual”.7 Using this theoretical basis as our starting-point, we seek to explore the hypothesis that throughout the historical in-teraction between societies and nature there has always been a close link between the use of energy, land-use management, and the land-scape ecology of humanized territories. From this socio-ecological point of view, landscape can be seen as the expression of the metabo-lism that any society maintains with natural systems.8
5 F. González Bernáldez, “Western Mediterranean land-use systems as anteced-ents for semiarid America”, in Global Land Use Change, B.L. Turner (ed.), CSIC, Madrid 1995, pp. 131-149.
6 Margalef, “Ecological heory and Prediction” cit., p. 125; Farina, “he Cul-tural Landscape” cit., p. 313-320.
7 R. Margalef, “Acelerada inversión de la topología de los sistemas epiconti-nentales humanizados”, in La incidencia de la especie humana sobre la faz de la tierra (1955-2005), J.M. Naredo, L. Gutiérrez (eds), Universidad de Granada/Fundación César Manrique, Granada 2005, p. 217-219.
8 Landscape may be deined from many points of view depending on the dis-cipline. See A.P.A. Vink, Landscape Ecology and Land Use, Longman, New York 1983. From a landscape ecology standpoint, landscapes can be regarded as systems that form territorial entities on the Earth’s surface through the activity of the rocks, water, air, soil, plants, animals −and through the ever-growing transforming capacity of Humanity as well; see S.J. Zonneveld, Land Evaluation and Landscape Science. ITC Textbook of Photointerpretation, International Institute for Aerospace Survey and Earth Science, Enschede 1979. hese complex systems, organized in hierarchical levels of complexity that depend on their space-time scale, are liable to be identiied as heterogeneous areas made up of interrelated ecosystems that are repeated throughout a given area according to a similar pattern, see R.T.T. Forman, M. Gordon, Landscape Ecology, Wiley, Chichester 1986; R.M. May, Eco-logical Concepts, Blackwell, Oxford 1989; R.V. O’Neill, “Perspectives in hierarchy and scale”, in Perspectives in Ecological heory, J. Rougharden, R.M. May, S.A. Levin (eds), Princeton UP, Princeton 1989. Landscape ecology considers a land-scape’s composition and spatial coniguration, together with the properties of its

GE117
A fall in the energy efficiency of the agrarian system
h ree decades ago, pioneering work in energy analysis of economic l uxes revealed a substantial decline in energy yields in contemporary agrarian systems as a result of massive consumption of fossil fuels and other industrial inputs.9 More recently, several studies have reassessed
elements, to be closely related to the physical, biological, ecological, sociological, and economic processes (which is to say, socio-ecological processes) that occur in it, see R.T.T. Forman, Land Mosaics. h e Ecology of Landscape and Regions, CUP, Cambridge 1995; id., “Some general principles of landscape and regional ecol-ogy”, in Landscape Ecology, 10, 1995, pp.133-142. h e landscape structure is, therefore, the result of the functional processes it hosts, though at the same time it also regulates the functioning of these processes, see Forman, Gordon, Land-scape Ecology cit. However, landscape ecology i nds it increasingly dii cult to assess this relationship between the spatial patterns and the functional processes, see P. Opdam, R. Foppen, C. Vos, “Bridging the gap between ecology and spatial plan-ning in landscape ecology”, in Landscape Ecology, 16, 2001, pp. 767-779; H. Li, J. Wu, “Use and misuse of landscape indices”, in Landscape Ecology, 19, 2004, pp. 389-399. Landscape ecology provides a framework for an integrated understand-ing of the land-use and land-cover changes that take place in a territory, by means of new mathematical tools that can analyse the structural and functional changes brought about by progressive anthropogenic transformations.
9 N. Geogescu-Roegen, h e Entropy Law and the Economic Process, Harvard UP, Harvard 1971; id., Energy and Economic Myths: Institutional and Analytical Economic Essays, Pergamon Press, New York 1976; G. Leach, Energy and Food Production, IPC Science and Technology Press, Guildford 1976; D. Pimentel, M. Pimentel, Food, Energy, and Society, Edward Arnold, London 1979; J.M. Naredo, P. Campos, “La energía en los sistemas agrarios”, Agricultura y Sociedad, 15, 1980, pp. 17-114; id., “Los balances energéticos de la agricultura española”, in Agri-cultura y Sociedad, 15, 1980, pp. 163-256; J. Martínez Alier, K. Schlüpmann, Ecological Economics: Energy, Environment and Society, Basil Blackwell, Oxford 1987; J. Martínez Alier (ed.), Los principios de la Economía Ecológica. Textos de PP. Geddes, S. A. Podolinsky y F. Soddy, Fundación Argentaria/Visor, Madrid 1995; J.M. Naredo, La evolución de la agricultura en España (1940-1990), Publicaciones de la Universidad de Granada, Granada 1996; J.M. Naredo, A. Valero (eds), De-sarrollo económico y deterioro ecológico, Fundación Argentaria/Visor, Madrid 1999; O. Carpintero, J.M. Naredo, “Sobre la evolución de los balances energéticos de la agricultura española, 1950-2000”, in Historia Agraria, 40, 2006, pp. 531-554; X. Cussó, R: Garrabou, E. Tello, “Social metabolism in an agrarian region of
RESEARCH ARTICLES / MARULL, PINO, TELLO 118
the role of traditional agrarian practices and know-how in ensuring certain sustainable strategies of forest management and the conser-vation of agricultural landscapes.10 However, the role played by en-ergy and material lows generated by social metabolism as a driving force of contemporary land-use changes is still not well understood. his study, therefore, seeks to strengthen the dialogue between both lines of research: economic-ecological accounts of energy and material lows, on the one hand, and the assessment of land-use changes seen from the perspective of landscape ecology, on the other.11
In order to highlight this societal link between energy or material throughputs and land-use change, we introduce here the concept of “landscape eiciency”, understood as a way of improving the socio-economic satisfaction of human needs while maintaining the healthi-est landscape ecological patterns and processes, so as to ensure that the natural resources and environmental services ofered by the land matrix continue to be enjoyed. Here we do not use the term “ei-ciency” with its usual narrow sense, as in economic geography, but rather in a wider ecological-economic sense, closer in this respect to the idea of “eco-eiciency”. Mainstream economists typically speak of a “production possibilities frontier”; perhaps, we might start exploring
Catalonia (Spain) in 1860-70: lows, energy balance and land use”, in Ecological Economics, 58, 2006, pp. 49-65.
10 Farina, “he Cultural Landscape” cit., p. 313-320; M. Agnoletti (ed.), he Conservation of Cultural Landscapes, CABI, Wallingford/Cambridge MA 2006; J. Parrotta, M. Agnoletti, E. Johann (eds), Cultural heritage and sustainable forest management: he role of traditional knowledge, 2 vols, Ministerial Conference for the Protection of Forest in Europe/IUFRO, Warsaw 2006.
11 F. Krausmann, H. Haberl, N.B. Schulz, K.-H. Erb, E. Darge, V. Gaube, “Land-use change and socio-economic metabolism in Austria, Part I: driving forces of land-use change 1950-1995, in Land Use Policy, 20, 1, 2003, pp. 1-20; H. Haberl, K.-H. Erb, F. Krausmann, H. Adensam, N.B. Schulz, “Land-use change and socio-economic metabolism in Austria. Part II: land-use scenarios for 2020”, in Land Use Policy, 20, 2003, pp.21-39; H. Haberl, M. Wackernagel, T. Wrbka, in “Land use and sustainabil-ity indicators. An introduction”, Land Use Policy, 21, 3, 2004, pp. 193-198; H. Haberl, M. Fischer-Kowalski, F. Krausmann, H. Weisz, V. Winiwarter, “Progress towards sus-tainability? What the conceptual framework of material and energy low accounting (MEFA) can ofer”, in Land Use Policy, 21, 3, 2004, pp. 199-213; Wrbka et al., “Link-ing pattern and process” cit., pp. 289-306; Haberl et al., “From LTER to LTSER” cit.

GE119
the notion of a “frontier of ecological possibilities” and ask ourselves whether the short-term advance of the former might entail a medium and long-term retreat of the latter. h is is typically what occurs when societies enter a period of unsustainable development, but it does not necessarily have to work this way. h e frontier of human production-possibilities can be pushed ahead without rel ecting negatively on short, medium, and long-term ecological possibilities. h e eventual outcome is a matter of social choice, including the set of ecological possibilities that human societies wish to preserve or enhance.
Ecosystems do not make choices; they merely evolve. Ramon Margalef was at frequent pains to remind us that in the interaction between nature and society most so-called “ecological” problems are “human, and very human indeed”.12 h e new Long-term Socio-eco-logical Research strategy (LTSER) sees human societies as engaged in a co-evolutionary and interactive process with their natural systems, rather than treating them as any other species that simply creates a disturbance in the ecosystem.13 A key factor in determining whether human development will be achieved while preserving, improving, or degrading the ecological systems are the land-use choices made by societies. It is for this reason that we have chosen the term “land-scape ei ciency” to describe the historical relationship between soci-etal land-use patterns and the ecological processes that may or may not be at work in the territory. h ere can be no doubt that landscape ei ciency is a necessary condition for sustainable development.
h e studies that we have carried out in the Vallès county of Cata-lonia (Map 1) coni rm that the energy balance of current agrarian systems has a large dei cit compared with the situation around 1860: back then, each unit of energy invested yielded 1.7 units of energy, whereas in 1999-2004 the yield had dropped to 0.2. In other terms,
12 R. Margalef, Widening vistas: toward an Ecology tailored to our problems, Fundación César Manrique, Lanzarote/Madrid 1996.
13 H. Haberl, “h e Energetic Metabolism of Societies. Part I: Accounting Concepts”, in Journal of Industrial Ecology, 5, 1, 2001, pp. 107-136; id., “h e Energetic Metabolism of Societies. Part I: Empirical Examples”, in Journal of In-dustrial Ecology, 5, 2, 2001, pp. 53-70; id., “h e global socioeconomic energetic metabolism as a sustainability problem”, in Energy, 31, 2006, pp. 87-99.

RESEARCH ARTICLES / MARULL, PINO, TELLO 120
Maps 1. Location of the five municipalities in the study area (West and East Vallès Counties in the Province of Barcelona, Catalonia and Spain)
The study area in the Province
of Barcelona and Catalonia
The Province of Barcelona
and Catalonia in Spain
today one must spend 4.5 units of any type of energy to produce 1 unit of biomass energy (Table 2).14 his comparison between current practices of energy and land-use management with those of 1860 also reveals that the dramatic increase in external inputs and signiicant losses in energy transformations in the agrarian system are closely connected to major processes of land-use change: viz., the growing functional segregation between crops, livestock and woodland. In other words, the agrarian system has become so energetically inef-icient during the fossil fuel era principally because of its land-use ineiciency.15 Moreover, this ineiciency has become a major driving
14 X. Cussó, R. Garrabou, J.R. Olarieta, E. Tello, “Balances energéticos y usos del suelo en la agricultura catalana: una comparación entre mediados del siglo XIX y inales del siglo XX”, in Historia Agraria, 40, 2006, pp. 471-500.
15 E. Tello, R. Garrabou, X. Cussó, “Energy Balance and Land Use: the Mak-

GE121
force towards landscape degradation – together with urbanization and the spread of industrial sites and transport facilities.
Energy inefficiency and ecological degradationas a result of landscape inefficiency
h e deterioration in the agrarian system’s energy yield following the “green revolution” stems, in the i rst place, from a consump-tion of external inputs that can be as high as 135 GJ/hectare, while the mean photosynthetic i xation of solar energy over the vegetation cover of our area of study is only 34 GJ/hectare. h is represents an input of external energy four times greater than the primary produc-tion of the agro-ecosystem. However, if we break this enormous l ow
ing of an Agrarian Landscape from the Vantage Point of Social Metabolism”, in Agnoletti, h e Conservation of Cultural Landscapes cit., p. 42-56.
Table 2. Summary of the energy balance of the agrarian system in our case study of the Catalan Vallès county around 1860 and in 1999-2004 (thousands of GJ/year or GJ/hectare)
towards 1860 in 1999-2004
Useful agrarian cover (UAC) cropland pastureland woodland cropland woodland, pasture
Primary solar energy, fixed 146.3 GJ 34.4 GJ 87.2 GJ 187.3 GJ 211.0 GJ
a mean 22.4 GJ/ha of UAC a mean 34.1 GJ/ha of UAC
crops livestock forestry crops livestock forestry
Final output by sector (FO) 38.6 GJ 2.9 GJ 129.5 GJ 135.9 GJ 144.5 GJ 69.1 GJ
Livestock weight units (LU) 983 LU of 500 Kg (41 Kg/ha) 23,833 LU500 (1,021 Kg/ha)
Cattle feed 68.7 GJ (5.7 GJ/ha) 1,095.7 GJ (103 GJ/ha)
Manure or fertilizers 23.9 GJ (2 GJ/ha) 55.5 GJ (4.7 GJ/ha)
Total inputs consumed (TIC) 102.4 GJ (8.5 GJ/ha) 1,625.8 GJ (139.1 GJ/ha)
External inputs consumed (EIC) 6.6 GJ (0.2 GJ/ha) 1,574.4 GJ (134.9 GJ/ha)
Total final output (TFO) 171.0 GJ (14.3 GJ/ha) 349.5 GJ (29.9 GJ/ha)
Energy return on total inputs (EROTI = TFO/TIC) 1.67 0.21
Energy return on external inputs (EROEI = TFO/EIC) 66.6 0.22
% of TFO/primary solar energy fixed in UAC 64% 88%
% of EIC/primary solar energy fixed in UAC 1% 395%
Source: our own summary in Cussó, Garrabou, Olarieta and Tello (2006:471-500). All the ratios per hectare are referred to the total useful agrarian cover (UAC = cropland + pastureland + woodland). Forestry output in 1860 includes pruning.

RESEARCH ARTICLES / MARULL, PINO, TELLO 122
Table 3. Composition of the external energy inputs inve-sted by the agrarian system in the study area of the Cata-lan Vallès county in 1999-2004
of foreign energy down into its main components we discover that imported cattle feed accounts for two thirds of it, and that this is out of all proportion with the available grazing land, local fodder crops, or the capacity of the soil to absorb the dung (Table 3).
Hence, the overriding feature of the agrarian system’s energy bal-ance is a land-use disintegration from the surrounding landscapes. Agricultural metabolism has become integrated into a new globalized land system. Its main energy lows run through the local landscape as if this were now no more than an inert platform, without induc-ing any integrated connection between its agricultural, pastureland or woodland patches. his functional breaking away of social me-tabolism from the surrounding landscapes occurs not only by excess, but by defect as well. On the one hand, the inal agricultural output of some 36 GJ per cultivated hectare requires an expenditure of die-sel oil, electricity, fertilizers, and other chemicals in excess of 45 GJ/hectare, which brings the energy yield of the crop below one unit. On the other hand, to maintain a livestock density of one ton of live weight per hectare entails having to import as feed the equivalent of two and a half times the biomass that the land can yield through photosynthesis. he introduction of the livestock input and output in the balance reduces the overall energy yield to an index of 0.2.
thousand
GJ/year
%
of total
external
inputs
GJ/ha
input inflow compared
with the total biomass
production in the UAC
Cattle feed imported 1,044,331 66.36 89.50 2.622
Oil, gas and electricity 493,716 31.37 42.31 1.239
Fertilizers, herbicides and chemicals 27,794 1.77 2.38 0.070
Seeds 7,492 0.48 0.64 0.019
Human labour 430 0.03 0.04 0.001
TOTAL EXTERNAL INPUTS 1,573,763 100.00 134.87 3.951
Total biomass produced in the UAC 398,335 -- 34.14 1.000
Source: our own summary taken from Cussó, Garrabou, Olarieta and Tello (2006:471-500). Useful agrarian cover (UAC) = cropland + pastureland + woodland.

GE123
While this dei cit accumulates in the more intensively cropped ar-eas, two thirds of the biomass produced by derelict woodland is not used at all. h is year-on-year accumulation of some 18 GJ/hectare of residual wooden biomass grown on abandoned cropland eventually becomes the fuel pyre that is set ablaze in the next forest wildi re.16
Following Margalef ’s indication that by “looking at energy subsi-dies we can gain a better understanding of the role that external energy plays in ecosystems”, we seek to understand the historical relationship between the transformation undergone by a cultural landscape, its driving forces, and the loss of this landscape’s ecological functionality. We wish to employ a cross-disciplinary approach to test the following hypothesis: a remarkable loss of landscape ei ciency, closely associated with the deterioration of the ecological landscape structure, under-lies the decrease in agrarian systems’ energy yield following the “green revolution”, as well as the contemporary crisis faced by a rural world that has lost its age-old capacity of land-use management.
In the past, agrarian societies exploited their land in dif erent gra-dients of intensity, striving all the while to maintain an integrated landscape management, as their very subsistence depended on this. People not only lived on the land but of the land they inhabited. h e only way to of set the high energy losses caused by inei cient ani-mal bioconversion, on which societies were heavily dependent for obtaining draught power and manure, was to ensure the ei cient in-tegration of cropland, pastureland, and woodland areas.17 h us, past organic agrarian systems were energy ei cient largely because rural communities managed their land ei ciently. A healthy landscape ecology was therefore a side-ef ect of this land-use ei ciency, at least until population growth, together with increasing commercial ties and urbanization, raised the human pressure on the land well be-yond certain critical thresholds, leading to landscape degradation.
16 A.T. Grove, O. Rackham, h e Nature of Mediterranean Europe. An Ecological History, Yale U.P., New Haven/London 2001, pp. 217-240.
17 F. Krausmann, “Milk, Manure and Muscular Power. Livestock and the In-dustrialization of Agriculture”, in Human Ecology, 32, 6, 2004, pp. 735-773; H. Haberl et al., “Progress towards sustainability” cit., pp. 199–213.

RESEARCH ARTICLES / MARULL, PINO, TELLO 124
Any social metabolism based on solar energy is always area-de-pendent in a local or bio-regional sense. his means that in traditional agrarian systems there would have been a strong and almost immedi-ate feedback between failures of land or energy management strategies, and the wellbeing of the rural population. his explains why in these organic-based economies, which relied almost exclusively on photo-synthesis to grow everything, the greater the density of population and trade became, the more important it was to manage the land-use system with the highest landscape eiciency. he large-scale exploita-tion of underground fossil fuels has enabled agrarian systems to over-come this age-old dependence on animal bioconversion, and hence integrated land management has ceased to be a necessity.18 However, should the loss of this age-old necessity entail forgetting its utility? Both changes – the loss and the forgetting – have gone hand in hand, but this does not necessarily imply that one was a necessary consequence of the other. Adequate land-use management, combined with sound regional or urban planning, might have prevented traditional rural communities’ abandonment of their land management strategies from leading to overall landscape ineiciency. his historical point requires clariication, since today the ecological degradation brought about by the prolonged neglect of integrated land management appears to urge us to strive to regain our past landscape eiciency, albeit within a difer-ent economic and environmental context.19
18 R.P. Sieferle, he Subterranean Forest. Energy Systems and the Industrial Revo-lution, he White Horse Press, Cambridge 2001; R.P. Sieferle, F. Krausmann, H. Schandl, V. Winiwarter, Das Ende der Fläche. Zum gesellschaftlichen Stofwechsel der Industrialisierung, Böhlau Verlag, Cologne/Weimar/Vienna 2006; M. Fischer-Kow-alski, H. Haberl, Socioecological Transitions and Global Change. Trajectories of Social Metabolism and Land Use, Edward Elgar, Cheltenham/Northampton 2007.
19 Farina, “he Cultural Landscape” cit., p. 313-20; Cussó et al., “Social Me-tabolism” cit., p. 49-65; Agnoletti, he Conservation of Cultural Landscapes cit.; E. Tello, R. Garrabou, J.R. Olarieta, X. Cussó, “From integration to abandonment. Forest management in the Mediterranean agro-ecosystems before and after the ‘green revolution’ (he Vallès County. Catalonia, Spain, 1860-1999)”, in Parrotta et al., Cultural Heritage cit., pp. 339-346.

GE125
Maps 4. Main land-use changes in four municipalities of the study area (Caldes de Montbui, Castellar del Val-lès, Polinyà and Sentmenat) during the last 150 years (1853-2004).
Source: made with GIS by Marc Badia-Miró (UB), Oscar Miral-les and Anna Carreras (SITEM) for the research project SEJ2006-15108-C02-01/GEOG, from the historical cadastral maps kept in the ICC, ACA and other regional ar-chives, the Rural Cadastral Service in the Province of Barcelona, and the digital topographic maps of Ca-talonia. We thank the Catalan Car-tographic Institute (ICC) for giving us permission to use the historical cadastral maps of Castellar del Vallès (1854) and Polinyà (1856) made by Pedro Moreno Ramírez, that are kept in the ICC archive.

RESEARCH ARTICLES / MARULL, PINO, TELLO 126
Methodology and indices used to assess land-use changes in the Vallès study areaover the last 150 years: A landscape ecology perspective
Maps 4 have been drawn using a GIS processing of the cadas-tral topographic elevations of 1853-56 and 1954-56 – recorded in documents kept in various historical archives – alongside digitally mapped satellite images of ive municipalities in the Catalan county of the Vallès, taken in 1999-2004. A simple visual comparison re-veals a dramatic increase of landscape simpliication from the mid 19th century to the present day. We clearly need to examine the role played in the study area by the disintegration of cropping, livestock breeding, and agroforestry, by the regrowth of woods on currently abandoned terraced slopes, and by urban expansion. Table 5 shows the main land-use changes that have taken place in the ive munici-palities over the three time periods analysed. Between the 1860s and the 1950s, the most signiicant transformation was the reduction of
Table 5. Main land-uses in the five municipalities of the Vallès study area in the 1860s, 1950s and 1999-2004, ac-cording to available cadastral records
1860s 1950s 1999-2004
Land-uses/periods hectares % hectares % hectares %
Irrigated orchards 300.9 2.4 538.5 4.2 123.0 0.9
Cereal land 1,665.7 13.4 2,459.2 19.4 3,130.3 23.3
Vineyards 3,147.8 25.3 1,252.6 9.9 62.0 0.5
Olive trees 432.9 3.5 391.4 3.1 224.0 1.7
Almond, hazelnut and other trees 179.2 1.4 583.4 4.6 205.6 1.5
TOTAL CROPLAND 5,726.5 46.0 5,225.1 41.1 3,744.9 27.8
Woodland and brushes 3,624.4 29.1 6,967.5 54.8 7,097.0 52.7
Pasture and wasteland 2,636.2 21.2 253.5 2.0 827.0 6.1
Unproductive and urbanized land 470.7 3.8 258.1 2.0 1,794.0 13.3
TOTAL LAND ACCOUNTED 12,457.8 100.0 12,704.2 100.0 13,462.9 100.0
Source: our own summary of information collected from the cadastral records in the Archive of the Crown of Aragon (ACA), concerning the municipalities of Caldes de Montbui, Castellar del Vallès, Palau-solità i Plegamans and Sentmenat in the 1860s and 1950s. For 1999-2004, we used data from the Rural Cadastral Service of the Province of Barcelona and IDESCAT statistics (http://www.idescat.net/en/).

GE127
the area of land given over to vineyards in favour of cereals, hazelnut trees, irrigated orchards, woodland, and pasture. h e overall area devoted to cropland only fell from 46 to 41% of the total area with-in this period. By contrast, with the wide-scale introduction of the ‘green revolution’ half a century later, the area dedicated to cropland fell to just 28%, while there was a massive increase in the reforesting of abandoned land and a great expansion of urbanized areas.
Land-use change matrixes obtained by means of a GIS cover-inter-section of the above-mentioned historical cadastral maps coni rm that the most signii cant transformation that took place between 1853-56 and 1954-56 was the abandonment and reforesting of some 2,423 hectares of what had previously been cropland (27% of the total area suitable for crops) following the late nineteenth-century agrarian crisis, which led to the creation of a single world market for agrarian products. It was primarily the land given over to vineyards (some 1,539 hectares) that was not replanted after the devastating phylloxera plague, followed by cereal land (445 hectares), pasture (226 hectares), olive trees (116 hectares), and irrigated orchards (20 hectares). Urban expansion re-mained very modest and the agrarian landscape mosaic was maintained on the cultivated l atland. Between 1954-56 and 1999-2004, instead, the main change was the allocation of all of 1,947 hectares for urban expansion (16% of the useful agrarian area). Two thirds of this area was obtained at the expense of cultivated land, the rest of woodland and pastures. A further 646 hectares of abandoned cultivated land (5%) were reforested. As a result of this process, crops were concentrated on the area’s l atter and more easily irrigated land, causing the destruction of the earlier polycultural Mediterranean mosaic.
Below we employ various landscape ecology concepts and indica-tors to analyse the environmental impact of this transformation on the vegetation cover of the Vallès county from the mid-nineteenth century down to the present day. Parallel to this, we seek to test the application of two new socio-ecological indices, originally de-veloped to analyze the metropolitan area of Barcelona, to historical cadastral maps and aerial photography, as a means to measure the loss of landscape ei ciency and environmental quality caused by the destruction of the traditional Mediterranean agrarian mosaics.
RESEARCH ARTICLES / MARULL, PINO, TELLO 128
Hundreds of indicators have been developed to measure land-scape structures.20 hey include rather complex mathematical op-erators evaluating speciic aspects of the composition and spatial coniguration of a landscape, along with the size, shape, and spatial distribution of its elements, i.e., the patches of which it is made up.21 As a rule, structural indicators, closely relecting the physical properties of the landscape, can be distinguished from functional indicators, which are linked more speciically to the processes taking place in them.22 Here we combine these two approaches to analyse land-use changes in the agrarian landscape of our study area. We irst adopted an exclusively structural approach for three municipal districts (Caldes de Montbui, Castellar del Vallès and Polinyà), en-tailing the calculation of various landscape indicators typically em-ployed in classical ecology. We then adopted a functional approach over a more extensive rectangular area including all the municipal districts in our study area. his approach involved the application of the socio-ecological indices recently developed in the studies dis-cussed above. By adopting this approach we assumed a certain risk, given that these new parameters are used here for the irst time in a comparative historical study of the structural functioning of difer-ent agrarian landscapes. herefore, in order to conirm the results provided by these new indicators, we adapted the matrixes used in the calculations and the constants introduced in the mathemati-cal models to allow us to carry out three diferent temporal cross-sectional assessments of land-use patterns, and the corresponding
20 K. McGarigal, B.J. Marks, Fragstats: spatial pattern analysis program for quantifying landscape structure, Gen. Tech. Report PNW-GTR-3521, USDA Forest Service, Paciic Norwest Research Station, Portland 1995; E.J. Gustafson, “Quantifying landscape spatial pattern: what is the state of the art?”, in Ecosystems, 1, 1998, pp. 143-156.
21 M.G. Turner, “Landscape Ecology: he efect of pattern on process”, in An-nual Review of Ecological System, 20, 1989, pp. 171-197; D. Colville, “Ecological landscape analysis using GIS”, in Landscape ecology in land use planning. Methods and practice, G. Domon, J. Falardeau (eds), Canadian Society for Landscape Ecolo-gy and Management/Polyscience Publications Inc., Morin Heights (Canada) 1995.
22 J. Aronson, E. Le Floc’h, “Vital landscape attributes: missing tools for resto-ration ecology”, in Restoration Ecology, 4, 1996, pp. 377-387.

GE129
changes in these patterns over time. h us, in addition to providing empirical results, this paper presents a novel methodology for the study of long-term historical changes in cultural landscapes.23
Structural and functional approaches
We carried out a landscape structural analysis of three periods: 1853-56, 1954-56 and 2004. For each period, we drew directly com-parable land cover maps based on the cadastral information (Maps 4). We then calculated structural metrics for the original maps, and also further rated their units into classes of naturalness obtained by reclassifying land cover categories according to degrees of anthro-pogenic disturbance: 1, natural (well-preserved natural habitats); 2, semi-natural (disturbed natural habitats and formerly abandoned i elds); 3, agricultural (crops and recently mowed areas); and 4, set-tlements, industrial areas, transport infrastructure, and other arti-i cial land cover categories.24 h is second approach enabled us to identify standards of landscape change for a very high level of aggre-gation of land units. For the original maps, two widely used metrics of landscape ecology were used, diversity and fragmentation, both calculated for each municipal district and cross-section.
i) Land cover diversity. h is parameter dei nes landscape heteroge-neity as a system made up of dif erent, disconnected, and frequently contrasting elements.25 To evaluate diversity one must identify land cover varieties and record their distribution and spatial abundance. Diversity is a frequently used measure in community ecology for es-timating species richness (i.e., the actual number of species present) and their equifrequency (i.e., the relative proportion of each species, in terms of numbers of individuals, covering, etc.). h us, the higher the number of species present, or the more equifrequent they are, the greater the diversity is. Diversity has also been widely used in land-
23 See annexes in Marull et al., “Análisis estructural y functional” cit., pp. 124-126.24 Ibid.25 F. Burel, J. Baudry, Ecología del Paisaje. Conceptos, Métodos y Aplicaciones,
Ediciones Mundi Prensa, Madrid 2002.

RESEARCH ARTICLES / MARULL, PINO, TELLO 130
scape ecology to measure the richness and equifrequency of landscape units (land cover, land uses, habitat, units of vegetation, etc.). In con-trast to indings for communities, there is no clear evidence that a high index of land cover diversity is particularly advantageous for maintaining landscapes as ecologically functioning entities. However, diversity measurements do provide information about the degree of landscape heterogeneity, so here they will be used for this purpose. To calculate land cover diversity, we employed the Shannon-Weaver in-dex, adapted to landscape ecology.26 We also applied the same index to the cover of agricultural land and pastureland.
ii) Ecological fragmentation. Fragmentation is, in general, deined as that process operating at the landscape scale which determines not only the loss of habitat but also its splitting into distinct units.27 Fragmen-tation is an essential component of global change and is believed re-sponsible for major losses in the diversity of species, communities, and ecosystems, deemed comparable to the massive extinctions undergone by the Earth at various moments in its history.28 At the local scale, an increase in fragmentation leads to the loss of adequate habitat for the more demanding species, the so-called inner-habitat specialist species, and their substitution by generalist species or multi-habitat generalist species, which frequently exploit the edges of each habitat. hough fragmentation can be measured in many ways, we have short-listed the following three: a) the mean number of polygons by land cover category, obtained by calculating the quotient between the number of polygons and the number of covers per municipal district and year; b) the total perimeter of the polygons per municipal district and year; c)
26 R.V. O’Neill, J.R. Krummel, R.H. Gardner, G. Sigihara, B. Jackson, D.L. De Angelis, B.T. Milne, M.G. Turner, B. Zygmunt, S.W. Christensen, V.H. Dale, R.L. Graham, “Indices of landscape pattern”, in Landscape Ecology, 1, 3, 1988, pp. 153-162; McGarigal, Marks, Fragstats cit.
27 M. Guirado, Paisatges forestals fragmentats en un entorn humanitzat: efectes de les variables intrínsiques i antròpiques sobre la riquesa i la composició especíica de la lora vascular, Departament de Biologia Animal, Biologia Vegetal i Ecologia, Universitat Autònoma de Barcelona, Cerdanyola del Vallès 2002.
28 P.M. Vitousek, “Beyond global warming: ecology and global change”, in Ecology, 75, 1994, pp.1861-1876.

GE131
the grain size or mean surface of the polygons. In order to establish the naturalness classes, only the diversity of the categories and number of polygons per class was calculated here, following the methodology out-lined above. h e proportion of naturalness classes was also calculated for the given municipal districts and the given periods of time.
h e calculation of landscape function metrics is complex and there are few examples to draw on. One of the main dii culties is that many ecological processes taking place at the landscape scale are not easily mapped. However, a number of proposals have been put forward, based on functional landscape attributes.29 h ese include capability of landscape units to host species and processes as a func-tion of their size, proximity to similar units, and contact between heterogenic units or ecotones. Indeed, connectivity stands out as being one of the most widely used metrics. Some authors consider it a single attribute while others tend to distinguish two aspects: con-nectance and connectivity, where the former refers to connection from a structural point of view (which is to say that it can be calcu-lated on the basis of physical attributes), while the latter describes functional aspects of the connection between landscape elements, such as patterns of organism movement and migration, or the re-sponse of organisms to the presence of barriers. For many species, connectance and connectivity are indeed quite distinct.
Here various indicators are used to assess the ecological function-ing of the land matrix from two points of view: (i) the capability of landscape units to host processes and (ii) their capability to connect with other landscape units in a not completely independent way. h ere is, however, an apparent relationship between these two per-spectives, given that the capability of an area as a habitat depends largely on its connectivity, and vice versa. h ese indicators form part of complex cartographic indices that include the Landscape Metrics Index (LMI) and the Ecological Connectivity Index (ECI), devel-oped by two of the authors of this study for use in strategic environ-mental assessment of plans and programmes.30
29 Aronson, Le Floc’h, “Vital landscape attributes” cit., pp. 377-387.30 J. Marull, J. Pino, J.M. Mallarach, M.J. Cordobilla, “A Land Suitability In-

RESEARCH ARTICLES / MARULL, PINO, TELLO 132
Assessing landscape capability to host habitats for species and ecological processes
Land capacity to host species and processes is assessed here using the Index of Natural Heritage Value, recently developed for the met-ropolitan region of Barcelona.31 his index assesses a given area as a function of four partial indices made up of a total of 18 indicators that measure biological, chorological, and eco-landscape features, along with the environmental and ecosystemic services ofered to society. he methodology we propose has few precedents among the best known conservation initiatives. Its main innovation is its at-tempt at achieving a continuous approximation in natural heritage assessment.32 It has certain methodological features in common with the National Gap Analysis Program developed in the United States, namely, it can be continuous and is based on repeated units, vegeta-tion is considered as the main substitute variable of biodiversity, and it explores predictive models based on indirect variables.33
One of the sub-modules or partial indices that make up the In-dex of Natural Heritage Value is the Landscape Metrics Index. It comprises a suite of indicators related to the structural capability of a given area as a generator of ecological processes.34 he algorithm
dex for Strategic Environmental Assessment in metropolitan areas”, in Landscape and Urban Planning, 81, 2007, pp. 200-212.
31 J. Marull, J. Pino, J. Carreras, A. Ferré, M.J. Cordobilla, J. Llinàs, F. Rodà, E. Carrillo, J.M. Ninot, “Primera proposta d’Índex de Valor del Patrimoni Natural de Catalunya (IVPN), una eina cartogràica per a l’avaluació ambiental estratègica”, in Butlletí de la Institució Catalana d’Història Natural, 72, 2005, pp. 115-138.
32 K. McGarigal, S. Cushman, S.G. Staford, Multivariate Statistics for Wildlife and Ecology Research, Springer-Verlag, New York 2000.
33 A.R. Kiester, M.J. Scott, B. Csuti, R.F. Noss, B. Butterield, K. Sahr, D. White, “Conservation prioritization using GAP data”, in Conservation Biology, 10, 1996, pp. 1332-1342.
34 he Landscape Metrics Index (LMI) measures a region’s capability (as afected by human activities) to support organisms and ecological processes, see Marull et al., “Primera proposta d’Índex del Patrimoni Natural” cit., pp. 115-138. his is calculated on the basis of four indicators basically obtained from GIS accounting: potential for relationships between habitat patches; ecot-

GE133
is calculated as the sum of four indicators: the potential relation between landscape units, the contact heterogeneity between these units, ecological integrity versus anthropogenic environmental im-pact, and vertical complexity of the structure. h is original method-ology has been adapted in order to carry out historical cross-section-al studies based on maps containing simplii ed information about vegetation covers.35 h us, each indicator furnishes a distinct, though complementary, component to the landscape metrics:
i) Potential relation between landscape units. h is parameter is based on the postulates of the ecological theory of islands and its im-plementation on fragmented landscapes.36 h is theory holds that bi-odiversity conservation is related to the size of the habitat fragments and the distances between them. h e indicator aims at quantifying the potential functioning of the habitat by means of an equation, inspired by Newton’s Law of Universal Gravity, which estimates the potential relationships of each polygon.
ii) Contact heterogeneity between landscape units. h e size of the patches of a given habitat is a decisive feature in terms of the hosting of species and ecological processes, though not for edge species that exploit the borders between each habitat (ecotones) or various habi-tats.37 For this reason, the quality of the patches of a habitat should be assessed, though not solely for the species living inside it but also for those that exploit its edges. h erefore, we propose an indica-tor combining information about the species living inside the patch with an assessment of the degree of heterogeneity at the borders of
onic contrast between adjacent habitats; human impact on habitats; and vertical complexity.
LMI = 1 + 9 (γi - γ
min) / (γ
max - γ
min)
Where γi is the sum of the indicators for each point in the region, while γ
min
and γmax
are the minimum and maximum values, respectively, in the study area under consideration.
35 See annexes in Marull et al., “Análisis estructural y functional” cit., pp. 124-126.36 R. McArthur, E.O. Wilson, h e h eory of Island Biogeography, Princeton UP,
Princeton 1967; Forman, “Some general principles” cit., pp. 133-142.37 Ibid.

RESEARCH ARTICLES / MARULL, PINO, TELLO 134
each polygon. We assume the hypothesis that a higher contrast at the margins of the patches allows a signiicant number of diferent species to be hosted.
iii) Ecological integrity of landscape units. Major anthropogenic landscape units, such as settlement areas or transport infrastructure, constitute a major source of disturbance for fragments of natural and semi-natural habitats. Several studies have shown the impact that urban areas and infrastructure have on the composition of lora and fauna and on the structure of the fragments of adjacent wood-land.38 In order to quantify the efect of anthropogenic landscape units on the quality of the other surrounding habitats we propose an indicator that seeks to assess the piercing and adjacency of patches determined by urban settlements and roads.
iv) Vertical complexity of landscape units. he number of species that a given landscape may host depends not only on the number, relative abundance, and spatial coniguration of the habitats of which it is comprised, but also on the relative properties of the structural complexity of these units. As a rule, an increase in biodiversity can be expected with rising vertical complexity, starting from the simplest herbaceous communities up to those that contain more than one tree layer. Moreover, the state of ecological succession of the habitat is assumed to be important for the regulation of species richness.
Assessing the connectivity of the landscape ecology
We assessed the potential of the landscape as a connector of matter, energy, and information between natural systems using a new para-metric model, expressed entirely in mathematical language and devel-oped with a GIS.39 he analysis of ecological connectivity has been the
38 R.T.T. Forman, D. Sperling, J.A. Bissonette, A.P. Clevenger, C.D. Cutshall, V.H. Dale, L. Fahring, L. France, C.R. Goldman, K. Henaue, J.A. Jones, F.J. Swanson, T. Turrentine, T.C. Winter, Road Ecology. Science and Solutions, Island Press, Washington DC 2003.
39 J. Marull, J.M. Mallarach, “A GIS methodology for assessing ecological con-nectivity: application to the Barcelona Metropolitan Area”, in Landscape and Urban

GE135
object of earlier methodological developments in various countries, based primarily on the theoretical postulates of landscape ecology, combined on occasions with more pragmatic approximations.40 Nev-ertheless, most existing methods require a large amount of data that include the distribution of key species.41 By contrast, here we propose a simplii ed holistic model to explain the observed phenomena in the belief that it will be of greater use at the regional scale.42
Our methodology is based on the topological analysis of land-use and facilitates the generation of a diagnosis of the ecological con-nectivity of land ecosystems.43 h is diagnosis is based on the land-scape units to be connected and on a computer model of travel cost distances, which includes the modelled ef ect of anthropogenic bar-
Planning, 71, 2005, pp. 243-262; J.M. Mallarach, J. Marull, “Impact assessment of ecological connectivity at the regional level: recent developments in the Barcelona Met-ropolitan Area”, in Impact Assessment and Project Appraisal, 24, 2, 2006, pp. 127-137.
40 P. Beier, R.F. Noss, “Do Habitat Corridors Provide Connectivity?”, in Con-servation Biology, 12, 6, 1998, pp. 1241-1252; J. Brandt, “Ecological networks in Danish planning”, in Landschap, 12, 3, 1995, pp. 63-76; J. Kubes, “Biocentres and corridors in a cultural landscape. A critical assessment of the ‘territorial system of ecological stability’”, in Landscape and Urban Planning, 35, 1996, pp. 231-240.
41 M. Múgica, J.V. de Lucio, C. Martínez, P. Sastre, J.A. Atauri-Mezquida, C. Montes, Territorial integration of natural protected areas and ecological connectivity within Mediterranean landscapes, Consejería de Medio Ambiente, Junta de Anda-lucía, Sevilla 2002.
42 R.H. Gardner, R.V. O’Neill, “Pattern, Process and Predictability: Neutral Models for Landscape Analysis”, in Quantitative Methods in Landscape Ecology, M.G. Turner, R.H. Gardner (eds), Springer, New York 1990.
43 h e methodology of the ECI is described in detail in Marull, Mallarach, “A GIS methodology” cit., pp. 243-262. Essentially, it takes into account the distance between dif erent functional ecological areas, the ai nity of their habitats and the impact of human-made barriers.
ECI = 10 - 9 (ln (1 + (xi - x
min)) / ln (1 + (x
max - x
min)))3
Where xi is the cost distance by pixel, and x
min and x
max are the minimum and
maximum values of the cost distance in the study under consideration, respec-tively. h e cost distance was calculated using an impedance matrix which is a function of two factors: ecological ai nity of a set of Functional Ecological Areas; and barrier ef ects of urban and infrastructure areas.

RESEARCH ARTICLES / MARULL, PINO, TELLO 136
riers. he algorithm used incorporates an expert assessment of the results.44 We adapted and simpliied the standard methodological procedure to facilitate a historical assessment of land-use changes. We were thus able to assess the anthropogenic barrier efect over sur-rounding spaces, the impact on ecological functional areas, and the current ecological connectivity of each historical scenario. he three main steps in this analysis can be summarised as follows:
i) Ecological Functional Areas. hese determine the natural spaces to be connected according to their ainity, and two fundamental cri-teria: minimum surface and topology.45 Mosaics of habitats are in-cluded due to the existing correlation between the diversity of habi-tats and species.46 he deinition of ecologically functional areas has an intrinsic value: according to the ecological theory of percolation, signiicant problems for the conservation of biodiversity may ensue when the share of ecologically functional areas in a given landscape is reduced below a certain threshold.47
ii) Barrier Efect Index. he ecological disturbance that urban ar-eas and infrastructure can cause greatly exceeds those recorded in their immediate surroundings.48 In fact, the urban spaces, the peri-urban settlements, and the facilities that link them together frag-ment the agricultural and woodland spaces, and this has a major
44 See annexes in Marull et al., “Análisis estructural y functional” cit., pp. 124-126.
45 H. Andrén, “Efects of habitat fragmentation on birds and mammals in landscapes with diferent proportions of suitable habitat: a review”, in Oikos, 71, 1994, pp. 355-366.
46 J. Pino, F. Rodà, J. Ribas, X. Pons, “Landscape structure and bird species richness: Implications for conservation in rural areas between natural parks”, in Landscape and Urban Planning, 49, 2000, pp. 35-48.
47 R.V. O’Neill, R.H. Gardner, M.G. Turner, “A hierarchical neutral model for landscape analysis”, in Landscape Ecology, 7, 1, 1992, pp. 55-61; K.A. With, T.O. Crist, “Critical thresholds in species response to landscape structure”, in Ecology, 76, 8, 1995, pp. 2446-2459.
48 S.C. Trombulak, C.A. Frissell, “Review of Ecological Efects of Roads on Terrestrial and Aquatic Communities”, in Conservation Biology, 14, 1, 1999, pp. 18-30; R.T.T. Forman, “Estimate of the Area Afected Ecologically by the Road System in the United States”, in Conservation Biology, 14, 1, 2000, pp. 31-35.

GE137
impact on the landscape’s ecological functioning. To this we should add the impact of the emission of polluting agents into the atmos-phere, noise, sewage, and the dumping of waste, all of which, in one way or another, have a detrimental ef ect on natural systems.
iii) Ecological Connectivity Index. Ecological connectivity is the quality that allows distinct ecosystems, communities, species, and populations to come into contact. h is index hence measures the complexity of a network on which basic ecological processes de-pend: matter, energy and information. h erefore, ECI represents a synthesis of the functional variables.49 It constitutes a parameter of paramount importance, since it has been shown that isolated pro-tected natural spaces, no matter how well designed and managed, are unable to conserve their biodiversity and comply with other im-portant socio-ecological functions.50
The diachronic use of the ecological landscape indices in the study area
h ree municipal districts in the Vallès Oriental (Maps 1 and 4) were chosen for a GIS analysis of historical maps by applying sev-eral landscape ecological indices. One of these (Polinyà) sits entirely within the Vallès plain, while the remaining two (Caldes de Mont-bui and Castellar del Vallès) are located midway between this plain and the i rst foothills of the Catalan pre-littoral mountain range. Together, the three cover an area of almost 8,960 hectares (Caldes de Montbui, 3,663; Castellar del Vallès, 4,423; Polinyà, 873). Our analyses encompassed a larger, square area when applying the Land-scape Metrics Index (LMI) and the Ecological Connectivity Index (ECI). We used 1956-57 Us Air Force aerial photographs, and our chronological perspective was hence limited to the second half of the last century.
We conducted landscape structure analysis, based on the classic methodology, of the three periods for which cartographic sources
49 Marull, Mallarach, “A GIS methodology” cit., pp. 243-262.50 Forman, Gordon, Landscape Ecology cit.
RESEARCH ARTICLES / MARULL, PINO, TELLO 138
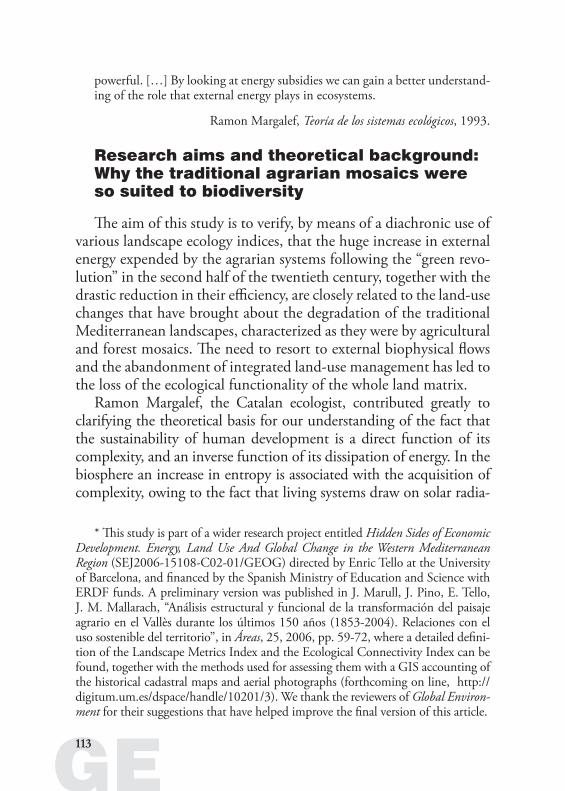
Figure 6. Landscape attributes calculated on land covers for each municipality and period
Land cover diversity
0,0
0,5
1,0
1,5
2,0
2,5
3,0
Caldes Castellar Polinyà
Bits / p
ixel
1850
1950
2000
Agricultural cover diversity
0,0
0,5
1,0
1,5
2,0
2,5
Caldes Castellar Polinyà
Bits / p
ixel
1850
1950
2000
Fragmentation
0
20
40
60
80
100
120
140
160
Caldes Castellar Polinyà
Po
lyg
on
s / c
ove
r
1850
1950
2000
Land cover richness
0
2
4
6
8
10
12
14
Caldes Castellar Polinyà
1850
1950
2000
Length of ecotones
0
200
400
600
800
1000
1200
Caldes Castellar Polinyà
Le
ng
th (
km
)
1850
1950
2000
Size of grain
0
2
4
6
8
10
12
Caldes Castellar Polinyà
1850
1950
2000
were available: 1853-56, 1954-56 and 2004. Using this cadastral information and GIS tools, we drew land cover maps for each pe-riod using a common map legend (Maps 4). Given their origin and the way in which they were drawn, cross comparisons of these maps can be made. he structural metrics were calculated for the original maps and for a reclassiication of their units in naturalness class-
Source: made with GIS by María José Cordobilla, Emili del Pozo and Jac Cirera in Barcelona Regional, for the research project SEJ2006-15108-C02-01/GEOG, from the land-use covers taken from the historical sources cited in Maps 4, and the irst aerial photograph made in 1956-57 by the Us Air Force.
1850
1950
2000
Bit /
pix
el
Bit /
pix
el
Bit /
pix
el
Avera
ge a
rea (
ha)
Poly
gons /
cover
Length
(km
)

GE139
es.51 h is second assessment allows us to detect changes in landscape patterns at a very high level of unit aggregation, which will have a strong inl uence on the functioning of the landscapes themselves.
For the periods between 1853 and 2004, very few changes were observed in the number of land covers per municipal district (Fig-ure 6). Likewise, no consistent pattern in the change of land cover diversity could be observed between municipal districts, though a certain increase in these values was recorded for the most recent pe-riod. As the number of land covers per municipal district remained constant, equitativity rel ects a very similar pattern to that of diver-sity: minimum levels in 1954 and a maximum value in 2004 (data not included here). Similarly, there are no great variations in the diversity of agricultural land-cover classes, apart from the fact that it peaks in 1954-56 and falls in 2004. By contrast, attributes related to fragmentation were found to show sharp, consistent trends between municipal districts. h e mean value of the polygons per land-cover category and the total length of the perimeters increased markedly between 1954 and 2004, while the mean size of the patches pre-sented an opposite trend.
h e long-term patterns in the diversity of naturalness classes resemble those recorded for land-cover diversity, though they are somewhat sharper (Figure 7). A highly notable increase in this pa-rameter was recorded in all the municipal districts during the periods 1954-56 and 2004, coinciding with the expansion of urban areas. Since the number of naturalness classes remained constant, this in-crease in diversity can be explained as a result of an increase of their equifrequency. Fragmentation was found to increase exponentially throughout the period, with the main increase taking place between 1954-56 and 2004. An analysis of the relative importance of the various naturalness groups showed a gradual decline in agricultural and urban types throughout 1954-56 and 2004. h e proportion of natural units (woodland) peaked in the period 1954-56 in the municipal districts of the pre-littoral mountain range (Castellar del
51 See annexes in Marull et al., “Análisis estructural y functional” cit., pp. 124-126.

RESEARCH ARTICLES / MARULL, PINO, TELLO 140
Figure 7. Landscape attributes calculated on naturalness classes for each municipality and period
Diversity of naturalness classes
0,0
0,5
1,0
1,5
2,0
Caldes Castellar Polinyà
Bits / p
ixel
1850
1950
2000
Fragmentation of naturalness classes
0
50
100
150
200
250
300
Caldes Castellar Polinyà
1850
1950
2000
Proportion of naturalness 1:
Natural
0
20
40
60
80
Caldes Castellar Polinyà
Perc
enta
ge o
f are
a 1850
1950
2000
Proportion of naturalness 2:
Seminatural
0
5
10
15
20
25
Caldes Castellar Polinyà
Pe
rcenta
ge o
f are
a 1850
1950
2000
Proportion of naturalness 3:
Agricultural
0
10
20
30
40
50
60
70
80
90
Caldes Castellar Polinyà
Perc
enta
ge o
f are
a
1850
1950
2000
Proportion of naturalness 4: Urban
0,0
10,0
20,0
30,0
40,0
50,0
Caldes Castellar Polinyà
Pe
rce
nta
ge
of a
rea 1850
1950
2000
Vallès and Caldes de Montbui). Later, this igure fell due to ires and urban expansion. he proportion of the semi-natural class (bushes and meadows) has recently undergone a sharp increase, due in all likelihood to agricultural abandonment and forest ires.
We carried out the landscape functional analysis using the afore-mentioned parametric methods, which assess the landscape matrix in terms of two properties: its capability to host species and ecological
Source: made with GIS by María José Cordobilla, Emili del Pozo and Jac Cirera in Barcelona Regional, for the research project SEJ2006-15108-C02-01/GEOG, from the land-use covers taken from the historical sources cited in Maps 4, and the irst aerial photograph made in 1956-57 by the Us Air Force.
1850
1950
2000
Num
ber
of
Poly
gons
Bit /
pix
el
Perc
enta
ge o
f are
a
Perc
enta
ge o
f are
a
Perc
enta
ge o
f are
a
Perc
enta
ge o
f are
a

GE141
processes and its potential to connect horizontal l ows of energy, mat-ter, and information. In order to incorporate the main ecological proc-esses, the study encompassed a larger area than that taken into consid-eration for the structural analysis discussed above, and included part of the littoral and pre-littoral mountain ranges of Catalonia (Maps 8 and 10). h e period of analysis had to be shortened (1954-2004) because of the lack of cartographic sources for this wider, square area from the mid-nineteenth century onward. h is dif erence in the i eld analysis was necessary, since a functional analysis requires a wider area as it must incorporate the l ows that circulate between the units of the landscape and thereby cushion the so-called “edge ef ect”. In consid-eration of the importance of the l ows circulating between the plain and the adjacent hills for our analysis, and to avoid the segregation of the three municipalities selected above, we increased the number of municipal districts comprising our study area to i ve (Sentmenat and Palau-solità i Plegamans were therefore added to Caldes de Montbui, Castellar del Vallès, and Polinyà).
When considering the attributes of potential relation, contact heterogeneity, and ecological integrity, a substantial loss in ecologi-cally functional areas was observed over the period of study (Maps 8 and Figure 9). In all cases, a fall in the frequency of the highest values and an increase in the importance of the lowest values were observed. A sharp increase in the percentage of land surface with no functional capacity, as well as land surface excluded from the analy-sis (in the main urban land covers) also became apparent. Likewise, vertical complexity showed marked variations, with a decrease in high woodland and bushes matched by an increase in low woodland and bushes, in addition to a signii cant increase in excluded areas. As a result of these changes, the Landscape Metrics Index (LMI) underwent a dramatic fall in the frequency of its highest values (8 to 10) and a particularly notable increase in areas without any eco-landscape interest. Values in the mid-range presented highly variable patterns (Figure 9).
A substantial loss of ecological functional areas (Figure 11) was observed over the period of study. While in the period 1954-56 they accounted for 90% of the whole area under study, by 2004 this per-

RESEARCH ARTICLES / MARULL, PINO, TELLO 142
Maps 8. The landscape as a generator of ecological pro-cesses: Cartography of the Landscape Metrics Index (LMI), applied to the study area in 1954-56 and 1999-2004
7
Source: made with GIS by María José Cordobil-la, Emili del Pozo and Jac Cirera in Barcelona Regional, for the rese-arch project SEJ2006-1 5 1 0 8 - C 0 2 - 0 1 /GEOG, from the land-use covers taken from the historical sources cited in Maps 4, and the irst aerial photo-graph made in 1956-57 by the Us Air Force.

GE143
Figure 9. The landscape as a generator of ecological pro-cesses: main results obtained in the study area compa-ring the 1954-56 with 1999-2004 state
Potential relation
0
1.000
2.000
3.000
4.000
5.000
6.000
7.000
1 2 3 4 5
Are
a (
ha)
1954
2004
NullVery
lowHigh
Very
highLow
Contact heterogeneity
0
1 000
2 000
3 000
4 000
5 000
6 000
7 000
8 000
9 000
1 2 3 4 5
Are
a (
ha
)
1954
2004
Null Very
lowHigh
Very
highLow
Vertical complexity
0
1 000
2 000
3 000
4 000
5 000
6 000
7 000
8 000
1 2 3 4 5
1954
2004
Excluded
Short grasses
and dry crop
Shrubs and
short woods
Tall
woods
Tall grasses
and irrigated
crop
Landscape Metrics Index (LMI)
0
1 000
2 000
3 000
4 000
5 000
6 000
0 1 2 3 4 5 6 7 8 9 10
Are
a (
ha
)
1954
2004
Ecological integrity
0
2.000
4.000
6.000
8.000
10.000
12.000
14.000
1 2 3 4 5
Are
a (
ha)
1954
2004
NullVery
lowHigh
Very
highLow
centage had fallen to 64%. h is i gure is a source of special concern if we bear in mind that below a certain threshold – around 60% according to several studies – 52 the functioning of the system enters
52 With, Crist, “Critical thresholds” cit., pp. 2446-2459.
Source: made with GIS by María José Cordobilla, Emili del Pozo and Jac Cirera in Barcelona Regional, for the research project SEJ2006-15108-C02-01/GEOG, from the land-use covers taken from the historical sources cited in Maps 4, and the i rst aerial photograph made in 1956-57 by the Us Air Force.
Are
a (
ha)
Are
a (
ha)
Are
a (
ha)
Are
a (
ha)
Are
a (
ha)

RESEARCH ARTICLES / MARULL, PINO, TELLO 144
Maps 10. The landscape as a connector for ecological pro-cesses: cartography of the Ecological Connectivity Index (ECI), applied to the study area in 1954-56 and 1999-2004
9
Source: made with GIS by María José Cordobil-la, Emili del Pozo and Jac Cirera in Barcelona Regional, for the rese-arch project SEJ2006-1 5 1 0 8 - C 0 2 - 0 1 /GEOG, from the land-use covers taken from the historical sources cited in Maps 4, and the irst aerial photo-graph made in 1956-57 by the Us Air Force.

GE145
a critical phase and a signii cant decline in biodiversity may ensue. h ese results are closely related to the growing ecological fragmen-tation revealed by the structural analysis carried out with classical metrics. It is apparent that the barriers inserted by cities and ur-ban facilities segregate natural and agricultural spaces and that these fragments are becoming increasingly smaller and isolated from each other. h ese residual spaces have started to lose the greater part of their ecological functions and are becoming the main cause of the regional and global loss of biodiversity.53 h us, while the Barrier Ef-fect Index (Figure 11) indicated a 28% impact on the whole area under study in 1956, by 2004 the index had climbed to 63%. h is result is by itself clearly indicative of current trends and very much in line with i ndings for metropolitan areas published elsewhere.54
Finally, as expected from the above results – a dramatic fall in ec-ological functional areas and a considerable increase in the ef ects of anthropogenic barriers – the ecological connectivity between wood-land, agricultural and pasture mosaics deteriorated signii cantly dur-ing the period 1954-2004 (Maps 10). h us, while in 1954 85% of the area had an ECI>5, by 2004 barely 16% of the area had a comparable index (Figure 11). However, it should be noted that, since the study area lies between the pre-littoral mountain range and the plain, this part of the Metropolitan Region of Barcelona still maintains a signii cant functional connectivity. Considerably lower values were obtained for the rest of the Vallès county, which today is completely fragmented by urban and peri-urban settlements, in-dustrial sites, and transport facilities, and where the only remaining connectors are often just a few streams that suf er high rates of eco-logical degradation.55 h us, we can conclude that over the last 50
53 D. Saunders, R.J. Hobbs, C.R. Margules, “Biological consequences of eco-system fragmentation: a review”, in Conservation Biology, 5, 1991, pp.18-32.
54 R.T.T. Forman, L.E. Alexander, “Roads and their major ecological ef ects”, in Annual Review of Ecology and Systematics, 29, 1998, pp. 207-231; Trombulak, Frissell, “Review of Ecological Ef ects of Roads” cit., pp. 18-30; Forman, “Esti-mate of the Area Af ected” cit., pp. 31-35.
55 J. Marull, J.M. Mallarach, “La conectividad ecológica en el Área Metro-politana de Barcelona”, Ecosistemas, 11, 2, 2002, http//www.aeet.org/ecosiste-

RESEARCH ARTICLES / MARULL, PINO, TELLO 146
Figure 11. The landscape as a connector for ecological processes: main results obtained in the study area com-paring the 1954-56 with 1999-2004 state
Ecological functional areas
0
1 000
2 000
3 000
4 000
5 000
6 000
7 000
Forest mosaic Agricultural
mosaic
Agroforest
mosaic
Non-
functional
natural areas
Non-natural
areas
Are
a (
ha
)
1954
2004
Source: made with GIS by María José Cordobilla, Emili del Pozo and Jac Cirera in Barcelona Regional, for the research project SEJ2006-15108-C02-01/GEOG, from the land-use covers taken from the historical sources cited in Maps 4, and the irst aerial photograph made in 1956-57 by the US Air Force.
Barrier effect index (BEI)
0
1 000
2 000
3 000
4 000
5 000
6 000
7 000
8 000
9 000
10 000
0 1 2 3 4 5 6 7 8 9 10
Are
a (
ha)
1954
2004
Ecological connectivity index (ECI)
0
1 000
2 000
3 000
4 000
5 000
6 000
1 2 3 4 5 6 7 8 9 10
Are
a (
ha)
1954
2004

GE147
years the priority given to urban development in the metropolitan area of Barcelona has taken a heavy toll on the traditional agricul-tural mosaics of the plain. For this reason, the conservation of spaces such as those under study here takes on even greater signii cance.
Conclusions and further research proposals
h is study meets a two-fold aim. First, it has tested the possibilities furnished by historical cartographic sources and aerial photographs, combined with those provided by recently developed orthopho-tomaps and orthocorrected satellite images, to analyse the changes in the structure and composition of the land matrix using GIS tools and methods devised in landscape ecology. Second, it has tested new parametric indices, including the Landscape Metrics Index and the Ecological Connectivity Index, to assess the ei ciency of these his-torical landscapes. h e answer to the basic question – can the loss of landscape ei ciency attributable to the degradation of the traditional Mediterranean agro-forestry mosaic be accounted for by means of new socio-ecological indices or landscape metrics? – is ai rmative.
h is study has also carried out a preliminary test of the hypoth-esis that much of the loss of landscape ei ciency, associated with a change in the composition and structure of the ecological land-scape, is historically linked to a deterioration in the energy yield of the agrarian systems, together with the social crisis suf ered by a rural world that has gradually lost control of the land. Here again the answer would seem to be ai rmative, although further research and the development of improved methods are required. Our results actually show that the loss in energy yield went hand in hand with signii cant anthropogenic modii cations to landscape structure and composition, which in their turn increased land fragmentation and reduced the grain size of patches. An increase in heterogeneity as-sociated with a larger number of less natural land-covers (urban and road) has also been coni rmed. h e changes observed in the land
mas/022/investigacion6.htm; Marull, Mallarach, “A GIS methodology” cit., pp. 243-262.

RESEARCH ARTICLES / MARULL, PINO, TELLO 148
matrix seem to suggest that the likely impact on the ecological func-tioning of the landscape will be particularly strong.
What exactly though are these efects likely to be? he presence of strong links between a landscape’s structure and the way it functions is today widely accepted, although landscape ecology is not ind-ing it easy to describe this phenomenon in mathematical terms.56 Several authors have indicated that an increase in the fragmentation and a decrease in the grain size of landscape units can have a negative efect on their capacity to host specialised species (i.e., inner-patch specialist species) and complex ecological processes.57 he use of the new socio-ecological indices reported here would appear to reinforce this thesis. In fact, our results, obtained by applying indices of po-tential relation, contact heterogeneity, and ecological integrity, show a general loss of the functional capacity of the region under analysis as a habitat over the period of study. Likewise, the connective capac-ity of the region has also been afected by these changes, as shown by the fall in the number of functional ecological areas, the increase in the anthropogenic barrier efect, and the sharp decrease in the Eco-logical Connectivity Index. Generally speaking, landscapes tend to become more suitable for opportunistic edge species that do not re-quire special ecological conditions, and thus become a fertile ground for intrusive exotic species.58 he end result is, therefore, a simplii-cation in the quality and quantity of the landscape as an ecosystem. his loss of ecological functioning in these ill-structured landscapes becomes apparent as they lose their capability to host and connect complex ecological processes.
Any attempt at a more precise assessment of this cause-efect rela-tionship, i.e., that which exists between the loss of energy eiciency and changes in the landscape structure and functioning, lies beyond the scope of this present study. he historical link between both processes requires a more complex exploration and the incorpora-
56 Forman, Gordon, Landscape Ecology cit.; Li, Wu, “Use and misuse” cit., pp. 389-399.
57 Forman, “Some general principles” cit., pp. 133-142.58 Guirado, Paisatges forestals fragmentats cit.
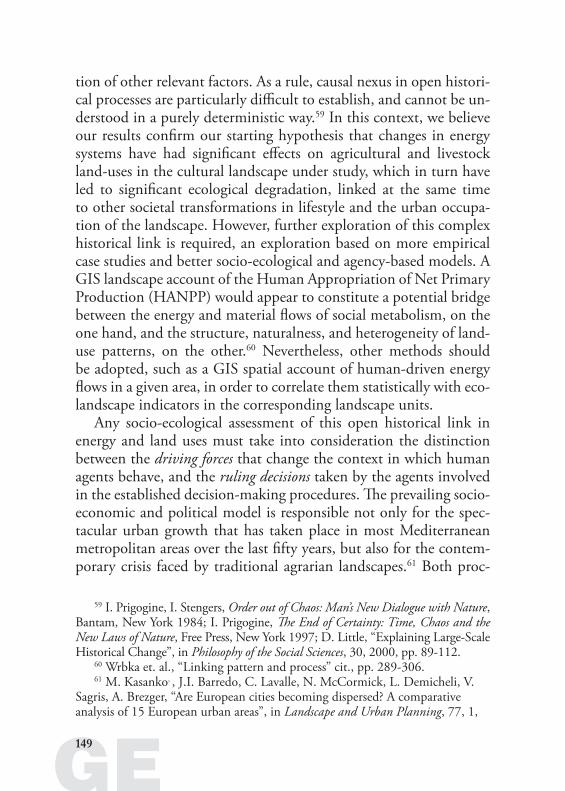
GE149
tion of other relevant factors. As a rule, causal nexus in open histori-cal processes are particularly dii cult to establish, and cannot be un-derstood in a purely deterministic way.59 In this context, we believe our results coni rm our starting hypothesis that changes in energy systems have had signii cant ef ects on agricultural and livestock land-uses in the cultural landscape under study, which in turn have led to signii cant ecological degradation, linked at the same time to other societal transformations in lifestyle and the urban occupa-tion of the landscape. However, further exploration of this complex historical link is required, an exploration based on more empirical case studies and better socio-ecological and agency-based models. A GIS landscape account of the Human Appropriation of Net Primary Production (HANPP) would appear to constitute a potential bridge between the energy and material l ows of social metabolism, on the one hand, and the structure, naturalness, and heterogeneity of land-use patterns, on the other.60 Nevertheless, other methods should be adopted, such as a GIS spatial account of human-driven energy l ows in a given area, in order to correlate them statistically with eco-landscape indicators in the corresponding landscape units.
Any socio-ecological assessment of this open historical link in energy and land uses must take into consideration the distinction between the driving forces that change the context in which human agents behave, and the ruling decisions taken by the agents involved in the established decision-making procedures. h e prevailing socio-economic and political model is responsible not only for the spec-tacular urban growth that has taken place in most Mediterranean metropolitan areas over the last i fty years, but also for the contem-porary crisis faced by traditional agrarian landscapes.61 Both proc-
59 I. Prigogine, I. Stengers, Order out of Chaos: Man’s New Dialogue with Nature, Bantam, New York 1984; I. Prigogine, h e End of Certainty: Time, Chaos and the New Laws of Nature, Free Press, New York 1997; D. Little, “Explaining Large-Scale Historical Change”, in Philosophy of the Social Sciences, 30, 2000, pp. 89-112.
60 Wrbka et. al., “Linking pattern and process” cit., pp. 289-306.61 M. Kasanko, , J.I. Barredo, C. Lavalle, N. McCormick, L. Demicheli, V.
Sagris, A. Brezger, “Are European cities becoming dispersed? A comparative analysis of 15 European urban areas”, in Landscape and Urban Planning, 77, 1,

RESEARCH ARTICLES / MARULL, PINO, TELLO 150
esses have led to a conceptual devaluation of landscape understood as a system, so that today landscapes are regarded as little more than extensions of land available for any use, or to fall into disuse, regard-less of ecological impact.62 his loss of value has led to a general lack of concern as regards landscape management, barely ofset by public policy issues. However, our society is coming under increasing pres-sure to weigh up the medium and long-term socio-ecological efects of the absence of sustainable land-use management. In this context of socio-ecological awareness, there can be no excuse for not seeking to recover the virtue of landscape eiciency.
We believe that such a change is possible, precisely because the cause-efect relationship between the socio-economic system and land-use management has always been historical. hrough the weav-ing of trends that lead to multiple situations of path-dependency, history matters. Nevertheless, historical trends are not ruled by fate. If a causal relationship is historical and not deterministic, then it is intrinsically liable to modiication. Understanding its genesis helps to identify the key conditions to change its course. We trust that studies such as the present one will help in this task, providing ap-propriate criteria and useful instruments that may restore the ei-ciency of our landscapes.
2, pp. 111-130; Farina, “he Cultural Landscape” cit., pp. 313-320; Agnoletti, he Conservation of Cultural Landscapes cit.; Parrotta et al., Cultural Heritage cit.
62 J. Marull, “La vulnerabilidad del territorio en la región metropolitana de Barcelona. Parámetros e instrumentos de análisis”, in El territorio como sistema. Conceptos y herramientas de ordenación, R. Folch (ed.), CUIMP/Diputació de Barcelona, Barcelona 2003
