fujitsu apd introduction
DESCRIPTION
With the Fujitsu’s Automated Business Process Discovery & Visualization service, we aim to help solve one of the biggest challenges faced by companies embarking on a process improvement and governance initiative – illuminating the exposure to inefficiencies, non-compliance, fraud, legal, and other business value leakage issues lying hidden in operational workflows.TRANSCRIPT
Fujitsu APD Workshop
Fujitsu America, Inc.
Fujitsu America, Inc. - CONFIDENTIAL
Fujitsu America, Inc. - CONFIDENTIAL2
Agenda
Interstage Automated Process Discovery (APD) Service Overview
Interstage APD Workshop Overview
Systems and Data Discussion Oracle, SalesForce, BMI, others
APD Workshop Scheduling
3
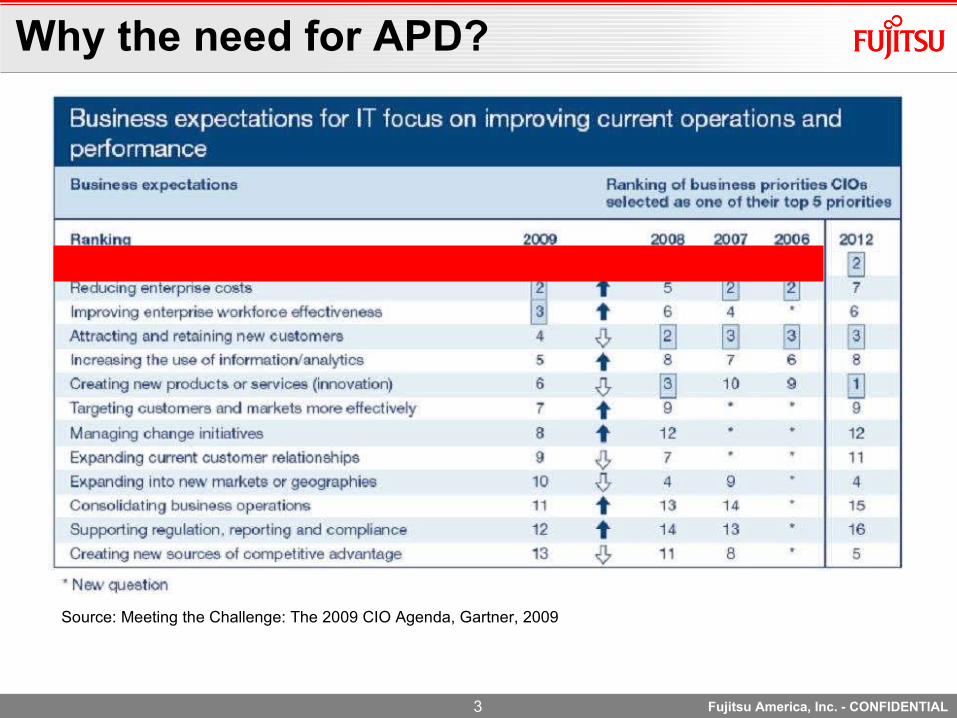
Why the need for APD?
Source: Meeting the Challenge: The 2009 CIO Agenda, Gartner, 2009
Fujitsu America, Inc. - CONFIDENTIAL
4
As Is
What you think is happening
To Be
What should be happening
Through interviews
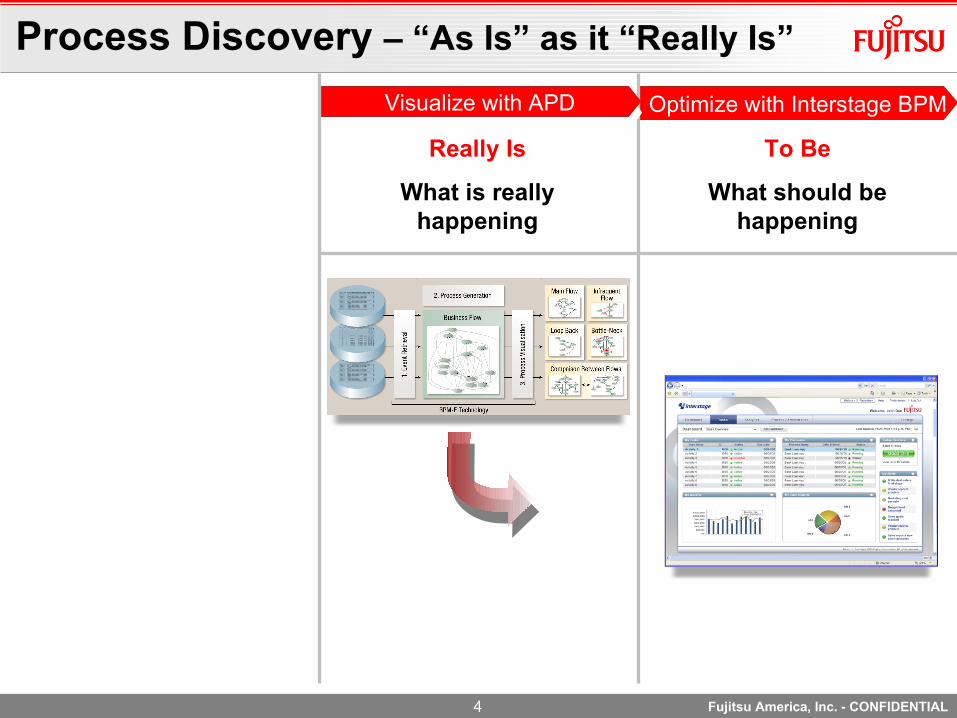
Process Discovery – “As Is” as it “Really Is”
By the book
Optimize with Interstage BPM
Really Is
What is really happening
Visualize with APD
Fujitsu America, Inc. - CONFIDENTIAL
5
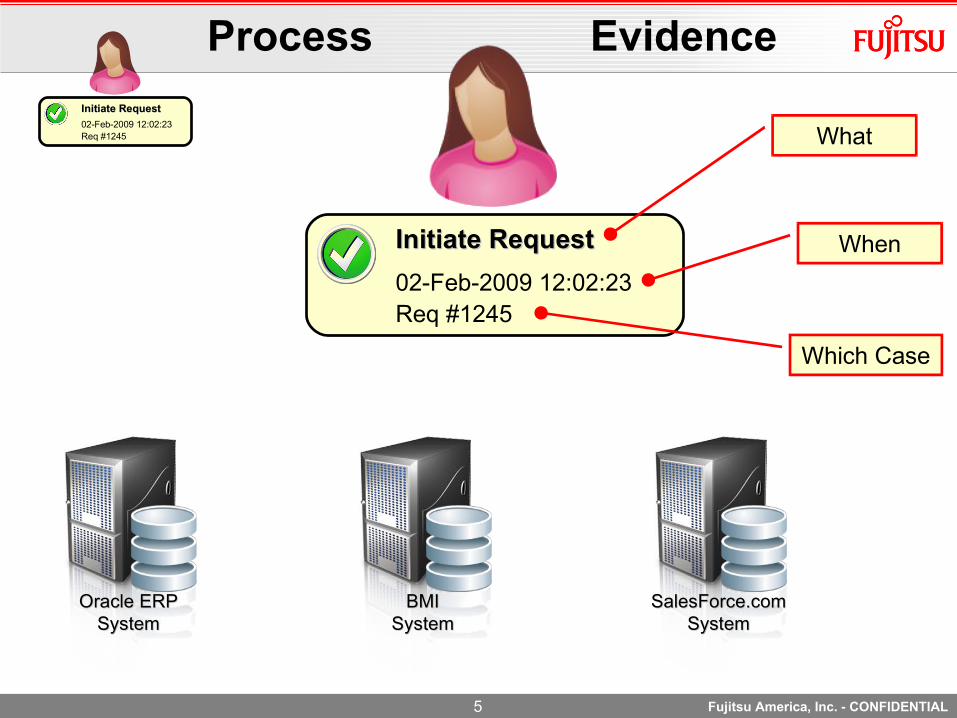
Initiate RequestInitiate Request
02-Feb-2009 12:02:23 Req #1245
BMIBMISystemSystem
SalesForce.comSalesForce.comSystemSystem
Oracle ERPOracle ERPSystemSystem
When
What
Which Case
Initiate RequestInitiate Request
02-Feb-2009 12:02:23 Req #1245
Process Evidence
Fujitsu America, Inc. - CONFIDENTIAL
6
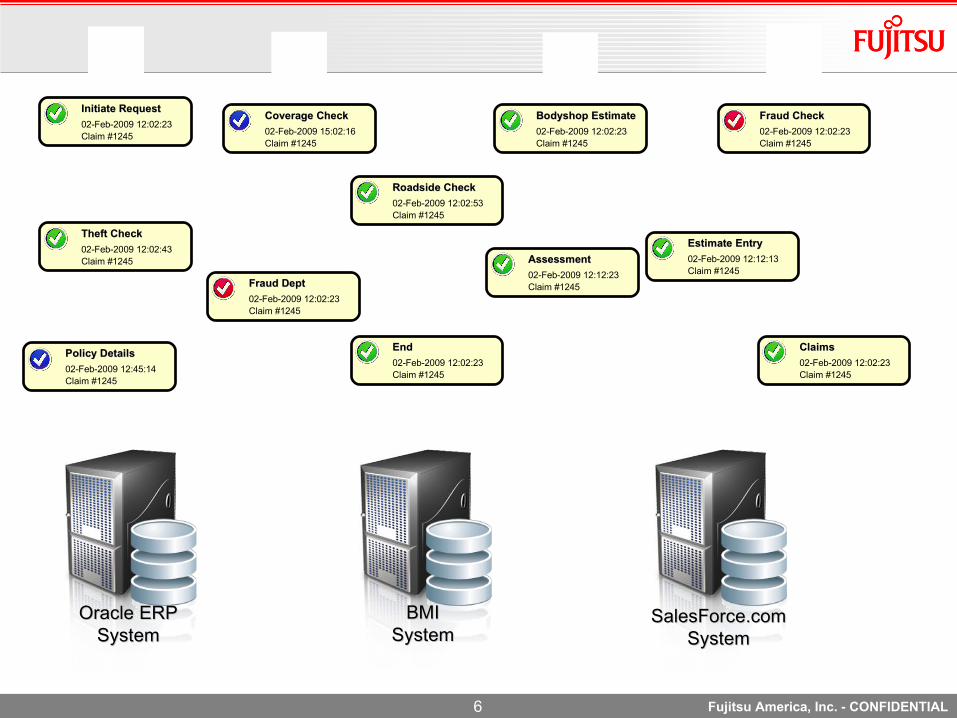
Initiate RequestInitiate Request
02-Feb-2009 12:02:23 Claim #1245
Theft CheckTheft Check
02-Feb-2009 12:02:43 Claim #1245
ClaimsClaims
02-Feb-2009 12:02:23 Claim #1245
Roadside CheckRoadside Check
02-Feb-2009 12:02:53 Claim #1245
AssessmentAssessment
02-Feb-2009 12:12:23 Claim #1245
EndEnd
02-Feb-2009 12:02:23 Claim #1245
Estimate EntryEstimate Entry
02-Feb-2009 12:12:13 Claim #1245
Bodyshop EstimateBodyshop Estimate
02-Feb-2009 12:02:23 Claim #1245
Coverage CheckCoverage Check
02-Feb-2009 15:02:16 Claim #1245
Policy DetailsPolicy Details
02-Feb-2009 12:45:14 Claim #1245
Fraud CheckFraud Check
02-Feb-2009 12:02:23 Claim #1245
Fraud DeptFraud Dept
02-Feb-2009 12:02:23 Claim #1245
Oracle ERPOracle ERPSystemSystem
BMIBMISystemSystem
SalesForce.comSalesForce.comSystemSystem
Fujitsu America, Inc. - CONFIDENTIAL
7
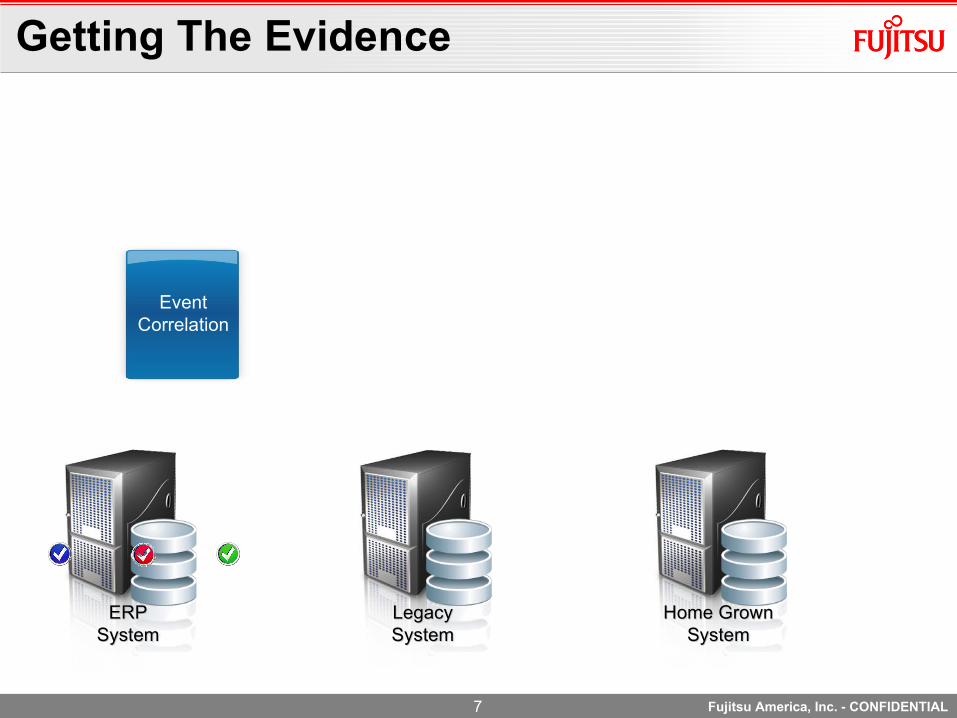
LegacyLegacySystemSystem
Home GrownHome GrownSystemSystem
ERPERPSystemSystem
Event Correlation
Getting The Evidence
Fujitsu America, Inc. - CONFIDENTIAL

8
Event Correlation
StartStart
Policy DetailsPolicy Details
Coverage CheckCoverage Check
Theft CheckTheft Check
Bodyshop EstimateBodyshop Estimate
Roadside CheckRoadside Check
Estimate EntryEstimate Entry
Fraud CheckFraud Check
AssessmentAssessment
ClaimsClaims
Fraud Check DeptFraud Check Dept
EndEnd
11
22
33
44
Visualize the process flow See what happens, what sequence, which way
View process metrics See information about how many, how long, how often
Analyze inefficient process routes
Look for delays, loopbacks, and repeated steps
Compare with business requirements Look for waste, cost of routes, opportunities to streamline, go lean
Process Visualization & Analysis
Process Generator
Understanding The Evidence
Fujitsu America, Inc. - CONFIDENTIAL
9
StartStart
Policy DetailsPolicy Details
Coverage CheckCoverage Check
Theft CheckTheft Check
Bodyshop EstimateBodyshop Estimate
Roadside CheckRoadside Check
Estimate EntryEstimate Entry
Fraud CheckFraud Check
AssessmentAssessment
ClaimsClaims
Fraud Check DeptFraud Check Dept
EndEnd
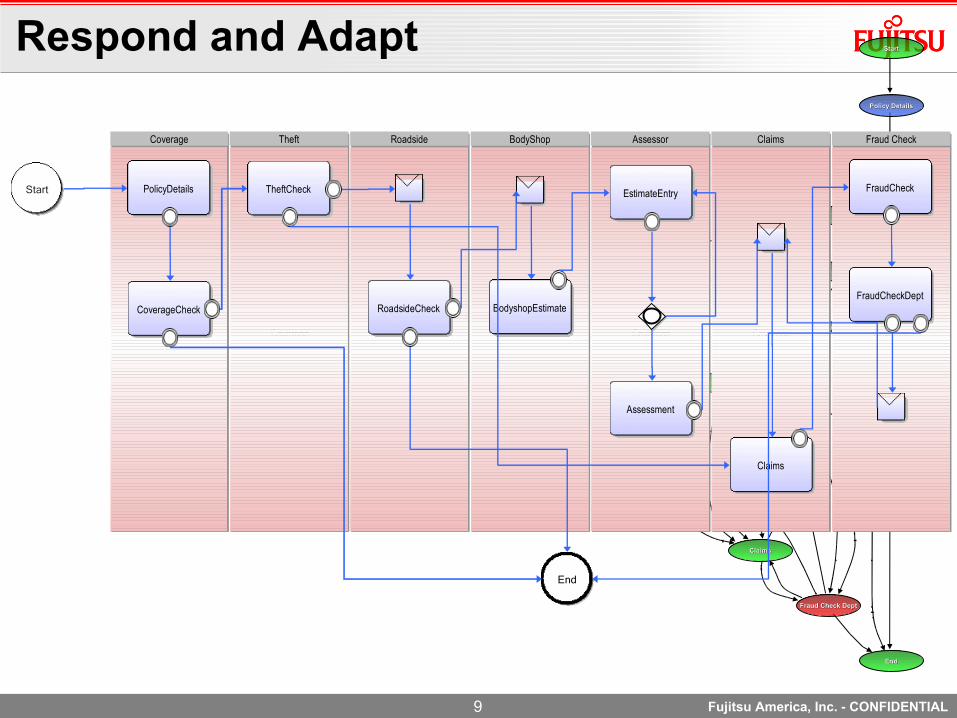
Coverage
BodyShop
Coverage
Theft
Coverage
Coverage
Coverage
Roadside
Coverage
Assessor
Coverage
Claims
Coverage
Fraud Check
End
PolicyDetails
CoverageCheck
TheftCheck
RoadsideCheck BodyshopEstimate
EstimateEntry
Assessment
Claims
FraudCheck
FraudCheckDept
Start
Respond and Adapt
Fujitsu America, Inc. - CONFIDENTIAL
Copyright 2009 FUJITSU10
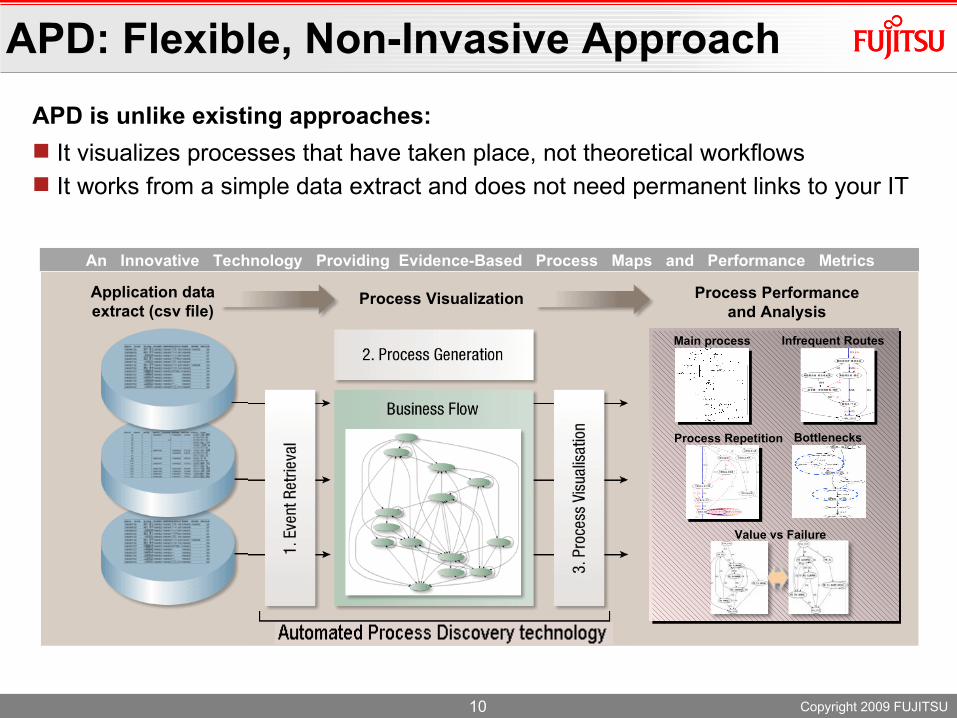
APD is unlike existing approaches:
It visualizes processes that have taken place, not theoretical workflows It works from a simple data extract and does not need permanent links to your IT
APD: Flexible, Non-Invasive Approach
An Innovative Technology Providing Evidence-Based Process Maps and Performance Metrics
Main process Infrequent Routes
Process Repetition Bottlenecks
Value vs Failure
Process Performance and Analysis
Process VisualizationApplication data extract (csv file)
11
Visualize the Process Flow
L 3 17
CP
10
T 8
4665
A 3C
A 4
5059
P 02
135
P 2
T 2
7479
SJ
S6 S
35
CM
S3 S
90
T 1
T 2S
7479
T 7
85
S1
SJS
35
SFS
321
TAS
35
NT
143
6850
TD
10
M2
P 01
26
M 2 A
6365
M3
43
M4 D
M9A
46
M 8
7394
35
A3 B
1302 4946
M1
2352
96
L 6 C
1357
M3 V
M3R
736
P 04
267
AT 5
5085
1302
10
80
A 3
898
T 6
LC
7515
80
135
4183
859
S 6
7494
18
13
6434
9
951
SF
464
M4C
7348
M7
M 10
7394
C 1 H
29
898
WA
539
T 9 S
29
2881
21
568
PA
953
281
2811
T5
S1 S
7394
96
859
M4 B
315
M2 B
25
M4 A
292
35
M 4
4581
1145
M5 B
7394
46 7348
M5 A
7394
TA
496
10
35
S 2 S
9111
7394
35
L 6
1357
CD
90
90
22
242
14
34
912
P 5
7394
M3 T
987
16
444
FINAL _ STATE
7385
D 1
85
AT3
4655
AT 2
1885
AT 1
825
143
46
T 4
43
T 5 S
7394
7394
659
294
S 4
34
315
6030
1156
926
9
5260
18
446
INITIAL _ STATE
860
6505 DZ
29
P 4
7403
34
T9
626
1885
5445
35
T 3
T 4 S
7437
626
S3
194
7525
292
46
6053
TE
23
7394
7437
194
884
119
825
1920
4620
42
T 3 S
7437
7437
29
9
10
1357
6462
515
169
119
267
34
74797394
488
4581
1810
515
23
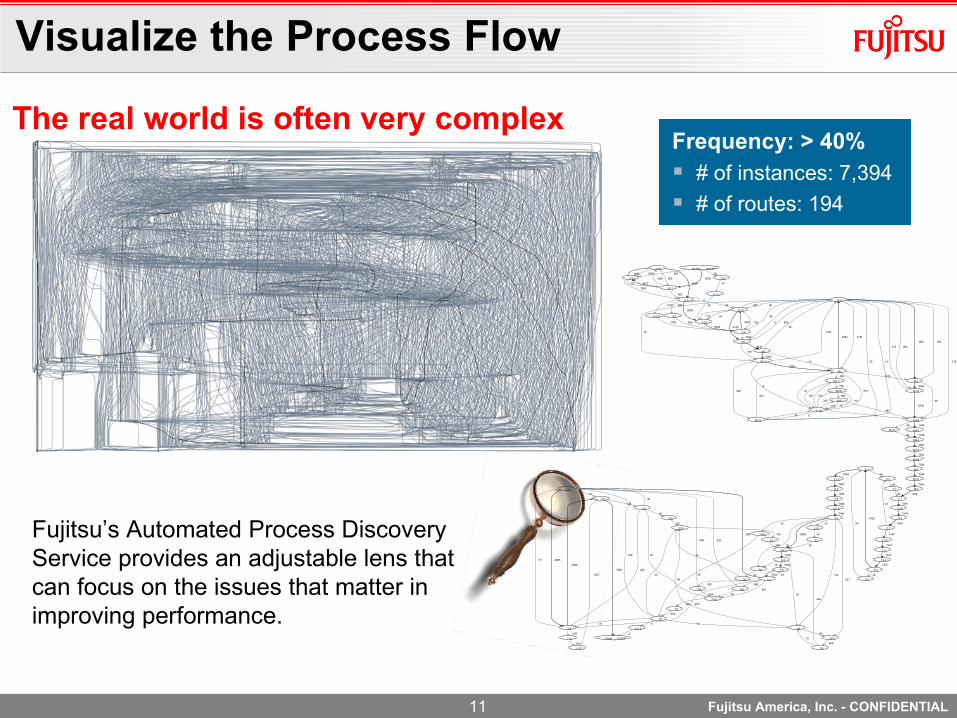
The real world is often very complex
Fujitsu’s Automated Process Discovery Service provides an adjustable lens that can focus on the issues that matter in improving performance.
# of instances: 18,481
# of routes: 8,942
Frequency: > 40% # of instances: 7,394
# of routes: 194
Fujitsu America, Inc. - CONFIDENTIAL
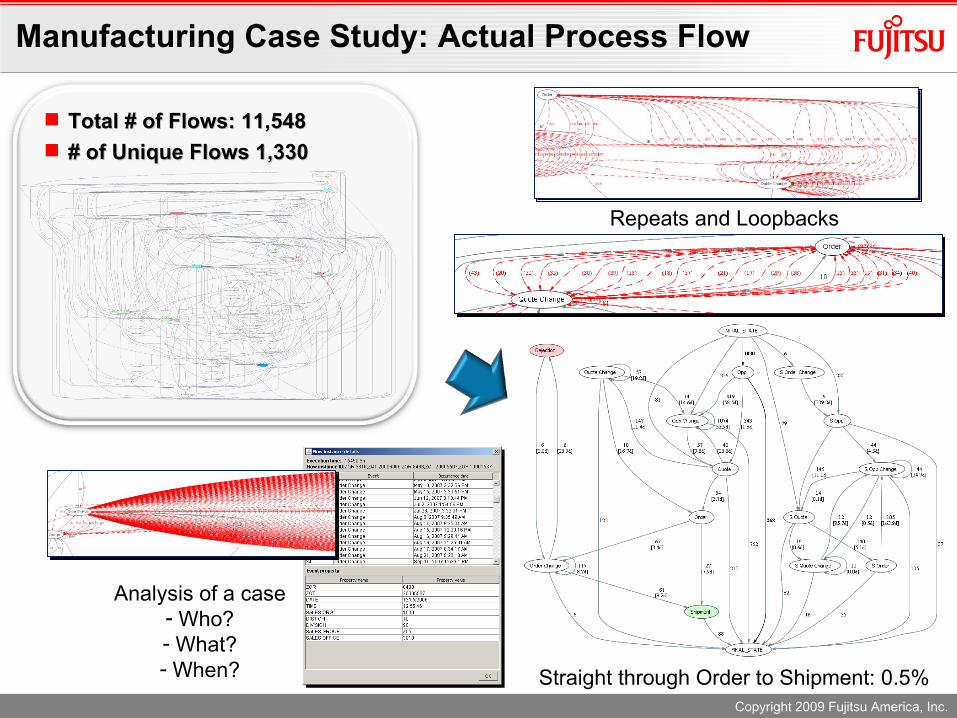
Manufacturing Case Study: Actual Process Flow
Total # of Flows: 11,548Total # of Flows: 11,548 # of Unique Flows 1,330# of Unique Flows 1,330
Repeats and Loopbacks
Analysis of a case- Who?- What?- When? Straight through Order to Shipment: 0.5%
Copyright 2009 Fujitsu America, Inc.
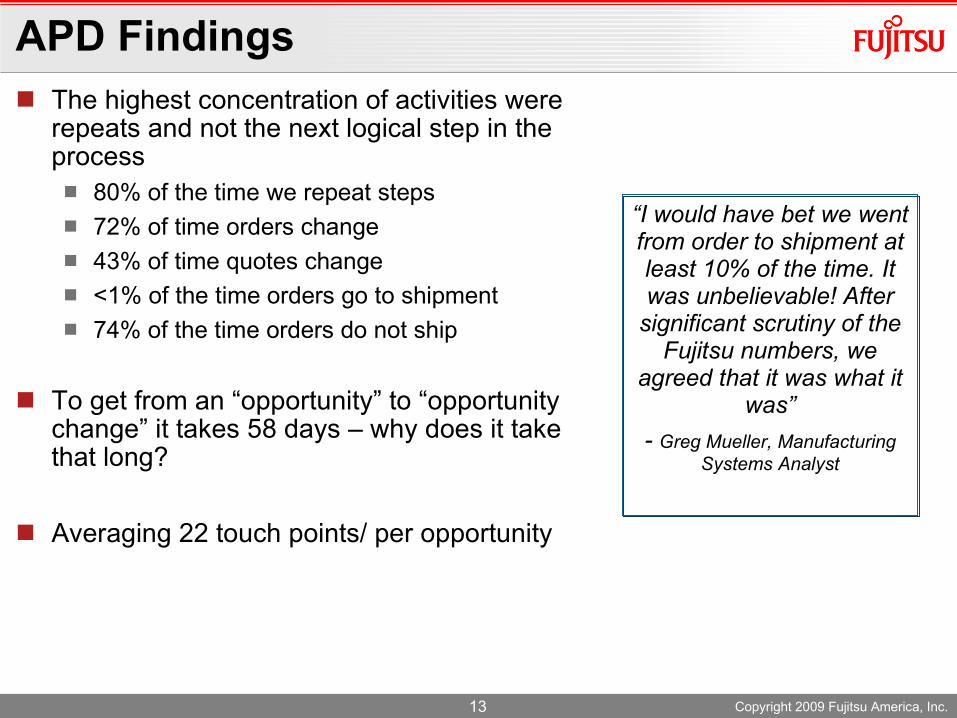
APD Findings The highest concentration of activities were
repeats and not the next logical step in the process 80% of the time we repeat steps 72% of time orders change 43% of time quotes change <1% of the time orders go to shipment 74% of the time orders do not ship
To get from an “opportunity” to “opportunity change” it takes 58 days – why does it take that long?
Averaging 22 touch points/ per opportunity
Copyright 2009 Fujitsu America, Inc.13
“I would have bet we went from order to shipment at least 10% of the time. It was unbelievable! After
significant scrutiny of the Fujitsu numbers, we
agreed that it was what it was”
- Greg Mueller, Manufacturing Systems Analyst
Next Steps & Feedback
Identified 22 process improvement projects – 80% were directly because of APD. Examples include: Creating a simplified opportunity
entry view in SAP Adding timers/ ticklers to review
opportunities every week and decide whether to proceed to quote or drop an opportunity (currently reviews are done every 30 days by which time it is too late to undo build instructions)
Redoing the approval process within SAP
“We were very impressed by how much insight into our
critical opportunity-to-order process the Fujitsu Automated
Process Discovery and Visualization service provided in so little time, at such low cost, and with so little disruption to our business. APD produced
easy-to-understand visualizations based on what is actually happening within our organization, allowing us to
make solid process-improvement decisions”
- Greg Mueller, Manufacturing Systems Analyst
Copyright 2009 Fujitsu America, Inc.
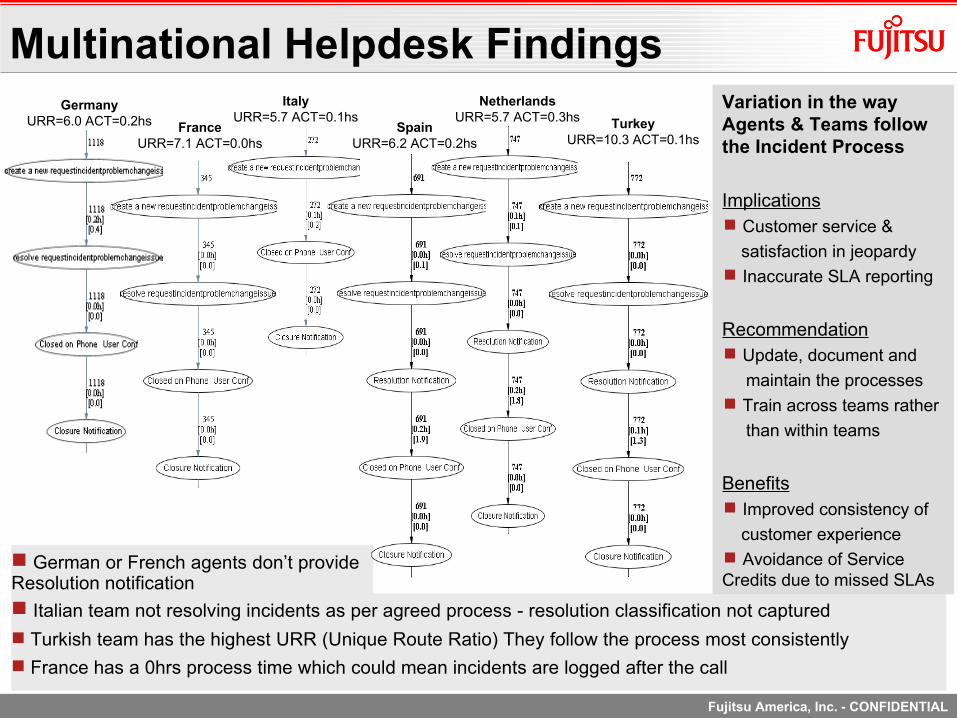
Multinational Helpdesk Findings
German or French agents don’t provide Resolution notification
GermanyURR=6.0 ACT=0.2hs
NetherlandsURR=5.7 ACT=0.3hs
ItalyURR=5.7 ACT=0.1hs
FranceURR=7.1 ACT=0.0hs
SpainURR=6.2 ACT=0.2hs
Italian team not resolving incidents as per agreed process - resolution classification not captured
Turkish team has the highest URR (Unique Route Ratio) They follow the process most consistently
France has a 0hrs process time which could mean incidents are logged after the call
TurkeyURR=10.3 ACT=0.1hs
Variation in the way Agents & Teams follow the Incident Process
Implications
Customer service &
satisfaction in jeopardy
Inaccurate SLA reporting
Recommendation
Update, document and
maintain the processes
Train across teams rather
than within teams
Benefits
Improved consistency of
customer experience
Avoidance of Service Credits due to missed SLAs
Fujitsu America, Inc. - CONFIDENTIAL
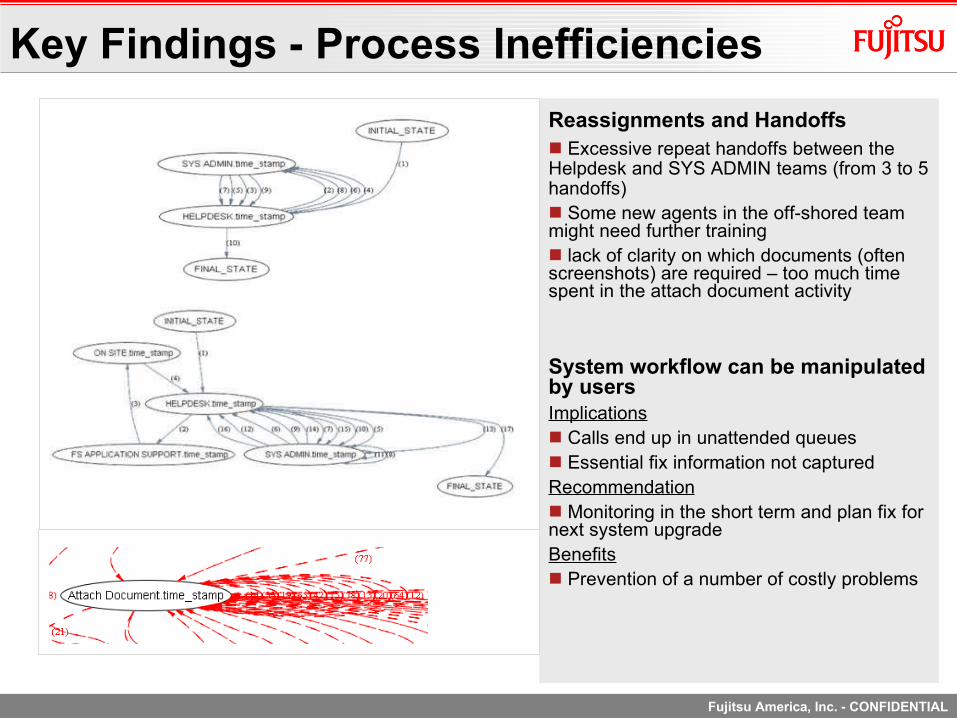
Key Findings - Process Inefficiencies
Reassignments and Handoffs Excessive repeat handoffs between the Helpdesk and SYS ADMIN teams (from 3 to 5 handoffs) Some new agents in the off-shored team might need further training lack of clarity on which documents (often screenshots) are required – too much time spent in the attach document activity
System workflow can be manipulated by usersImplications Calls end up in unattended queues Essential fix information not capturedRecommendation Monitoring in the short term and plan fix for next system upgradeBenefits Prevention of a number of costly problems
Fujitsu America, Inc. - CONFIDENTIAL
Automated Process DiscoveryDemo
Fujitsu America, Inc. - CONFIDENTIAL
18
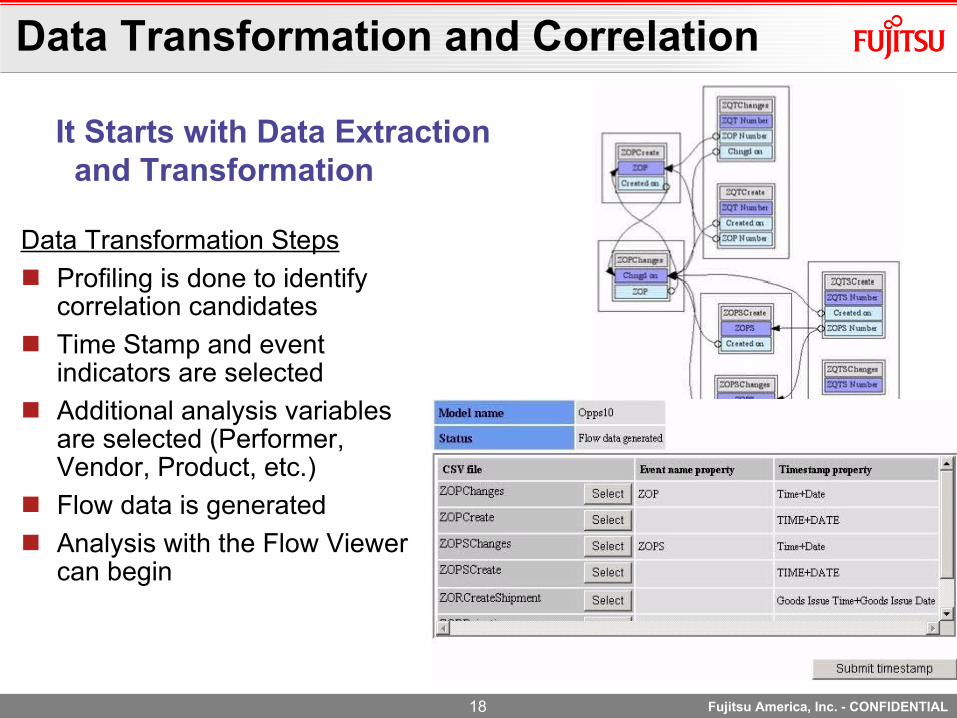
Data Transformation and Correlation
Data Transformation Steps
Profiling is done to identify correlation candidates
Time Stamp and event indicators are selected
Additional analysis variables are selected (Performer, Vendor, Product, etc.)
Flow data is generated
Analysis with the Flow Viewer can begin
It Starts with Data Extraction and Transformation
Fujitsu America, Inc. - CONFIDENTIAL
Copyright 2009 FUJITSU LIMITED19
Summary: Benefits From APD
Quick Discovery and Visualization of processes Insights for automation and process improvement initiatives Helps you ask the right questions – focus on “why” are things happening vs.
“what” is happening Non-invasive approach: Minimal disruption to customer’s business Fraction of the time compared to “interview” method for discovery Comparison of ‘As-Is’ and ‘Really-Is’ processes Diagnosis based on metrics
Responding and improving processes Improve and optimize high-visibility/high-impact processes Converge business processes to best-of-breed processes
Ensuring compliance Determine unauthorized actions/fraud – reduce risk from non-compliance
Jump-starts process improvement projects Process mapping in standards-based modeling environment Full BPM suite to instantiate “To Be” processes