fugro n.v. annual report 2008 -...
TRANSCRIPT
GEOTECHNIEK
MILIEU ONDERZOEK
MARINER
AN
NU
AL
RE
PO
RT
20
08
FU
GR
O N
.V
.
Annua l R e p o r t 2008F U G RO N .V.

Fugro N.V.
Veurse Achterweg 10
P.O. Box 41
2260 AA Leidschendam
The Netherlands
Telephone: +31 (0)70 3111422
Fax: +31 (0)70 3202703
E-mail: [email protected]
www.fugro.com
Trade Register number 27120091
VAT number 00 56 21 409 B01
C o l o p h o n
Fugro N.V.
Veurse Achterweg 10
2264 SG Leidschendam
The Netherlands
Telephone: +31 (0)70 3111422
Fax: +31 (0)70 3202703
Concept and realisation:
C&F Report Amsterdam B.V.
Photography and images:
Max and Co., Aberdeen
Picture Report, Amsterdam
Fugro N.V.
Fugro has endeavoured to fulfil all legal requirements
related to copyright. Anyone who, despite this, is of
the opinion that other copyright regulations could
be applicable should contact Fugro.
Translation: Technical Editing Services Limited,
Tattenhall, United Kingdom
This annual report is a translation of the official
report published in the Dutch language.
This annual report is also available on www.fugro.com.
For complete information, see www.fugro.com.
Cautionary Statement regarding Forward-Looking Statements
This annual report may contain forward-looking statements. Forward-looking statements are statements that are not historical facts, including
(but not limited to) statements expressing or implying Fugro N.V.’s beliefs, expectations, intentions, forecasts, estimates or predictions (and the
assumptions underlying them). Forward-looking statements necessarily involve risks and uncertainties. The actual future results and situations
may therefore differ materially from those expressed or implied in any forward-looking statements. Such differences may be caused by various
factors (including, but not limited to, developments in the oil and gas industry and related markets, currency risks and unexpected operational
setbacks). Any forward-looking statements contained in this annual report are based on information currently available to Fugro N.V.’s manage-
ment. Fugro N.V. assumes no obligation to make a public announcement in each case where there are changes in information related to,
or if there are otherwise changes or developments in respect of, the forward-looking statements in this annual report.
■ Preface from the President
and Chief Executive Officer 2
■ Fugro at a glance 3
Major developments in 2008 3
Key fi gures 4
Mission and profi le 6
Fugro’s activities 7
Financial targets and strategy 8
Information for shareholders 10
■ Report of the Supervisory Board 15
■ Report of the Board of Management 19
General 19
Acquisitions 20
Capacity adjustment 21
Business line changes 23
Financial 23
Dividend proposal 27
Market developments and trends 27
Backlog 29
Post balance sheet date events 29
Outlook 30
Important and interesting contracts 32
Geotechnical division 34
Survey division 36
Geoscience division 38
■ Theme: Deep, deeper, deepest 41
■ General information 54
Corporate Social Responsibility (CSR) 54
Health, Safety and Environment (HSE) 60
Information and Communication Technology (ICT) 60
Research 61
Risk management 61
Corporate governance 67
Corporate information 68
■ A n n u a l A c c o u n t s 2 0 0 8 75
1 Consolidated income statement 76
2 Consolidated statement of recognised
income and expense 77
3 Consolidated balance sheet 78
4 Consolidated statement of cash fl ows 79
5 Notes to the consolidated fi nancial statements 81
6 Subsidiaries and associates of Fugro N.V.
calculated using the equity method 138
7 Company balance sheet 141
8 Company income statement 142
9 Notes to the company fi nancial statements 143
10 Other information 147
Report of Fugro Trust Offi ce Foundation 150
Report of ANT Trust & Corporate Services N.V. 151
Historic review 152
Glossary 154
C o n t e n t s
A n n u a l R e p o r t 2 0 0 8
2
■ P r e f a c e f r o m t h e P r e s i d e n t
a n d C h i e f E x e c u t i v e O f f i c e r
D e a r s h a r e h o l d e r s a n d o t h e r s t a ke h o l d e r s ,
Last year we were able to successfully continue the
upward trend of previous years. The revenue increased
by more than 19% to over EUR 2.1 billion, and profi ts
increased by more than 31% to EUR 283.4 million. We now
have well over 13,600 employees and their enthousiasm
has been an essential contribution to our success. In
addition to the capacity expansion to support the strong
organic growth, we successfully concluded a number
of acquisitions. These have contributed to the further
expansion of our services and are creating growth
opportunities for the future.
The strong growth of the company has resulted in a
doubling of revenue over the last four years. This makes it
desirable to adapt the organisation, without endangering
Fugro’s key values, such as short communication lines
and a decentralised structure where we can operate close
to the clients. While maintaining the three-division
structure, the fastest growing business lines, Offshore
Survey and Development & Production, are subdivided as
from 2009 onwards. Further details are given in the report
of the Board of Management.
For the coming year, our strategy will remain focused on
delivering a broad spectrum of services to the oil and gas
industry that cover the entire life cycle of the production
fi elds. In addition, we will continue to supply services to
the mining and infrastructure industries. This way, Fugro
can react to growth in sectors such as energy, transport,
natural recources and water.
During the second half of last year market conditions
worldwide changed dramatically as a result of the
fi nancial crisis. This has led to a substantial drop in prices
of oil and gas and other minerals and left a number of
clients hesitant to make new investments. In a number of
countries the recession has already led to Governments
announcing stimulus packages to boost the economy in
areas such as infrastructure.
The general view with respect to the oil and gas
exploration for the long term has not changed. Due to the
depletion of existing fi elds and the increasing complexity
of exploring and developing new fi elds, large investments
will be needed in future to meet oil and gas demand.
Two national oil companies, for whom Fugro performs
many services, have announced that they will increase
their investment budgets signifi cantly during the coming
years, despite the lower oil price.
In the theme ‘Deep, deeper, deepest’ of this Annual Report
we will highlight the continuing development of oil and
gas exploration and production in ever deeper waters.
Much uncertainty exists at the moment about the
duration and seriousness of the worldwide economic
downturn. We start the new year with a strong backlog
and will keep a close eye on the developments. Our
healthy fi nancial position, cautiousness when entering
into new commitments and strict cost control
will help Fugro to weather this rather uncertain
forthcoming period.
Yours faithfully,
Fugro N.V.
K.S. Wester
President and Chief Executive Offi cer
3Fugro at a glance
■ F u g r o a t a g l a n c e
■ M A J O R D E V E L O P M E N T S I N 2 0 0 8
• It is proposed to increase the dividend in cash or
in (certifi cates of) ordinary shares to EUR 1.50 (2007:
EUR 1.25) per (certifi cate of an) ordinary share.
• At the end of 2008 the new seismic vessel Geo
Caribbean was added to the fl eet. In addition
another two vessels came into operation for survey
work. At the end of 2008 the Fugro fl eet comprised
55 vessels, of which 25 were fully owned.
• According to plan the investments in 2008 were
relatively high as a consequence of the capacity
expansion decided on in 2006.
• The annual revenue of the acquired operational
companies in 2008 amounts to approximately
EUR 64 million. The total cost of the acquisitions
completed in 2008 was EUR 66 million. In addition,
assets and related activities were acquired for an
amount of EUR 20 million in total.
• According to external publications, investments in
US dollars terms by the international oil and gas
industry in 2008 increased by more than 20%
compared to 2007 to around USD 450 billion.
In 2008 these investments led to a high demand
for services from suppliers to this industry.
The international segment is the most
important for Fugro. In this segment the
investments are expected to decrease with
about 6% to USD 300 billion.
• The backlog for 2009 amounts to EUR 1,600.4
million – an increase of 9.7% compared to the
beginning of 2008 (EUR 1,458.5 million). Based
upon equal exchange rates (measured in 2007
year-end exchange rates) the increase is 16.1%.
• In 2008 revenue increased by 19.5% to EUR 2,154.5
million (2007: EUR 1,802.7 million). Organic growth
was 23.4%. As a result of acquisitions, revenue
increased by 4.0%. Exchange rate variances had
a negative effect of 7.9% on revenue.
• The net result increased by 31.1% to
EUR 283.4 million (2007: EUR 216.2 million).
• The net profi t margin increased to 13.2%
(2007: 12.0%).
• The result from operating activities (EBIT)
increased by 18.9% to EUR 386.2 million
(2007: EUR 324.8 million). EBIT was negatively
infl uenced by an amount of around
EUR 25 million as a result of the estimated effects
of the current economical crisis on the valuation
of a number of balance sheet items.
• Profi t before income tax has been positively
impacted in 2008 by some EUR 26 million relating
to foreign exchange variances. The profi t and loss
account was negatively impacted by some
EUR 25 million relating to the impact of the
expected negative effects of the current worldwide
economic crisis on the valuation of a number of
balance sheet items.
• All three divisions contributed towards the much
improved result.
• Earnings per share increased by 25% to EUR 3.88
(2007: EUR 3.11). Cash fl ow per share was 24%
higher at EUR 6.01 (2007: EUR 4.84).
The term ‘shares’ as used in this Annual Report should, with respect to shares issued by Fugro N.V., be construed to include certificates of shares (also referred
to as ‘depositary receipts’ for shares) issued by Stichting Administratiekantoor Fugro (also referred to as ‘Fugro Trust Office Foundation’ or ‘Fugro Trust
Office’), unless the context otherwise requires or unless it is clear from the context that this is not the case. For further information please refer to page 69.
4
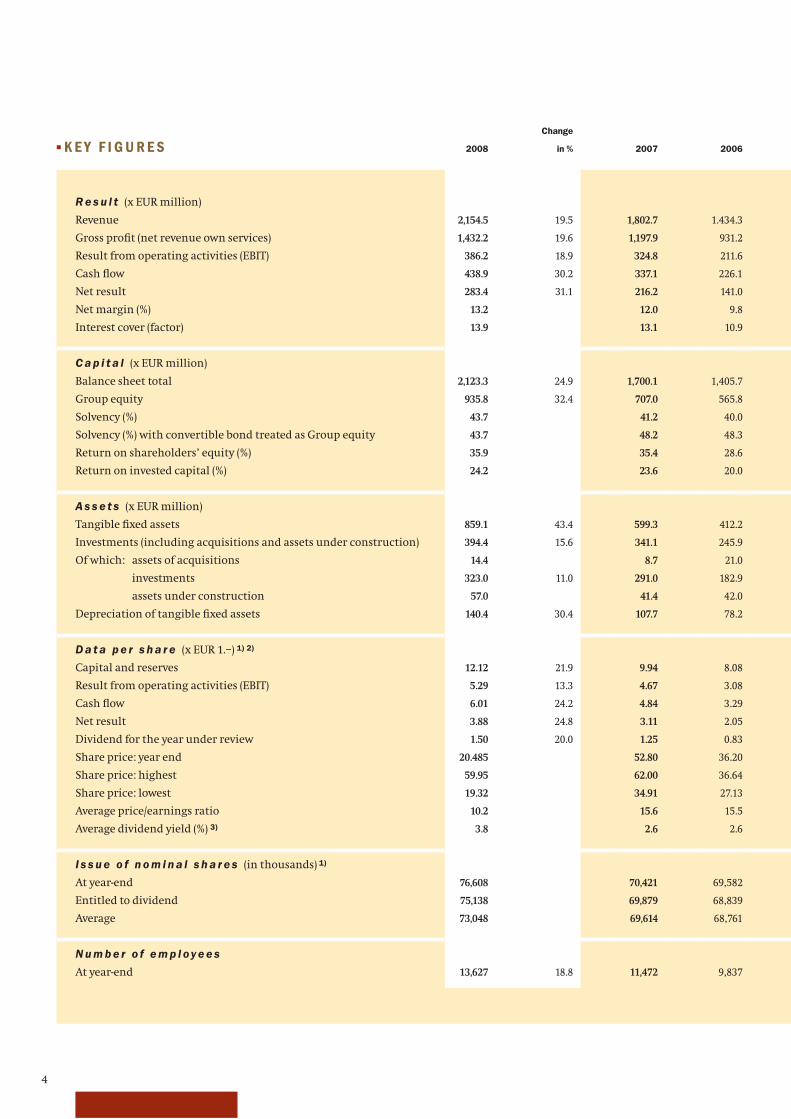
■ K E Y F I G U R E S 2008
Change
in % 2007 2006
R e s u l t (x EUR million)
Revenue 2,154.5 19.5 1,802.7 1.434.3
Gross profi t (net revenue own services) 1,432.2 19.6 1,197.9 931.2
Result from operating activities (EBIT) 386.2 18.9 324.8 211.6
Cash fl ow 438.9 30.2 337.1 226.1
Net result 283.4 31.1 216.2 141.0
Net margin (%) 13.2 12.0 9.8
Interest cover (factor) 13.9 13.1 10.9
C a p i t a l (x EUR million)
Balance sheet total 2,123.3 24.9 1,700.1 1,405.7
Group equity 935.8 32.4 707.0 565.8
Solvency (%) 43.7 41.2 40.0
Solvency (%) with convertible bond treated as Group equity 43.7 48.2 48.3
Return on shareholders’ equity (%) 35.9 35.4 28.6
Return on invested capital (%) 24.2 23.6 20.0
A s s e t s (x EUR million)
Tangible fi xed assets 859.1 43.4 599.3 412.2
Investments (including acquisitions and assets under construction) 394.4 15.6 341.1 245.9
Of which: assets of acquisitions 14.4 8.7 21.0
investments 323.0 11.0 291.0 182.9
assets under construction 57.0 41.4 42.0
Depreciation of tangible fi xed assets 140.4 30.4 107.7 78.2
D a t a p e r s h a r e (x EUR 1.–) 1) 2)
Capital and reserves 12.12 21.9 9.94 8.08
Result from operating activities (EBIT) 5.29 13.3 4.67 3.08
Cash fl ow 6.01 24.2 4.84 3.29
Net result 3.88 24.8 3.11 2.05
Dividend for the year under review 1.50 20.0 1.25 0.83
Share price: year end 20.485 52.80 36.20
Share price: highest 59.95 62.00 36.64
Share price: lowest 19.32 34.91 27.13
Average price/earnings ratio 10.2 15.6 15.5
Average dividend yield (%) 3) 3.8 2.6 2.6
I s s u e o f n o m i n a l s h a r e s (in thousands) 1)
At year-end 76,608 70,421 69,582
Entitled to dividend 75,138 69,879 68,839
Average 73,048 69,614 68,761
N u m b e r o f e m p l oy e e s
At year-end 13,627 18.8 11,472 9,837
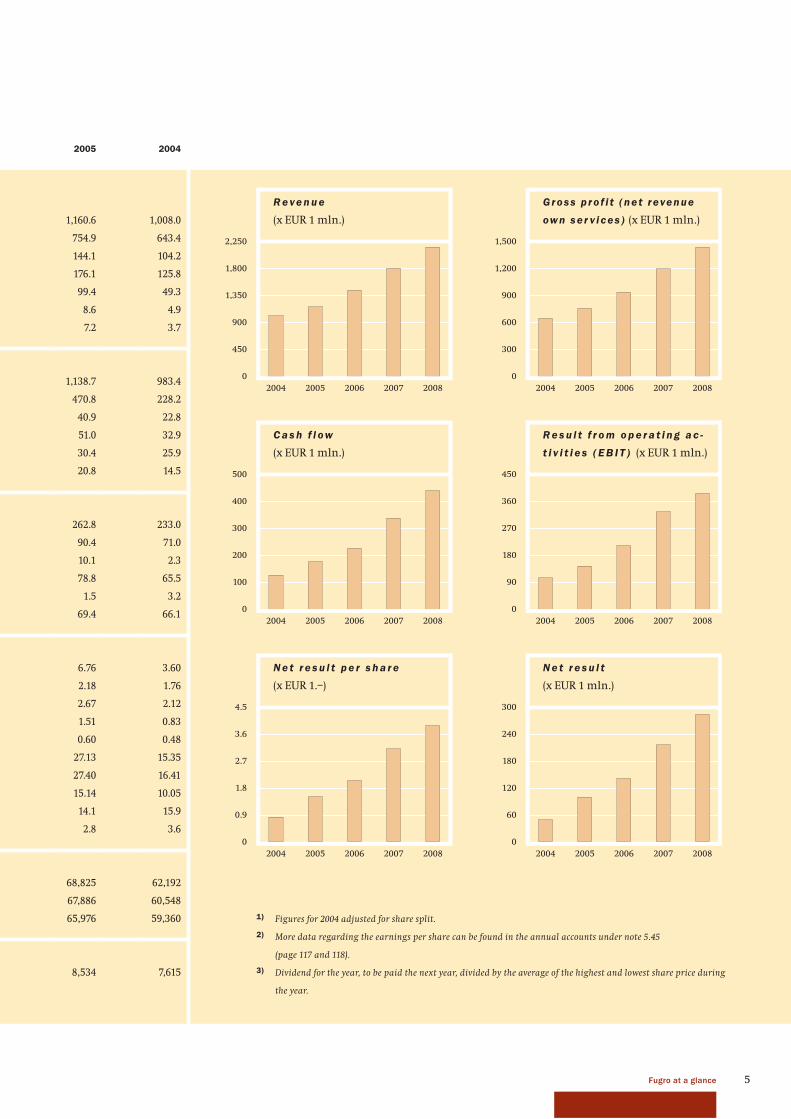
5Fugro at a glance
0
450
900
1,350
1,800
2,250
20082007200620052004
R e ve n u e
(x EUR 1 mln.)
0
300
600
900
1,200
1,500
20082007200620052004
Gross p ro f i t (net revenue
own ser v ices ) (x EUR 1 mln.)
0
100
200
300
400
500
20082007200620052004
C a s h f l ow
(x EUR 1 mln.)
0
60
120
180
240
300
20082007200620052004
N e t r e s u l t
(x EUR 1 mln.)
0
0.9
1.8
2.7
3.6
4.5
20082007200620052004
N e t r e s u l t p e r s h a r e
(x EUR 1.–)
0
90
180
270
360
450
20082007200620052004
R e s u l t f r o m o p e r a t i n g a c -
t i v i t i e s ( E B I T ) (x EUR 1 mln.)
2005 2004
1,160.6 1,008.0
754.9 643.4
144.1 104.2
176.1 125.8
99.4 49.3
8.6 4.9
7.2 3.7
1,138.7 983.4
470.8 228.2
40.9 22.8
51.0 32.9
30.4 25.9
20.8 14.5
262.8 233.0
90.4 71.0
10.1 2.3
78.8 65.5
1.5 3.2
69.4 66.1
6.76 3.60
2.18 1.76
2.67 2.12
1.51 0.83
0.60 0.48
27.13 15.35
27.40 16.41
15.14 10.05
14.1 15.9
2.8 3.6
68,825 62,192
67,886 60,548
65,976 59,360
8,534 7,615
1) Figures for 2004 adjusted for share split.
2) More data regarding the earnings per share can be found in the annual accounts under note 5.45
(page 117 and 118).
3) Dividend for the year, to be paid the next year, divided by the average of the highest and lowest share price during
the year.
6
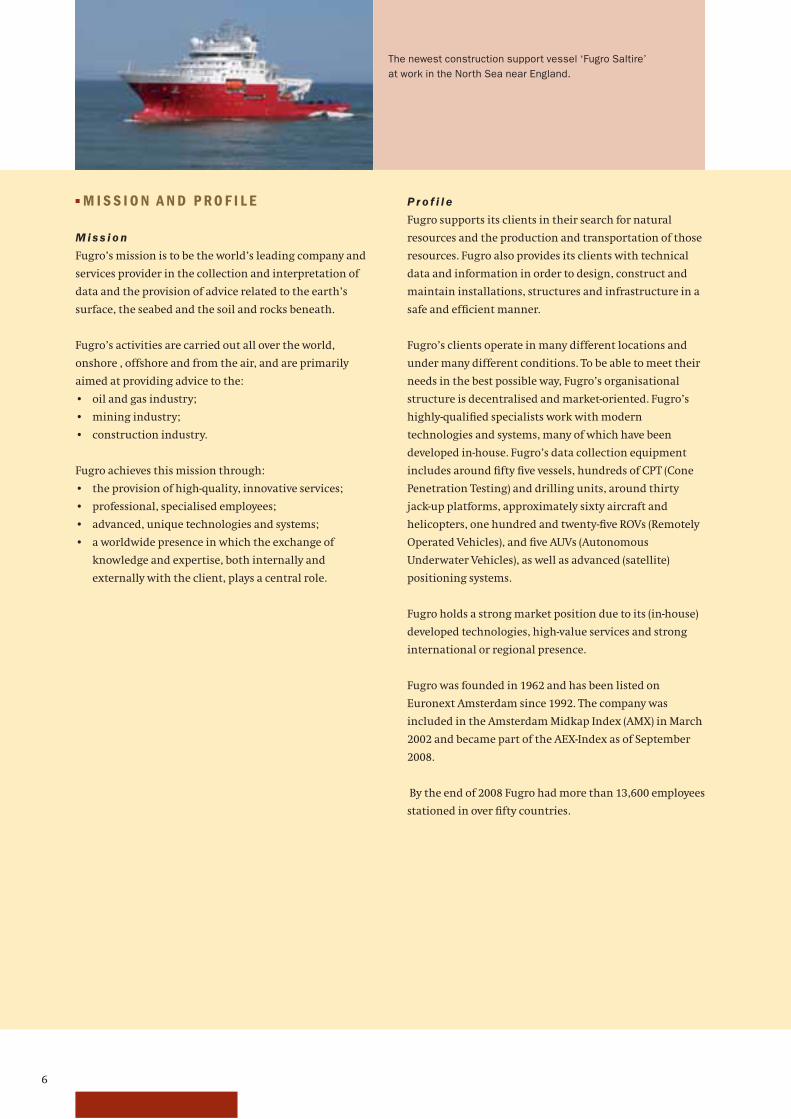
The newest construction support vessel ‘Fugro Saltire’
at work in the North Sea near England.
■ M I S S I O N A N D P RO F I L E
M i s s i o n
Fugro’s mission is to be the world’s leading company and
services provider in the collection and interpretation of
data and the provision of advice related to the earth’s
surface, the seabed and the soil and rocks beneath.
Fugro’s activities are carried out all over the world,
onshore , offshore and from the air, and are primarily
aimed at providing advice to the:
• oil and gas industry;
• mining industry;
• construction industry.
Fugro achieves this mission through:
• the provision of high-quality, innovative services;
• professional, specialised employees;
• advanced, unique technologies and systems;
• a worldwide presence in which the exchange of
knowledge and expertise, both internally and
externally with the client, plays a central role.
P r o f i l e
Fugro supports its clients in their search for natural
resources and the production and transportation of those
resources. Fugro also provides its clients with technical
data and information in order to design, construct and
maintain installations, structures and infrastructure in a
safe and effi cient manner.
Fugro’s clients operate in many different locations and
under many different conditions. To be able to meet their
needs in the best possible way, Fugro’s organisational
structure is decentralised and market-oriented. Fugro’s
highly-qualifi ed specialists work with modern
technologies and systems, many of which have been
developed in-house. Fugro’s data collection equipment
includes around fi fty fi ve vessels, hundreds of CPT (Cone
Penetration Testing) and drilling units, around thirty
jack-up platforms, approximately sixty aircraft and
helicopters, one hundred and twenty-fi ve ROVs (Remotely
Operated Vehicles), and fi ve AUVs (Autonomous
Underwater Vehicles), as well as advanced (satellite)
positioning systems.
Fugro holds a strong market position due to its (in-house)
developed technologies, high-value services and strong
international or regional presence.
Fugro was founded in 1962 and has been listed on
Euronext Amsterdam since 1992. The company was
included in the Amsterdam Midkap Index (AMX) in March
2002 and became part of the AEX-Index as of September
2008.
By the end of 2008 Fugro had more than 13,600 employees
stationed in over fi fty countries.
7Fugro at a glance
■ F U G RO ’ S A C T I V I T I E S
The nature of its specialist services means that Fugro is
particularly involved in large and complex projects.
Consequently, to achieve the optimum results, clients are
offered a combination of a range of Fugro’s activities and
services. The scope of the cohesive activities Fugro offers
worldwide is unique. The activities are arranged in three
divisions: Geotechnical, Survey and Geoscience.
G e o t e c h n i c a l
The Geotechnical division provides consultancy services,
making use of in-house developed technologies in order to
collect data combined with expertise in data analysis and
advise on foundation design and soil mechanics. These
services support clients’ projects worldwide in all
environments, onshore, near shore and offshore
including deep water, and for a multitude of markets,
infrastructure development, construction, materials
testing, water resources and the construction of oil and
gas installations.
S u r vey
The Survey division covers a range of services to support
the activities of the oil and gas industry, including
geophysical investigation using dedicated vessels,
construction support services, remotely operated vehicles
(ROVs) operations employed in subsea construction and
drilling environment and meteorological and
oceanographic studies, as well as Fugro’s global
positioning system Starfi x providing precise positioning
and navigation. Outside the oil and gas industry the
division performs route surveys for the telecoms industry
and hydrographic charting for Governmental clients.
Terrestrial and airborne services are focused on local and
regional markets with clients such as governments,
public services, industry and construction.
G e o s c i e n c e
The Geoscience division concentrates on gathering,
processing, interpreting, managing and storing
geophysical, geological and technical data for
the evaluation of the presence of natural resources,
including oil, gas, water and minerals, and also to
optimise the exploration, development and production of
those resources. The collection of data at sea mainly takes
place by seismic survey. On land various special non-
seismic measuring techniques are used from low fl ying
airplanes and helicopters to collect the data. Clients
are oil and gas companies, mining, industry and
governmental organisations.
8
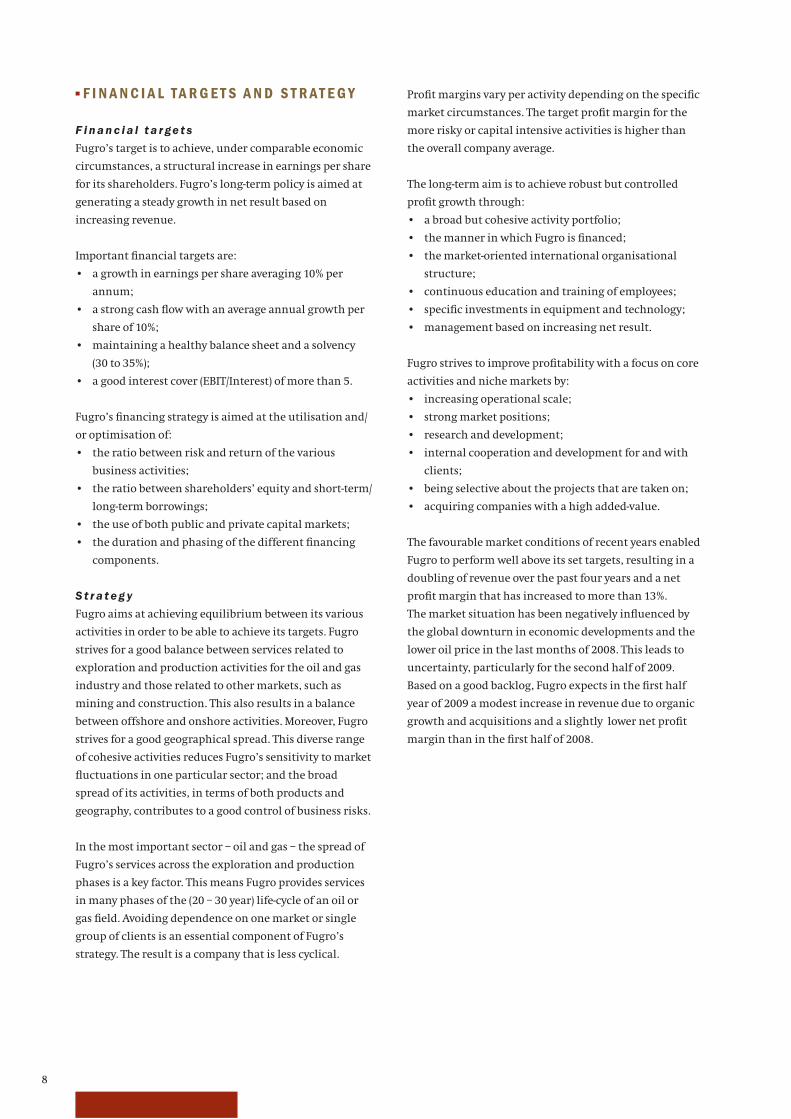
■ F I N A N C I A L TA R G E T S A N D S T R AT E G Y
F i n a n c i a l t a r ge t s
Fugro’s target is to achieve, under comparable economic
circumstances, a structural increase in earnings per share
for its shareholders. Fugro’s long-term policy is aimed at
generating a steady growth in net result based on
increasing revenue.
Important fi nancial targets are:
• a growth in earnings per share averaging 10% per
annum;
• a strong cash fl ow with an average annual growth per
share of 10%;
• maintaining a healthy balance sheet and a solvency
(30 to 35%);
• a good interest cover (EBIT/Interest) of more than 5.
Fugro’s fi nancing strategy is aimed at the utilisation and/
or optimisation of:
• the ratio between risk and return of the various
business activities;
• the ratio between shareholders’ equity and short-term/
long-term borrowings;
• the use of both public and private capital markets;
• the duration and phasing of the different fi nancing
components.
S t r a t e g y
Fugro aims at achieving equilibrium between its various
activities in order to be able to achieve its targets. Fugro
strives for a good balance between services related to
exploration and production activities for the oil and gas
industry and those related to other markets, such as
mining and construction. This also results in a balance
between offshore and onshore activities. Moreover, Fugro
strives for a good geographical spread. This diverse range
of cohesive activities reduces Fugro’s sensitivity to market
fl uctuations in one particular sector; and the broad
spread of its activities, in terms of both products and
geography, contributes to a good control of business risks.
In the most important sector – oil and gas – the spread of
Fugro’s services across the exploration and production
phases is a key factor. This means Fugro provides services
in many phases of the (20 – 30 year) life-cycle of an oil or
gas fi eld. Avoiding dependence on one market or single
group of clients is an essential component of Fugro’s
strategy. The result is a company that is less cyclical.
Profi t margins vary per activity depending on the specifi c
market circumstances. The target profi t margin for the
more risky or capital intensive activities is higher than
the overall company average.
The long-term aim is to achieve robust but controlled
profi t growth through:
• a broad but cohesive activity portfolio;
• the manner in which Fugro is fi nanced;
• the market-oriented international organisational
structure;
• continuous education and training of employees;
• specifi c investments in equipment and technology;
• management based on increasing net result.
Fugro strives to improve profi tability with a focus on core
activities and niche markets by:
• increasing operational scale;
• strong market positions;
• research and development;
• internal cooperation and development for and with
clients;
• being selective about the projects that are taken on;
• acquiring companies with a high added-value.
The favourable market conditions of recent years enabled
Fugro to perform well above its set targets, resulting in a
doubling of revenue over the past four years and a net
profi t margin that has increased to more than 13%.
The market situation has been negatively infl uenced by
the global downturn in economic developments and the
lower oil price in the last months of 2008. This leads to
uncertainty, particularly for the second half of 2009.
Based on a good backlog, Fugro expects in the fi rst half
year of 2009 a modest increase in revenue due to organic
growth and acquisitions and a slightly lower net profi t
margin than in the fi rst half of 2008.
9Fugro at a glance
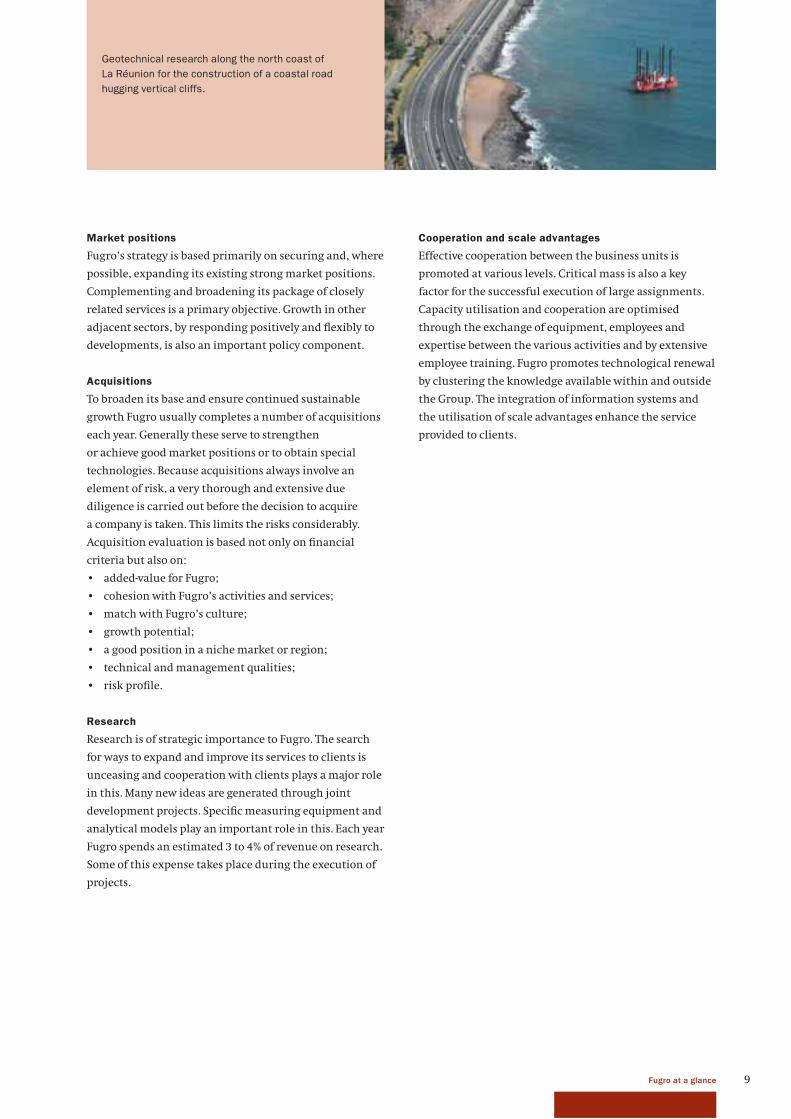
Geotechnical research along the north coast of
La Réunion for the construction of a coastal road
hugging vertical cliffs.
Market positions
Fugro’s strategy is based primarily on securing and, where
possible, expanding its existing strong market positions.
Complementing and broadening its package of closely
related services is a primary objective. Growth in other
adjacent sectors, by responding positively and fl exibly to
developments, is also an important policy component.
Acquisitions
To broaden its base and ensure continued sustainable
growth Fugro usually completes a number of acquisitions
each year. Generally these serve to strengthen
or achieve good market positions or to obtain special
technologies. Because acquisitions always involve an
element of risk, a very thorough and extensive due
diligence is carried out before the decision to acquire
a company is taken. This limits the risks considerably.
Acquisition evaluation is based not only on fi nancial
criteria but also on:
• added-value for Fugro;
• cohesion with Fugro’s activities and services;
• match with Fugro’s culture;
• growth potential;
• a good position in a niche market or region;
• technical and management qualities;
• risk profi le.
Research
Research is of strategic importance to Fugro. The search
for ways to expand and improve its services to clients is
unceasing and cooperation with clients plays a major role
in this. Many new ideas are generated through joint
development projects. Specifi c measuring equipment and
analytical models play an important role in this. Each year
Fugro spends an estimated 3 to 4% of revenue on research.
Some of this expense takes place during the execution of
projects.
Cooperation and scale advantages
Effective cooperation between the business units is
promoted at various levels. Critical mass is also a key
factor for the successful execution of large assignments.
Capacity utilisation and cooperation are optimised
through the exchange of equipment, employees and
expertise between the various activities and by extensive
employee training. Fugro promotes technological renewal
by clustering the knowledge available within and outside
the Group. The integration of information systems and
the utilisation of scale advantages enhance the service
provided to clients.
10
■ I N F O R M AT I O N F O R S H A R E H O L D E R S
I m p o r t a n t d a t e s
6 March 2009 Publication of the 2008 annual fi gures, press conference and analysts’ meeting with
webcast
30 April 2009 Record date for registration to attend the Annual General Meeting of Shareholders
7 May 2009,
before trading hours
Trading update regarding the development of the business
7 May 2009, 14.00 hours Annual General Meeting of Shareholders in The Hague, Crowne Plaza The Hague
– Promenade Hotel, dual language webcast (Dutch and English)
11 May 2009 Ex-dividend date
13 May 2009 Record date entitlement to dividend
22 May 2009 Last date for notifi cation of dividend preference
27 May 2009,
after trading hours
Determination and publication of the optional dividend in (certifi cates of) shares,
based on the average share price at the close of business of the stock exchange
on 25, 26 and 27 May
29 May 2009 Payment of the dividend related to fi nancial year 2008
7 August 2009 Publication of the half-yearly fi gures and announcement of the profi t forecast for 2009,
press conference and analysts’ meeting with webcast
19 November 2009,
before trading hours Trading update regarding the development of the business
5 March 2010 Publication of the 2009 annual fi gures, press conference and analysts’ meeting with
webcast
D a t a p e r s h a r e
(x EUR 1.–) 2008 2007 2006 2005 2004
Cash fl ow 6.01 4.84 3.29 2.67 2.12
Net result 3.88 3.11 2.05 1.51 0.83
Dividend paid out in the year under review 1.25 0.83 0.60 0.48 0.48
Proposed dividend over the year under review 1.50 1.25 0.83 0.60 0.48
L i s t i n g o n t h e s t o c k e x c h a n ge
Fugro certifi cates of shares are listed on Euronext
Amsterdam. Since March 2002 Fugro was included in
Euronext’s Amsterdam Midkap Index (AMX) and became
part of the AEX-Index as of September 2008, with a
weighing factor of 0.9% of the index. The market
capitalisation of the Company at the end of February 2009
amounts to approximately EUR 1.6 billion. Since 8 July
2002 Fugro share options have also been traded on
Euronext Amsterdam Derivative Markets.
As far as is known, approximately 66% of the (certifi cates
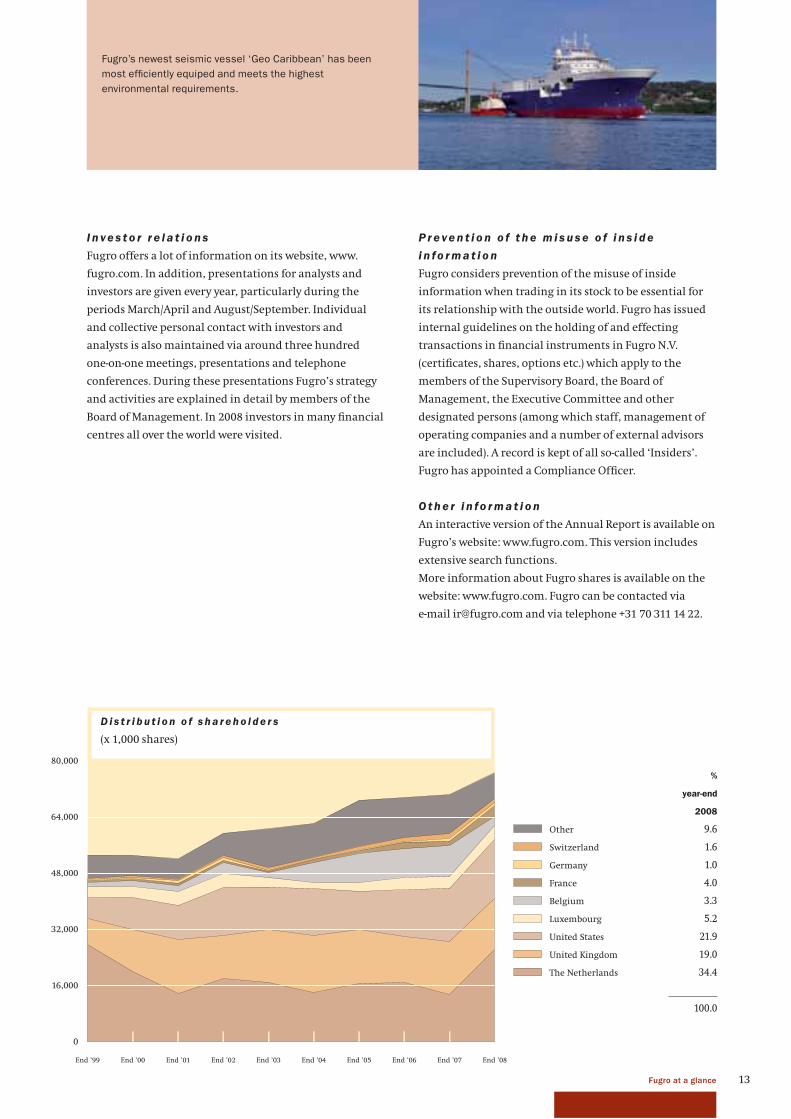
of) shares are held by foreign investors, mainly from the
United Kingdom and the United States.
Information per share can be found on pages 4 and 5
(key fi gures) and on pages 10, 116 and 117.
D i v i d e n d p o l i c y
Fugro strives for a pay-out ratio of 35 to 55% of the net
result. The shareholder may choose between a dividend
entirely in cash or entirely in (certifi cates of) shares
charged to the reserves.
In 2008 around 61% of the shareholders opted to receive
the dividend for 2007 in the form of (certifi cates of) shares
(in 2007: 63%). 1,028,345 shares have been issued for this
purpose.
D i v i d e n d fo r 2 0 0 8
It is proposed that the dividend for 2008 will be increased
to EUR 1.50 per ordinary share (2007: EUR 1.25), paid,
according to the preference of the holder:
• in cash, or
• in (certifi cates of) ordinary shares.
11Fugro at a glance
M o ve m e n t i n n u m b e r o f s h a r e s p u r c h a s e d
fo r o p t i o n p l a n
2008 2007
Situation on 1/1 542,716 743,396
Purchased 1,581,000 700,000
Sold in connection with
option exercised (654,020) (900,680)
Situation on 31/12 1,469,696 542,716
Granted, not exercised
options as of 31/12 5,993,550 5,524,020
C h a n ge i n i s s u e d
s h a r e s 2008 2007
Issued on 1/1 70,421,443 69,582,201
Optional dividend 1,028,345 838,830
Conversion of convertible
bond 5,158,170 412
Issued on 31/12 76,607,958 70,421,443
Purchased for option
plan at 31/12 1,469,696 542,716
Entitled to dividend
as of 31/12 75,138,262 69,878,727
Average number of
outstanding shares 73,047,931 69,614,020The proposed dividend equates to a pay-out percentage
of 39.8% of the net profi t.
Shareholders have until 22 May 2009 to make their
dividend preference known. The determination of the
number of shares that entitles the holder to one new
share will take place on 27 May 2009 at the close of
business of the stock exchange and will be based on the
average share price at the close of business of the stock
exchange on 25, 26 and 27 May 2009. To arrive at a whole
number a deviation of a maximum of 5% of the calculated
value may be applied. The dividend will be made payable
on 29 May 2009.
The percentage of shares and share certifi cates that was
represented in person or by proxy in the shareholders’
meetings over the past three years was as follows:
A ge n d a fo r s h a r e h o l d e r s ’ m e e t i n g
The agenda, including explanatory notes, of the
shareholders meeting will be posted timely on the website
www.fugro.com. Hard copies of the agenda can be ordered
by telephone (+ 31 (0)70 – 311 14 22) or via e-mail
R e m o t e e l e c t r o n i c v o t i n g
Depending on experience with the use of electronic
means of communication to follow the course of a general
meeting of shareholders and to cast votes during the
meeting without being physically present or by proxy,
Fugro will decide whether to facilitate this.
S h a r e / c e r t i f i c a t e h o l d i n g s o f 5 % o r m o r e
As far as we are aware the only holders of more than 5% (as
referred to in the Financial Markets Supervision Act in the
Netherlands) in Fugro’s N.V.’s share capital (apart from
the Fugro Trust Offi ce) are the following:
ING Groep N.V. 9.64%
G-J. Kramer 1) 6.00%
1) In person and via Woestduin Holding N.V.
As stated on page 10, only certifi cates of ordinary shares
are listed on Euronext Amsterdam. These certifi cates of
ordinary shares are issued by the Fugro Trust Offi ce,
which carries out the administration of the underlying
ordinary shares (for which it has issued the certifi cates).
On 1 February 2009 the Fugro Trust Offi ce held 91.48% of
the issued ordinary shares.
Certifi -
cates and
shares
Shares
held by
Fugro Trust
Offi ce*
% of issued
share
capital
AGM 2008 34.3 64.9 99.2
AGM 2007 42.1 56.9 99.0
AGM 2006 23.5 75.9 99.4
* Fugro Trust Office (Stichting Administratiekantoor Fugro)
votes on the shares for which certificates have been issued and
on which shares the certificate holders don’t vote themselves
as representative of the Trust Office.
12
them being granted, although the resulting fi ne of 90% of
the net profi t (after deduction of taxes) would make this
very unattractive. For the grants after 31 December 2006
the vesting period for all employee options is three years.
In the year under review Fugro purchased 1,581,000
certifi cates of shares at an average price of EUR 47.92 to
cover the option scheme. On 31 December 2008 1,469,696
certifi cates of shares were held for the purpose of Fugro’s
option scheme. These certifi cates of shares are not
entitled to dividend and there are no voting rights
attached to the underlying shares. The exercise of all the
options outstanding at the end of 2008, including the
options granted on 31 December 2008, could – after using
the purchased certifi cates of shares – lead to an increase
of the issued share capital by a maximum of 5.9%. Since
the beginning of 2009, 1,500 options have been exercised.
Pa r t i c i p a t i o n s a n d e m p l oy e e o p t i o n s
As far as is known, on 31 December 2008 around 1.1% of
Fugro’s equity (and an unknown number of certifi cates)
was held by Directors and employees.
Of the total number of employee options granted during
the past years, 4,851,650 options (excluding the option
grants as per 31 December 2008) were still outstanding on
31 December 2008. On 31 December 2008, 1,141,900 new
options, with an exercise price of EUR 20,485, were
granted to a total of 620 employees. Of these options 27.6%
was granted to members of Fugro’s Board of Management
(see also page 134 and page 135).
Options are granted to an extensive group of employees.
The granting of options is dependent on the achievement
of the targets of the Group as a whole and of the
individual operating companies as well as on the
contribution of the relevant employee and the Company’s
long-term growth.
Employee options are granted annually on 31 December
and the option exercise price is equal to the price of the
certifi cates at the closing of Euronext Amsterdam on the
last trading day of the year. The options granted are
unconditional and the option period is six years. The
vesting period for the granted options is three years
starting at the fi rst of January of the year following the
grant date. The only exceptions are the options which
were granted to Dutch residents on 31 December 2006.
These options may also be exercised within three years of
0
15
30
45
60
75
0
6,000
12,000
18,000
24,000
30,000
2004 2005 2006 2007 2008
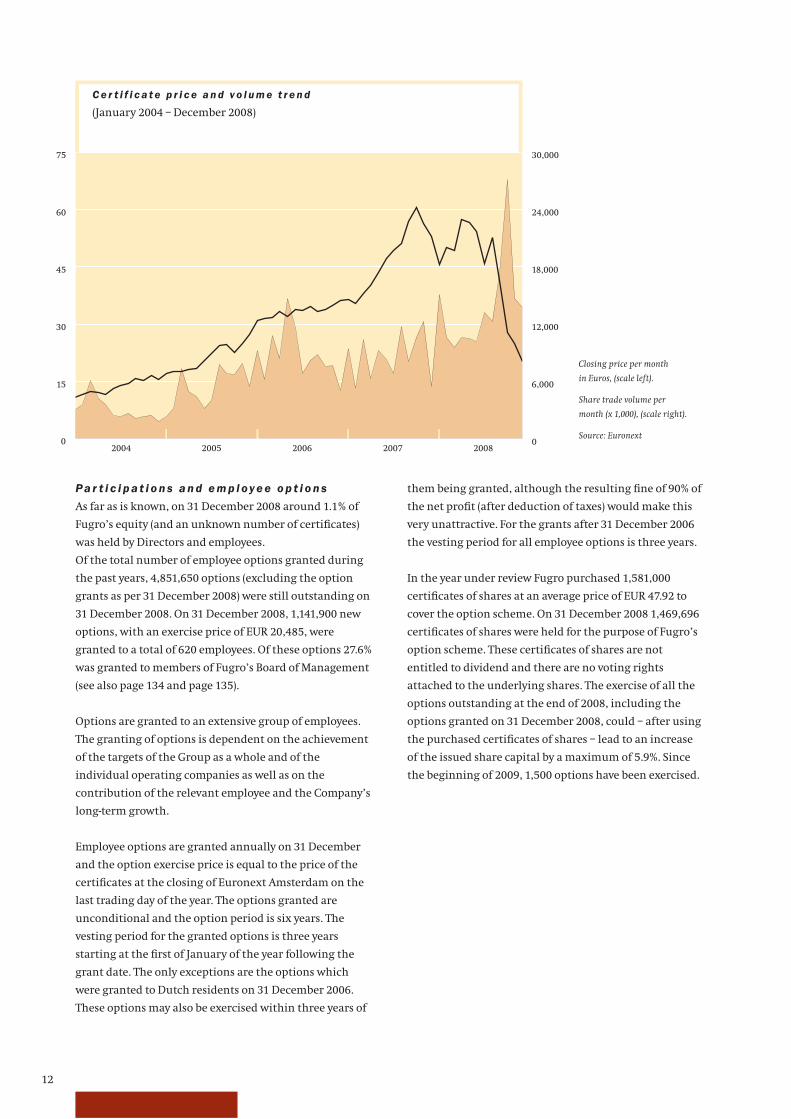
Closing price per month
in Euros, (scale left).
Share trade volume per
month (x 1,000), (scale right).
Source: Euronext
C e r t i f i c a t e p r i c e a n d v o l u m e t r e n d
(January 2004 – December 2008)
13Fugro at a glance
Fugro’s newest seismic vessel ‘Geo Caribbean’ has been
most effi ciently equiped and meets the highest
environmental requirements.
0
16,000
32,000
48,000
64,000
80,000
End ’07 End ’08End ’06End ’05End ’04End ’03End ’02End ’01End ’00End ’99
The Netherlands
United Kingdom
United States
France
Germany
Luxembourg
Belgium
Switzerland
Other
D i s t r i b u t i o n o f s h a r e h o l d e r s
(x 1,000 shares)
%
year-end
2008
9.6
1.6
1.0
4.0
3.3
5.2
21.9
19.0
34.4
100.0
P r e ve n t i o n o f t h e m i s u s e o f i n s i d e
i n fo r m a t i o n
Fugro considers prevention of the misuse of inside
information when trading in its stock to be essential for
its relationship with the outside world. Fugro has issued
internal guidelines on the holding of and effecting
transactions in fi nancial instruments in Fugro N.V.
(certifi cates, shares, options etc.) which apply to the
members of the Supervisory Board, the Board of
Management, the Executive Committee and other
designated persons (among which staff, management of
operating companies and a number of external advisors
are included). A record is kept of all so-called ‘Insiders’.
Fugro has appointed a Compliance Offi cer.
O t h e r i n fo r m a t i o n
An interactive version of the Annual Report is available on
Fugro’s website: www.fugro.com. This version includes
extensive search functions.
More information about Fugro shares is available on the
website: www.fugro.com. Fugro can be contacted via
e-mail [email protected] and via telephone +31 70 311 14 22.
I n ve s t o r r e l a t i o n s
Fugro offers a lot of information on its website, www.
fugro.com. In addition, presentations for analysts and
investors are given every year, particularly during the
periods March/April and August/September. Individual
and collective personal contact with investors and
analysts is also maintained via around three hundred
one-on-one meetings, presentations and telephone
conferences. During these presentations Fugro’s strategy
and activities are explained in detail by members of the
Board of Management. In 2008 investors in many fi nancial
centres all over the world were visited.
14
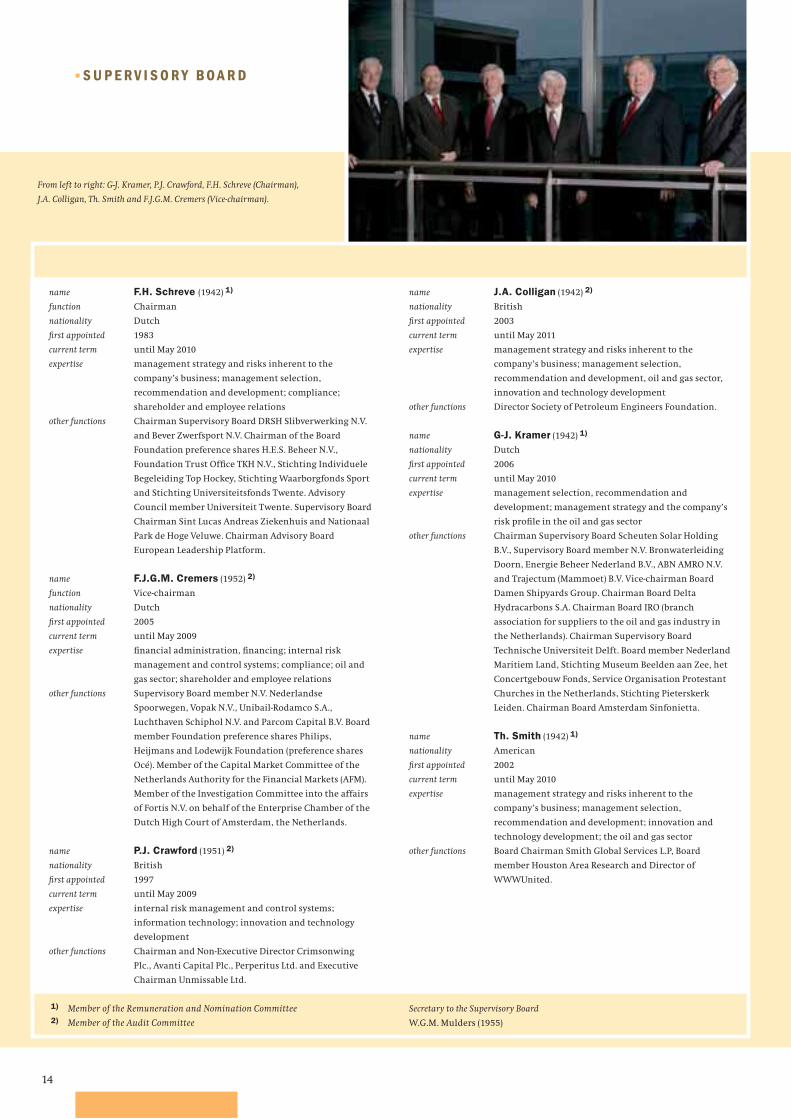
From left to right: G-J. Kramer, P.J. Crawford, F.H. Schreve (Chairman),
J.A. Colligan, Th. Smith and F.J.G.M. Cremers (Vice-chairman).
name F.H. Schreve (1942) 1)
function Chairman
nationality Dutch
fi rst appointed 1983
current term until May 2010
expertise management strategy and risks inherent to the
company’s business; management selection,
recommendation and development; compliance;
shareholder and employee relations
other functions Chairman Supervisory Board DRSH Slibverwerking N.V.
and Bever Zwerfsport N.V. Chairman of the Board
Foundation preference shares H.E.S. Beheer N.V.,
Foundation Trust Offi ce TKH N.V., Stichting Individuele
Begeleiding Top Hockey, Stichting Waarborgfonds Sport
and Stichting Universiteitsfonds Twente. Advisory
Council member Universiteit Twente. Supervisory Board
Chairman Sint Lucas Andreas Ziekenhuis and Nationaal
Park de Hoge Veluwe. Chairman Advisory Board
European Leadership Platform.
name F.J.G.M. Cremers (1952) 2)
function Vice-chairman
nationality Dutch
fi rst appointed 2005
current term until May 2009
expertise fi nancial administration, fi nancing; internal risk
management and control systems; compliance; oil and
gas sector; shareholder and employee relations
other functions Supervisory Board member N.V. Nederlandse
Spoorwegen, Vopak N.V., Unibail-Rodamco S.A.,
Luchthaven Schiphol N.V. and Parcom Capital B.V. Board
member Foundation preference shares Philips,
Heijmans and Lodewijk Foundation (preference shares
Océ). Member of the Capital Market Committee of the
Netherlands Authority for the Financial Markets (AFM).
Member of the Investigation Committee into the affairs
of Fortis N.V. on behalf of the Enterprise Chamber of the
Dutch High Court of Amsterdam, the Netherlands.
name P.J. Crawford (1951) 2)
nationality British
fi rst appointed 1997
current term until May 2009
expertise internal risk management and control systems;
information technology; innovation and technology
development
other functions Chairman and Non-Executive Director Crimsonwing
Plc., Avanti Capital Plc., Perperitus Ltd. and Executive
Chairman Unmissable Ltd.
name J.A. Colligan (1942) 2)
nationality British
fi rst appointed 2003
current term until May 2011
expertise management strategy and risks inherent to the
company’s business; management selection,
recommendation and development, oil and gas sector,
innovation and technology development
other functions Director Society of Petroleum Engineers Foundation.
name G-J. Kramer (1942) 1)
nationality Dutch
fi rst appointed 2006
current term until May 2010
expertise management selection, recommendation and
development; management strategy and the company’s
risk profi le in the oil and gas sector
other functions Chairman Supervisory Board Scheuten Solar Holding
B.V., Supervisory Board member N.V. Bronwaterleiding
Doorn, Energie Beheer Nederland B.V., ABN AMRO N.V.
and Trajectum (Mammoet) B.V. Vice-chairman Board
Damen Shipyards Group. Chairman Board Delta
Hydracarbons S.A. Chairman Board IRO (branch
association for suppliers to the oil and gas industry in
the Netherlands). Chairman Supervisory Board
Technische Universiteit Delft. Board member Nederland
Maritiem Land, Stichting Museum Beelden aan Zee, het
Concertgebouw Fonds, Service Organisation Protestant
Churches in the Netherlands, Stichting Pieterskerk
Leiden. Chairman Board Amsterdam Sinfonietta.
name Th. Smith (1942) 1)
nationality American
fi rst appointed 2002
current term until May 2010
expertise management strategy and risks inherent to the
company’s business; management selection,
recommendation and development; innovation and
technology development; the oil and gas sector
other functions Board Chairman Smith Global Services L.P, Board
member Houston Area Research and Director of
WWWUnited.
1) Member of the Remuneration and Nomination Committee
2) Member of the Audit Committee
Secretary to the Supervisory Board
W.G.M. Mulders (1955)
■ S U P E R V I S O R Y BO A R D
15Report of the Supervisory Board* The Dutch Corporate Governance Code applicable for the financial year 2008.
■ R e p o r t o f t h e S u p e r v i s o r y B o a r d
The year 2008 was again excellent for Fugro, despite
the fast developing worldwide economic crisis.
The revenue and net result increased substantially
and the market position was strengthened further.
The specifi c strategy that Fugro pursues is being
implemented consistently on a fi nancial, organisational
and professional basis. Through this, Fugro has built a
balanced portfolio of activities and services and secured
worldwide market positions. The Supervisory Board is
convinced that Fugro will be able to withstand the
consequences of the worldwide economic downturn and
has confi dence in the future of Fugro.
A n n u a l a c c o u n t s a n d d i v i d e n d p r o p o s a l
This Annual Report includes the 2008 Annual Accounts,
which are accompanied by an unqualifi ed report of the
external auditor, KPMG Accountants N.V. (‘KPMG’). These
Annual Accounts were prepared in accordance with
International Financial Reporting Standards as adopted
by the European Union and section 9 of Book 2 of the
Dutch Civil Code.
We have discussed the Annual Accounts with the Board of
Management in the presence of KPMG. We are of the
opinion that the Annual Accounts and the report by the
Board of Management provide a true and fair picture of
the state of affairs within Fugro and form a good basis on
which to hold the Board of Management accountable for
the management policies pursued and the Supervisory
Board accountable for its supervision of the management
policies pursued. We have signed the Annual Accounts
pursuant to our statutory obligation under article 2:101.2
of Book 2 of the Dutch Civil Code.
We propose that the shareholders adopt the 2008 Annual
Accounts and discharge the Board of Management for its
management and the Supervisory Board for its
supervision.
We endorse the proposal of the Board of Management
to increase the dividend for 2008 to EUR 1.50 per
(certifi cate of an) ordinary share (2007: EUR 1.25).
This dividend comprises either a cash payment or
a settlement in (certifi cates of) ordinary shares, whichever
the shareholder or the certifi cate holder prefers. The
proposed dividend equates to a pay-out percentage of
39.8% of the net result.
C o m p o s i t i o n a n d p r o f i l e o f t h e S u p e r v i s o r y
B o a r d
The Supervisory Board comprises of persons with Dutch,
British and American nationality. Information about each
member of the Supervisory Board is included on page 14.
The profi le of the Supervisory Board describes the range
of expertise that should be represented in our Board.
This relates to knowledge and experience in the fi elds of
strategy, fi nance, fi nancial control, information
technology, management and organisation, employee and
social policy, marketing, innovation and technological
development, and the oil and gas industry. The division of
duties within the Supervisory Board and the procedures
of the Supervisory Board and its committees are laid down
in a set of regulations. Both the profi le and the
regulations are posted on Fugro’s website, www.fugro.
com. In our opinion both the composition of the
Supervisory Board and the expertise and experience of its
individual members meet the stipulated requirements.
The requirements of the Dutch Corporate Governance
Code* (the ‘Code’) are fulfi lled with respect to the
independence of the Supervisory Directors. The exception
is Mr. G-J. Kramer, former CEO of Fugro, who is not
independent as defi ned by the Code. This exception is in
accordance with the Code and as a result the composition
of our Board fulfi ls the independence stipulation. In
addition Supervisory Board members do not carry out any
other functions that could jeopardise their independence.
During the year under review none of the Supervisory
Board members held any shares, or certifi cates of shares,
in the Company or securities related to the Company, with
the exception of Mr. Kramer who, as the former CEO of the
Company, holds employee options awarded to him at that
time in that capacity. Besides that Mr. Kramer also holds a
substantial interest in Fugro.
P l e n a r y a c t i v i t i e s
In the year under review fi ve scheduled meetings, each
lasting several days, were convened by the Supervisory
Board and the Board of Management. One Supervisory
Board member was absent during one of the meetings for
personal reasons. On all other occassions the Board was
complete. Most of the meetings were also attended by the
other members of the Executive Committee. Occasionally
a meeting was held in the absence of the Board of
Management. In November a meeting was combined with
16
visits to operating companies in India. Every year
(extensive) company visits take place. The strategy for all
the Company’s activities is reviewed at least once per year.
The major issues discussed during the meetings included
amongst others the fi nancial results and the overall
strategy, as well as the strategies for the various business
lines. Intended acquisitions and disposals were also
discussed as were developments in the various markets.
Items regularly on the agenda were health, safety and
environment (HSE), major investments, the fi lling of
various senior management positions, human resources,
ICT and the risks inherent to the Company’s activities as
well as the Board’s opinion regarding the set-up and
functioning of the risk management and control systems.
The reports of the separate committees were also
discussed. In addition to these scheduled meetings, a few
interim meetings took place via the telephone during
which a number of intended investments and acquisitions
were discussed further. Much attention was paid to the
worldwide fi nancial crisis and as a result thereof the
possible scenarios for the Company.
Mutual consultation between Supervisory Board
members also took place on a fairly regular basis.
The functioning of the Board of Management and
the Supervisory Board as well as the individual Board
members was discussed in the absence of the Board
of Management as was the general business progress.
The fi ndings of the external audit were discussed with
the external auditor. On a number of occasions there was
contact between individual Supervisory Board members
and the Board of Management: in particular there were
regular discussions between the Chairman of the
Supervisory Board and the CEO. There were also bilateral
contacts between other members of the Supervisory
Board and individual members of the Board of
Management and Executive Committee.
Au d i t C o m m i t t e e
In the year under review the members of the Audit
Committee were Messrs. F.J.G.M. Cremers (Chairman),
P.J. Crawford, F.H. Schreve (until July 2008) and
J.A. Colligan (from July 2008). The composition of the
Audit Committee is in accordance with the requirements
of the Code. Collectively the members possess the
required experience and fi nancial expertise to supervise
the Company’s fi nancial activities, annual accounts and
risk profi le. Mr. Cremers was acting as the fi nancial expert
within the meaning of the Code.
In 2008 the Audit Committee met three times.
The external auditor (KPMG) attended all three meetings.
The annual accounts and half-yearly results were
discussed during the relevant meetings. Topics such as
taxation, claims, disputes and the fi nancial crisis were
also discussed in depth. Risk areas, such as hedging,
fl uctuations in currency exchange rates and insurance
were also discussed as was the functioning of the internal
and external control mechanisms and the work-plan of
the internal audit function. The Audit Committee was
informed of important fi ndings from the control visits.
The external auditor was given the opportunity, if desired,
to discuss issues with members of the Audit Committee in
the absence of Fugro’s Board of Management and staff.
R e m u n e r a t i o n a n d N o m i n a t i o n C o m m i t t e e
In the year under review the members of this committee
were Messrs. J.A. Colligan (Chairman until July 2008),
F.H. Schreve (Chairman from July 2008), Th. Smith and
Mr. G-J. Kramer. In 2008 the Committee met formally
three times but also met informally on a number of
occasions.
As far as remuneration is concerned, the topics discussed
included the remuneration of the individual members of
the Board of Management, the remuneration policy for
the members of the Board of Management and the stock
option scheme. The remuneration of the individual
members of the Board of Management, recommended by
the Remuneration and Nomination Committee, was
determined by the Supervisory Board within the
parameters of the remuneration policy.
In the Annual General Meeting of Shareholders on 14 May
2008 a few amendments on both the remuneration policy
for the members of the Board of Management and the
stock option scheme were respectively adopted and
approved. The Remuneration Report for the year 2008,
as prepared by the Remuneration and Nomination
Committee and approved by the Supervisory Board,
contains a report on the way the remuneration policy for
the fi nancial year 2008 has been implemented. Both the
Remuneration Report and the remuneration policy are
posted on Fugro’s website (www.fugro.com).
Remuneration policy
The key elements of Fugro’s remuneration policy for the
members of the Board of Management, as adopted by the
shareholders in May 2008, are as follows:
• fi xed (base) salary is determined at the median level of
a peer group of comparable companies (local and
international);
17Report of the Supervisory Board
• variable income (annual bonus or short-term
incentive) depends on targets determined in advance
with a maximum of twelve months (100%) of annual
fi xed salary. On-target performance will result in a
bonus of eight months of annual fi xed salary. Part of
the bonus is related to quantifi ed fi nancial targets and
accounts for 2/3 of the annual bonus and part of the
bonus is related to non-fi nancial / personal targets and
will account for 1/3 of the annual bonus;
• fi nancial targets and the weighing given to the
individual fi nancial elements are as follows: earnings
per share 60%, net profi t margin 20% and ROCE (return
on capital employed) 20%;
• non-fi nancial targets are determined prior to the start
of the relevant year. These targets are based on Fugro’s
strategic agenda. Fugro does not disclose the actual
targets as this is considered commercially sensitive
information;
• with respect to the long-term incentive, the Board of
Management participates in a broad option scheme
that is applicable to management throughout the
Group (approximately 620 people). Options are granted
on the basis of the contribution to the long term
development of the company, including the
development of the long term strategy, on the basis of
measurable targets such as the (growth) targets in the
strategic plan. Options are granted unconditionally
and in accordance with Best practice provision II.2.2.
of the Code. An overview of the stock option scheme is
included in the Annual Accounts;
• customary pension scheme based upon an available
premium system;
• fringe benefi ts are commensurate with the position
held.
Further details of the remuneration of the members of
the Board of Management during the year under review
can be found on page 134 of the Annual Accounts and in
the Remuneration Report 2008.
As far as nomination is concerned, the topics discussed
included the composition of the Supervisory Board and
of the Executive Committee and also their functioning.
A p p o i n t m e n t s
Supervisory Board
Messrs. F.J.G.M. Cremers and P.J. Crawford are scheduled to
retire by rotation as Supervisory Board members in May
2009. On being asked, Mr. Cremers is willing to take a seat
on the Supervisory Board for a second term of four years.
We will recommend to the next Annual General Meeting
of Shareholders to reappoint Mr. Cremers as member of
the Supervisory Board. If Mr. Cremers is reappointed as a
member of the Supervisory Board he will remain vice-
chairman of the Supervisory Board and chairman of the
Audit Committee.
Mr. Crawford, having reached the maximum period of
three terms of four years, will terminate his Supervisory
Board membership. The period during which
Mr. Crawford has been a member of the Supervisory
Board, the last six as member of the Audit Committee as
well, was characterised by the considerable growth of the
Company and the development of more and more
complex services. Mr. Crawford’s specifi c expertise on ICT
has been of high value for Fugro. The Supervisory Board
and the Board of Management are very grateful to
Mr. Crawford for his intense commitment to the Group
and his expert and valuable interpretation of his
commissionership.
We will recommend to the next Annual General Meeting
of Shareholders the appointment of Mrs. M. Helmes as
a member of the Supervisory Board and successor to
Mr. Crawford. Mrs. Helmes (43) has German nationality
and has a broad international experience. Currently
Mrs. Helmes is a member of the Executive Board and CFO
of ThyssenKrupp Elevator AG.
We consider the appointment of Mrs. Helmes to be in
the interests of Fugro in view of her industry knowledge
and her experience in general and fi nancial management.
The Supervisory Board primarily looks at the expertise,
experience and independence of the candidate for the
appointment of a new supervisory director, but with this
appointment the desire to select a diverse Supervisory
Board in terms of age and gender is fulfi lled.
If Mrs. Helmes is appointed as Supervisory Board member,
she will be a member of the Audit Committee.
Curricula vitae of Mrs. Helmes and Mr. Cremers can be
found in the explanatory notes to the (provisional) agenda
for the Annual General Meeting of Shareholders on 7 May
2009, a copy of which is available on Fugro’s website.
I n c o n c l u s i o n
We thank the Board of Management, the Executive
Committee and the thousands of employees who have
dedicated themselves to Fugro on a daily basis. Thanks to
their efforts, Fugro has achieved the leading worldwide
market position it now occupies. We are aware of the
challenges 2009 will bring us, but we feel confi dent that
Fugro will be able to withstand these challenges from its
strong position.
Leidschendam, 5 March 2009
F.H. Schreve, Chairman
F.J.G.M. Cremers, Vice-chairman
J.A. Colligan
P.J. Crawford
G-J. Kramer
Th. Smith
18
Due to changes in the business lines, the Executive Committee has additional members as per 1 January 2009, being Messrs. H. Meyer – Director Seismic Services and J.H. Sommerville
Director Subsea Services, in order to maintain short reporting lines and suffi cient focus on similar activities within the fast growing company. More information on this change of the
business lines can be found on page 23.
From left to right: S.J. Thomson, A. Steenbakker, O.M. Goodman, J.H. Sommerville, K.S. Wester (President and CEO), A. Jonkman, P. van Riel, H. Meyer, W.S. Rainey and J. Rüegg.
■ E X E C U T I V E C O M M I T T E E
E xe c u t i ve C o m m i t t e e
Fugro N.V. is the holding company for a large number of
operating companies located throughout the world carrying out
a variety of activities. To promote client-orientation and
effi ciency the Group’s organisational structure is highly
decentralised, but cohesive.
The managements of the operating companies report
directly to the Executive Committee.
The members of the Board of Management are part of the
Executive Committee.
B o a r d o f M a n a ge m e n t O t h e r m e m b e r s o f t h e E xe c u t i ve C o m m i t t e e
name K.S. Wester (1946)
function President and Chief Executive Offi cer
nationality Dutch
employed by Fugro since 1981
appointed to statutory Board 1996
(President and Chief Executive Offi cer 2005)
name A. Jonkman (1954)
function Chief Financial Offi cer
nationality Dutch
employed by Fugro since 1988
appointed to statutory Board 2004
(reappointed in 2008)
current term until May 2012
other function Member Supervisory Board Dietsmann N.V.
name P. van Riel (1956)
function Director Development & Production
nationality Dutch
employed by Fugro since 2001
appointed to statutory Board 2006
current term until May 2010
name A. Steenbakker (1957)
function Director Onshore Geotechnical Services
nationality Dutch
employed by Fugro since 2005
appointed to statutory Board 2006
current term until May 2010
name O.M. Goodman (1956)
function Director Geospatial Services
nationality Irish
employed by Fugro since 1993
fi rst appointed to current position 2001
name J. Rüegg (1944)
function Director Offshore Survey
nationality Swiss
employed by Fugro since 1992
fi rst appointed to current position 1999
name W.S. Rainey (1954)
function Director Offshore Geotechnical Services
nationality American
employed by Fugro since 1981
fi rst appointed to current position 2006
name S.J. Thomson (1958)
function Director Airborne Survey
nationality Australian
employed by Fugro since 1999
fi rst appointed to current position 2006
Company Secretary
W.G.M. Mulders (1955)
19Report of the Board of Management
■ R e p o r t o f t h e B o a r d o f M a n a g e m e n t
In fi nancial terms, the year 2008 can be summarised as
follows:
• Fugro’s revenue increased by 19.5% to EUR 2,154.5
million (2007: EUR 1,802.7 million). Revenue increased
by 23.4% of organic growth and by 4.0% as a result of
acquisitions. The foreign currency effect was 7.9%
negative;
• The result from operating activities (EBIT) increased by
18.9% to EUR 386.2 million (2007: EUR 324.8 million);
• Net profi t increased by 31.1% to EUR 283.4 million
(2007: EUR 216.2 million);
• Profi t before income tax has been positively impacted
in 2008 by some EUR 26 million relating to foreign
exchange variances and the profi t and loss account
was negatively impacted by some EUR 25 million
relating to the impact of the anticipated negative
effects of the current worldwide economic crisis on
the valuation of a number of balance sheet items.
In the light of the above results, it is proposed that the
dividend for 2008 be increased to EUR 1.50 per (certifi cate
of an) ordinary share (2007: EUR 1.25).
In May, Fugro was awarded the King Willem I award in the
‘large company’ category. This national business award is
awarded every two years by the King Willem I foundation,
with active support from the Ministry of Economic
Affairs. The foundation was set up in 1958 by a number of
business-related organisations and the Dutch Central
■ G E N E R A L
The fi nancial year 2008 closed with again an increased
revenue and profi t for Fugro. Furthermore, the net profi t
margin increased to over 13%. During this period, market
circumstances were very good, although in the course of
the last quarter, uncertainties increased in the light of the
worldwide recession. Strong organic growth, supported
by investments in the last few years in capacity expansion,
was also realised in 2008. All three company divisions
generated growth in revenue and an increase in profi t.
The company continued to broaden its service package
and strengthen its presence in a number of countries
through acquisitions. These investments brought with
them new technologies, which created new growth
opportunities when combined with Fugro’s expertise and
global presence.
During the year large, complex projects, often involving
several business lines, were successfully completed. This
concerns both onshore and offshore projects. Examples of
such projects are described on pages 32 and 33.
Fugro collects, processes and interprets data relating to
the earth’s surface, the seabed and the (deeper) soils and
rocks beneath. Around 75% of company activities are
related to the oil and gas industry. With its broad range of
services, Fugro is involved in many phases of the life cycle
of oil and gas fi elds. Fugro’s involvement in maintenance
of (complex) facilities made by the oil and gas industry
will have a positive effect on Fugro in future. Through its
balanced portfolio and increased global presence, Fugro
supplies services to a large group of clients in the oil and
gas industry.
Fugro is also active in the infrastructure (approximately
15% of revenue) and mining sectors (approximately 4% of
revenue). The remaining 6% of revenue is coming from
some other market segments.
Working visit of his Royal Highness the Prince of Orange to the Fugro head offi ce in
Leidschendam on 29 January 2009. The visit was related to the King Willem I award.
20
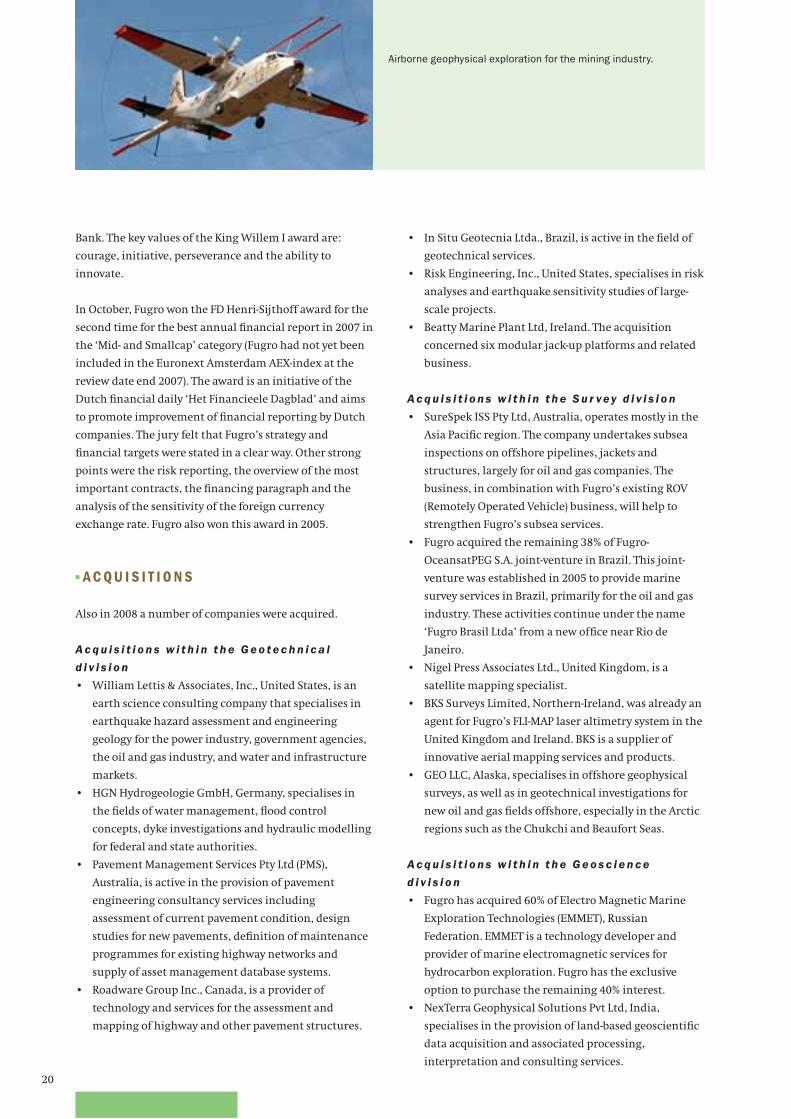
Airborne geophysical exploration for the mining industry.
Bank. The key values of the King Willem I award are:
courage, initiative, perseverance and the ability to
innovate.
In October, Fugro won the FD Henri-Sijthoff award for the
second time for the best annual fi nancial report in 2007 in
the ‘Mid- and Smallcap’ category (Fugro had not yet been
included in the Euronext Amsterdam AEX-index at the
review date end 2007). The award is an initiative of the
Dutch fi nancial daily ‘Het Financieele Dagblad’ and aims
to promote improvement of fi nancial reporting by Dutch
companies. The jury felt that Fugro’s strategy and
fi nancial targets were stated in a clear way. Other strong
points were the risk reporting, the overview of the most
important contracts, the fi nancing paragraph and the
analysis of the sensitivity of the foreign currency
exchange rate. Fugro also won this award in 2005.
■ A C QU I S I T I O N S
Also in 2008 a number of companies were acquired.
A c q u i s i t i o n s w i t h i n t h e G e o t e c h n i c a l
d i v i s i o n
• William Lettis & Associates, Inc., United States, is an
earth science consulting company that specialises in
earthquake hazard assessment and engineering
geology for the power industry, government agencies,
the oil and gas industry, and water and infrastructure
markets.
• HGN Hydrogeologie GmbH, Germany, specialises in
the fi elds of water management, fl ood control
concepts, dyke investigations and hydraulic modelling
for federal and state authorities.
• Pavement Management Services Pty Ltd (PMS),
Australia, is active in the provision of pavement
engineering consultancy services including
assessment of current pavement condition, design
studies for new pavements, defi nition of maintenance
programmes for existing highway networks and
supply of asset management database systems.
• Roadware Group Inc., Canada, is a provider of
technology and services for the assessment and
mapping of highway and other pavement structures.
• In Situ Geotecnia Ltda., Brazil, is active in the fi eld of
geotechnical services.
• Risk Engineering, Inc., United States, specialises in risk
analyses and earthquake sensitivity studies of large-
scale projects.
• Beatty Marine Plant Ltd, Ireland. The acquisition
concerned six modular jack-up platforms and related
business.
A c q u i s i t i o n s w i t h i n t h e S u r vey d i v i s i o n
• SureSpek ISS Pty Ltd, Australia, operates mostly in the
Asia Pacifi c region. The company undertakes subsea
inspections on offshore pipelines, jackets and
structures, largely for oil and gas companies. The
business, in combination with Fugro’s existing ROV
(Remotely Operated Vehicle) business, will help to
strengthen Fugro’s subsea services.
• Fugro acquired the remaining 38% of Fugro-
OceansatPEG S.A. joint-venture in Brazil. This joint-
venture was established in 2005 to provide marine
survey services in Brazil, primarily for the oil and gas
industry. These activities continue under the name
‘Fugro Brasil Ltda’ from a new offi ce near Rio de
Janeiro.
• Nigel Press Associates Ltd., United Kingdom, is a
satellite mapping specialist.
• BKS Surveys Limited, Northern-Ireland, was already an
agent for Fugro’s FLI-MAP laser altimetry system in the
United Kingdom and Ireland. BKS is a supplier of
innovative aerial mapping services and products.
• GEO LLC, Alaska, specialises in offshore geophysical
surveys, as well as in geotechnical investigations for
new oil and gas fi elds offshore, especially in the Arctic
regions such as the Chukchi and Beaufort Seas.
A c q u i s i t i o n s w i t h i n t h e G e o s c i e n c e
d i v i s i o n
• Fugro has acquired 60% of Electro Magnetic Marine
Exploration Technologies (EMMET), Russian
Federation. EMMET is a technology developer and
provider of marine electromagnetic services for
hydrocarbon exploration. Fugro has the exclusive
option to purchase the remaining 40% interest.
• NexTerra Geophysical Solutions Pvt Ltd, India,
specialises in the provision of land-based geoscientifi c
data acquisition and associated processing,
interpretation and consulting services.
21Report of the Board of Management
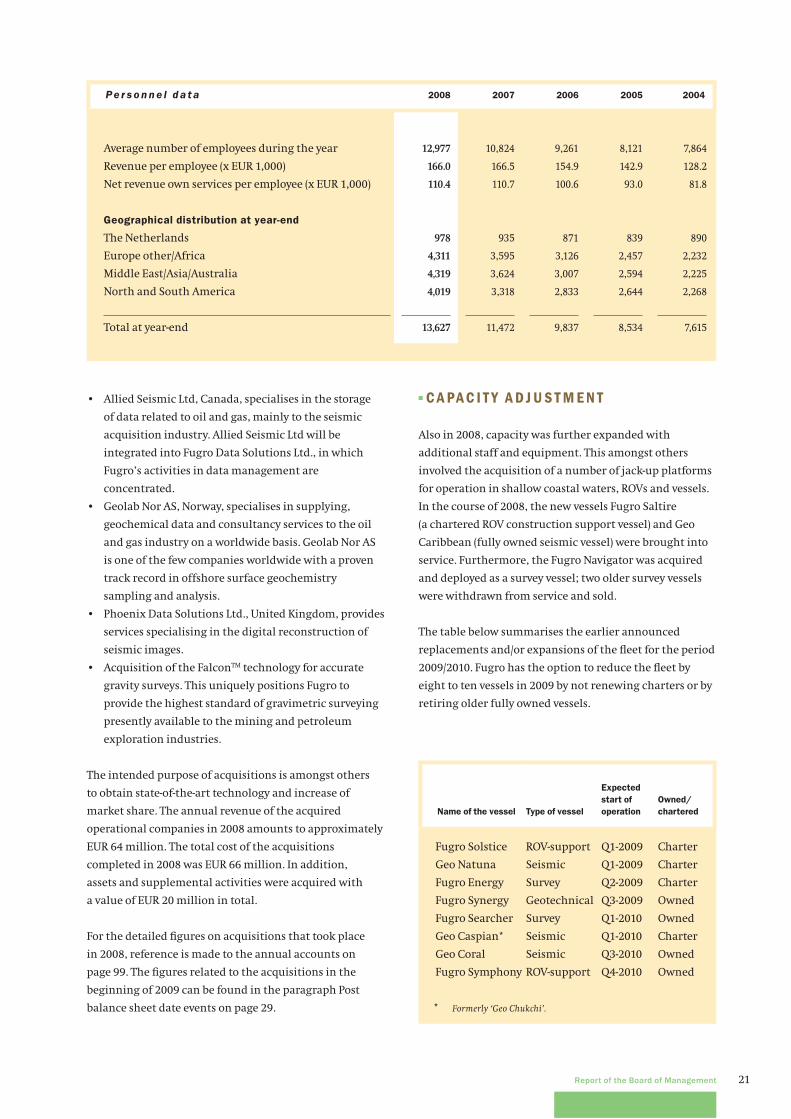
Pe r s o n n e l d a t a 2008 2007 2006 2005 2004
Average number of employees during the year 12,977 10,824 9,261 8,121 7,864
Revenue per employee (x EUR 1,000) 166.0 166.5 154.9 142.9 128.2
Net revenue own services per employee (x EUR 1,000) 110.4 110.7 100.6 93.0 81.8
Geographical distribution at year-end
The Netherlands 978 935 871 839 890
Europe other/Africa 4,311 3,595 3,126 2,457 2,232
Middle East/Asia/Australia 4,319 3,624 3,007 2,594 2,225
North and South America 4,019 3,318 2,833 2,644 2,268
Total at year-end 13,627 11,472 9,837 8,534 7,615
• Allied Seismic Ltd, Canada, specialises in the storage
of data related to oil and gas, mainly to the seismic
acquisition industry. Allied Seismic Ltd will be
integrated into Fugro Data Solutions Ltd., in which
Fugro’s activities in data management are
concentrated.
• Geolab Nor AS, Norway, specialises in supplying,
geochemical data and consultancy services to the oil
and gas industry on a worldwide basis. Geolab Nor AS
is one of the few companies worldwide with a proven
track record in offshore surface geochemistry
sampling and analysis.
• Phoenix Data Solutions Ltd., United Kingdom, provides
services specialising in the digital reconstruction of
seismic images.
• Acquisition of the FalconTM technology for accurate
gravity surveys. This uniquely positions Fugro to
provide the highest standard of gravimetric surveying
presently available to the mining and petroleum
exploration industries.
The intended purpose of acquisitions is amongst others
to obtain state-of-the-art technology and increase of
market share. The annual revenue of the acquired
operational companies in 2008 amounts to approximately
EUR 64 million. The total cost of the acquisitions
completed in 2008 was EUR 66 million. In addition,
assets and supplemental activities were acquired with
a value of EUR 20 million in total.
For the detailed fi gures on acquisitions that took place
in 2008, reference is made to the annual accounts on
page 99. The fi gures related to the acquisitions in the
beginning of 2009 can be found in the paragraph Post
balance sheet date events on page 29.
■ C A PA C I T Y A D J U S T M E N T
Also in 2008, capacity was further expanded with
additional staff and equipment. This amongst others
involved the acquisition of a number of jack-up platforms
for operation in shallow coastal waters, ROVs and vessels.
In the course of 2008, the new vessels Fugro Saltire
(a chartered ROV construction support vessel) and Geo
Caribbean (fully owned seismic vessel) were brought into
service. Furthermore, the Fugro Navigator was acquired
and deployed as a survey vessel; two older survey vessels
were withdrawn from service and sold.
The table below summarises the earlier announced
replacements and/or expansions of the fl eet for the period
2009/2010. Fugro has the option to reduce the fl eet by
eight to ten vessels in 2009 by not renewing charters or by
retiring older fully owned vessels.
Name of the vessel Type of vessel
Expected
start of
operation
Owned/
chartered
Fugro Solstice ROV-support Q1-2009 Charter
Geo Natuna Seismic Q1-2009 Charter
Fugro Energy Survey Q2-2009 Charter
Fugro Synergy Geotechnical Q3-2009 Owned
Fugro Searcher Survey Q1-2010 Owned
Geo Caspian* Seismic Q1-2010 Charter
Geo Coral Seismic Q3-2010 Owned
Fugro Symphony ROV-support Q4-2010 Owned
* Formerly ‘Geo Chukchi’.
22
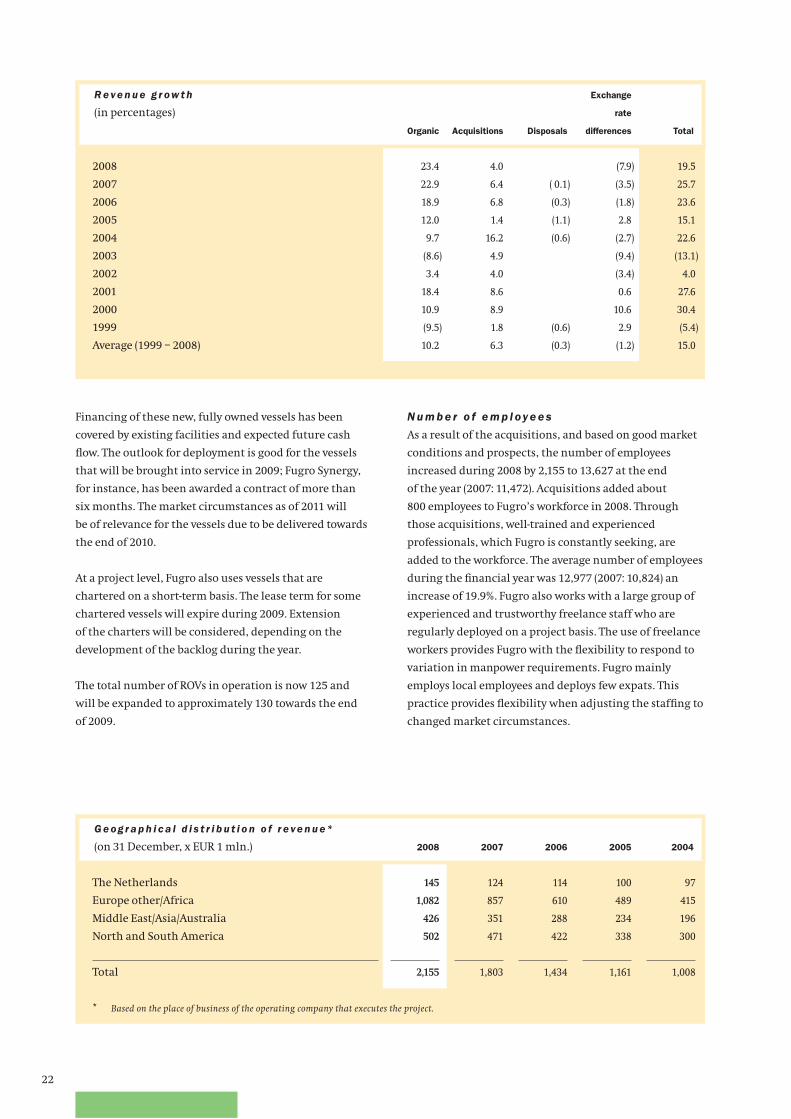
G e og r a p h i c a l d i s t r i b u t i o n o f r e ve n u e *
(on 31 December, x EUR 1 mln.) 2008 2007 2006 2005 2004
The Netherlands 145 124 114 100 97
Europe other/Africa 1,082 857 610 489 415
Middle East/Asia/Australia 426 351 288 234 196
North and South America 502 471 422 338 300
Total 2,155 1,803 1,434 1,161 1,008
* Based on the place of business of the operating company that executes the project.
Financing of these new, fully owned vessels has been
covered by existing facilities and expected future cash
fl ow. The outlook for deployment is good for the vessels
that will be brought into service in 2009; Fugro Synergy,
for instance, has been awarded a contract of more than
six months. The market circumstances as of 2011 will
be of relevance for the vessels due to be delivered towards
the end of 2010.
At a project level, Fugro also uses vessels that are
chartered on a short-term basis. The lease term for some
chartered vessels will expire during 2009. Extension
of the charters will be considered, depending on the
development of the backlog during the year.
The total number of ROVs in operation is now 125 and
will be expanded to approximately 130 towards the end
of 2009.
N u m b e r o f e m p l oy e e s
As a result of the acquisitions, and based on good market
conditions and prospects, the number of employees
increased during 2008 by 2,155 to 13,627 at the end
of the year (2007: 11,472). Acquisitions added about
800 employees to Fugro’s workforce in 2008. Through
those acquisitions, well-trained and experienced
professionals, which Fugro is constantly seeking, are
added to the workforce. The average number of employees
during the fi nancial year was 12,977 (2007: 10,824) an
increase of 19.9%. Fugro also works with a large group of
experienced and trustworthy freelance staff who are
regularly deployed on a project basis. The use of freelance
workers provides Fugro with the fl exibility to respond to
variation in manpower requirements. Fugro mainly
employs local employees and deploys few expats. This
practice provides fl exibility when adjusting the staffi ng to
changed market circumstances.
R e ve n u e g r ow t h
(in percentages)
Organic Acquisitions Disposals
Exchange
rate
differences Total
2008 23.4 4.0 (7.9) 19.5
2007 22.9 6.4 ( 0.1) (3.5) 25.7
2006 18.9 6.8 (0.3) (1.8) 23.6
2005 12.0 1.4 (1.1) 2.8 15.1
2004 9.7 16.2 (0.6) (2.7) 22.6
2003 (8.6) 4.9 (9.4) (13.1)
2002 3.4 4.0 (3.4) 4.0
2001 18.4 8.6 0.6 27.6
2000 10.9 8.9 10.6 30.4
1999 (9.5) 1.8 (0.6) 2.9 (5.4)
Average (1999 – 2008) 10.2 6.3 (0.3) (1.2) 15.0
23Report of the Board of Management
Despite the global shortage of specialists, Fugro has been
successful when it comes to recruiting experienced and
professional employees. Increasingly this is coordinated
on a global basis with best practices being implemented at
a local level. Fugro’s recruitment success is largely based
on the global spread of its activities and the employment
possibilities that Fugro has to offer innovative and
entrepreneurial staff.
■ B U S I N E S S L I N E C H A N G E S
The strong growth and expansion of the activities in the
past few years makes it desirable to adapt our
organisation, without however endangering Fugro’s key
values, such as maintaining strong decentralised local
operating companies close to clients, with a focus on
specialist services. Furthermore, short and clear
communication lines need to be maintained. The most
important changes which took effect from 1 January 2009
within the existing three division structure are:
S u r vey d i v i s i o n
• The ROV activities (with now around 125 ROVs) were
split from Offshore Survey to form a new business line:
Subsea Services.
• The satellite positioning activities, which were partly
in Offshore Survey and partly in Geospatial Services,
have been combined as Positioning group in Offshore
Survey.
G e o s c i e n c e d i v i s i o n
The business line Development and Production (D&P) has
been split into two parts:
• The seismic activities (data acquisition, processing and
multi client) became a separate business line: Seismic
Services.
• The other activities of D&P, including data
management, reservoir modelling and geological
consultancy, continued as a business line under the
name Information Services.
The services portfolio of Airborne survey was extended
with, amongst others, marine gravity and electro-
magnetic surveying. This business line continued as
General Geophysical Services, with services focused on
exploration, both for mining and the oil and gas industry.
In view of the above, Mr. H. Meyer and Mr. J.H. Sommer-
ville joined the Executive Committee as Chief Operating
Offi cer (COO) for Seismic Services and Subsea Services
respectively as of 1 January 2009. The members of the
Executive Committee report to the President and Chief
Executive Offi cer.
■ F I N A N C I A L
R e ve n u e a n d c o s t s d e ve l o p m e n t
In 2008, revenue increased by 19.5% to EUR 2,154.5
million, compared with EUR 1,802.7 million in 2007.
Unrealised revenue, as a result of the delay in delivery
of vessels in 2008, was more than compensated by the
higher revenue generated elsewhere in the Group.
A breakdown of the increase in revenue is shown in the
table on page 22. This shows that most of the revenue
increase was achieved through organic growth of 23.4%.
Third party costs amounted to EUR 722.3 million (2007:
EUR 604.9 million). This is an increase of 19.4%. The third
party costs as a percentage of revenue were 33.5%, which
is similar to 2007 (33.6%).
Personnel expenses increased by 19.4% to EUR 618.6
million (2007: 518.1 million). This is 28.7% of the revenue,
equal to 2007. One of the reasons that the personnel
expenses remain stable as a percentage of revenue
compared to 2007, is the fact that Fugro works with local
employees worldwide and often young employees are
recruited who are partly trained on the job. These young
employees join experienced teams. The average cost per
employee was EUR 47,671, a decrease of 0.4% with respect
to 2007.
Depreciation of tangible fi xed assets increased
signifi cantly from EUR 107.7 million in 2007 to EUR 140.4
million in 2008. This represents an increase of 30.4%.
The increase is a result of the capacity expansion, which
took place in 2007 and 2008, in mainly the vessel fl eet
including related equipment and ROVs. Depreciation as
a percentage of revenue increased slightly to 6.5% (2007:
6.0%).
Other expenses amounted to EUR 295.7 million in 2008
(2007: EUR 254.6 million), an increase of 16.1%.
As a percentage of revenue, these costs decreased to 13.7%
(2007: 14.1%). Other expenses included a variety of
different costs, which cannot be allocated directly to
projects like repair and maintenance, occupancy cost, etc.
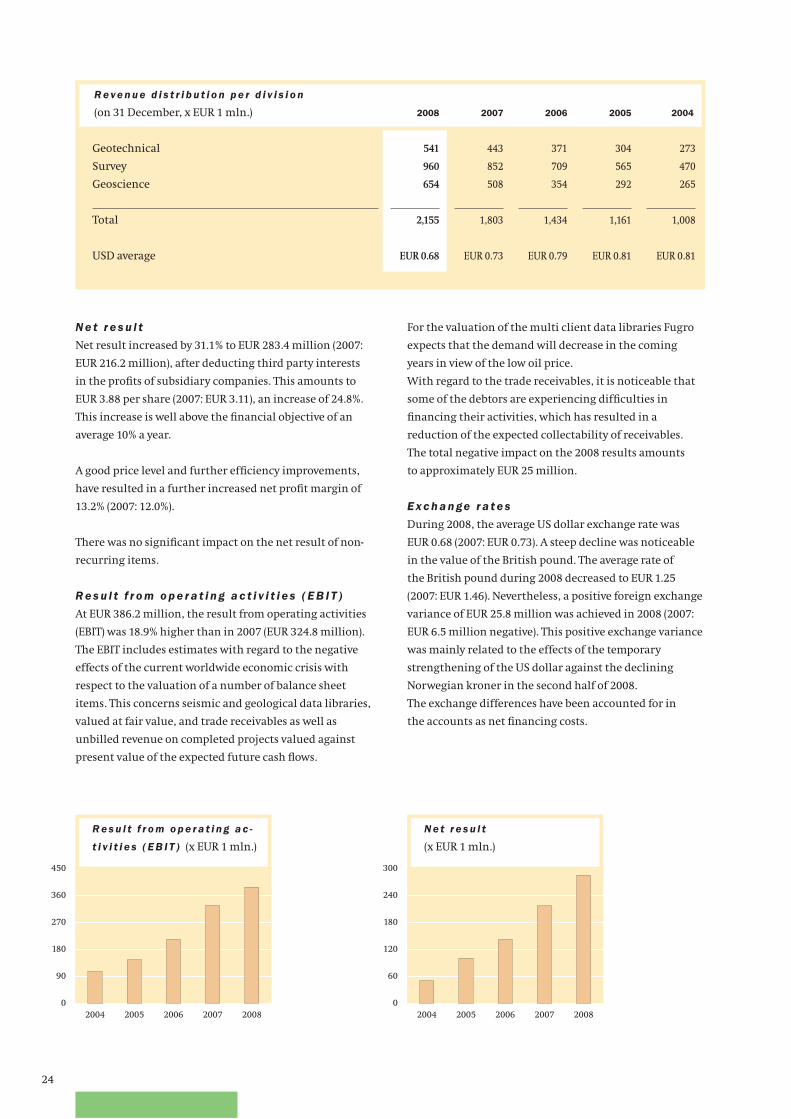
24
N e t r e s u l t
Net result increased by 31.1% to EUR 283.4 million (2007:
EUR 216.2 million), after deducting third party interests
in the profi ts of subsidiary companies. This amounts to
EUR 3.88 per share (2007: EUR 3.11), an increase of 24.8%.
This increase is well above the fi nancial objective of an
average 10% a year.
A good price level and further effi ciency improvements,
have resulted in a further increased net profi t margin of
13.2% (2007: 12.0%).
There was no signifi cant impact on the net result of non-
recurring items.
R e s u l t f r o m o p e r a t i n g a c t i v i t i e s ( E B I T )
At EUR 386.2 million, the result from operating activities
(EBIT) was 18.9% higher than in 2007 (EUR 324.8 million).
The EBIT includes estimates with regard to the negative
effects of the current worldwide economic crisis with
respect to the valuation of a number of balance sheet
items. This concerns seismic and geological data libraries,
valued at fair value, and trade receivables as well as
unbilled revenue on completed projects valued against
present value of the expected future cash fl ows.
For the valuation of the multi client data libraries Fugro
expects that the demand will decrease in the coming
years in view of the low oil price.
With regard to the trade receivables, it is noticeable that
some of the debtors are experiencing diffi culties in
fi nancing their activities, which has resulted in a
reduction of the expected collectability of receivables.
The total negative impact on the 2008 results amounts
to approximately EUR 25 million.
E x c h a n ge r a t e s
During 2008, the average US dollar exchange rate was
EUR 0.68 (2007: EUR 0.73). A steep decline was noticeable
in the value of the British pound. The average rate of
the British pound during 2008 decreased to EUR 1.25
(2007: EUR 1.46). Nevertheless, a positive foreign exchange
variance of EUR 25.8 million was achieved in 2008 (2007:
EUR 6.5 million negative). This positive exchange variance
was mainly related to the effects of the temporary
strengthening of the US dollar against the declining
Norwegian kroner in the second half of 2008.
The exchange differences have been accounted for in
the accounts as net fi nancing costs.
0
90
180
270
360
450
20082007200620052004
R e s u l t f r o m o p e r a t i n g a c -
t i v i t i e s ( E B I T ) (x EUR 1 mln.)
0
60
120
180
240
300
20082007200620052004
N e t r e s u l t
(x EUR 1 mln.)
R e ve n u e d i s t r i b u t i o n p e r d i v i s i o n
(on 31 December, x EUR 1 mln.) 2008 2007 2006 2005 2004
Geotechnical 541 443 371 304 273
Survey 960 852 709 565 470
Geoscience 654 508 354 292 265
Total 2,155 1,803 1,434 1,161 1,008
USD average EUR 0.68 EUR 0.73 EUR 0.79 EUR 0.81 EUR 0.81
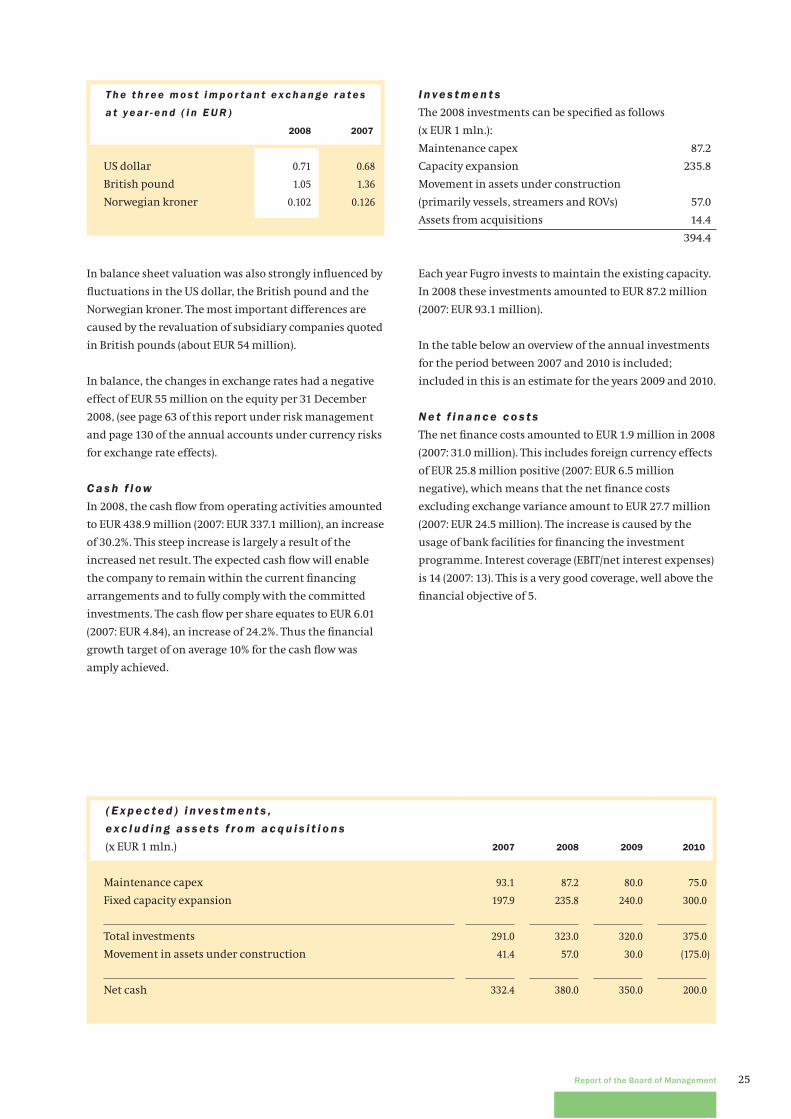
25Report of the Board of Management
In balance sheet valuation was also strongly infl uenced by
fl uctuations in the US dollar, the British pound and the
Norwegian kroner. The most important differences are
caused by the revaluation of subsidiary companies quoted
in British pounds (about EUR 54 million).
In balance, the changes in exchange rates had a negative
effect of EUR 55 million on the equity per 31 December
2008, (see page 63 of this report under risk management
and page 130 of the annual accounts under currency risks
for exchange rate effects).
C a s h f l ow
In 2008, the cash fl ow from operating activities amounted
to EUR 438.9 million (2007: EUR 337.1 million), an increase
of 30.2%. This steep increase is largely a result of the
increased net result. The expected cash fl ow will enable
the company to remain within the current fi nancing
arrangements and to fully comply with the committed
investments. The cash fl ow per share equates to EUR 6.01
(2007: EUR 4.84), an increase of 24.2%. Thus the fi nancial
growth target of on average 10% for the cash fl ow was
amply achieved.
I n ve s t m e n t s
The 2008 investments can be specifi ed as follows
(x EUR 1 mln.):
Maintenance capex 87.2
Capacity expansion 235.8
Movement in assets under construction
(primarily vessels, streamers and ROVs) 57.0
Assets from acquisitions 14.4
394.4
Each year Fugro invests to maintain the existing capacity.
In 2008 these investments amounted to EUR 87.2 million
(2007: EUR 93.1 million).
In the table below an overview of the annual investments
for the period between 2007 and 2010 is included;
included in this is an estimate for the years 2009 and 2010.
N e t f i n a n c e c o s t s
The net fi nance costs amounted to EUR 1.9 million in 2008
(2007: 31.0 million). This includes foreign currency effects
of EUR 25.8 million positive (2007: EUR 6.5 million
negative), which means that the net fi nance costs
excluding exchange variance amount to EUR 27.7 million
(2007: EUR 24.5 million). The increase is caused by the
usage of bank facilities for fi nancing the investment
programme. Interest coverage (EBIT/net interest expenses)
is 14 (2007: 13). This is a very good coverage, well above the
fi nancial objective of 5.
( E x p e c t e d ) i n ve s t m e n t s ,
e x c l u d i n g a s s e t s f r o m a c q u i s i t i o n s
(x EUR 1 mln.) 2007 2008 2009 2010
Maintenance capex 93.1 87.2 80.0 75.0
Fixed capacity expansion 197.9 235.8 240.0 300.0
Total investments 291.0 323.0 320.0 375.0
Movement in assets under construction 41.4 57.0 30.0 (175.0)
Net cash 332.4 380.0 350.0 200.0
T h e t h r e e m o s t i m p o r t a n t e x c h a n ge r a t e s
a t y e a r - e n d ( i n E U R )
2008 2007
US dollar 0.71 0.68
British pound 1.05 1.36
Norwegian kroner 0.102 0.126
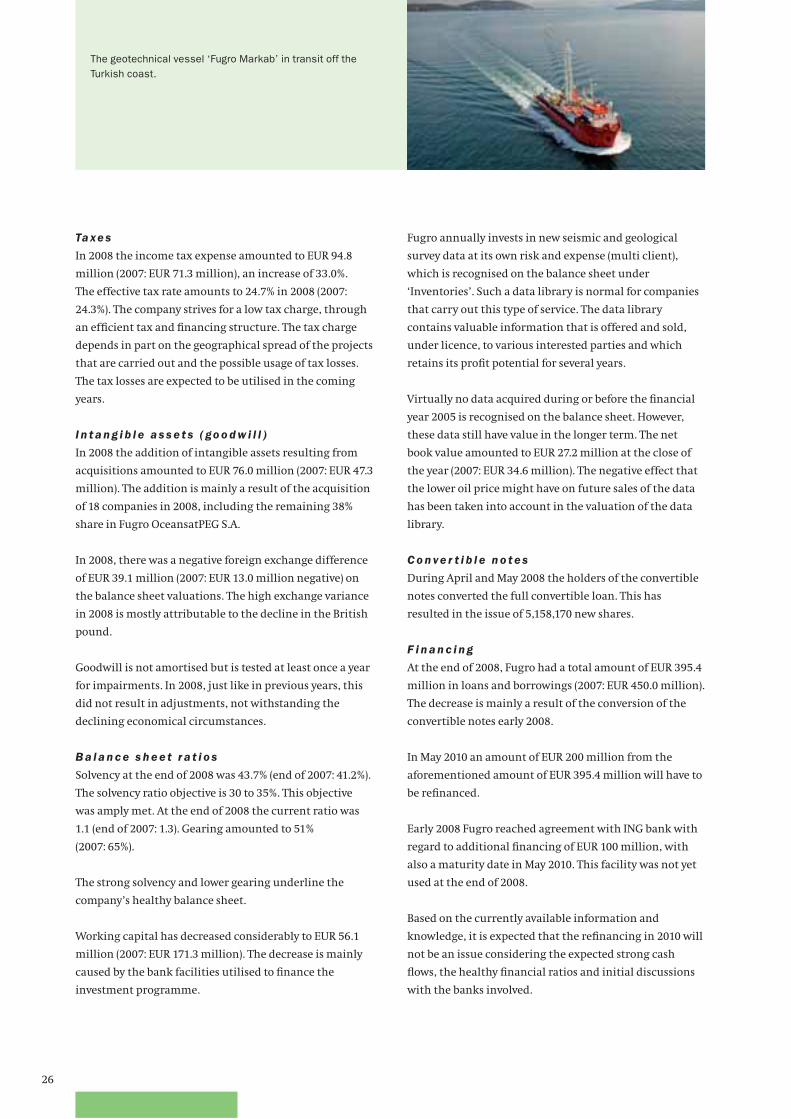
26
The geotechnical vessel ‘Fugro Markab’ in transit off the
Turkish coast.
Ta xe s
In 2008 the income tax expense amounted to EUR 94.8
million (2007: EUR 71.3 million), an increase of 33.0%.
The effective tax rate amounts to 24.7% in 2008 (2007:
24.3%). The company strives for a low tax charge, through
an effi cient tax and fi nancing structure. The tax charge
depends in part on the geographical spread of the projects
that are carried out and the possible usage of tax losses.
The tax losses are expected to be utilised in the coming
years.
I n t a n g i b l e a s s e t s ( go o d w i l l )
In 2008 the addition of intangible assets resulting from
acquisitions amounted to EUR 76.0 million (2007: EUR 47.3
million). The addition is mainly a result of the acquisition
of 18 companies in 2008, including the remaining 38%
share in Fugro OceansatPEG S.A.
In 2008, there was a negative foreign exchange difference
of EUR 39.1 million (2007: EUR 13.0 million negative) on
the balance sheet valuations. The high exchange variance
in 2008 is mostly attributable to the decline in the British
pound.
Goodwill is not amortised but is tested at least once a year
for impairments. In 2008, just like in previous years, this
did not result in adjustments, not withstanding the
declining economical circumstances.
B a l a n c e s h e e t r a t i o s
Solvency at the end of 2008 was 43.7% (end of 2007: 41.2%).
The solvency ratio objective is 30 to 35%. This objective
was amply met. At the end of 2008 the current ratio was
1.1 (end of 2007: 1.3). Gearing amounted to 51%
(2007: 65%).
The strong solvency and lower gearing underline the
company’s healthy balance sheet.
Working capital has decreased considerably to EUR 56.1
million (2007: EUR 171.3 million). The decrease is mainly
caused by the bank facilities utilised to fi nance the
investment programme.
Fugro annually invests in new seismic and geological
survey data at its own risk and expense (multi client),
which is recognised on the balance sheet under
‘Inventories’. Such a data library is normal for companies
that carry out this type of service. The data library
contains valuable information that is offered and sold,
under licence, to various interested parties and which
retains its profi t potential for several years.
Virtually no data acquired during or before the fi nancial
year 2005 is recognised on the balance sheet. However,
these data still have value in the longer term. The net
book value amounted to EUR 27.2 million at the close of
the year (2007: EUR 34.6 million). The negative effect that
the lower oil price might have on future sales of the data
has been taken into account in the valuation of the data
library.
C o n ve r t i b l e n o t e s
During April and May 2008 the holders of the convertible
notes converted the full convertible loan. This has
resulted in the issue of 5,158,170 new shares.
F i n a n c i n g
At the end of 2008, Fugro had a total amount of EUR 395.4
million in loans and borrowings (2007: EUR 450.0 million).
The decrease is mainly a result of the conversion of the
convertible notes early 2008.
In May 2010 an amount of EUR 200 million from the
aforementioned amount of EUR 395.4 million will have to
be refi nanced.
Early 2008 Fugro reached agreement with ING bank with
regard to additional fi nancing of EUR 100 million, with
also a maturity date in May 2010. This facility was not yet
used at the end of 2008.
Based on the currently available information and
knowledge, it is expected that the refi nancing in 2010 will
not be an issue considering the expected strong cash
fl ows, the healthy fi nancial ratios and initial discussions
with the banks involved.
27Report of the Board of Management
The Private Placement loans have been concluded in euros
(20 million) and US dollars (120 million). The US dollar
loans are held in the original currency to fi nance the
assets on the balance sheet denominated in US dollars.
Interest on the Private Placement loans varies between
6.45% and 7.10%. The Private Placement loans will be
repaid in stages in 2012, 2014 and 2017.
■ D I V I D E N D P RO P O S A L
It is proposed that the dividend for 2008 be increased to
EUR 1.50 per ordinary share (2007: EUR 1.25), paid
according to the preference of the shareholder:
• in cash, or
• in (certifi cates of) ordinary shares.
The proposed dividend equates to a pay-out percentage
of 39.8% of the net result.
■ M A R K E T D E V E L O P M E N T S A N D T R E N D S
Tr e n d s
The year 2008 confronted the world with a fi nancial crisis
that draws heavily on the world economy. The crisis has
snowballed since August 2008 and banking corporations
and other companies have been given government
support to guarantee their existence. The world economy
has reacted very strongly to the fi nancial crisis. These
negative sentiments are well noticeable and they have
spread over many sectors worldwide.
Fugro is reasonably protected against negative effects,
through its position, the international markets in which
Fugro operates and the mix of its clients, but Fugro will
not be immune to the consequences of a continuing
worldwide crisis.
T h e o i l a n d ga s m a r ke t
The oil price per barrel has fallen sharply in the last
months of 2008. The current price is around USD 40.
Experts indicate an expected oil price of USD 75 or higher
in the long term. Smaller oil companies that are
dependent on external fi nancing for the development of
their more marginal fi elds, foresee problems with regard
to their business processes, and projects for these clients
may be delayed. The share of Fugro’s revenue for this
category is relatively small. A number of national oil
companies and large international players have
announced their intentions to continue investing, also at
an oil price of about USD 40, in order to be able to mitigate
future production decline. These intentions might
however be adjusted, should the oil price drop below that
level for a longer period of time.
During 2008 investments by the oil and gas industry have
increased further by a substantial 22% to around USD 450
billion. The entire market sector, including Fugro,
benefi ted from this increase. About 75% of Fugro’s
revenue is related to oil and gas.
According to recent external market research,
investments by oil and gas companies will drop by about
12% to USD 400 billion worldwide in 2009. For the
so-called international market, which is an important
segment to Fugro, a drop of about 6% to USD 300 billion,
is expected. A number of key players have already
announced that the budgets will remain at the same
level or be increased.
Increasingly, as a consequence of its broad package of
solution-oriented services, Fugro is involved throughout
almost the entire life cycle of oil and gas fi elds. This cycle
can last for several decades. It starts with the search for
fi elds and continues from investigations and surveys
related to the design and construction of the structures
required to bring new fi elds into production, to improving
production from existing fi elds and fi nally
decommissioning. Fugro will, therefore, be able to
continue to benefi t from the further increase in the
investments (already substantial in recent years) now
being made by the oil and gas companies. In the years to
come, investments will still be undertaken to achieve
production in the longer term.
Many of the exploration and development activities,
especially those related to deepwater projects, take place
in the Gulf of Mexico, West Africa and Brazil. Other
regions that continue to be very active are the Middle
East, the Caspian Sea, the North Sea and parts of Asia,
India and Australia. There is also increasing interest in
detailed reservoir information from existing fi elds to
enable production levels to be maintained for as long as
possible, and to extract the maximum volume of available
oil and gas.
Demand for gas is creating a strong global growth market.
Some of the demand is met by production of liquefi ed
natural gas (LNG), which can be transported over the sea.
Fugro is carrying out surveys for a number of LNG
terminals now under development in various parts of the
world. High energy prices are making the development of
gas fi elds located at considerable distance from the user
markets more attractive. This is especially applicable in
the Middle East where there are considerable gas reserves
within transportation distance of India, China and Japan.
Large-scale developments are also taking place in
countries that have been exporting gas for some time,
such as Australia, Nigeria and Indonesia. This will
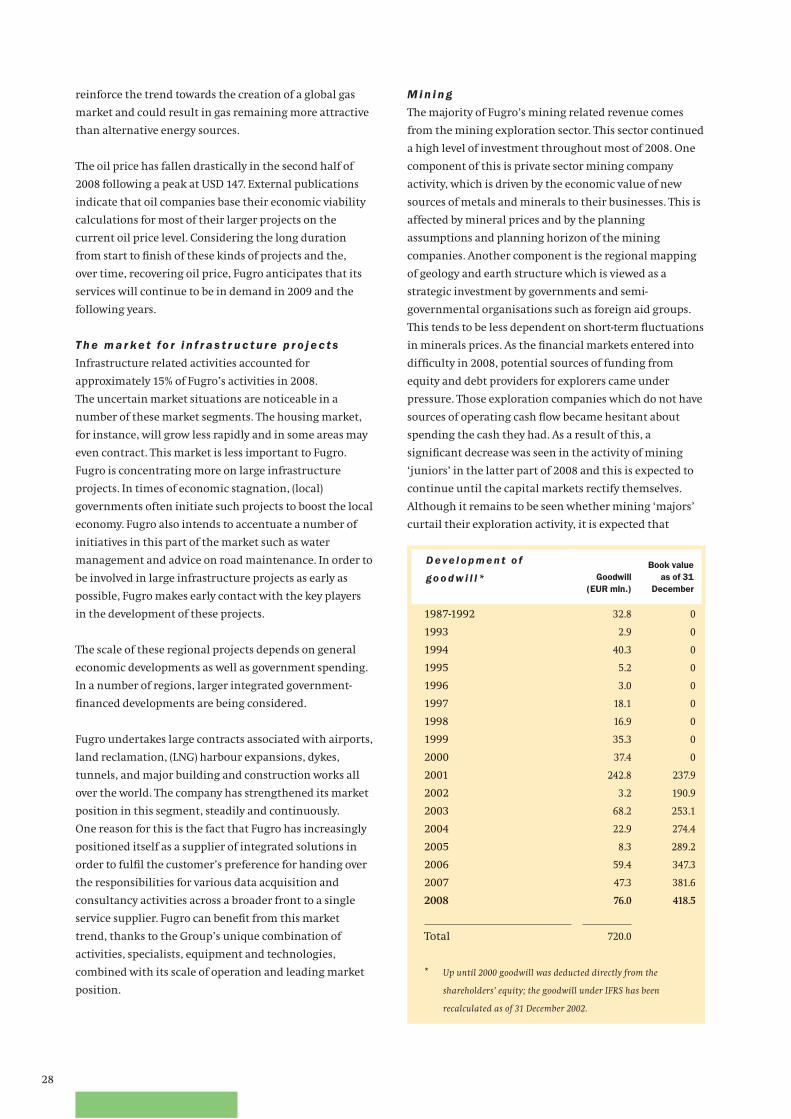
28
M i n i n g
The majority of Fugro’s mining related revenue comes
from the mining exploration sector. This sector continued
a high level of investment throughout most of 2008. One
component of this is private sector mining company
activity, which is driven by the economic value of new
sources of metals and minerals to their businesses. This is
affected by mineral prices and by the planning
assumptions and planning horizon of the mining
companies. Another component is the regional mapping
of geology and earth structure which is viewed as a
strategic investment by governments and semi-
governmental organisations such as foreign aid groups.
This tends to be less dependent on short-term fl uctuations
in minerals prices. As the fi nancial markets entered into
diffi culty in 2008, potential sources of funding from
equity and debt providers for explorers came under
pressure. Those exploration companies which do not have
sources of operating cash fl ow became hesitant about
spending the cash they had. As a result of this, a
signifi cant decrease was seen in the activity of mining
‘juniors’ in the latter part of 2008 and this is expected to
continue until the capital markets rectify themselves.
Although it remains to be seen whether mining ‘majors’
curtail their exploration activity, it is expected that
reinforce the trend towards the creation of a global gas
market and could result in gas remaining more attractive
than alternative energy sources.
The oil price has fallen drastically in the second half of
2008 following a peak at USD 147. External publications
indicate that oil companies base their economic viability
calculations for most of their larger projects on the
current oil price level. Considering the long duration
from start to fi nish of these kinds of projects and the,
over time, recovering oil price, Fugro anticipates that its
services will continue to be in demand in 2009 and the
following years.
T h e m a r ke t fo r i n f r a s t r u c t u r e p r o j e c t s
Infrastructure related activities accounted for
approximately 15% of Fugro’s activities in 2008.
The uncertain market situations are noticeable in a
number of these market segments. The housing market,
for instance, will grow less rapidly and in some areas may
even contract. This market is less important to Fugro.
Fugro is concentrating more on large infrastructure
projects. In times of economic stagnation, (local)
governments often initiate such projects to boost the local
economy. Fugro also intends to accentuate a number of
initiatives in this part of the market such as water
management and advice on road maintenance. In order to
be involved in large infrastructure projects as early as
possible, Fugro makes early contact with the key players
in the development of these projects.
The scale of these regional projects depends on general
economic developments as well as government spending.
In a number of regions, larger integrated government-
fi nanced developments are being considered.
Fugro undertakes large contracts associated with airports,
land reclamation, (LNG) harbour expansions, dykes,
tunnels, and major building and construction works all
over the world. The company has strengthened its market
position in this segment, steadily and continuously.
One reason for this is the fact that Fugro has increasingly
positioned itself as a supplier of integrated solutions in
order to fulfi l the customer’s preference for handing over
the responsibilities for various data acquisition and
consultancy activities across a broader front to a single
service supplier. Fugro can benefi t from this market
trend, thanks to the Group’s unique combination of
activities, specialists, equipment and technologies,
combined with its scale of operation and leading market
position.
D e ve l o p m e n t o f
go o d w i l l * Goodwill
(EUR mln.)
Book value
as of 31
December
1987-1992 32.8 0
1993 2.9 0
1994 40.3 0
1995 5.2 0
1996 3.0 0
1997 18.1 0
1998 16.9 0
1999 35.3 0
2000 37.4 0
2001 242.8 237.9
2002 3.2 190.9
2003 68.2 253.1
2004 22.9 274.4
2005 8.3 289.2
2006 59.4 347.3
2007 47.3 381.6
2008 76.0 418.5
Total 720.0
* Up until 2000 goodwill was deducted directly from the
shareholders’ equity; the goodwill under IFRS has been
recalculated as of 31 December 2002.
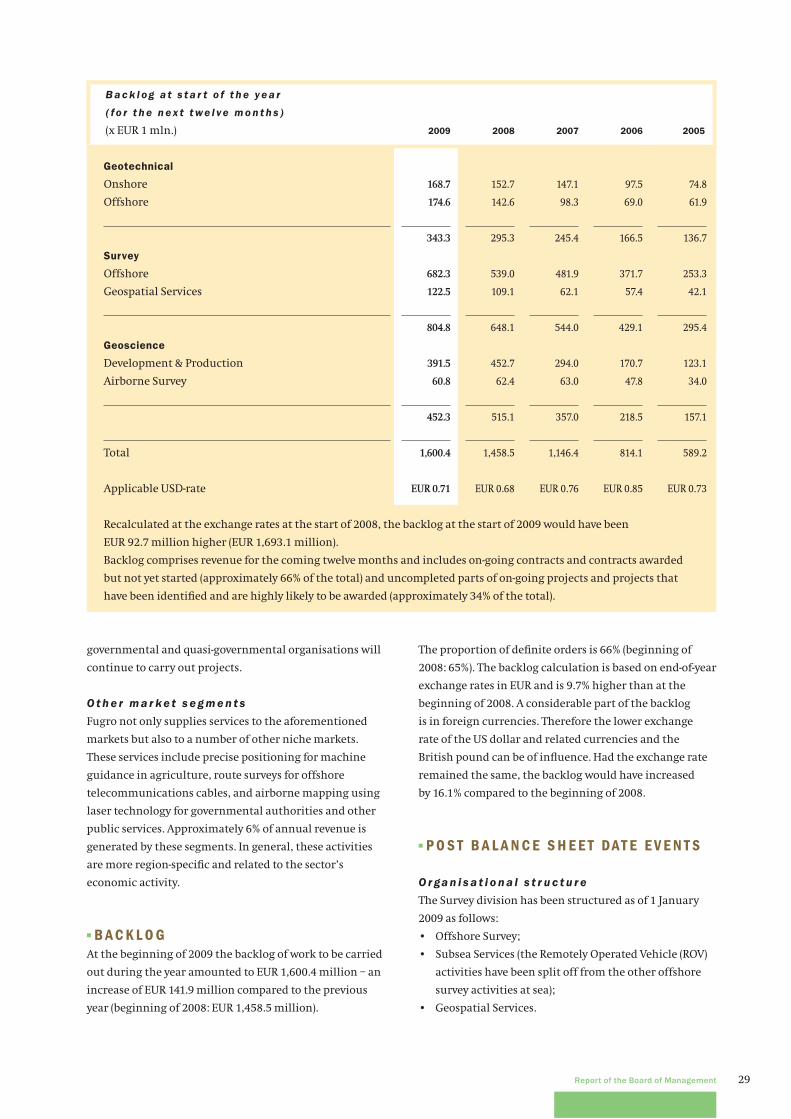
29Report of the Board of Management
The proportion of defi nite orders is 66% (beginning of
2008: 65%). The backlog calculation is based on end-of-year
exchange rates in EUR and is 9.7% higher than at the
beginning of 2008. A considerable part of the backlog
is in foreign currencies. Therefore the lower exchange
rate of the US dollar and related currencies and the
British pound can be of infl uence. Had the exchange rate
remained the same, the backlog would have increased
by 16.1% compared to the beginning of 2008.
■ P O S T B A L A N C E S H E E T DAT E E V E N T S
O r ga n i s a t i o n a l s t r u c t u r e
The Survey division has been structured as of 1 January
2009 as follows:
• Offshore Survey;
• Subsea Services (the Remotely Operated Vehicle (ROV)
activities have been split off from the other offshore
survey activities at sea);
• Geospatial Services.
governmental and quasi-governmental organisations will
continue to carry out projects.
O t h e r m a r ke t s e g m e n t s
Fugro not only supplies services to the aforementioned
markets but also to a number of other niche markets.
These services include precise positioning for machine
guidance in agriculture, route surveys for offshore
telecommunications cables, and airborne mapping using
laser technology for governmental authorities and other
public services. Approximately 6% of annual revenue is
generated by these segments. In general, these activities
are more region-specifi c and related to the sector’s
economic activity.
■ B A C K L O GAt the beginning of 2009 the backlog of work to be carried
out during the year amounted to EUR 1,600.4 million – an
increase of EUR 141.9 million compared to the previous
year (beginning of 2008: EUR 1,458.5 million).
B a c k l og a t s t a r t o f t h e y e a r
( fo r t h e n e x t t we l ve m o n t h s )
(x EUR 1 mln.) 2009 2008 2007 2006 2005
Geotechnical
Onshore 168.7 152.7 147.1 97.5 74.8
Offshore 174.6 142.6 98.3 69.0 61.9
343.3 295.3 245.4 166.5 136.7
Survey
Offshore 682.3 539.0 481.9 371.7 253.3
Geospatial Services 122.5 109.1 62.1 57.4 42.1
804.8 648.1 544.0 429.1 295.4
Geoscience
Development & Production 391.5 452.7 294.0 170.7 123.1
Airborne Survey 60.8 62.4 63.0 47.8 34.0
452.3 515.1 357.0 218.5 157.1
Total 1,600.4 1,458.5 1,146.4 814.1 589.2
Applicable USD-rate EUR 0.71 EUR 0.68 EUR 0.76 EUR 0.85 EUR 0.73
Recalculated at the exchange rates at the start of 2008, the backlog at the start of 2009 would have been
EUR 92.7 million higher (EUR 1,693.1 million).
Backlog comprises revenue for the coming twelve months and includes on-going contracts and contracts awarded
but not yet started (approximately 66% of the total) and uncompleted parts of on-going projects and projects that
have been identifi ed and are highly likely to be awarded (approximately 34% of the total).
30
Considering the lead time required to put new fi elds into
production, the need for continuous investment in future
production capacity has not been greatly affected by the
current economic situation. According to external reports
published at the end of 2008, it is expected that the
investment budgets of international companies that are
important to Fugro will drop by 6% in 2009 compared to
2008, to around USD 300 billion. Fugro’s involvement in
maintenance of installations at sea (inspection repair
maintenance or IRM) has increased over the last few years
and these activities are far less sensitive to oil price
fl uctuations.
For Fugro’s infrastructure-related activities, stimulus
packages by various governments will lead to more
projects that will compensate for a decline in more
prestigious projects such as the construction of artifi cial
islands off the coast of Dubai. The decentralised
organisational structure, with local operating companies,
will enable Fugro to respond quickly to changes in
demand for infrastructure services that have a national or
regional character.
Due to the sharp fall in prices for minerals and the heavy
dependence of smaller clients on external fi nancing for
projects, a decline in the demand for mineral exploration
services is expected for 2009. This decline can largely be
compensated for by applying research methods that were
developed for the mining industry when searching for oil
and gas and for which Fugro recently received a number
of contracts.
In addition to the infl uence of aforementioned
uncertainties in market developments, the exchange rate
of the US dollar and the British pound compared to the
euro is important. Last year the British pound in
particular lost value against the euro. The larger part of
Fugro’s revenue and costs are in the same currency. The
translation to euros could be of infl uence on the reporting
of results, which is in euros. Furthermore, political
instability can lead to stagnation of projects.
Recent developments will result in less tension in the
labour market and more manageable costs of services by
third parties, such as transport and short-term charter of
vessels.
The Geoscience division has been structured as of
1 January 2009 as follows:
• Seismic Services;
• General Geophysical Services (acquisition, processing
and interpretation of non seismic data from the air,
as well as on land and at sea);
• Information Services.
A c q u i s i t i o n s
Post balance sheet date Fugro announced the acquisition
of the LoadTest group of companies, headquartered in
Gainesville, Florida, USA and with subsidiaries in
Singapore, Korea and United Kingdom, for approximately
EUR 13 million. LoadTest is the world’s leading provider
of static pile load testing services, using the proprietary
bi-directional Osterberg Cell® load testing method.
Revenue for the last fi nancial year was more than
EUR 13 million and the company employs 40 staff.
■ O U T L O O K
The oil and gas industry is Fugro’s most important market
sector, representing a 75% share of the company’s
revenue. The price of oil has no direct infl uence on the
services but can certainly affect the behaviour of Fugro’s
clients with regard to their investments.
The worldwide recession, caused by the fi nancial crisis,
has led to a slowdown in the demand for oil and gas. The
Organisation of the Petroleum Exporting Countries
(OPEC) has, like other oil exporters, responded by cutting
oil production levels. Much uncertainty remains about
the level at which supply and demand will stabilise and at
what oil price. This situation can lead in the short term to
high volatility in the oil price per barrel, as was the case
last year when the price per barrel fl uctuated between
USD 37 and USD 147 per barrel. The current price level of
around USD 40 will most likely delay new projects for
producers with high external fi nancing costs. These are
usually smaller oil companies with primarily short-term,
small-scale projects. On the other hand, some national oil
companies (NOCs) and larger international producers
have recently indicated their intention to increase
investments in the coming year, or at least keep them at
the 2008 level. The investment horizon is an important
issue and must take account of the fact that for new larger
offshore oil and gas fi elds, the time that passes between
the decision to develop a fi eld and the actual start of
production can be several years. Worldwide, the decrease
in production of existing fi elds through depletion is 6 to
8% annually.
31Report of the Board of Management
R e p o r t p u r s u a n t t o a r t i c l e 5 : 2 5 c o f
t h e F i n a n c i a l M a r ke t s S u p e r v i s i o n A c t
i n t h e N e t h e r l a n d s
In the opinion of the Board of Management, the annual
accounts 2008 of Fugro N.V. (pages 76 to 149) give a true
and fair view of the assets, liabilities, the fi nancial
position, and the profi t or loss of Fugro N.V. and its
consolidated companies and the annual report 2008
gives a true and fair view of the fi nancial position as
per 31 December 2008, and the course of events during
2008 of Fugro N.V. and its consolidated companies,
whose details are included in the annual accounts.
The signifi cant risks Fugro N.V. faces are described in
this annual report.
Leidschendam, 5 March 2009
K.S. Wester, President and Chief Executive Offi cer
A. Jonkman, Chief Financial Offi cer
P. van Riel, Director
A. Steenbakker, Director
Currently there is still a lot of uncertainty about the
depth and duration of the worldwide recession.
Fugro will respond to this with measures such as:
• restrictions on new investments, unless profi table in
the short term or strategically important
• fl exibility in hired capacity, such as chartered vessels
and freelance staff
• strict cost control and further optimisation of
operational effi ciency.
As soon as recovery of the world economy sets in, the
sectors on which Fugro focuses, in particular those of
energy, construction, transport, minerals and water,
should soon offer good opportunities.
Expansion and broadening of activities through
acquisition will remain part of the strategy.
The current situation may lead to more realistic
valuations of companies than has been the case in
some sectors in recent years.
In summary, based on a good backlog, we expect in the
fi rst half year of 2009 a modest increase in revenue due to
organic growth and acquisitions and a slightly lower net
profi t margin than in the fi rst half of 2008. In view of the
current volatility in the market developments the
expected course of events for the full year 2009 cannot be
indicated at this time.
Due to the short-term nature of a number of our projects,
as in previous years we will fi rst publish a quantitative
forecast for the entire year in August 2009, at the time of
the publication of the 2009 half-yearly report.
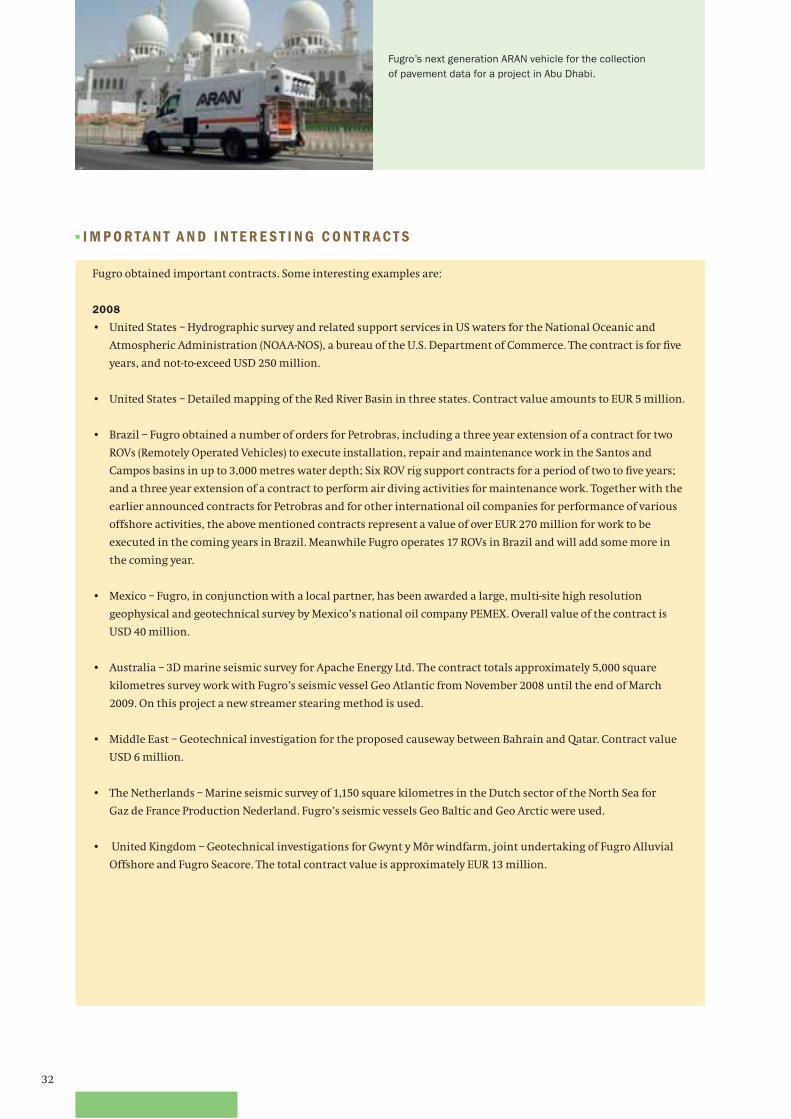
32
Fugro’s next generation ARAN vehicle for the collection
of pavement data for a project in Abu Dhabi.
Fugro obtained important contracts. Some interesting examples are:
2008
• United States – Hydrographic survey and related support services in US waters for the National Oceanic and
Atmospheric Administration (NOAA-NOS), a bureau of the U.S. Department of Commerce. The contract is for fi ve
years, and not-to-exceed USD 250 million.
• United States – Detailed mapping of the Red River Basin in three states. Contract value amounts to EUR 5 million.
• Brazil – Fugro obtained a number of orders for Petrobras, including a three year extension of a contract for two
ROVs (Remotely Operated Vehicles) to execute installation, repair and maintenance work in the Santos and
Campos basins in up to 3,000 metres water depth; Six ROV rig support contracts for a period of two to fi ve years;
and a three year extension of a contract to perform air diving activities for maintenance work. Together with the
earlier announced contracts for Petrobras and for other international oil companies for performance of various
offshore activities, the above mentioned contracts represent a value of over EUR 270 million for work to be
executed in the coming years in Brazil. Meanwhile Fugro operates 17 ROVs in Brazil and will add some more in
the coming year.
• Mexico – Fugro, in conjunction with a local partner, has been awarded a large, multi-site high resolution
geophysical and geotechnical survey by Mexico’s national oil company PEMEX. Overall value of the contract is
USD 40 million.
• Australia – 3D marine seismic survey for Apache Energy Ltd. The contract totals approximately 5,000 square
kilometres survey work with Fugro’s seismic vessel Geo Atlantic from November 2008 until the end of March
2009. On this project a new streamer stearing method is used.
• Middle East – Geotechnical investigation for the proposed causeway between Bahrain and Qatar. Contract value
USD 6 million.
• The Netherlands – Marine seismic survey of 1,150 square kilometres in the Dutch sector of the North Sea for
Gaz de France Production Nederland. Fugro’s seismic vessels Geo Baltic and Geo Arctic were used.
• United Kingdom – Geotechnical investigations for Gwynt y Môr windfarm, joint undertaking of Fugro Alluvial
Offshore and Fugro Seacore. The total contract value is approximately EUR 13 million.
■ I M P O R TA N T A N D I N T E R E S T I N G C O N T R A C T S
33Report of the Board of Management
• Africa – Several airborne projects, funded by the European Union: In the past years Fugro fl ew approximately
600,000 line kilometres in Niger to acquire data to evaluate the mining possibilities in the country with a total
contract value of USD 12.5 million. At the beginning of 2009 the airborne survey activitites in Ghana will be
fi nished (300,000 line kilometres, USD 14.1 million), as well as in Senegal (more than 150,000 line kilometres,
USD 4.3 million).
• Papua New Guinea – For the Ministry of Mines in Papua New Guinea Fugro collected approximately 200,000 line
kilometres in the central highlands of PNG during a three-year period. The result is intended to contribute to a
regional database of mineral prospectivity. This EUR 12.5 million survey was also fi nanced by the European
Union.
• Middle East – Major geophysical research to determine the condition of runway pavement and foundation of the
Abu Dhabi International Airport. For this project Fugro used an integrated system of different geophysical
techniques and satellite navigation.
• Africa (Isle de La Réunion) – Near shore geotechnical investigation as part of a feasibility study on improvement of
a 15 kilometre coastal highway section. This highway on the island of La Réunion is prone to landslides and
erosion by tropical storm waves. Near shore testing and coring at 37 sites has been undertaken using the Skate IV
self-elevating jack-up platform.
2009
• Brazil – an award for a geochemical coring programme in the Jacuipe basin in the northeast of Brazil with a
contract value of about EUR 6 million.
• Tanzania/Mozambique – two contracts for the execution of extensive oceanographic and meteorological
measurement programs in the Indian Ocean offshore Tanzania and Mozambique. The programs will be more
than a year’s work.
• South America – Two contracts for high accuracy elevation mapping over parts of South America, with a
combined value of USD 13 million. The contracts will be carried out using Fugro EarthData’s exclusive GeoSAR
airborne radar mapping system and are funded by the U.S. government.
• Spain – The Spanish harbour authority, Puertos del Estado, has awarded Fugro a two year service and
maintenance contract for an existing ocean buoy network along the Spanish coast line. The contract value is
EUR 3.9 million, with an option to extend the contract for an additional four years, in which case, the total value
could reach over EUR 12 million. The Puertos del Estado Deep Water Network is designed to measure marine
climatic parameters and was set up in 1996 in a supply and maintenance contract between Puertos del Estado
and Fugro. The system currently consists of 23 operating buoys and three current meter strings in 15 positions
stretching along the entire coastline of Spain.
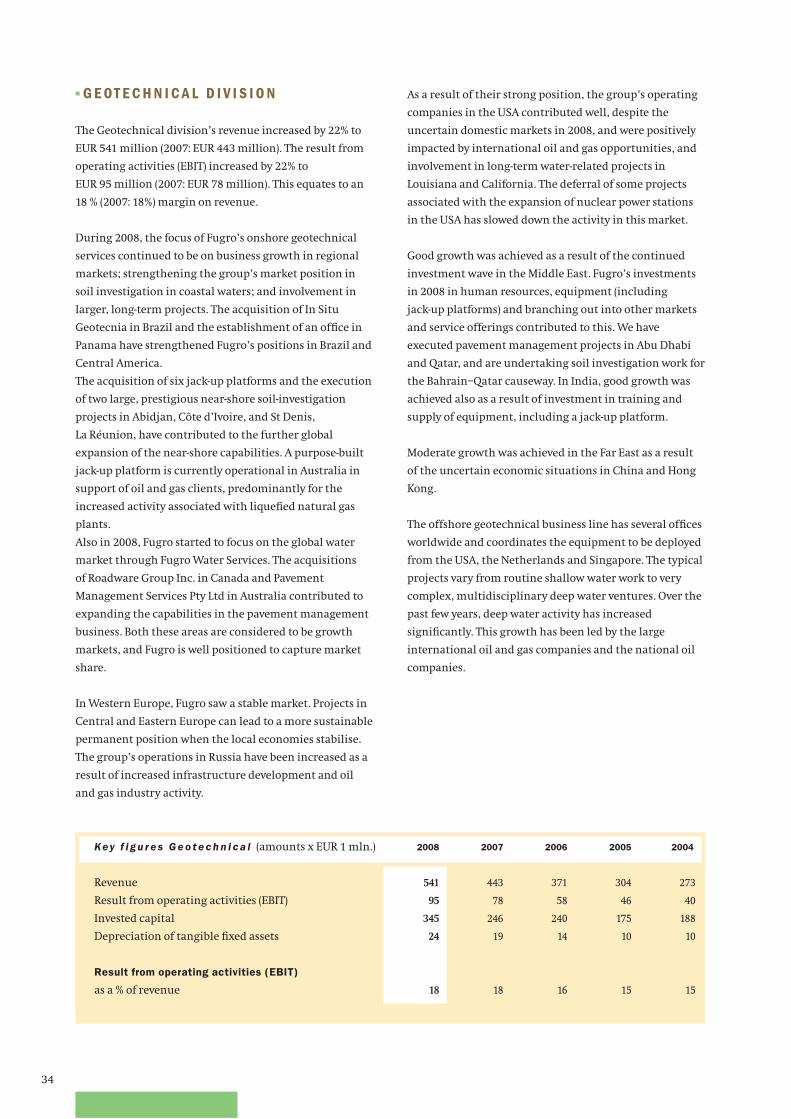
34
Key f i g u r e s G e o t e c h n i c a l (amounts x EUR 1 mln.) 2008 2007 2006 2005 2004
Revenue 541 443 371 304 273
Result from operating activities (EBIT) 95 78 58 46 40
Invested capital 345 246 240 175 188
Depreciation of tangible fi xed assets 24 19 14 10 10
Result from operating activities (EBIT)
as a % of revenue 18 18 16 15 15
As a result of their strong position, the group’s operating
companies in the USA contributed well, despite the
uncertain domestic markets in 2008, and were positively
impacted by international oil and gas opportunities, and
involvement in long-term water-related projects in
Louisiana and California. The deferral of some projects
associated with the expansion of nuclear power stations
in the USA has slowed down the activity in this market.
Good growth was achieved as a result of the continued
investment wave in the Middle East. Fugro’s investments
in 2008 in human resources, equipment (including
jack-up platforms) and branching out into other markets
and service offerings contributed to this. We have
executed pavement management projects in Abu Dhabi
and Qatar, and are undertaking soil investigation work for
the Bahrain–Qatar causeway. In India, good growth was
achieved also as a result of investment in training and
supply of equipment, including a jack-up platform.
Moderate growth was achieved in the Far East as a result
of the uncertain economic situations in China and Hong
Kong.
The offshore geotechnical business line has several offi ces
worldwide and coordinates the equipment to be deployed
from the USA, the Netherlands and Singapore. The typical
projects vary from routine shallow water work to very
complex, multidisciplinary deep water ventures. Over the
past few years, deep water activity has increased
signifi cantly. This growth has been led by the large
international oil and gas companies and the national oil
companies.
■ G E OT E C H N I C A L D I V I S I O N
The Geotechnical division’s revenue increased by 22% to
EUR 541 million (2007: EUR 443 million). The result from
operating activities (EBIT) increased by 22% to
EUR 95 million (2007: EUR 78 million). This equates to an
18 % (2007: 18%) margin on revenue.
During 2008, the focus of Fugro’s onshore geotechnical
services continued to be on business growth in regional
markets; strengthening the group’s market position in
soil investigation in coastal waters; and involvement in
larger, long-term projects. The acquisition of In Situ
Geotecnia in Brazil and the establishment of an offi ce in
Panama have strengthened Fugro’s positions in Brazil and
Central America.
The acquisition of six jack-up platforms and the execution
of two large, prestigious near-shore soil-investigation
projects in Abidjan, Côte d’Ivoire, and St Denis,
La Réunion, have contributed to the further global
expansion of the near-shore capabilities. A purpose-built
jack-up platform is currently operational in Australia in
support of oil and gas clients, predominantly for the
increased activity associated with liquefi ed natural gas
plants.
Also in 2008, Fugro started to focus on the global water
market through Fugro Water Services. The acquisitions
of Roadware Group Inc. in Canada and Pavement
Management Services Pty Ltd in Australia contributed to
expanding the capabilities in the pavement management
business. Both these areas are considered to be growth
markets, and Fugro is well positioned to capture market
share.
In Western Europe, Fugro saw a stable market. Projects in
Central and Eastern Europe can lead to a more sustainable
permanent position when the local economies stabilise.
The group’s operations in Russia have been increased as a
result of increased infrastructure development and oil
and gas industry activity.
35Report of the Board of Management
Research is continuously undertaken to improve and
enhance the data collection technology used routinely in
water depths to 3,000 m. Formerly, the emphasis and
capital investment were centred on vessels, equipment
and data collection, but, during 2008, the group’s efforts
shifted to building a world-recognised consulting group
by combining the expertise and experience of the
consultants in the survey and geotechnical groups into
one geoconsulting entity. This group has established
centres in the USA, the UK and Singapore.
The business line improved its performance compared
with 2007 as a result of more effi cient scheduling of
resources, market oriented pricing policies and general
higher work levels in 2008.
The group’s backlog has shifted to having a higher
proportion of revenue from the deepwater markets and
greater reliance on the large international and national
oil companies. Major projects were undertaken in
virtually all the geographical regions of the world, with
particularly large jobs in the Mediterranean, the Gulf of
Mexico, Brazil and West Africa. In 2008 two chartered
vessels were temporarily added to the fl eet to ensure
timely completion of work. At the end of the year, globally
all vessels entered 2009 with a signifi cant backlog, which
supports a good start for the year.
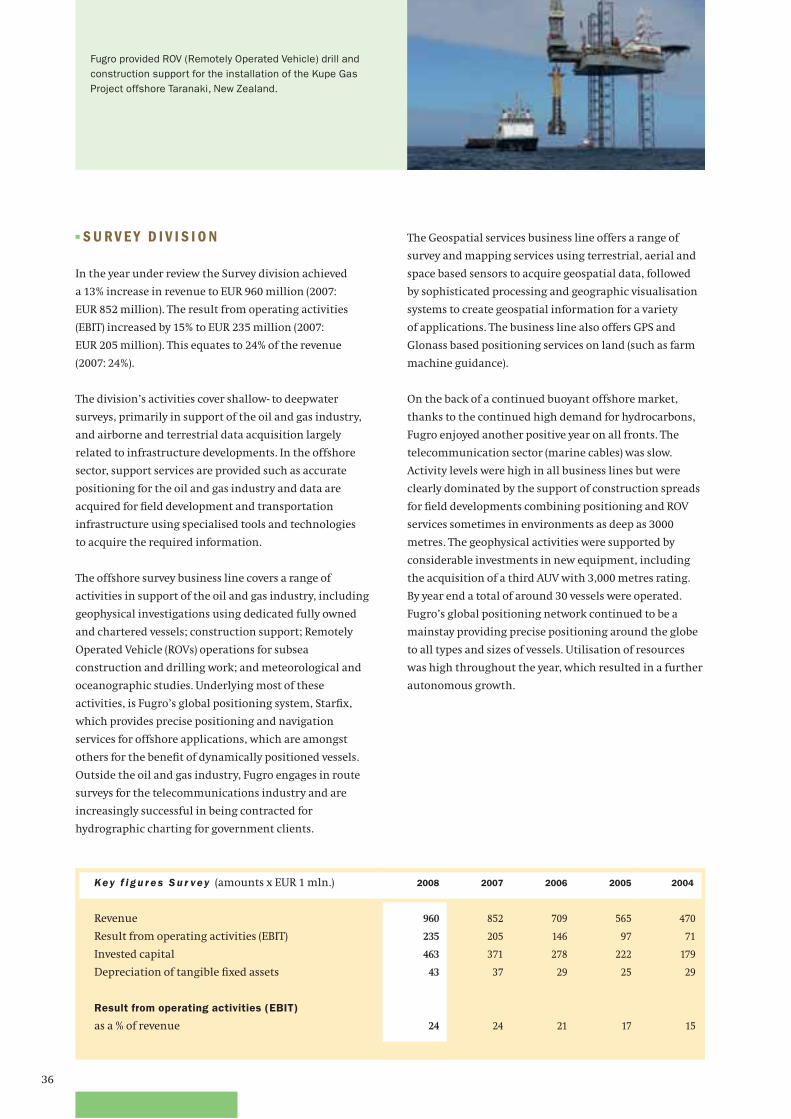
36
Fugro provided ROV (Remotely Operated Vehicle) drill and
construction support for the installation of the Kupe Gas
Project offshore Taranaki, New Zealand.
■ S U R V E Y D I V I S I O N
In the year under review the Survey division achieved
a 13% increase in revenue to EUR 960 million (2007:
EUR 852 million). The result from operating activities
(EBIT) increased by 15% to EUR 235 million (2007:
EUR 205 million). This equates to 24% of the revenue
(2007: 24%).
The division’s activities cover shallow- to deepwater
surveys, primarily in support of the oil and gas industry,
and airborne and terrestrial data acquisition largely
related to infrastructure developments. In the offshore
sector, support services are provided such as accurate
positioning for the oil and gas industry and data are
acquired for fi eld development and transportation
infrastructure using specialised tools and technologies
to acquire the required information.
The offshore survey business line covers a range of
activities in support of the oil and gas industry, including
geophysical investigations using dedicated fully owned
and chartered vessels; construction support; Remotely
Operated Vehicle (ROVs) operations for subsea
construction and drilling work; and meteorological and
oceanographic studies. Underlying most of these
activities, is Fugro’s global positioning system, Starfi x,
which provides precise positioning and navigation
services for offshore applications, which are amongst
others for the benefi t of dynamically positioned vessels.
Outside the oil and gas industry, Fugro engages in route
surveys for the telecommunications industry and are
increasingly successful in being contracted for
hydrographic charting for government clients.
The Geospatial services business line offers a range of
survey and mapping services using terrestrial, aerial and
space based sensors to acquire geospatial data, followed
by sophisticated processing and geographic visualisation
systems to create geospatial information for a variety
of applications. The business line also offers GPS and
Glonass based positioning services on land (such as farm
machine guidance).
On the back of a continued buoyant offshore market,
thanks to the continued high demand for hydrocarbons,
Fugro enjoyed another positive year on all fronts. The
telecommunication sector (marine cables) was slow.
Activity levels were high in all business lines but were
clearly dominated by the support of construction spreads
for fi eld developments combining positioning and ROV
services sometimes in environments as deep as 3000
metres. The geophysical activities were supported by
considerable investments in new equipment, including
the acquisition of a third AUV with 3,000 metres rating.
By year end a total of around 30 vessels were operated.
Fugro’s global positioning network continued to be a
mainstay providing precise positioning around the globe
to all types and sizes of vessels. Utilisation of resources
was high throughout the year, which resulted in a further
autonomous growth.
Key f i g u r e s S u r vey (amounts x EUR 1 mln.) 2008 2007 2006 2005 2004
Revenue 960 852 709 565 470
Result from operating activities (EBIT) 235 205 146 97 71
Invested capital 463 371 278 222 179
Depreciation of tangible fi xed assets 43 37 29 25 29
Result from operating activities (EBIT)
as a % of revenue 24 24 21 17 15
37Report of the Board of Management
Investment in people continued through the Fugro
Academy training programme, which is now well
established in the company. Investments were dominated
by equipment for the subsea market (sonars, positioning
tools and a total of 22 ROVs). The new ROV construction
support vessel Fugro Saltire (charter) and the survey vessel
Fugro Navigator (fully owned) were added to the fl eet.
Fugro maintained a presence in all oil and gas centres
around the world and invested considerably in furthering
the use of local staff, an undertaking appreciated in
particular by clients from the national oil companies
(NOCs). Acquisitions were limited to smaller companies
focused on adding value at strategic locations.
The demand for specialised Geospatial services is growing
worldwide, in particular spatial information for
governments, natural resource exploitation and
infrastructure related applications. Spurred on by the free
availability of maps and earth imagery on the Internet,
there is a growing trend to represent and visualise our fast
changing world through detailed maps, aerial imagery
and 3D models. Consequently, there is an increasing
demand for ever more accurate and up-to-date geospatial
data.
The acquisitions announced in 2007 were fully integrated
over the course of 2008 to strengthen Fugro’s Geospatial
service capability in North America, the Middle East,
Africa and Europe.
Geospatial Services experienced robust growth in 2008.
All market sectors and all regions where the business line
is active contributed positively to this growth. During
2008, investments were focused on acquiring new LiDAR
and imaging sensors for aerial applications and
instruments to support terrestrial survey services. In
aerial mapping, Fugro secured the award of a number of
important projects, like a multi-year contract to map the
entire rail network of the Norfolk Southern rail company
in the USA.
38
■ G E O S C I E N C E D I V I S I O N
In 2008 the Geoscience division achieved a 29% higher
revenue of EUR 654 million (2007: EUR 508 million).
The result from operating activities (EBIT) increased
by 34% to EUR 154 million (2007: EUR 115 million).
This equates to a margin on revenue of 24% (2007: 23%).
Development & Production activities supply the oil and
gas industry worldwide with a broad spectrum of
interrelated services and occupies a strong position in the
offshore seismic survey market and as a supplier of non-
exclusive multi client data. It also provides data
management and high-value geophysical, geological and
reservoir data processing and interpretation services
aimed at improving knowledge about (potential) oil and
gas reservoirs.
The activities of all the business units continued to
develop very well in 2008. Once again the oil and gas
industry showed an increase in investments in
exploration activities. This resulted in an increase in the
demand for seismic surveys and good sales of geological
and seismic multi client data.
Seismic activities made a strong contribution to the
Geoscience division. In 2008 total revenue in seismic
services amounted to approximately EUR 465 million,
by which the intended tripling of the activities has been
achieved and has made Fugro an important global player
in seismic survey. The demand for geoscience data for the
exploration and development of new oil and gas prospects
is expected to continue to grow as well as data to enhance
production from existing fi elds as production from
existing oil fi elds continues to decline. This decline needs
to be offset and additional production is required to meet
the projections for long term growth in oil and gas
demand from a growing world population.
The positive development of business in 2008 was due to
favourable market conditions and Fugro’s investment in
vessels and equipment is paying off. Fugro continued with
its seismic fl eet expansion plan and towards the end of
2008 launched the large high end, high capacity and fully
owned 3D vessel Geo Caribbean. In addition investments
were made in data warehouses, software development,
geologic laboratory equipment, software and computers
to expand seismic data processing capabilities.
By far the largest part of the 2008 growth was organic.
This organic growth was supported by some acquisitions
to expand the division’s geographic reach and technology
base. Acquisitions included Phoenix Data Solutions in the
United Kingdom which adds to Fugro Data Solutions’
seismic data conditioning capabilities. A further
acquisition was that of GeoLab Nor, which has added
signifi cant capacity for geochemistry services. In this fi eld
Fugro has now become a major service provider
in data acquisition, analysis and interpretation.
This acquisition will further support Fugro taking on the
marine acquisition of such data.
Demand for airborne geophysical services remained
robust in 2008. Both mining and oil and gas industries
continued to execute their exploration activity at
historically high levels. A number of governments
extended their interest in regional data acquisition as a
means of underpinning future natural resource-based
economic development. In the last quarter of 2008
demand for these services declined as result of the strong
drop in prices of raw materials.
Key f i g u r e s G e o s c i e n c e (amounts x EUR 1 mln.) 2008 2007 2006 2005 2004
Revenue 654 508 354 292 265
Result from operating activities (EBIT) 154 115 66 44 37
Invested capital 477 402 286 180 159
Depreciation of tangible fi xed assets 28 23 17 18 16
Result from operating activities (EBIT)
as a % of revenue 24 23 19 15 14
39Report of the Board of Management
Airborne Survey developed well and continuing progress
was made with respect to putting elements of the long
term plan into place. In order to strengthen its position as
the provider of the broadest range of geophysical
solutions, Fugro acquired the Falcon technology of gravity
gradiometry systems from BHP Billiton. This uniquely
positions Fugro to provide the highest standard of
airborne gravimetric surveying presently available to the
hydrocarbon and mining exploration industries.
Also, during the year Fugro Gravity and Magnetic Services
was created in order to provide a single point of contact
for the complete suite of Fugro’s potential fi elds
exploration services. These are of increasing importance
in two respects. As explorers are forced to broaden their
search space for new reserves of natural resources, gravity
and magnetics provides a cost effective way to cover large
areas relatively quickly. In addition, explorers are more
than ever concerned with prioritisation and de-risking of
drilling targets as these move into more complex and
challenging environments. In this sense, gravity and
magnetics are well suited as complementary data sets to
maximise the utility of seismic information.
Increased sales efforts established South America as a
signifi cant market in its own right. Elsewhere, data
acquisition portions of large regional mapping projects
in, amongst others, Ghana, Senegal and Papua New
Guinea were completed and a similar multi-year program
in Nigeria continued. The acquisition of NexTerra
Geophysical Solutions expanded our presence in India,
another geographic market which is expected to continue
to grow in importance.
The introduction of new helicopter electromagnetic
technology in 2007 was followed in 2008 by expansion of
the number of systems to establish Fugro as a signifi cant
provider of these services on a global basis. Important
surveys were executed in Canada, Africa and Russia.
Fugro also acquired 60% of EMMET, an electromagnetic
technology development company based in Russia.
EMMET forms part of the effort to extend the use of
existing airborne and terrestrial electromagnetic
capabilities and knowledge into the marine environment.

DeepdeeperdeepestThe world’s structurally growing demand for energy and the depletion of fi elds with ‘easy
accessibility’ mean that those oil and gas fi elds that are diffi cult to explore and develop are
becoming economically more attractive. Huge investments are being made in the exploitation of
such fi elds by the oil and gas industry.
Research shows that many of the remaining oil and gas reserves lie in deep water. Technological
developments in the oil and gas industry have made it possible to unlock these deposits,
which were previously unreachable. Fugro supports oil and gas companies in their search for
hydrocarbons in deep water, and helps them to chart the seabed and the structures that lie
thousands of metres below. The map of the world below shows the vast area (‘red and blue’)
that is regarded as deep water.
0 m up to 450 m 450 m up to 3,000 m 3,000 m up to 4,500 m 4,500 m up to 10,000 m
It turns out that many of the new oil and gas
concentrations being found are in small,
separate deposits rather than in one large
reservoir. Production from this sort of
discovery requires more extraction wells,
which may be situated many kilometres apart.
To be profi table, such fi elds need connecting
to a central producing facility on the sea fl oor.
This creates a complex infrastructure of
cables, pipelines, valves and other equipment
on the seabed.
Fugro supports the oil and gas industry
throughout all phases of an oil or gas fi eld’s
life cycle. Its technological leadership and
innovative strength enables the company to
respond to this trend for hydrocarbon
production in deep water.
Working at great depths, currently as deep as
3,000 m, brings enormous new challenges.
It is impossible for divers to operate at such
depths owing to the high water pressure.
Therefore, equipment needs to be installed
on the seabed and operated remotely from a
great distance. Fugro has an extensive range
of technological solutions for working at great
depths.
Complex challenges
0 m
1,000 m
2,000 m
3,000 m
Wate
r depth
In deep water and deep below the seabed
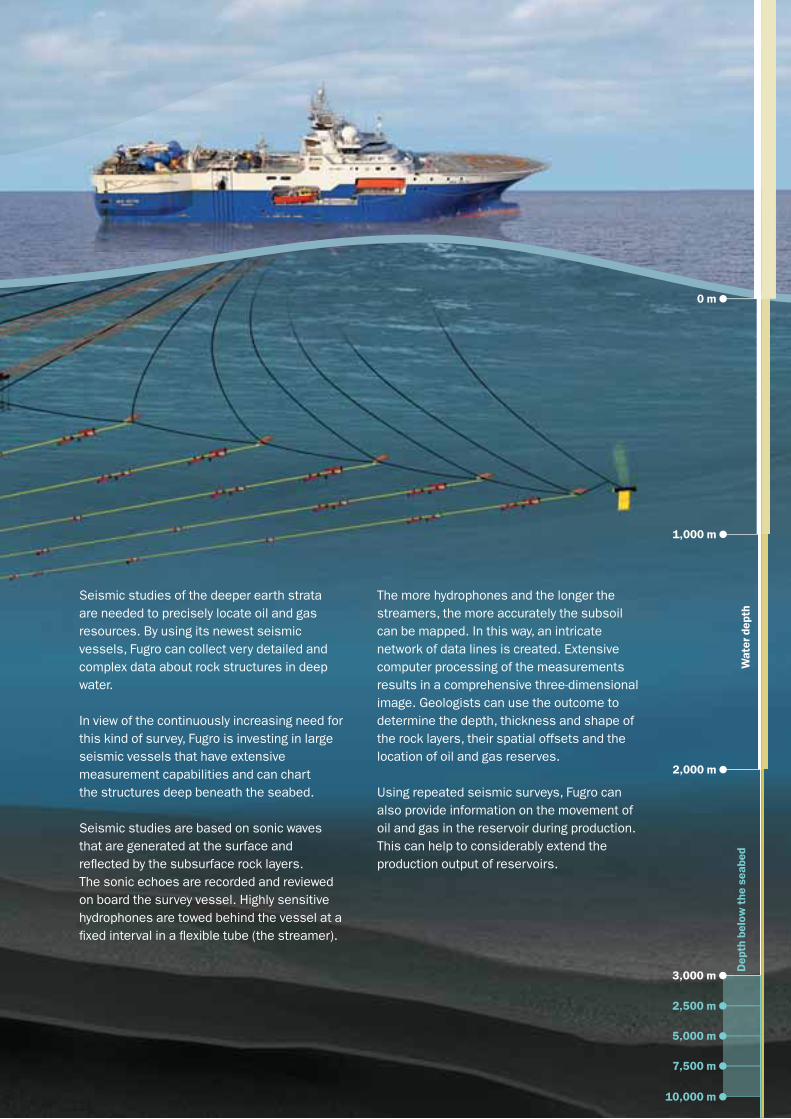
0 m
1,000 m
2,000 m
3,000 m
2,500 m
5,000 m
7,500 m
10,000 m
Wate
r depth
Depth
belo
w t
he s
eabed
Seismic studies of the deeper earth strata
are needed to precisely locate oil and gas
resources. By using its newest seismic
vessels, Fugro can collect very detailed and
complex data about rock structures in deep
water.
In view of the continuously increasing need for
this kind of survey, Fugro is investing in large
seismic vessels that have extensive
measurement capabilities and can chart
the structures deep beneath the seabed.
Seismic studies are based on sonic waves
that are generated at the surface and
refl ected by the subsurface rock layers.
The sonic echoes are recorded and reviewed
on board the survey vessel. Highly sensitive
hydrophones are towed behind the vessel at a
fi xed interval in a fl exible tube (the streamer).
The more hydrophones and the longer the
streamers, the more accurately the subsoil
can be mapped. In this way, an intricate
network of data lines is created. Extensive
computer processing of the measurements
results in a comprehensive three-dimensional
image. Geologists can use the outcome to
determine the depth, thickness and shape of
the rock layers, their spatial offsets and the
location of oil and gas reserves.
Using repeated seismic surveys, Fugro can
also provide information on the movement of
oil and gas in the reservoir during production.
This can help to considerably extend the
production output of reservoirs.
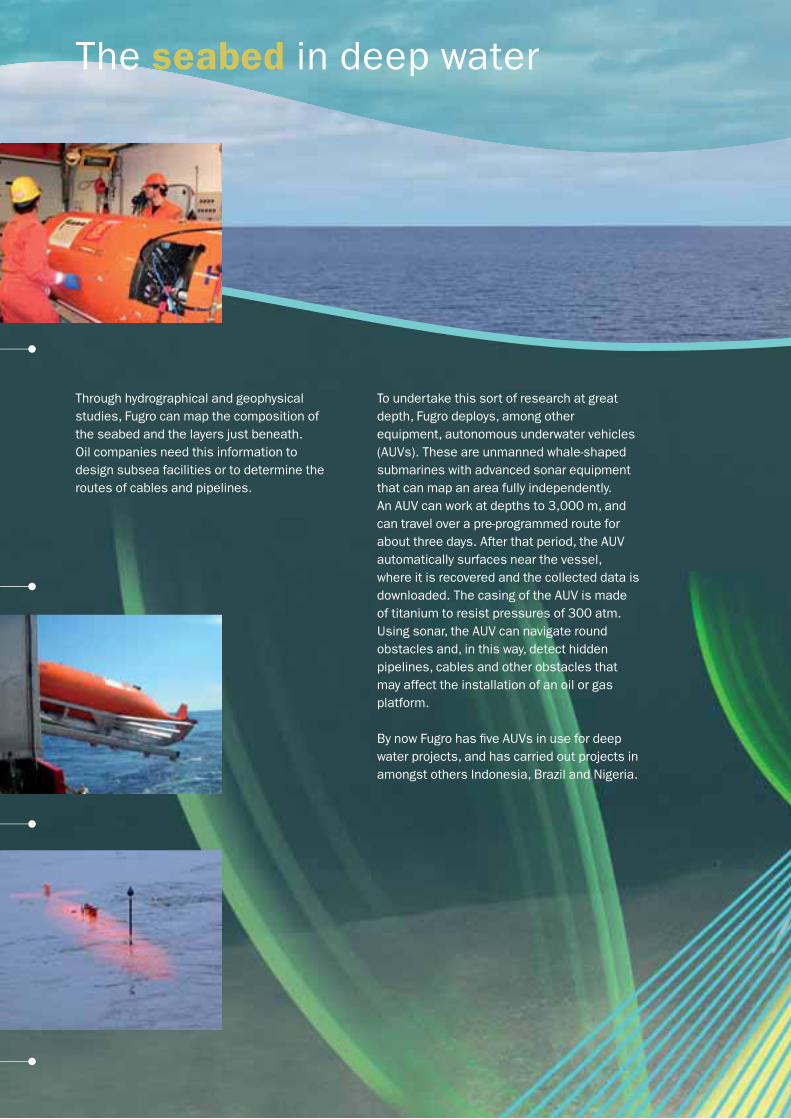
Through hydrographical and geophysical
studies, Fugro can map the composition of
the seabed and the layers just beneath.
Oil companies need this information to
design subsea facilities or to determine the
routes of cables and pipelines.
To undertake this sort of research at great
depth, Fugro deploys, among other
equipment, autonomous underwater vehicles
(AUVs). These are unmanned whale-shaped
submarines with advanced sonar equipment
that can map an area fully independently.
An AUV can work at depths to 3,000 m, and
can travel over a pre-programmed route for
about three days. After that period, the AUV
automatically surfaces near the vessel,
where it is recovered and the collected data is
downloaded. The casing of the AUV is made
of titanium to resist pressures of 300 atm.
Using sonar, the AUV can navigate round
obstacles and, in this way, detect hidden
pipelines, cables and other obstacles that
may affect the installation of an oil or gas
platform.
By now Fugro has fi ve AUVs in use for deep
water projects, and has carried out projects in
amongst others Indonesia, Brazil and Nigeria.
The seabed in deep water
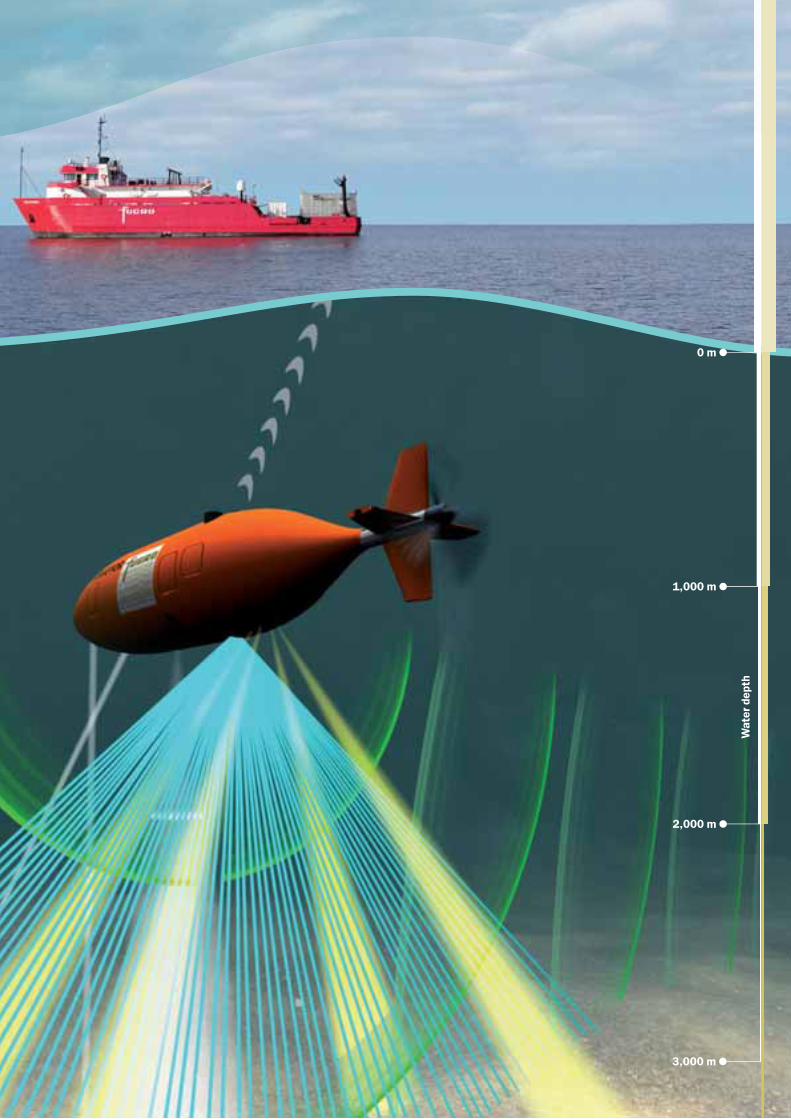
0 m
1,000 m
2,000 m
3,000 m
Wate
r depth
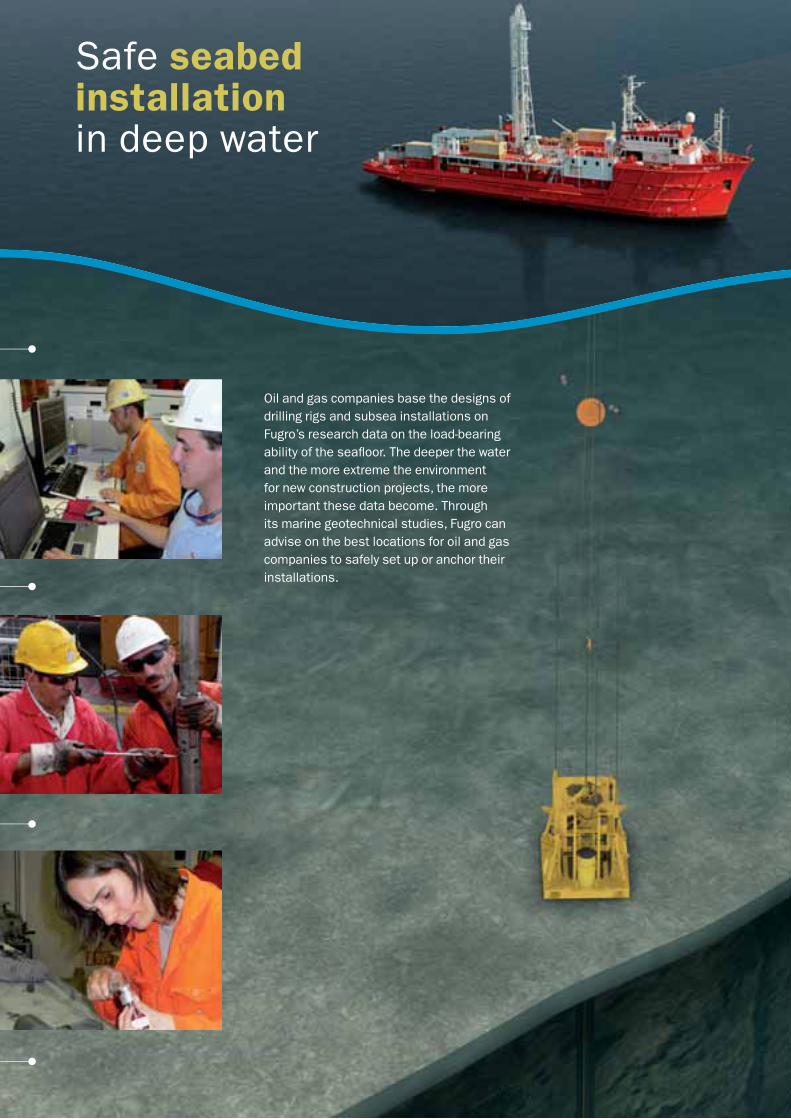
Oil and gas companies base the designs of
drilling rigs and subsea installations on
Fugro’s research data on the load-bearing
ability of the seafl oor. The deeper the water
and the more extreme the environment
for new construction projects, the more
important these data become. Through
its marine geotechnical studies, Fugro can
advise on the best locations for oil and gas
companies to safely set up or anchor their
installations.
Safe seabed installation in deep water
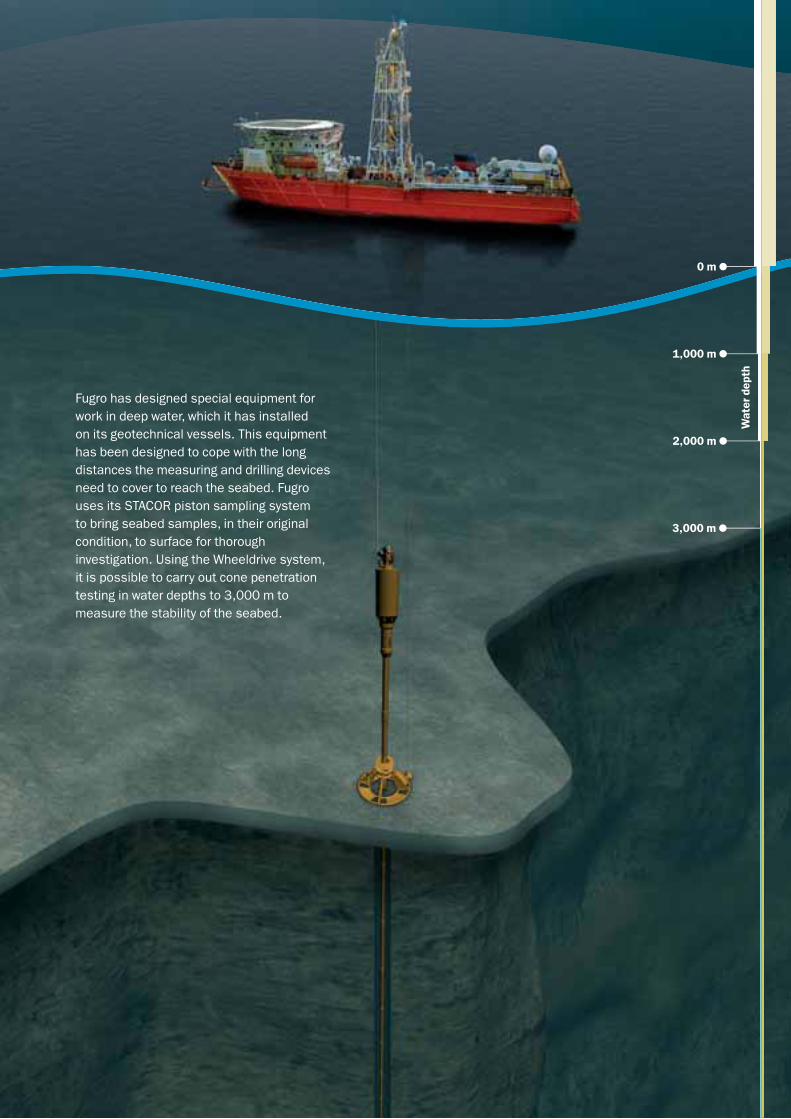
1,000 m
2,000 m
3,000 m
Wate
r depth
0 m
Fugro has designed special equipment for
work in deep water, which it has installed
on its geotechnical vessels. This equipment
has been designed to cope with the long
distances the measuring and drilling devices
need to cover to reach the seabed. Fugro
uses its STACOR piston sampling system
to bring seabed samples, in their original
condition, to surface for thorough
investigation. Using the Wheeldrive system,
it is possible to carry out cone penetration
testing in water depths to 3,000 m to
measure the stability of the seabed.
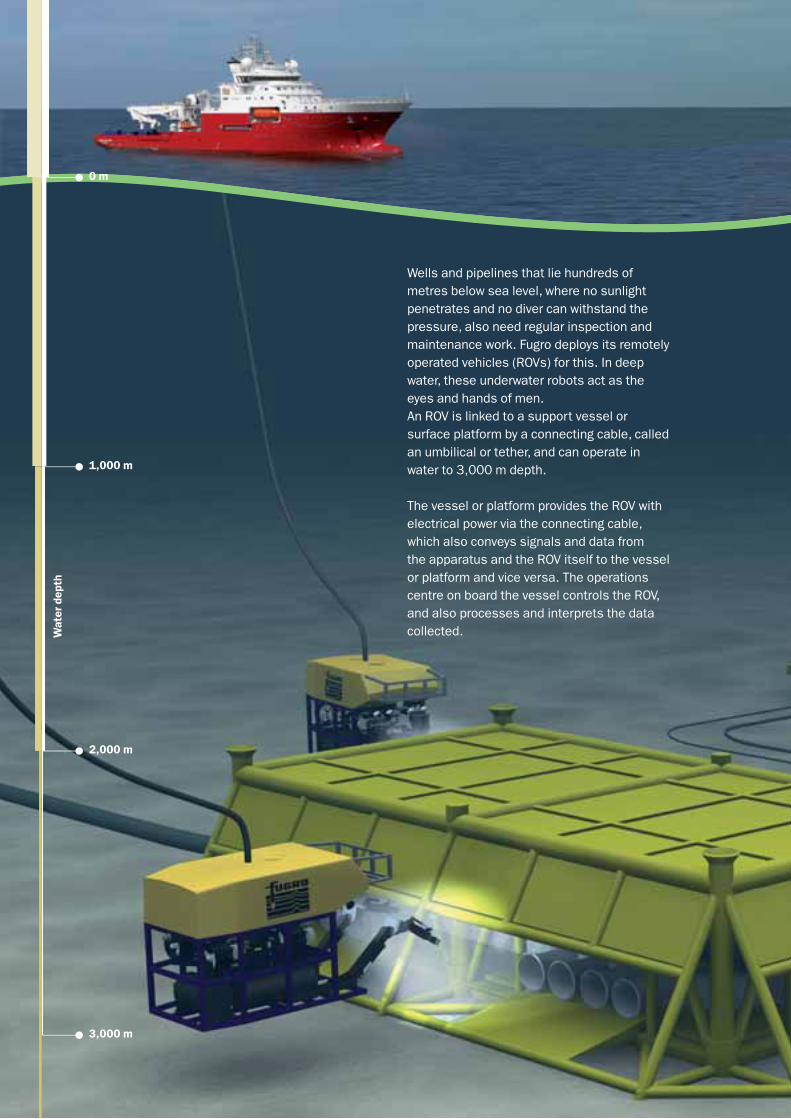
0 m
1,000 m
2,000 m
3,000 m
Wate
r depth
Wells and pipelines that lie hundreds of
metres below sea level, where no sunlight
penetrates and no diver can withstand the
pressure, also need regular inspection and
maintenance work. Fugro deploys its remotely
operated vehicles (ROVs) for this. In deep
water, these underwater robots act as the
eyes and hands of men.
An ROV is linked to a support vessel or
surface platform by a connecting cable, called
an umbilical or tether, and can operate in
water to 3,000 m depth.
The vessel or platform provides the ROV with
electrical power via the connecting cable,
which also conveys signals and data from
the apparatus and the ROV itself to the vessel
or platform and vice versa. The operations
centre on board the vessel controls the ROV,
and also processes and interprets the data
collected.
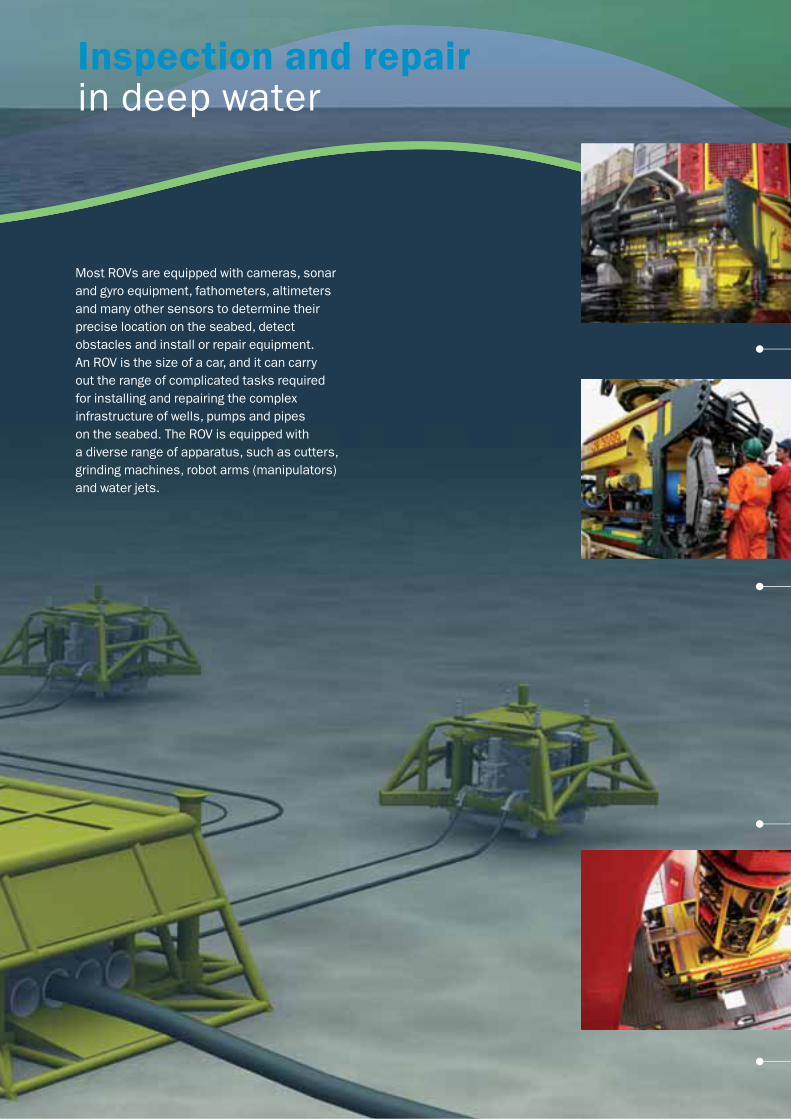
Most ROVs are equipped with cameras, sonar
and gyro equipment, fathometers, altimeters
and many other sensors to determine their
precise location on the seabed, detect
obstacles and install or repair equipment.
An ROV is the size of a car, and it can carry
out the range of complicated tasks required
for installing and repairing the complex
infrastructure of wells, pumps and pipes
on the seabed. The ROV is equipped with
a diverse range of apparatus, such as cutters,
grinding machines, robot arms (manipulators)
and water jets.
Inspection and repair in deep water
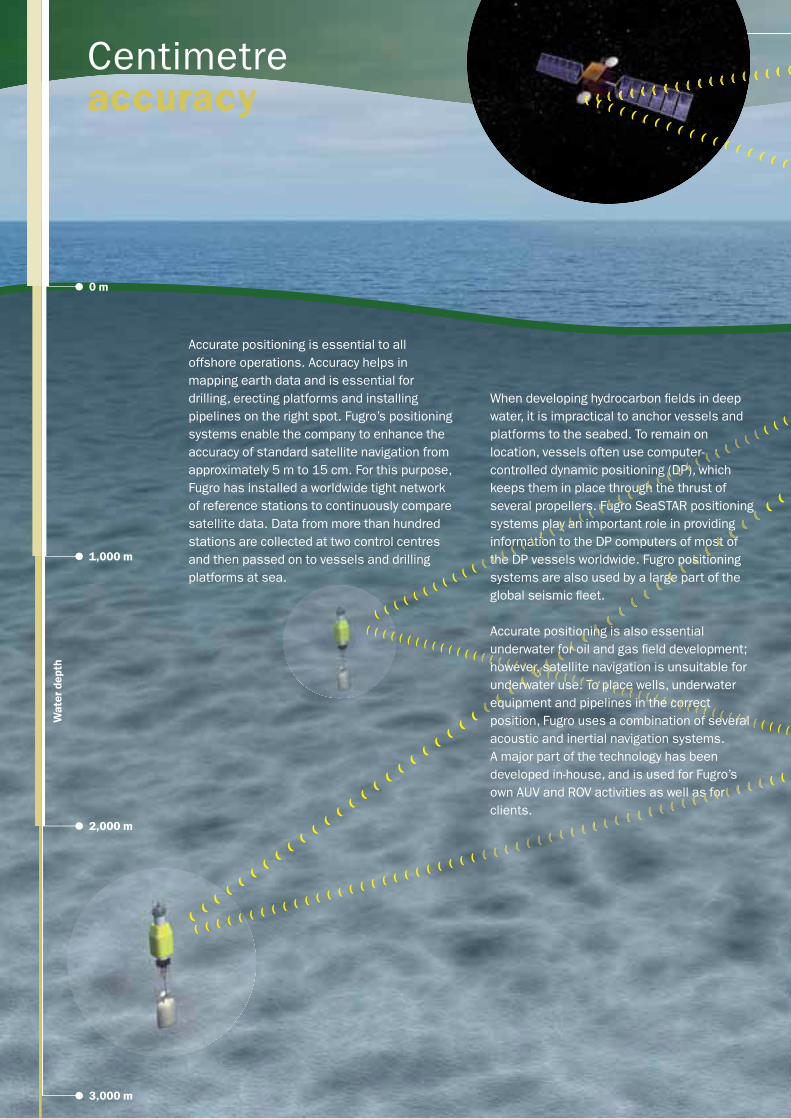
0 m
1,000 m
2,000 m
3,000 m
Wate
r depth
Accurate positioning is essential to all
offshore operations. Accuracy helps in
mapping earth data and is essential for
drilling, erecting platforms and installing
pipelines on the right spot. Fugro’s positioning
systems enable the company to enhance the
accuracy of standard satellite navigation from
approximately 5 m to 15 cm. For this purpose,
Fugro has installed a worldwide tight network
of reference stations to continuously compare
satellite data. Data from more than hundred
stations are collected at two control centres
and then passed on to vessels and drilling
platforms at sea.
When developing hydrocarbon fi elds in deep
water, it is impractical to anchor vessels and
platforms to the seabed. To remain on
location, vessels often use computer-
controlled dynamic positioning (DP), which
keeps them in place through the thrust of
several propellers. Fugro SeaSTAR positioning
systems play an important role in providing
information to the DP computers of most of
the DP vessels worldwide. Fugro positioning
systems are also used by a large part of the
global seismic fl eet.
Accurate positioning is also essential
underwater for oil and gas fi eld development;
however, satellite navigation is unsuitable for
underwater use. To place wells, underwater
equipment and pipelines in the correct
position, Fugro uses a combination of several
acoustic and inertial navigation systems.
A major part of the technology has been
developed in-house, and is used for Fugro’s
own AUV and ROV activities as well as for
clients.
Centimetreaccuracy
g
fsto
sp
gea
non
rf
sar
rwd
eq
P)D(g
thhugo
gruFs
nayl
ioatmo
eth
alree
cterroceh
e capoTe
tsaervewoh
osa
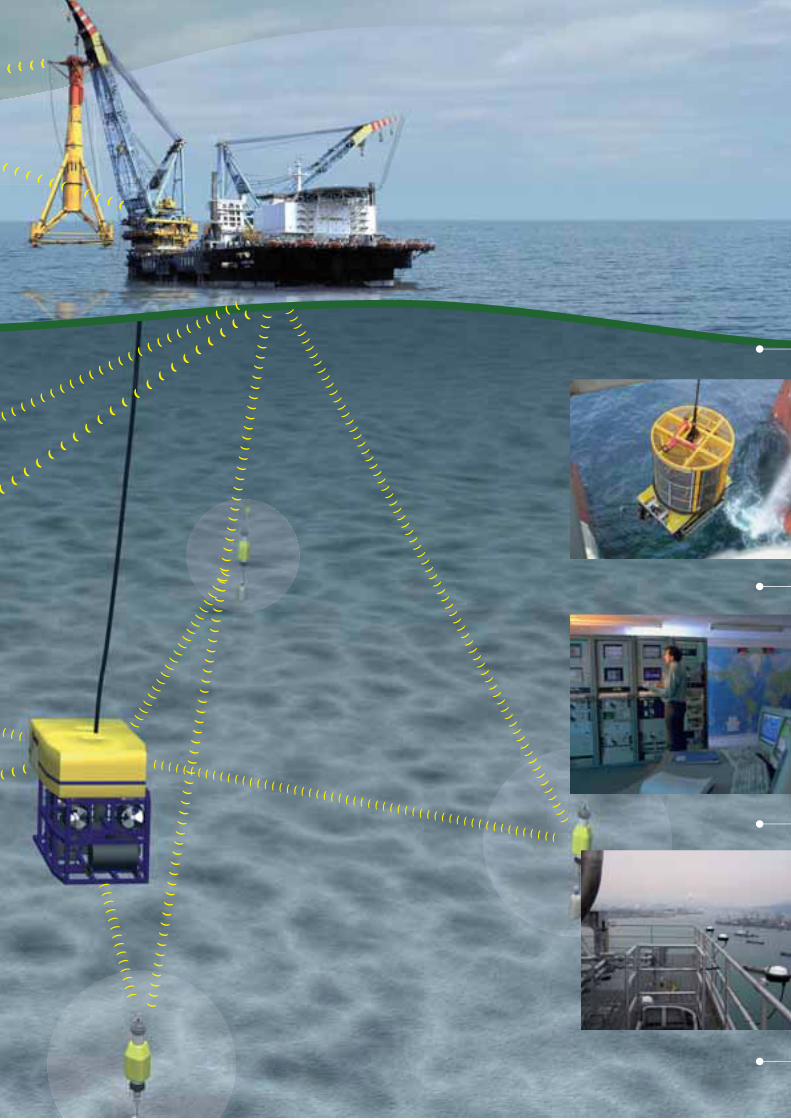
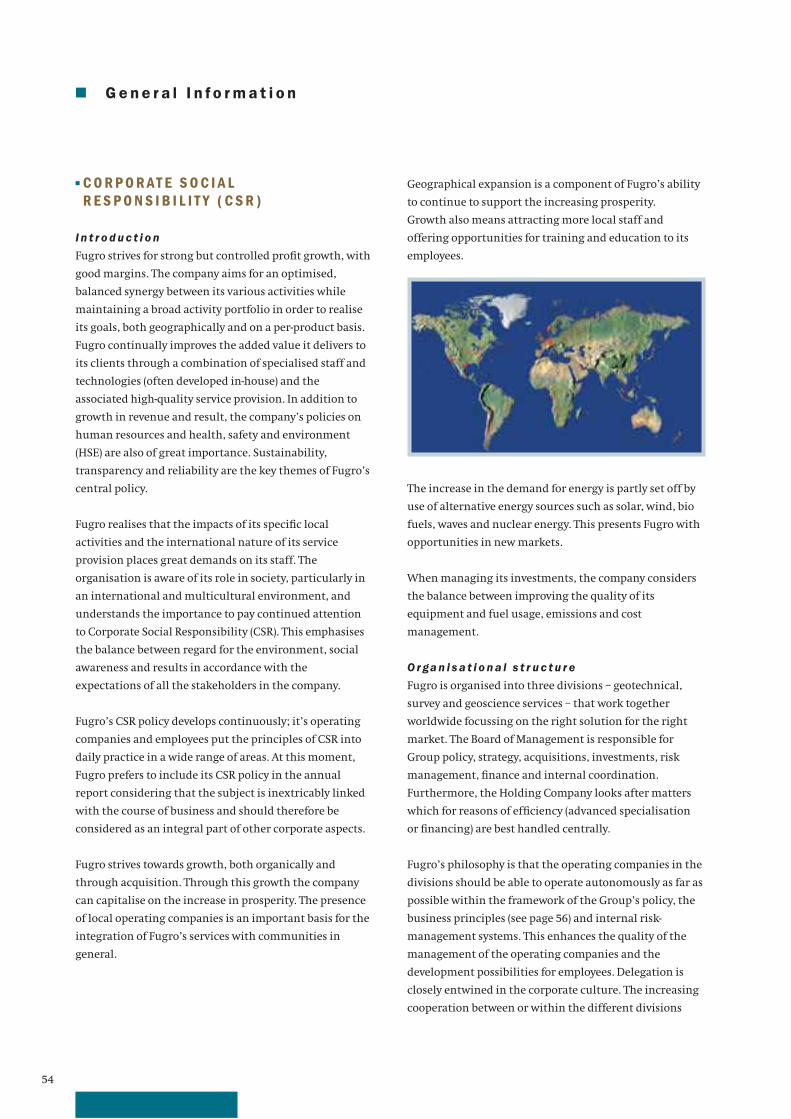
54
■ G e n e r a l I n f o r m a t i o n
■ C O R P O R AT E S O C I A L R E S P O N S I B I L I T Y ( C S R )
I n t r o d u c t i o n
Fugro strives for strong but controlled profi t growth, with
good margins. The company aims for an optimised,
balanced synergy between its various activities while
maintaining a broad activity portfolio in order to realise
its goals, both geographically and on a per-product basis.
Fugro continually improves the added value it delivers to
its clients through a combination of specialised staff and
technologies (often developed in-house) and the
associated high-quality service provision. In addition to
growth in revenue and result, the company’s policies on
human resources and health, safety and environment
(HSE) are also of great importance. Sustainability,
transparency and reliability are the key themes of Fugro’s
central policy.
Fugro realises that the impacts of its specifi c local
activities and the international nature of its service
provision places great demands on its staff. The
organisation is aware of its role in society, particularly in
an international and multicultural environment, and
understands the importance to pay continued attention
to Corporate Social Responsibility (CSR). This emphasises
the balance between regard for the environment, social
awareness and results in accordance with the
expectations of all the stakeholders in the company.
Fugro’s CSR policy develops continuously; it’s operating
companies and employees put the principles of CSR into
daily practice in a wide range of areas. At this moment,
Fugro prefers to include its CSR policy in the annual
report considering that the subject is inextricably linked
with the course of business and should therefore be
considered as an integral part of other corporate aspects.
Fugro strives towards growth, both organically and
through acquisition. Through this growth the company
can capitalise on the increase in prosperity. The presence
of local operating companies is an important basis for the
integration of Fugro’s services with communities in
general.
Geographical expansion is a component of Fugro’s ability
to continue to support the increasing prosperity.
Growth also means attracting more local staff and
offering opportunities for training and education to its
employees.
The increase in the demand for energy is partly set off by
use of alternative energy sources such as solar, wind, bio
fuels, waves and nuclear energy. This presents Fugro with
opportunities in new markets.
When managing its investments, the company considers
the balance between improving the quality of its
equipment and fuel usage, emissions and cost
management.
O r ga n i s a t i o n a l s t r u c t u r e
Fugro is organised into three divisions – geotechnical,
survey and geoscience services – that work together
worldwide focussing on the right solution for the right
market. The Board of Management is responsible for
Group policy, strategy, acquisitions, investments, risk
management, fi nance and internal coordination.
Furthermore, the Holding Company looks after matters
which for reasons of effi ciency (advanced specialisation
or fi nancing) are best handled centrally.
Fugro’s philosophy is that the operating companies in the
divisions should be able to operate autonomously as far as
possible within the framework of the Group’s policy, the
business principles (see page 56) and internal risk-
management systems. This enhances the quality of the
management of the operating companies and the
development possibilities for employees. Delegation is
closely entwined in the corporate culture. The increasing
cooperation between or within the different divisions
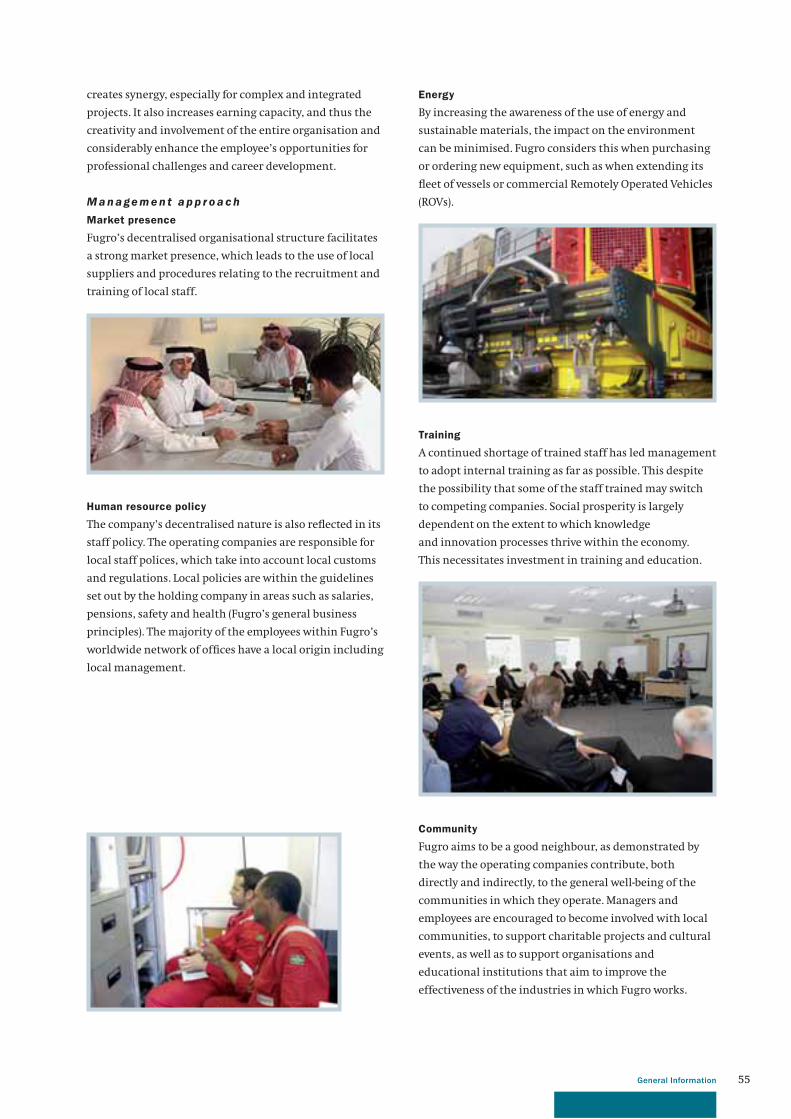
55General Information
creates synergy, especially for complex and integrated
projects. It also increases earning capacity, and thus the
creativity and involvement of the entire organisation and
considerably enhance the employee’s opportunities for
professional challenges and career development.
M a n a ge m e n t a p p r o a c h
Market presence
Fugro’s decentralised organisational structure facilitates
a strong market presence, which leads to the use of local
suppliers and procedures relating to the recruitment and
training of local staff.
Human resource policy
The company’s decentralised nature is also refl ected in its
staff policy. The operating companies are responsible for
local staff polices, which take into account local customs
and regulations. Local policies are within the guidelines
set out by the holding company in areas such as salaries,
pensions, safety and health (Fugro’s general business
principles). The majority of the employees within Fugro’s
worldwide network of offi ces have a local origin including
local management.
Energy
By increasing the awareness of the use of energy and
sustainable materials, the impact on the environment
can be minimised. Fugro considers this when purchasing
or ordering new equipment, such as when extending its
fl eet of vessels or commercial Remotely Operated Vehicles
(ROVs).
Training
A continued shortage of trained staff has led management
to adopt internal training as far as possible. This despite
the possibility that some of the staff trained may switch
to competing companies. Social prosperity is largely
dependent on the extent to which knowledge
and innovation processes thrive within the economy.
This necessitates investment in training and education.
Community
Fugro aims to be a good neighbour, as demonstrated by
the way the operating companies contribute, both
directly and indirectly, to the general well-being of the
communities in which they operate. Managers and
employees are encouraged to become involved with local
communities, to support charitable projects and cultural
events, as well as to support organisations and
educational institutions that aim to improve the
effectiveness of the industries in which Fugro works.
56
Obligations
In addition to regular, innovative research, which forms
part of its core business, Fugro is also involved with
several other related matters and social initiatives. This
includes the committee for wind power commissioned by
IRO (The Association of Dutch Suppliers in the Oil and Gas
industries) and the Eurogia cluster, an initiative to
provide a safe and long-lasting energy supply as part of
concerted efforts to create a cleaner and safer future.
Another area Fugro participates in is the research of gas
hydrates (frozen gas crystals) in deep waters. These may
develop into a potential source of energy, and the
knowledge acquired could also be used when advising on
the safety of drilling for sources of oil and gas in deep
waters.
Fugro participates in and supports higher education and
research at several universities worldwide. Employees are
actively involved through training and participation in
research consortia. In addition, Fugro employees are
active at management and committee levels of
international branch organisations.
Fugro is represented on the management of NIOZ
(Netherlands Institute for Sea Research). NIOZ’s mission is
to acquire and communicate scientifi c knowledge of the
seas and oceans to improve understanding of our planet
and ensure its long-term future. It also supports
education and research into marine sciences in the
Netherlands and Europe as a whole.
Fugro directors are on the board of institutes like
Deltares, an independent institute for applied research
and specialist advice in the development, distribution and
application of knowledge for the physical planning,
design and management of vulnerable deltas, coastal
areas and river basins in the Netherlands. Amongst
others, Fugro is also represented in the strategic advisory
board of TNO Bouw en Ondergrond (TNO Built
Environment and Geosciences- Subsurface and
Groundwater). This organisation contributes to
innovations for the government and industry.
These innovations are aimed at the sustainable design,
use and management of the build environment,
infrastructure and subsurface.
In the United States of America, Fugro representatives sit
on the advisory board of the Purdue University, as well as
on the advisory board and tutoring programme of the
Southern Methodist University, Environment and Civil
Engineering department.
Fugro’s general business
principles
Fugro works on the principle
that every employee shares
overall responsibility for the
company’s reputation. For all
staff, this means that it is not
enough to just do the right
things, but also how to do them
in the right way.
Management therefore requires all employees, at all levels
of the company, to observe the Fugro general business
principles. These rules determine the way in which
Fugro’s staff act towards one another and the market
in general. The way how Fugro conducts its business and
its attitude to its clients, partners and the environment
infl uence its productivity and success. The code of
conduct is available to all and can also be found on
Fugro’s corporate website.
Health and safety policy
Providing its employees with
a safe and healthy working
environment is one of Fugro’s
highest priorities. The vision for
the health and safety policy is
maintained by the holding
company. Fugro’s aims to create
safe and healthy working
conditions for all its employees
and subcontractors.
I n d i r e c t e c o n o m i c c o n t r i b u t i o n s
In the Netherlands, Fugro is a partner in Flood Control
2015. The innovations being brought about by this
programme ensure that the right information is available
at the right time to facilitate more-effi cient and effective
decisions during potentially dangerous fl oods. It is crucial
to get advanced warning of a calamity and to be aware of
the potential risks associated with fl ooding.
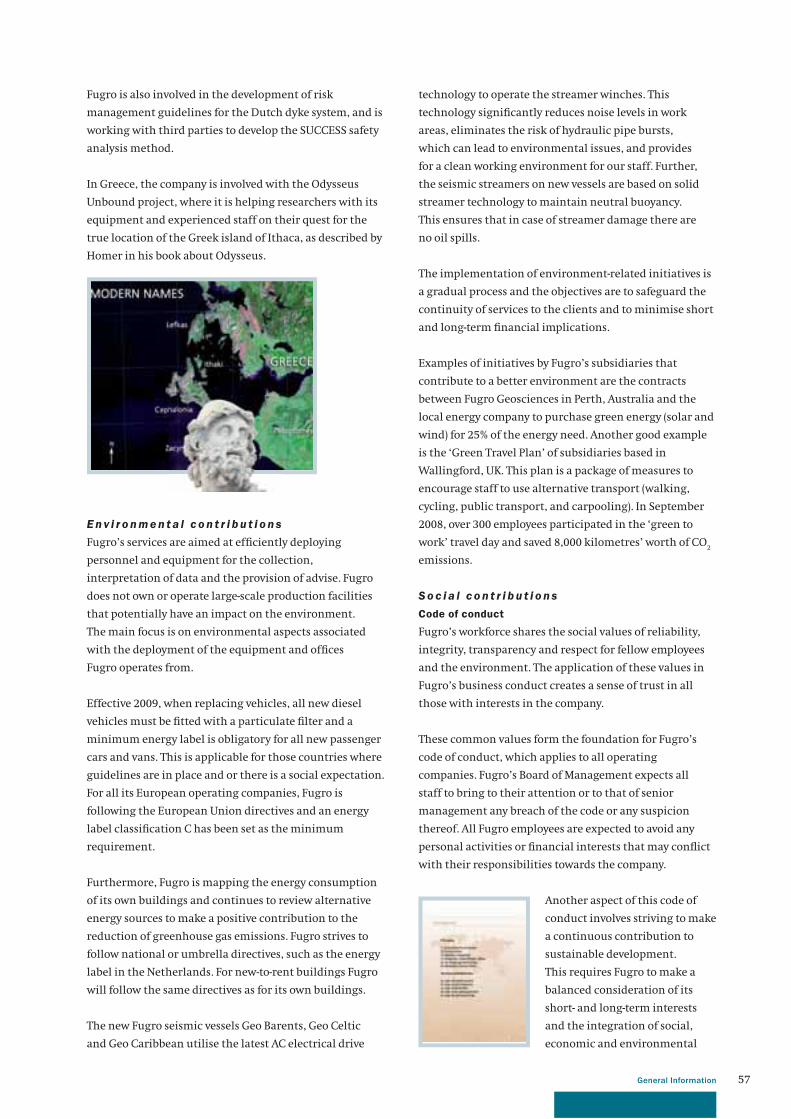
57General Information
Fugro is also involved in the development of risk
management guidelines for the Dutch dyke system, and is
working with third parties to develop the SUCCESS safety
analysis method.
In Greece, the company is involved with the Odysseus
Unbound project, where it is helping researchers with its
equipment and experienced staff on their quest for the
true location of the Greek island of Ithaca, as described by
Homer in his book about Odysseus.
E n v i r o n m e n t a l c o n t r i b u t i o n s
Fugro’s services are aimed at effi ciently deploying
personnel and equipment for the collection,
interpretation of data and the provision of advise. Fugro
does not own or operate large-scale production facilities
that potentially have an impact on the environment.
The main focus is on environmental aspects associated
with the deployment of the equipment and offi ces
Fugro operates from.
Effective 2009, when replacing vehicles, all new diesel
vehicles must be fi tted with a particulate fi lter and a
minimum energy label is obligatory for all new passenger
cars and vans. This is applicable for those countries where
guidelines are in place and or there is a social expectation.
For all its European operating companies, Fugro is
following the European Union directives and an energy
label classifi cation C has been set as the minimum
requirement.
Furthermore, Fugro is mapping the energy consumption
of its own buildings and continues to review alternative
energy sources to make a positive contribution to the
reduction of greenhouse gas emissions. Fugro strives to
follow national or umbrella directives, such as the energy
label in the Netherlands. For new-to-rent buildings Fugro
will follow the same directives as for its own buildings.
The new Fugro seismic vessels Geo Barents, Geo Celtic
and Geo Caribbean utilise the latest AC electrical drive
technology to operate the streamer winches. This
technology signifi cantly reduces noise levels in work
areas, eliminates the risk of hydraulic pipe bursts,
which can lead to environmental issues, and provides
for a clean working environment for our staff. Further,
the seismic streamers on new vessels are based on solid
streamer technology to maintain neutral buoyancy.
This ensures that in case of streamer damage there are
no oil spills.
The implementation of environment-related initiatives is
a gradual process and the objectives are to safeguard the
continuity of services to the clients and to minimise short
and long-term fi nancial implications.
Examples of initiatives by Fugro’s subsidiaries that
contribute to a better environment are the contracts
between Fugro Geosciences in Perth, Australia and the
local energy company to purchase green energy (solar and
wind) for 25% of the energy need. Another good example
is the ‘Green Travel Plan’ of subsidiaries based in
Wallingford, UK. This plan is a package of measures to
encourage staff to use alternative transport (walking,
cycling, public transport, and carpooling). In September
2008, over 300 employees participated in the ‘green to
work’ travel day and saved 8,000 kilometres’ worth of CO2
emissions.
S o c i a l c o n t r i b u t i o n s
Code of conduct
Fugro’s workforce shares the social values of reliability,
integrity, transparency and respect for fellow employees
and the environment. The application of these values in
Fugro’s business conduct creates a sense of trust in all
those with interests in the company.
These common values form the foundation for Fugro’s
code of conduct, which applies to all operating
companies. Fugro’s Board of Management expects all
staff to bring to their attention or to that of senior
management any breach of the code or any suspicion
thereof. All Fugro employees are expected to avoid any
personal activities or fi nancial interests that may confl ict
with their responsibilities towards the company.
Another aspect of this code of
conduct involves striving to make
a continuous contribution to
sustainable development.
This requires Fugro to make a
balanced consideration of its
short- and long-term interests
and the integration of social,
economic and environmental
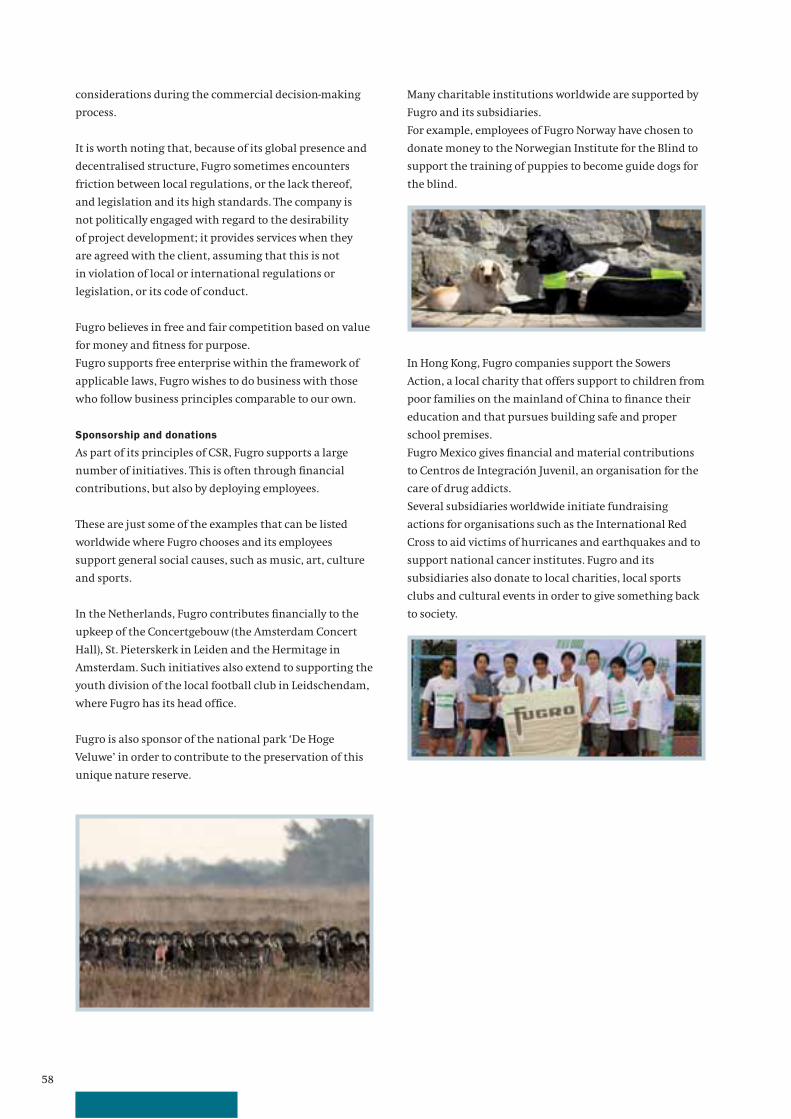
58
considerations during the commercial decision-making
process.
It is worth noting that, because of its global presence and
decentralised structure, Fugro sometimes encounters
friction between local regulations, or the lack thereof,
and legislation and its high standards. The company is
not politically engaged with regard to the desirability
of project development; it provides services when they
are agreed with the client, assuming that this is not
in violation of local or international regulations or
legislation, or its code of conduct.
Fugro believes in free and fair competition based on value
for money and fi tness for purpose.
Fugro supports free enterprise within the framework of
applicable laws, Fugro wishes to do business with those
who follow business principles comparable to our own.
Sponsorship and donations
As part of its principles of CSR, Fugro supports a large
number of initiatives. This is often through fi nancial
contributions, but also by deploying employees.
These are just some of the examples that can be listed
worldwide where Fugro chooses and its employees
support general social causes, such as music, art, culture
and sports.
In the Netherlands, Fugro contributes fi nancially to the
upkeep of the Concertgebouw (the Amsterdam Concert
Hall), St. Pieterskerk in Leiden and the Hermitage in
Amsterdam. Such initiatives also extend to supporting the
youth division of the local football club in Leidschendam,
where Fugro has its head offi ce.
Fugro is also sponsor of the national park ‘De Hoge
Veluwe’ in order to contribute to the preservation of this
unique nature reserve.
Many charitable institutions worldwide are supported by
Fugro and its subsidiaries.
For example, employees of Fugro Norway have chosen to
donate money to the Norwegian Institute for the Blind to
support the training of puppies to become guide dogs for
the blind.
In Hong Kong, Fugro companies support the Sowers
Action, a local charity that offers support to children from
poor families on the mainland of China to fi nance their
education and that pursues building safe and proper
school premises.
Fugro Mexico gives fi nancial and material contributions
to Centros de Integración Juvenil, an organisation for the
care of drug addicts.
Several subsidiaries worldwide initiate fundraising
actions for organisations such as the International Red
Cross to aid victims of hurricanes and earthquakes and to
support national cancer institutes. Fugro and its
subsidiaries also donate to local charities, local sports
clubs and cultural events in order to give something back
to society.
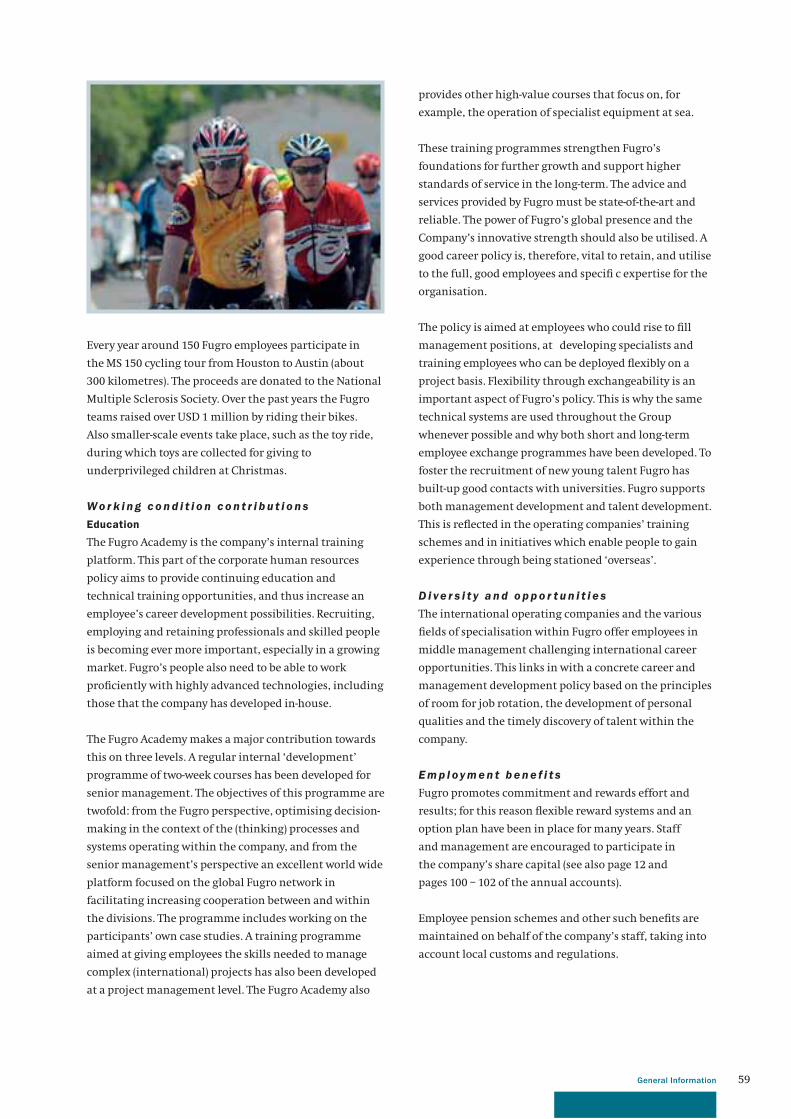
59General Information
Every year around 150 Fugro employees participate in
the MS 150 cycling tour from Houston to Austin (about
300 kilometres). The proceeds are donated to the National
Multiple Sclerosis Society. Over the past years the Fugro
teams raised over USD 1 million by riding their bikes.
Also smaller-scale events take place, such as the toy ride,
during which toys are collected for giving to
underprivileged children at Christmas.
Wo r k i n g c o n d i t i o n c o n t r i b u t i o n s
Education
The Fugro Academy is the company’s internal training
platform. This part of the corporate human resources
policy aims to provide continuing education and
technical training opportunities, and thus increase an
employee’s career development possibilities. Recruiting,
employing and retaining professionals and skilled people
is becoming ever more important, especially in a growing
market. Fugro’s people also need to be able to work
profi ciently with highly advanced technologies, including
those that the company has developed in-house.
The Fugro Academy makes a major contribution towards
this on three levels. A regular internal ‘development’
programme of two-week courses has been developed for
senior management. The objectives of this programme are
twofold: from the Fugro perspective, optimising decision-
making in the context of the (thinking) processes and
systems operating within the company, and from the
senior management’s perspective an excellent world wide
platform focused on the global Fugro network in
facilitating increasing cooperation between and within
the divisions. The programme includes working on the
participants’ own case studies. A training programme
aimed at giving employees the skills needed to manage
complex (international) projects has also been developed
at a project management level. The Fugro Academy also
provides other high-value courses that focus on, for
example, the operation of specialist equipment at sea.
These training programmes strengthen Fugro’s
foundations for further growth and support higher
standards of service in the long-term. The advice and
services provided by Fugro must be state-of-the-art and
reliable. The power of Fugro’s global presence and the
Company’s innovative strength should also be utilised. A
good career policy is, therefore, vital to retain, and utilise
to the full, good employees and specifi c expertise for the
organisation.
The policy is aimed at employees who could rise to fi ll
management positions, at developing specialists and
training employees who can be deployed fl exibly on a
project basis. Flexibility through exchangeability is an
important aspect of Fugro’s policy. This is why the same
technical systems are used throughout the Group
whenever possible and why both short and long-term
employee exchange programmes have been developed. To
foster the recruitment of new young talent Fugro has
built-up good contacts with universities. Fugro supports
both management development and talent development.
This is refl ected in the operating companies’ training
schemes and in initiatives which enable people to gain
experience through being stationed ‘overseas’.
D i ve r s i t y a n d o p p o r t u n i t i e s
The international operating companies and the various
fi elds of specialisation within Fugro offer employees in
middle management challenging international career
opportunities. This links in with a concrete career and
management development policy based on the principles
of room for job rotation, the development of personal
qualities and the timely discovery of talent within the
company.
E m p l oy m e n t b e n e f i t s
Fugro promotes commitment and rewards effort and
results; for this reason fl exible reward systems and an
option plan have been in place for many years. Staff
and management are encouraged to participate in
the company’s share capital (see also page 12 and
pages 100 – 102 of the annual accounts).
Employee pension schemes and other such benefi ts are
maintained on behalf of the company’s staff, taking into
account local customs and regulations.
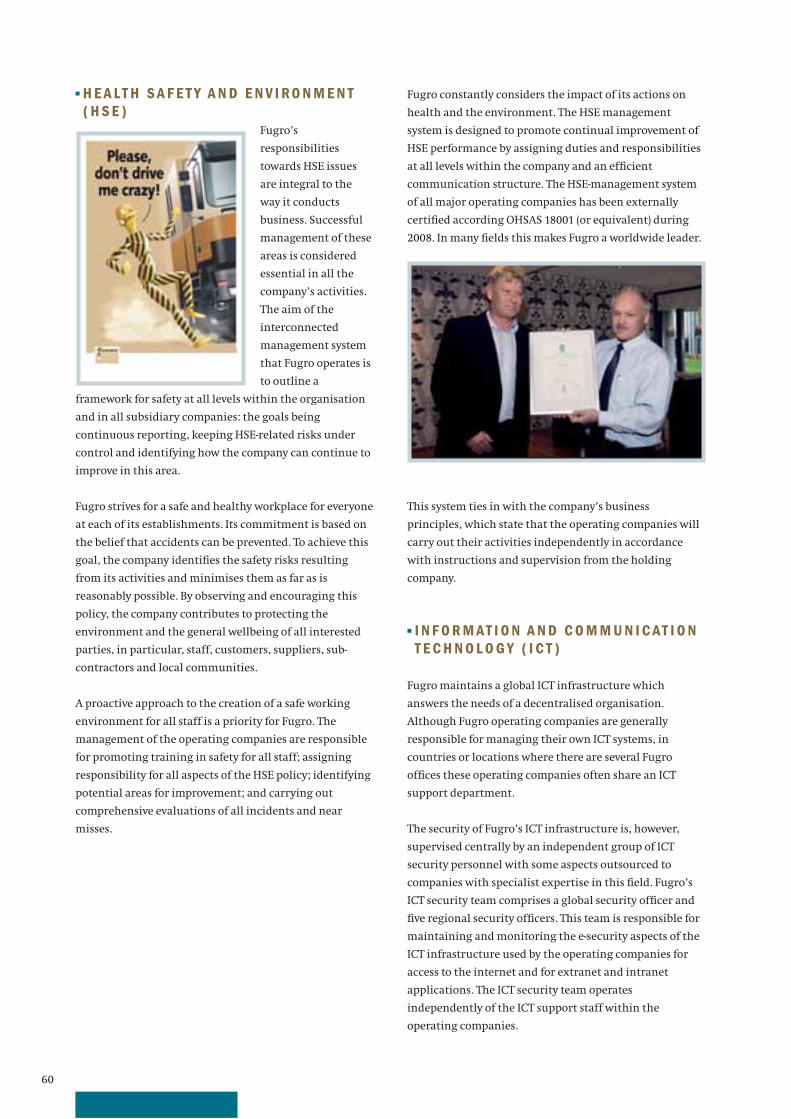
60
■ H E A LT H S A F E T Y A N D E N V I RO N M E N T ( H S E )
Fugro’s
responsibilities
towards HSE issues
are integral to the
way it conducts
business. Successful
management of these
areas is considered
essential in all the
company’s activities.
The aim of the
interconnected
management system
that Fugro operates is
to outline a
framework for safety at all levels within the organisation
and in all subsidiary companies: the goals being
continuous reporting, keeping HSE-related risks under
control and identifying how the company can continue to
improve in this area.
Fugro strives for a safe and healthy workplace for everyone
at each of its establishments. Its commitment is based on
the belief that accidents can be prevented. To achieve this
goal, the company identifi es the safety risks resulting
from its activities and minimises them as far as is
reasonably possible. By observing and encouraging this
policy, the company contributes to protecting the
environment and the general wellbeing of all interested
parties, in particular, staff, customers, suppliers, sub-
contractors and local communities.
A proactive approach to the creation of a safe working
environment for all staff is a priority for Fugro. The
management of the operating companies are responsible
for promoting training in safety for all staff; assigning
responsibility for all aspects of the HSE policy; identifying
potential areas for improvement; and carrying out
comprehensive evaluations of all incidents and near
misses.
Fugro constantly considers the impact of its actions on
health and the environment. The HSE management
system is designed to promote continual improvement of
HSE performance by assigning duties and responsibilities
at all levels within the company and an effi cient
communication structure. The HSE-management system
of all major operating companies has been externally
certifi ed according OHSAS 18001 (or equivalent) during
2008. In many fi elds this makes Fugro a worldwide leader.
This system ties in with the company’s business
principles, which state that the operating companies will
carry out their activities independently in accordance
with instructions and supervision from the holding
company.
■ I N F O R M AT I O N A N D C O M M U N I C AT I O N T E C H N O L O G Y ( I C T )
Fugro maintains a global ICT infrastructure which
answers the needs of a decentralised organisation.
Although Fugro operating companies are generally
responsible for managing their own ICT systems, in
countries or locations where there are several Fugro
offi ces these operating companies often share an ICT
support department.
The security of Fugro’s ICT infrastructure is, however,
supervised centrally by an independent group of ICT
security personnel with some aspects outsourced to
companies with specialist expertise in this fi eld. Fugro’s
ICT security team comprises a global security offi cer and
fi ve regional security offi cers. This team is responsible for
maintaining and monitoring the e-security aspects of the
ICT infrastructure used by the operating companies for
access to the internet and for extranet and intranet
applications. The ICT security team operates
independently of the ICT support staff within the
operating companies.
61General Information
■ R E S E A R C H
Fugro’s services provision, and thus its global market
positions, are, to a great extent, dependent on high-value
equipment, technologies and software. Technological
research and innovative developments play a key role in
this. Measurements are becoming more and more
detailed and even the most complex data can be
interpreted. Very often developments take place in close
cooperation with the client because the client is
interested in solving a specifi c problem. To this end, more
and more knowledge is exchanged or combined within
the company in order to arrive at solutions or new
developments.
■ R I S K M A N A G E M E N T
G e n e r a l
Fugro’s risk management policy is aimed at the long-term
sustainable management of its business activities and the
limiting or, where meaningful, hedging of the risks. Due
to the wide diversity of markets, clients and regions and
its broad portfolio of activities, quantifying all the
existing risks relevant to the Group as a whole is virtually
impossible. Risks are, however, quantifi ed wherever
possible and useful. This applies in particular to the
infl uence of the US dollar and the British pound.
See pages 24 and 25.
Strengths
• Consistent execution of strategy
• A good market position in many niche markets
worldwide
• Professional employees who receive continuous
additional training
• High-quality technology and services provision
• Well functioning fi nancial systems and risk
management systems
• Cooperation between business units
• Healthy fi nancial position
Weaknesses
• Sensitivity to rapid, sharp fl uctuations in the US dollar,
Norwegian kroner and the British pound exchange
rate
• Much of the revenue depends on investment by the oil
and gas industry
Opportunities
• Increased investment by the oil and gas industry,
amongst others related to depletion of existing fi elds
• Increasing demand for oil and gas as soon as the world
economy recovers
• Optimisation of existing oil and gas fi elds
• More and larger infrastructure projects, including
coastline protection
• Mining activities as soon as the demand for minerals
recovers
• Upcoming markets such as India, China, Brazil, Russia
and Eastern European countries
Threats
• Prolonged global economic and fi nancial crisis
• Continuing low oil price
• Collapse of the demand for oil, gas and/or minerals
• Political instability in countries and/or regions
important for Fugro
• Payment risk of clients with high fi nancing costs
• Pressure on prices by clients
F u g r o ’s l o n g - t e r m r i s k s a r e l i m i t e d d u e t o :
• The diversity of activities in more than one
international market segment;
• No clients with contracts accounting for more
than some 4% of Fugro’s total annual revenue;
• Proprietary, modern technologies (mostly
developed in-house) and professional
employees;
• The ability to adjust quickly to exchange rate
and price changes due to mostly short contracts;
• Geographical spread of the activities;
• A balanced and fl exible fl eet composition (Fugro
owned and chartered);
• Current liabilities (EUR 725 million) amount to
34% of the balance sheet total;
• Very limited risk related to pension obligations;
• Good internal risk management and control
systems;
• Some of the (manpower) capacity being hired-in
on a fl exible basis, among which free lance staff.
62
11%
46%
29%
14%
USD related
USD
GBP
EUR and other
B r e a k d ow n r e ve n u e p e r
c u r r e n c y (for the year 2008)
Oil and gas
Construction/infrastructure
Mining
Other
6%
75%
4%
15%
B r e a k d ow n r e ve n u e p e r
s e c t o r (for the year 2008)
O p e r a t i o n a l
Activity portfolio
Although the core activities show a high degree of
cohesion, they also target highly diverse markets, clients
and regions. A high proportion of the activities is related
to the oil and gas market. Fugro’s dependence on the
more cyclic investment in oil and gas exploration will be
reduced in favour of the more stable investments in oil
and gas production. The other activities are dependent on
developments in markets that include infrastructure,
construction and mining.
The infl uence of positive and negative conjunctural
effects is moderated by:
• the cohesion between the activities;
• the good geographical spread;
• the diversity of clients;
• strong market positions, and
• the size of the Group.
Contract flow and price changes
Some of Fugro’s contracts are awarded on the basis of
long-term preferred supplier agreements. Having a large
number of clients supports Fugro’s independence and
improves its stability. In the course of a year Fugro often
carries out a large number of projects for the same client.
The projects carried out for any single client do not,
however, account for more than around 4% of the total
annual revenue.
To carry out its projects Fugro has at its disposal highly
trained employees and technically advanced, and
therefore expensive, equipment. Much of Fugro’s work
involves short-term contracts. Fugro is, to a degree,
sensitive to price changes and sudden changes in
exchange rates, to which the Company can, however,
adapt quickly. Fugro’s budgets are, to a great extent, based
on the expected investments by the oil and gas companies.
Unless there is a structural drop in the oil price to less
than USD 30 – 35 per barrel, it is not anticipated that
substantial (up or down) fl uctuations in oil prices will lead
to a rapid change in these investments.
Capacity planning
Fugro is constantly alert for signals that indicate changes
in market conditions so it can react quickly and
appropriately. Sudden and unexpected changes in market
conditions are, however, always possible. Some of Fugro’s
survey activities can precede investment by clients and
generally take place at the start of activities or investment-
cycles of clients. This means Fugro’s activities can be
the fi rst to be affected by changes in market conditions.
Postponement and interruption to the fl ow of orders
can lead to temporary losses due to under-utilisation
of capacity.
The weather and the availability of vessels are key factors
for offshore activities in particular. Weather infl uences
are calculated into the budgets and are averaged out over
the year and the regions in which Fugro is active. As far as
vessels are concerned, Fugro’s objective is a balanced fl eet
in which around 45% of the vessels are Company owned
and around 40% are on mid-term or long-term charter
basis. Some vessels (approximately 15% of the fl eet) are
chartered on a project basis. The fact that Fugro is
deploying heavy and specialist equipment does mean that
the risk of capacity under-utilisation will increase. At the
same time, the exchange of manpower and equipment
between the various business units can increase capacity
utilisation.
Part of staff has been appointed on a temporary basis or
work on a freelance basis, providing Fugro a certain
fl exibility to respond to variations in manpower.
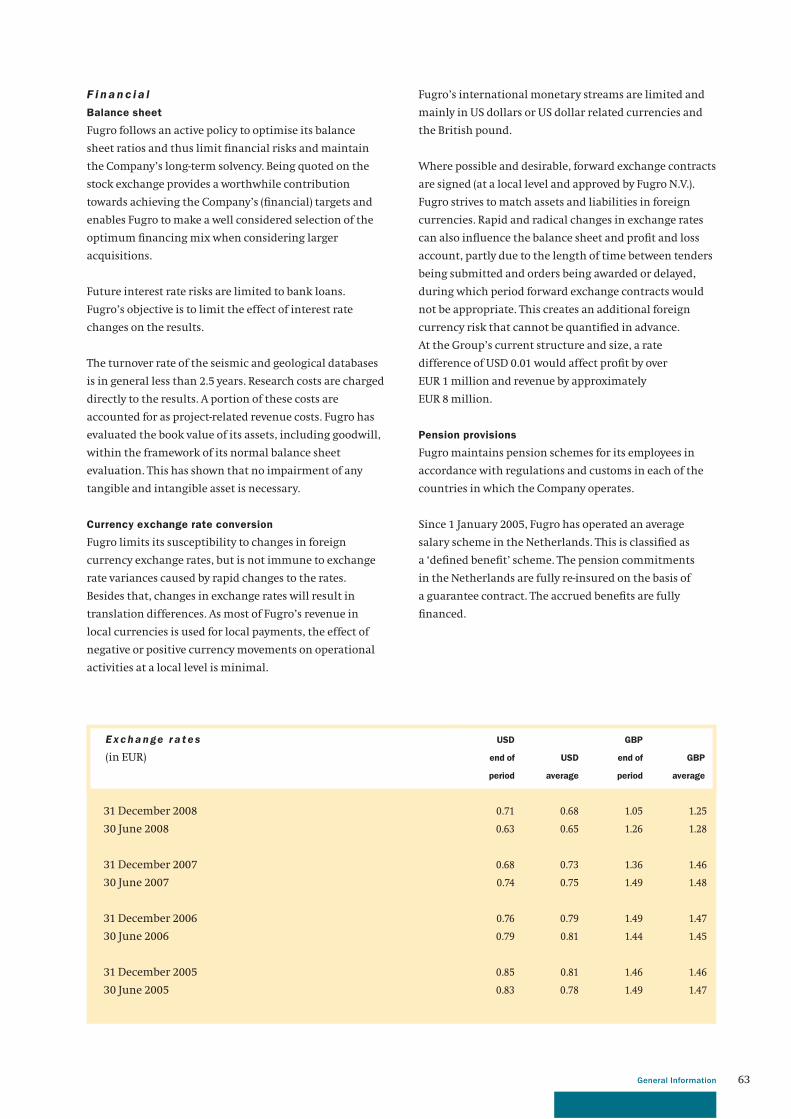
63General Information
E x c h a n ge r a t e s
(in EUR)
USD
end of
period
USD
average
GBP
end of
period
GBP
average
31 December 2008 0.71 0.68 1.05 1.25
30 June 2008 0.63 0.65 1.26 1.28
31 December 2007 0.68 0.73 1.36 1.46
30 June 2007 0.74 0.75 1.49 1.48
31 December 2006 0.76 0.79 1.49 1.47
30 June 2006 0.79 0.81 1.44 1.45
31 December 2005 0.85 0.81 1.46 1.46
30 June 2005 0.83 0.78 1.49 1.47
F i n a n c i a l
Balance sheet
Fugro follows an active policy to optimise its balance
sheet ratios and thus limit fi nancial risks and maintain
the Company’s long-term solvency. Being quoted on the
stock exchange provides a worthwhile contribution
towards achieving the Company’s (fi nancial) targets and
enables Fugro to make a well considered selection of the
optimum fi nancing mix when considering larger
acquisitions.
Future interest rate risks are limited to bank loans.
Fugro’s objective is to limit the effect of interest rate
changes on the results.
The turnover rate of the seismic and geological databases
is in general less than 2.5 years. Research costs are charged
directly to the results. A portion of these costs are
accounted for as project-related revenue costs. Fugro has
evaluated the book value of its assets, including goodwill,
within the framework of its normal balance sheet
evaluation. This has shown that no impairment of any
tangible and intangible asset is necessary.
Currency exchange rate conversion
Fugro limits its susceptibility to changes in foreign
currency exchange rates, but is not immune to exchange
rate variances caused by rapid changes to the rates.
Besides that, changes in exchange rates will result in
translation differences. As most of Fugro’s revenue in
local currencies is used for local payments, the effect of
negative or positive currency movements on operational
activities at a local level is minimal.
Fugro’s international monetary streams are limited and
mainly in US dollars or US dollar related currencies and
the British pound.
Where possible and desirable, forward exchange contracts
are signed (at a local level and approved by Fugro N.V.).
Fugro strives to match assets and liabilities in foreign
currencies. Rapid and radical changes in exchange rates
can also infl uence the balance sheet and profi t and loss
account, partly due to the length of time between tenders
being submitted and orders being awarded or delayed,
during which period forward exchange contracts would
not be appropriate. This creates an additional foreign
currency risk that cannot be quantifi ed in advance.
At the Group’s current structure and size, a rate
difference of USD 0.01 would affect profi t by over
EUR 1 million and revenue by approximately
EUR 8 million.
Pension provisions
Fugro maintains pension schemes for its employees in
accordance with regulations and customs in each of the
countries in which the Company operates.
Since 1 January 2005, Fugro has operated an average
salary scheme in the Netherlands. This is classifi ed as
a ‘defi ned benefi t’ scheme. The pension commitments
in the Netherlands are fully re-insured on the basis of
a guarantee contract. The accrued benefi ts are fully
fi nanced.
64
In the United States Fugro has a 401K system for its
employees. Fugro contributes towards the deposits of its
employees in accordance with agreed rules and taking the
regulations of the IRS, the American tax authority, into
account. This system is free of risk for Fugro.
In the United Kingdom Fugro operates a number of
pension schemes. All the schemes available to new
employees are defi ned contribution schemes. There is one
defi ned benefi t scheme open for long-serving employees
and there are other defi ned benefi t schemes which have
been closed but which have on-going obligations to their
members. Measures have been taken to ensure these
obligations can be paid when required.
In the other countries where Fugro has organised
retirement provisions for its employees, obligations
arising from these provisions are covered by items
recognised in the balance sheet of the relevant operating
company.
Insurance and legal risks
Fugro is insured against a number of risks. Risks related to
professional indemnity and general liability are covered
at a Group level. Equipment is insured locally and local
cover is arranged for risks associated with normal
business operations, such as insurance for the vehicle
fl eet, the buildings and for employees.
Several operating companies are involved in claims, either
as the claimant or the defendant, within the context of
normal business operations. Where necessary proper
provisions have been accounted for in the annual
accounts. Based on developments thus far, it is not
anticipated that Fugro’s fi nancial position will be
noticeably affected by any of these proceedings.
With regard to items included in the annual report
adjustments to estimates are possible.
I n t e r n a l s y s t e m s
Due to the generally short-term nature of its assignments,
constant monitoring of its markets and its operating and
fi nancial results is intrinsic to Fugro’s modus operandi.
Clarity and transparency are an absolute must for
assessing and evaluating risks. These are fundamental
characteristics of the Fugro culture. Due to the wide
variety of markets, clients and regions and Fugro’s
extensive activity portfolio, the managements of the
operating companies are responsible for the application
and monitoring of and compliance with the internal
control systems.
The monitoring systems consist of the internal control
framework described below.
Corporate Handbook
Fugro’s Corporate Handbook contains precise instructions
regarding many aspects, including risk management.
This Handbook is handed out to the senior management
members responsible for further application within the
operating companies.
Financial Handbook
This contains detailed guidelines for the fi nancial
reporting. The Financial Handbook is put at the disposal
of the senior management and of the controllers of all
operating companies and the Holding Company.
Insurance handbook
This contains detailed guidelines with respect to risks to
be insured. This manual is put at the disposal of managers
of subsidiaries and employees that are responsible for
insurances at the subsidiaries.
Manual for project management
This document contains the guidelines for the procedures
to be followed in project preparation and execution. This
manual is used by project managers.
Planning
The business plans of every Fugro unit are translated into
budgets. Adherence to the budgets is checked on a
quarterly basis. Any unforeseen circumstances that arise,
or any substantial deviation from the budgets, must be
reported immediately by the operating company
managements to the relevant responsible Executive
Committee member and to the Board of Management.
The monthly reports the operational management
submits to the Holding Company include an analysis of
the achievement of the approved plans.
Authorisation level
Managers are bound by clear restrictions regarding
representative authorisation. Projects and contracts with
a value or risk that exceeds a specifi ed amount must be
approved by either regional managers or the appropriate
member of the Executive Committee or Board of
Management.
65General Information
Letter of representation
Every six months all managers and controllers of
operating companies and the responsible member of the
Executive Committee sign a detailed statement regarding
the fi nancial reporting and internal control.
Internal Audit
The Holding Company carries out regular and frequent
internal audits of the various operating companies.
The fi ndings are reported directly to the Board of
Management and the Executive Committee.
Peer reviews
‘Peer reviews’ are also carried out on a regular basis.
A peer review involves an inspection of an operating
company by a team from other operating companies.
The results are reported directly to the Board of
Management and the Executive Committee.
Audit Committee
The Audit Committee, which comprises three members of
the Supervisory Board, ensures an independent
monitoring of the risk management process from the
perspective of its supervisory role. The Audit Committee
focuses on the quality of the internal and external
reporting, the effectiveness of the internal audits and the
functioning of the external accountants.
External audit
The annual accounts of Fugro N.V. and subsidiaries are
audited annually by external auditors. These audits take
place on the basis of generally accepted auditing
standards.
Advisory roles
The external auditor does not act in an advisory
capacity except where due diligence projects and
activities relating to the annual accounts are concerned.
Professional advice is provided by third party experts,
such as tax consultants and insurance advisors.
Safety
Subsidiaries are externally certifi ed in accordance with
the OHSAS 18001 standard. Compliance audit is done by
internal specialists and by external agencies when
re-certifi cation has to take place.
Whistle-blower’s regulation
Fugro operates a ‘whistle-blower’s charter’ to ensure that
any possible infringement of the Group’s policy and
procedures can be reported without this act of submitting
such a report having any adverse consequences for the
‘whistle-blower’.
D e c l a r a t i o n
The Board of Management believes that the internal risk
management and control systems described above provide
a reasonable level of assurance that the fi nancial
statements do not contain any material misstatements
and that these systems operated properly during the year
under review. The Board of Management has no
indication that these systems will not operate properly
during the current year.
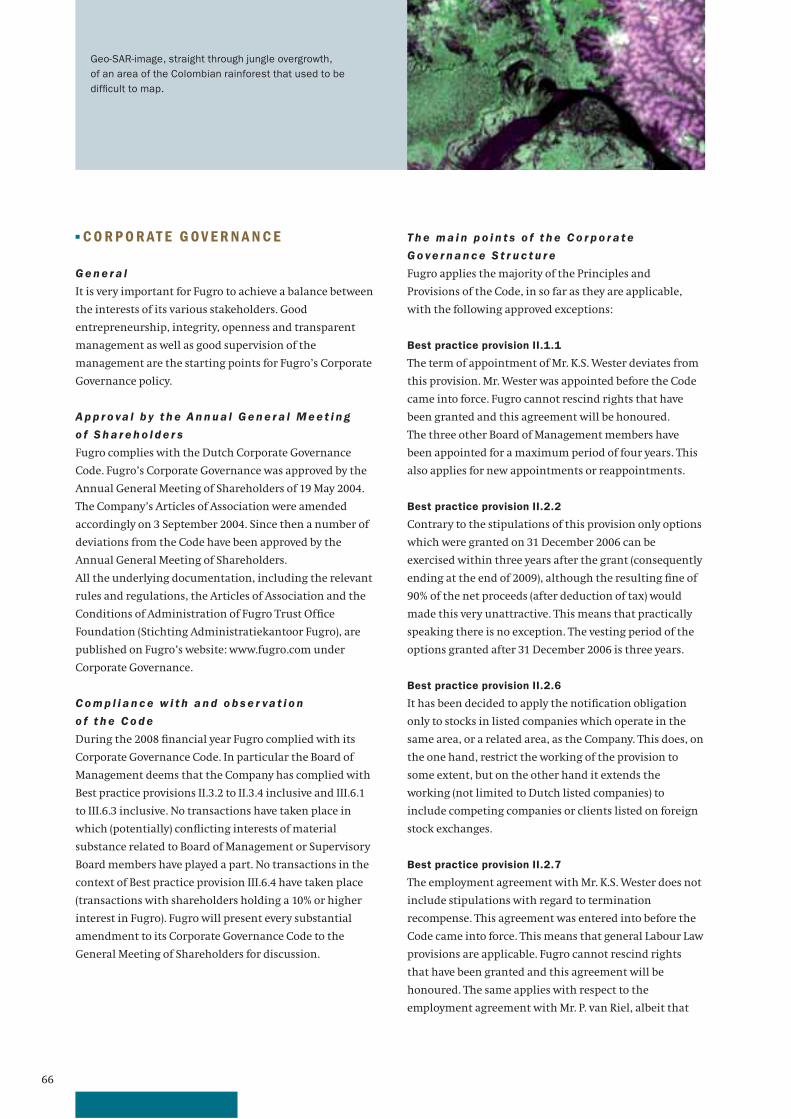
66
Geo-SAR-image, straight through jungle overgrowth,
of an area of the Colombian rainforest that used to be
diffi cult to map.
■ C O R P O R AT E G OV E R N A N C E
G e n e r a l
It is very important for Fugro to achieve a balance between
the interests of its various stakeholders. Good
entrepreneurship, integrity, openness and transparent
management as well as good supervision of the
management are the starting points for Fugro’s Corporate
Governance policy.
A p p r o va l b y t h e A n n u a l G e n e r a l M e e t i n g
o f S h a r e h o l d e r s
Fugro complies with the Dutch Corporate Governance
Code. Fugro’s Corporate Governance was approved by the
Annual General Meeting of Shareholders of 19 May 2004.
The Company’s Articles of Association were amended
accordingly on 3 September 2004. Since then a number of
deviations from the Code have been approved by the
Annual General Meeting of Shareholders.
All the underlying documentation, including the relevant
rules and regulations, the Articles of Association and the
Conditions of Administration of Fugro Trust Offi ce
Foundation (Stichting Administratiekantoor Fugro), are
published on Fugro’s website: www.fugro.com under
Corporate Governance.
C o m p l i a n c e w i t h a n d o b s e r va t i o n
o f t h e C o d e
During the 2008 fi nancial year Fugro complied with its
Corporate Governance Code. In particular the Board of
Management deems that the Company has complied with
Best practice provisions II.3.2 to II.3.4 inclusive and III.6.1
to III.6.3 inclusive. No transactions have taken place in
which (potentially) confl icting interests of material
substance related to Board of Management or Supervisory
Board members have played a part. No transactions in the
context of Best practice provision III.6.4 have taken place
(transactions with shareholders holding a 10% or higher
interest in Fugro). Fugro will present every substantial
amendment to its Corporate Governance Code to the
General Meeting of Shareholders for discussion.
T h e m a i n p o i n t s o f t h e C o r p o r a t e
G o ve r n a n c e S t r u c t u r e
Fugro applies the majority of the Principles and
Provisions of the Code, in so far as they are applicable,
with the following approved exceptions:
Best practice provision II.1.1
The term of appointment of Mr. K.S. Wester deviates from
this provision. Mr. Wester was appointed before the Code
came into force. Fugro cannot rescind rights that have
been granted and this agreement will be honoured.
The three other Board of Management members have
been appointed for a maximum period of four years. This
also applies for new appointments or reappointments.
Best practice provision II.2.2
Contrary to the stipulations of this provision only options
which were granted on 31 December 2006 can be
exercised within three years after the grant (consequently
ending at the end of 2009), although the resulting fi ne of
90% of the net proceeds (after deduction of tax) would
made this very unattractive. This means that practically
speaking there is no exception. The vesting period of the
options granted after 31 December 2006 is three years.
Best practice provision II.2.6
It has been decided to apply the notifi cation obligation
only to stocks in listed companies which operate in the
same area, or a related area, as the Company. This does, on
the one hand, restrict the working of the provision to
some extent, but on the other hand it extends the
working (not limited to Dutch listed companies) to
include competing companies or clients listed on foreign
stock exchanges.
Best practice provision II.2.7
The employment agreement with Mr. K.S. Wester does not
include stipulations with regard to termination
recompense. This agreement was entered into before the
Code came into force. This means that general Labour Law
provisions are applicable. Fugro cannot rescind rights
that have been granted and this agreement will be
honoured. The same applies with respect to the
employment agreement with Mr. P. van Riel, albeit that
67General Information
the termination recompose is limited to two times the
annual salary. The Code will be applied when (re)
appointing members of the Board of Management.
Best practice provision III.3.5
The term of the appointment of Mr. F.H. Schreve does not
comply with the condition laid down in this provision
because he has served as a Supervisory Board member for
longer than twelve years. He was reappointed as chairman
of the Supervisory Board by the Annual General Meeting
of Shareholders in 2006.
His reappointment was deemed to be very important at
that time for a number of reasons including ensuring the
desired continuity in the composition of the Supervisory
Board. The term of his appointment comes to an end in
2010.
Principle III.5 and best practice provision III.5.11
On 19 May 2005 the Remuneration Committee and the
Nomination Committee were, with the approval of the
Annual General Meeting of Shareholders, amalgamated
into one committee that carries out the tasks in both
areas. The reason for the amalgamation was that separate
Remuneration and Nomination Committees (with
separate meetings) had proven impractical due to the fact
that the Supervisory Board is small and three of its
members are not resident in the Netherlands.
As from 1 July 2008 Mr. F.H. Schreve fi lls the chairmanship
of this committee. Partly this does not comply with the
condition that the chairmanship of the Remuneration
Committee (but there is no separate remuneration
committee) is not fi lled by the chairman of the
supervisory board.
Principle IV.2
Maintaining its operational independence is crucial for
Fugro (see page 69 for the reasons). One of the ways to
safeguard this independence is share certifi cation. The
issuing of certifi cates of shares is, therefore, considered by
Fugro to be a necessary protective measure. When the
Fugro Trust Offi ce Foundation exercises its voting rights
the criteria used will, therefore, be that the interests of
Fugro, its associated companies and all others involved
are safeguarded in the best possible way.
Best practice provision IV.2.1
In accordance with this provision the Board of the Fugro
Trust Offi ce Foundation enjoys the confi dence of the
certifi cate holders and operates independently of Fugro.
One deviation from this provision is that the Conditions
of Administration of the Fugro Trust Offi ce do not
stipulate the instances in which and the conditions under
which certifi cate holders may ask the Fugro Trust Offi ce
to convene a meeting, excepting in respect of the
recommendation rights regarding the nomination of a
member of the Board of the Fugro Trust Offi ce (see the
explanation of Best practice provision IV.2.2).
Best practice provision IV.2.2
The Board of the Fugro Trust Offi ce has decided that
certifi cate holders representing at least 15% of the issued
share capital in the form of certifi cates may request that a
meeting of certifi cate holders is convened in order to
make a recommendation regarding the nomination of a
member of the Board of the Fugro Trust Offi ce.
Best practice provision IV.2.8
The Fugro Trust Offi ce’s regulations include a provision
regarding the granting of a proxy to exercise the right to
vote to holders of certifi cates. The proxy may, however, be
limited, excluded or recalled in the instances stated in the
Conditions of Administration of the Fugro Trust Offi ce.
This is in accordance with the legal regulation that came
into force on 1 October 2004 (Article 2:118a, sub 2 Dutch
Civil Code).
N e w C o r p o r a t e G o ve r n a n c e C o d e
On 10 December 2008 the Monitoring Committee
Corporate Governance (committee-Frijns) has presented
the updated Corporate Governance Code. This adjusted
Code will become effective for Fugro per 1 January 2009,
after the legislator has designated it by decree as the new
Corporate Governance Code as defi ned by law. The new
Code will have minimal or no consequences for Fugro’s
Corporate Governance structure. Fugro will report based
on this new Code in its Annual Report of 2009.
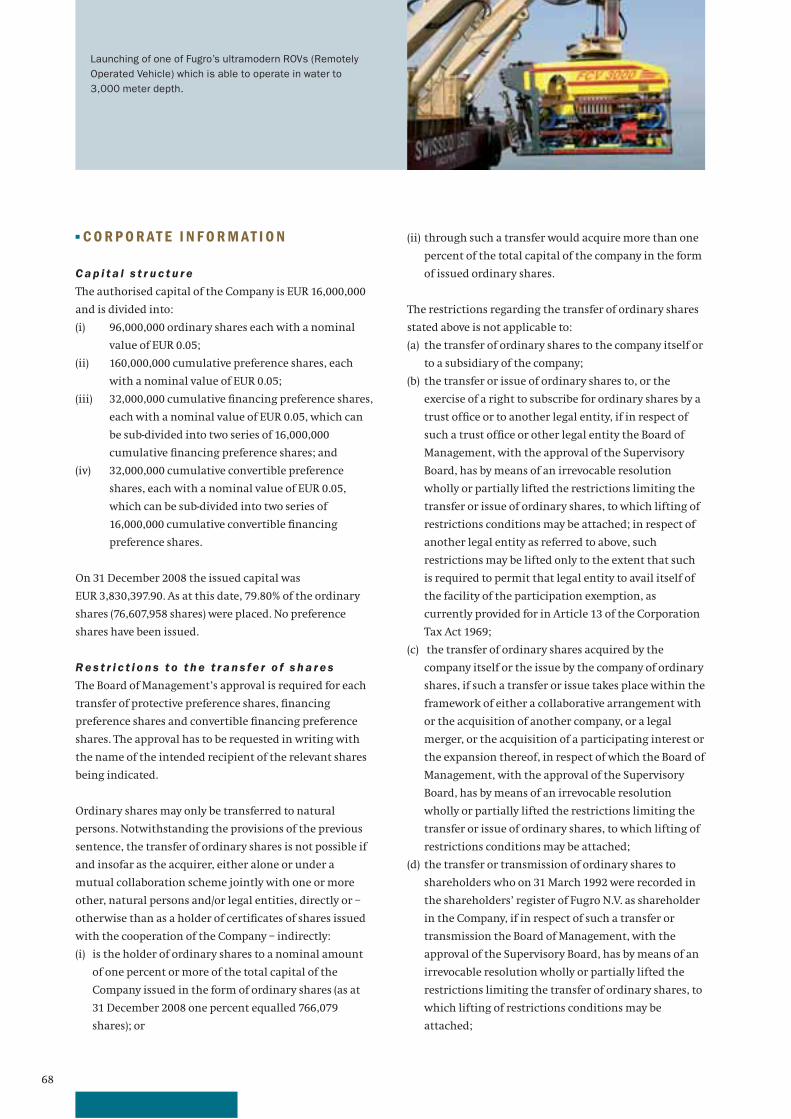
68
Launching of one of Fugro’s ultramodern ROVs (Remotely
Operated Vehicle) which is able to operate in water to
3,000 meter depth.
(ii) through such a transfer would acquire more than one
percent of the total capital of the company in the form
of issued ordinary shares.
The restrictions regarding the transfer of ordinary shares
stated above is not applicable to:
(a) the transfer of ordinary shares to the company itself or
to a subsidiary of the company;
(b) the transfer or issue of ordinary shares to, or the
exercise of a right to subscribe for ordinary shares by a
trust offi ce or to another legal entity, if in respect of
such a trust offi ce or other legal entity the Board of
Management, with the approval of the Supervisory
Board, has by means of an irrevocable resolution
wholly or partially lifted the restrictions limiting the
transfer or issue of ordinary shares, to which lifting of
restrictions conditions may be attached; in respect of
another legal entity as referred to above, such
restrictions may be lifted only to the extent that such
is required to permit that legal entity to avail itself of
the facility of the participation exemption, as
currently provided for in Article 13 of the Corporation
Tax Act 1969;
(c) the transfer of ordinary shares acquired by the
company itself or the issue by the company of ordinary
shares, if such a transfer or issue takes place within the
framework of either a collaborative arrangement with
or the acquisition of another company, or a legal
merger, or the acquisition of a participating interest or
the expansion thereof, in respect of which the Board of
Management, with the approval of the Supervisory
Board, has by means of an irrevocable resolution
wholly or partially lifted the restrictions limiting the
transfer or issue of ordinary shares, to which lifting of
restrictions conditions may be attached;
(d) the transfer or transmission of ordinary shares to
shareholders who on 31 March 1992 were recorded in
the shareholders’ register of Fugro N.V. as shareholder
in the Company, if in respect of such a transfer or
transmission the Board of Management, with the
approval of the Supervisory Board, has by means of an
irrevocable resolution wholly or partially lifted the
restrictions limiting the transfer of ordinary shares, to
which lifting of restrictions conditions may be
attached;
■ C O R P O R AT E I N F O R M AT I O N
C a p i t a l s t r u c t u r e
The authorised capital of the Company is EUR 16,000,000
and is divided into:
(i) 96,000,000 ordinary shares each with a nominal
value of EUR 0.05;
(ii) 160,000,000 cumulative preference shares, each
with a nominal value of EUR 0.05;
(iii) 32,000,000 cumulative fi nancing preference shares,
each with a nominal value of EUR 0.05, which can
be sub-divided into two series of 16,000,000
cumulative fi nancing preference shares; and
(iv) 32,000,000 cumulative convertible preference
shares, each with a nominal value of EUR 0.05,
which can be sub-divided into two series of
16,000,000 cumulative convertible fi nancing
preference shares.
On 31 December 2008 the issued capital was
EUR 3,830,397.90. As at this date, 79.80% of the ordinary
shares (76,607,958 shares) were placed. No preference
shares have been issued.
R e s t r i c t i o n s t o t h e t r a n s f e r o f s h a r e s
The Board of Management’s approval is required for each
transfer of protective preference shares, fi nancing
preference shares and convertible fi nancing preference
shares. The approval has to be requested in writing with
the name of the intended recipient of the relevant shares
being indicated.
Ordinary shares may only be transferred to natural
persons. Notwithstanding the provisions of the previous
sentence, the transfer of ordinary shares is not possible if
and insofar as the acquirer, either alone or under a
mutual collaboration scheme jointly with one or more
other, natural persons and/or legal entities, directly or –
otherwise than as a holder of certifi cates of shares issued
with the cooperation of the Company – indirectly:
(i) is the holder of ordinary shares to a nominal amount
of one percent or more of the total capital of the
Company issued in the form of ordinary shares (as at
31 December 2008 one percent equalled 766,079
shares); or
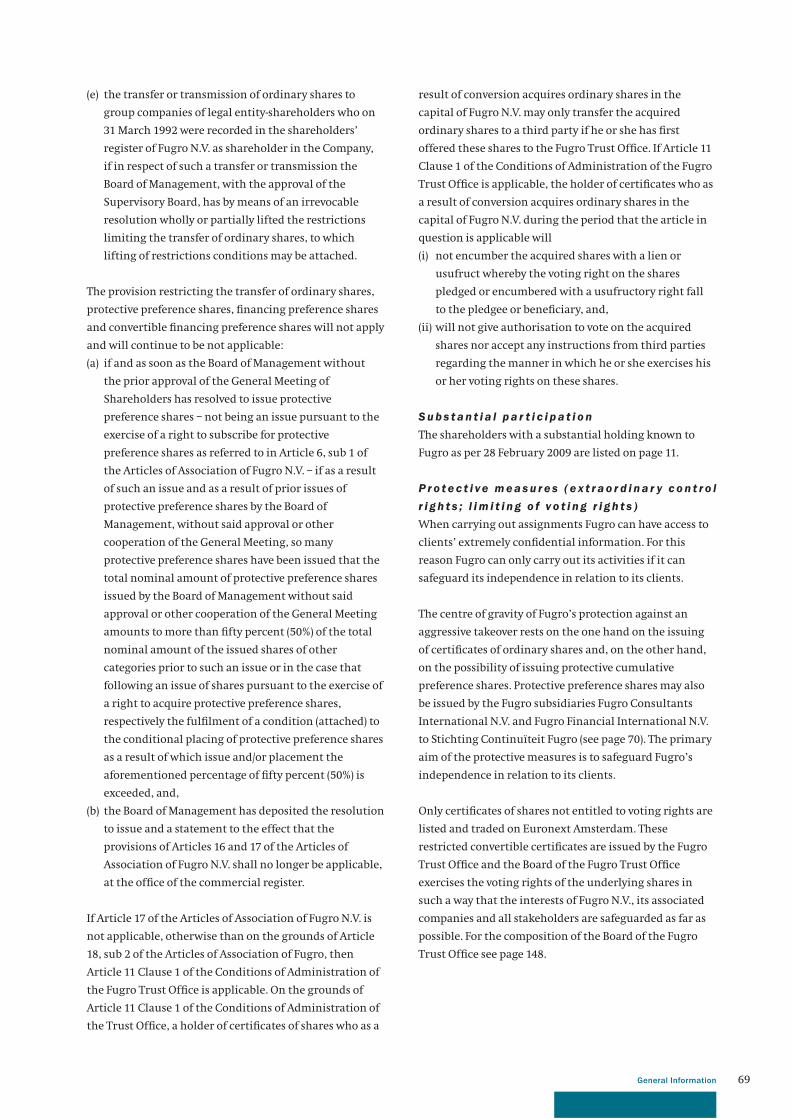
69General Information
result of conversion acquires ordinary shares in the
capital of Fugro N.V. may only transfer the acquired
ordinary shares to a third party if he or she has fi rst
offered these shares to the Fugro Trust Offi ce. If Article 11
Clause 1 of the Conditions of Administration of the Fugro
Trust Offi ce is applicable, the holder of certifi cates who as
a result of conversion acquires ordinary shares in the
capital of Fugro N.V. during the period that the article in
question is applicable will
(i) not encumber the acquired shares with a lien or
usufruct whereby the voting right on the shares
pledged or encumbered with a usufructory right fall
to the pledgee or benefi ciary, and,
(ii) will not give authorisation to vote on the acquired
shares nor accept any instructions from third parties
regarding the manner in which he or she exercises his
or her voting rights on these shares.
S u b s t a n t i a l p a r t i c i p a t i o n
The shareholders with a substantial holding known to
Fugro as per 28 February 2009 are listed on page 11.
P r o t e c t i ve m e a s u r e s ( e x t r a o r d i n a r y c o n t r o l
r i g h t s ; l i m i t i n g o f v o t i n g r i g h t s )
When carrying out assignments Fugro can have access to
clients’ extremely confi dential information. For this
reason Fugro can only carry out its activities if it can
safeguard its independence in relation to its clients.
The centre of gravity of Fugro’s protection against an
aggressive takeover rests on the one hand on the issuing
of certifi cates of ordinary shares and, on the other hand,
on the possibility of issuing protective cumulative
preference shares. Protective preference shares may also
be issued by the Fugro subsidiaries Fugro Consultants
International N.V. and Fugro Financial International N.V.
to Stichting Continuïteit Fugro (see page 70). The primary
aim of the protective measures is to safeguard Fugro’s
independence in relation to its clients.
Only certifi cates of shares not entitled to voting rights are
listed and traded on Euronext Amsterdam. These
restricted convertible certifi cates are issued by the Fugro
Trust Offi ce and the Board of the Fugro Trust Offi ce
exercises the voting rights of the underlying shares in
such a way that the interests of Fugro N.V., its associated
companies and all stakeholders are safeguarded as far as
possible. For the composition of the Board of the Fugro
Trust Offi ce see page 148.
(e) the transfer or transmission of ordinary shares to
group companies of legal entity-shareholders who on
31 March 1992 were recorded in the shareholders’
register of Fugro N.V. as shareholder in the Company,
if in respect of such a transfer or transmission the
Board of Management, with the approval of the
Supervisory Board, has by means of an irrevocable
resolution wholly or partially lifted the restrictions
limiting the transfer of ordinary shares, to which
lifting of restrictions conditions may be attached.
The provision restricting the transfer of ordinary shares,
protective preference shares, fi nancing preference shares
and convertible fi nancing preference shares will not apply
and will continue to be not applicable:
(a) if and as soon as the Board of Management without
the prior approval of the General Meeting of
Shareholders has resolved to issue protective
preference shares – not being an issue pursuant to the
exercise of a right to subscribe for protective
preference shares as referred to in Article 6, sub 1 of
the Articles of Association of Fugro N.V. – if as a result
of such an issue and as a result of prior issues of
protective preference shares by the Board of
Management, without said approval or other
cooperation of the General Meeting, so many
protective preference shares have been issued that the
total nominal amount of protective preference shares
issued by the Board of Management without said
approval or other cooperation of the General Meeting
amounts to more than fi fty percent (50%) of the total
nominal amount of the issued shares of other
categories prior to such an issue or in the case that
following an issue of shares pursuant to the exercise of
a right to acquire protective preference shares,
respectively the fulfi lment of a condition (attached) to
the conditional placing of protective preference shares
as a result of which issue and/or placement the
aforementioned percentage of fi fty percent (50%) is
exceeded, and,
(b) the Board of Management has deposited the resolution
to issue and a statement to the effect that the
provisions of Articles 16 and 17 of the Articles of
Association of Fugro N.V. shall no longer be applicable,
at the offi ce of the commercial register.
If Article 17 of the Articles of Association of Fugro N.V. is
not applicable, otherwise than on the grounds of Article
18, sub 2 of the Articles of Association of Fugro, then
Article 11 Clause 1 of the Conditions of Administration of
the Fugro Trust Offi ce is applicable. On the grounds of
Article 11 Clause 1 of the Conditions of Administration of
the Trust Offi ce, a holder of certifi cates of shares who as a
70
The objective of Stichting Beschermingspreferente
aandelen Fugro is the promotion of the interests of
Fugro and the companies maintained by Fugro, as well as
the companies in the Fugro Group, in such a way that the
interests of Fugro and all involved with Fugro are
safeguarded in the best possible manner and infl uences
which could damage the independence and/or continuity
and/or identity of Fugro and its associated companies to
the detriment of those interests are prevented as far as
possible, as is the execution of anything that is related to
or could be benefi cial to the above. The options on
protective preference shares granted to Fugro Consultants
International N.V. and Fugro Financial International N.V.
were approved by the Annual General Meeting of
Shareholders in 1999. The objective of Stichting
Continuïteit Fugro is the same as that of Stichting
Beschermingspreferente aandelen Fugro.
The protective measures described above will, especially
in a take-over situation, be put into effect when this is in
the interest of protecting the confi dentiality of clients’
data, safeguarding Fugro’s independence and defi ning
Fugro’s position in relation to that of the aggressor and
the aggressor’s plans and will create the possibility of
seeking the necessary alternatives. The protective
measures will not be put into effect to protect the Board of
Management’s own position. Due to the uncertainty
regarding the situations with which Fugro could be
confronted, the use of protective measures in
circumstances other than those described above cannot
be discounted.
The Fugro Trust Offi ce operates fully independent of the
Company.
Certifi cate holders (and their authorised proxies):
• may, after timely written notifi cation, attend and
speak at shareholders’ meetings;
• are entitled to request from the Fugro Trust Offi ce a
proxy to exercise the right to vote for the shares that
underlie their certifi cates. The Board of the Fugro
Trust Offi ce may only limit, exclude or recall this proxy
if:
a) a public bid for the (certifi cates of) shares in Fugro
N.V. has been announced or issued, or there is a
reasonable expectation that this will occur,
without the consent of the Company;
b) 25% or more of the subscribed capital of the
Company is held by one holder of (certifi cates of)
shares or by a number of holders collaborating on
the basis of a mutual agreement, or
c) exercising the right to vote may, in the opinion of
the Fugro Trust Offi ce, confl ict with the overall
interests of the Company;
• may as long as they are natural persons, exchange
their certifi cates into ordinary (voting) shares up to a
maximum of 1% of the issued share capital of Fugro
N.V. per shareholder.
Any issuing of protective preference shares will be carried
out by Stichting Beschermingspreferente aandelen Fugro.
On 14 May 2008 the Annual General Meeting of
Shareholders designated the Board of Management of
Fugro N.V. as the body which, for the period until 14
November 2009 is authorised, with the approval of the
Supervisory Board, to:
(a) issue and/or grant rights to acquire all preference
shares – by which is understood both protective
preference shares and fi nancing preference shares –
and ordinary shares in the issued capital, and
(b) to limit or exclude the priority rights on shares to be
issued.
Because no option agreement between Fugro N.V. and
Stichting Beschermingspreferente aandelen Fugro has
been signed and the threat of an aggressive take-over is
such that an immediate issue of preference shares by
Stichting Beschermingspreferente aandelen Fugro is
advisable, the Board of Management should, on the basis
of its designation as the body authorised to issue shares,
with the approval of the Supervisory Board, decide to
issue preference shares.
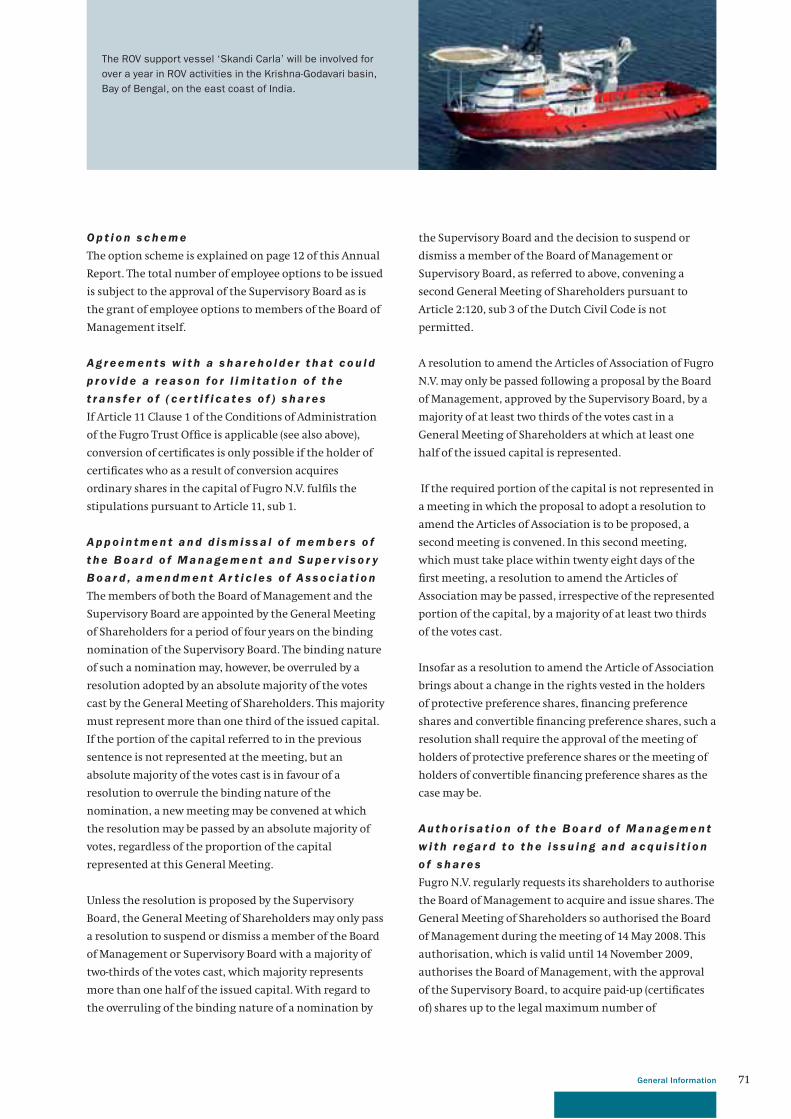
71General Information
The ROV support vessel ‘Skandi Carla’ will be involved for
over a year in ROV activities in the Krishna-Godavari basin,
Bay of Bengal, on the east coast of India.
the Supervisory Board and the decision to suspend or
dismiss a member of the Board of Management or
Supervisory Board, as referred to above, convening a
second General Meeting of Shareholders pursuant to
Article 2:120, sub 3 of the Dutch Civil Code is not
permitted.
A resolution to amend the Articles of Association of Fugro
N.V. may only be passed following a proposal by the Board
of Management, approved by the Supervisory Board, by a
majority of at least two thirds of the votes cast in a
General Meeting of Shareholders at which at least one
half of the issued capital is represented.
If the required portion of the capital is not represented in
a meeting in which the proposal to adopt a resolution to
amend the Articles of Association is to be proposed, a
second meeting is convened. In this second meeting,
which must take place within twenty eight days of the
fi rst meeting, a resolution to amend the Articles of
Association may be passed, irrespective of the represented
portion of the capital, by a majority of at least two thirds
of the votes cast.
Insofar as a resolution to amend the Article of Association
brings about a change in the rights vested in the holders
of protective preference shares, fi nancing preference
shares and convertible fi nancing preference shares, such a
resolution shall require the approval of the meeting of
holders of protective preference shares or the meeting of
holders of convertible fi nancing preference shares as the
case may be.
Au t h o r i s a t i o n o f t h e B o a r d o f M a n a ge m e n t
w i t h r e ga r d t o t h e i s s u i n g a n d a c q u i s i t i o n
o f s h a r e s
Fugro N.V. regularly requests its shareholders to authorise
the Board of Management to acquire and issue shares. The
General Meeting of Shareholders so authorised the Board
of Management during the meeting of 14 May 2008. This
authorisation, which is valid until 14 November 2009,
authorises the Board of Management, with the approval
of the Supervisory Board, to acquire paid-up (certifi cates
of) shares up to the legal maximum number of
O p t i o n s c h e m e
The option scheme is explained on page 12 of this Annual
Report. The total number of employee options to be issued
is subject to the approval of the Supervisory Board as is
the grant of employee options to members of the Board of
Management itself.
A g r e e m e n t s w i t h a s h a r e h o l d e r t h a t c o u l d
p r o v i d e a r e a s o n fo r l i m i t a t i o n o f t h e
t r a n s f e r o f ( c e r t i f i c a t e s o f ) s h a r e s
If Article 11 Clause 1 of the Conditions of Administration
of the Fugro Trust Offi ce is applicable (see also above),
conversion of certifi cates is only possible if the holder of
certifi cates who as a result of conversion acquires
ordinary shares in the capital of Fugro N.V. fulfi ls the
stipulations pursuant to Article 11, sub 1.
A p p o i n t m e n t a n d d i s m i s s a l o f m e m b e r s o f
t h e B o a r d o f M a n a ge m e n t a n d S u p e r v i s o r y
B o a r d , a m e n d m e n t A r t i c l e s o f A s s o c i a t i o n
The members of both the Board of Management and the
Supervisory Board are appointed by the General Meeting
of Shareholders for a period of four years on the binding
nomination of the Supervisory Board. The binding nature
of such a nomination may, however, be overruled by a
resolution adopted by an absolute majority of the votes
cast by the General Meeting of Shareholders. This majority
must represent more than one third of the issued capital.
If the portion of the capital referred to in the previous
sentence is not represented at the meeting, but an
absolute majority of the votes cast is in favour of a
resolution to overrule the binding nature of the
nomination, a new meeting may be convened at which
the resolution may be passed by an absolute majority of
votes, regardless of the proportion of the capital
represented at this General Meeting.
Unless the resolution is proposed by the Supervisory
Board, the General Meeting of Shareholders may only pass
a resolution to suspend or dismiss a member of the Board
of Management or Supervisory Board with a majority of
two-thirds of the votes cast, which majority represents
more than one half of the issued capital. With regard to
the overruling of the binding nature of a nomination by
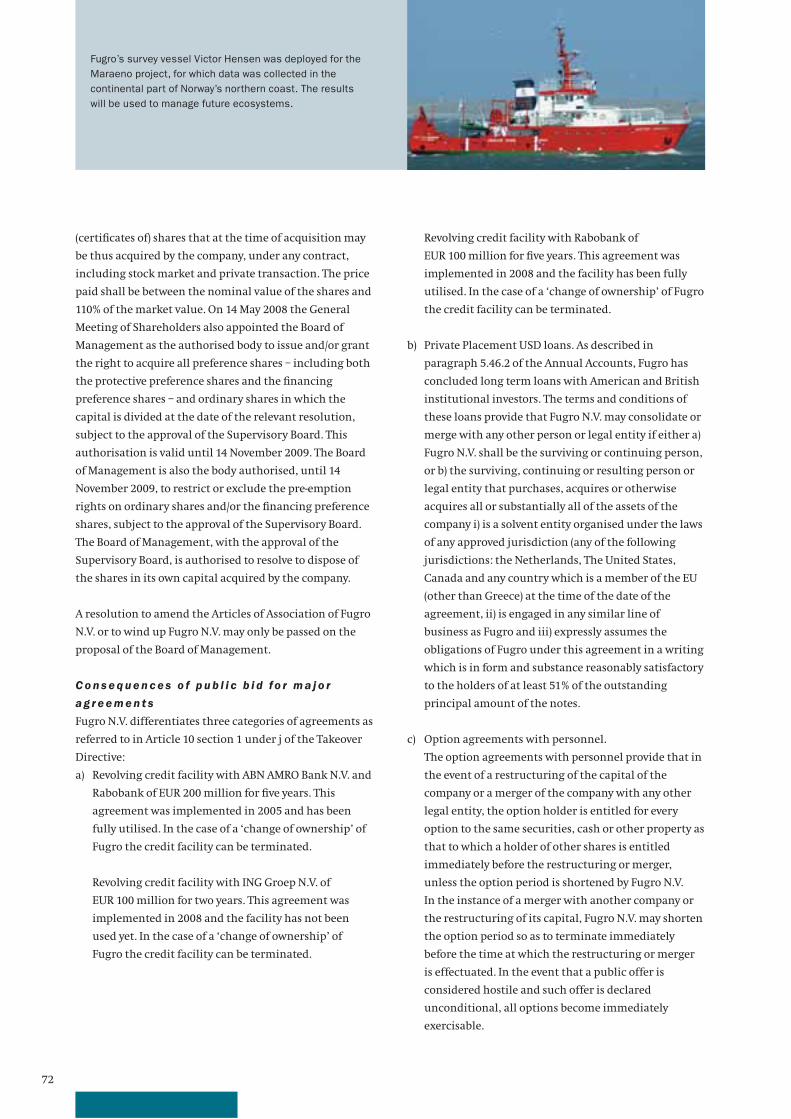
72
Fugro’s survey vessel Victor Hensen was deployed for the
Maraeno project, for which data was collected in the
continental part of Norway’s northern coast. The results
will be used to manage future ecosystems.
Revolving credit facility with Rabobank of
EUR 100 million for fi ve years. This agreement was
implemented in 2008 and the facility has been fully
utilised. In the case of a ‘change of ownership’ of Fugro
the credit facility can be terminated.
b) Private Placement USD loans. As described in
paragraph 5.46.2 of the Annual Accounts, Fugro has
concluded long term loans with American and British
institutional investors. The terms and conditions of
these loans provide that Fugro N.V. may consolidate or
merge with any other person or legal entity if either a)
Fugro N.V. shall be the surviving or continuing person,
or b) the surviving, continuing or resulting person or
legal entity that purchases, acquires or otherwise
acquires all or substantially all of the assets of the
company i) is a solvent entity organised under the laws
of any approved jurisdiction (any of the following
jurisdictions: the Netherlands, The United States,
Canada and any country which is a member of the EU
(other than Greece) at the time of the date of the
agreement, ii) is engaged in any similar line of
business as Fugro and iii) expressly assumes the
obligations of Fugro under this agreement in a writing
which is in form and substance reasonably satisfactory
to the holders of at least 51% of the outstanding
principal amount of the notes.
c) Option agreements with personnel.
The option agreements with personnel provide that in
the event of a restructuring of the capital of the
company or a merger of the company with any other
legal entity, the option holder is entitled for every
option to the same securities, cash or other property as
that to which a holder of other shares is entitled
immediately before the restructuring or merger,
unless the option period is shortened by Fugro N.V.
In the instance of a merger with another company or
the restructuring of its capital, Fugro N.V. may shorten
the option period so as to terminate immediately
before the time at which the restructuring or merger
is effectuated. In the event that a public offer is
considered hostile and such offer is declared
unconditional, all options become immediately
exercisable.
(certifi cates of) shares that at the time of acquisition may
be thus acquired by the company, under any contract,
including stock market and private transaction. The price
paid shall be between the nominal value of the shares and
110% of the market value. On 14 May 2008 the General
Meeting of Shareholders also appointed the Board of
Management as the authorised body to issue and/or grant
the right to acquire all preference shares – including both
the protective preference shares and the fi nancing
preference shares – and ordinary shares in which the
capital is divided at the date of the relevant resolution,
subject to the approval of the Supervisory Board. This
authorisation is valid until 14 November 2009. The Board
of Management is also the body authorised, until 14
November 2009, to restrict or exclude the pre-emption
rights on ordinary shares and/or the fi nancing preference
shares, subject to the approval of the Supervisory Board.
The Board of Management, with the approval of the
Supervisory Board, is authorised to resolve to dispose of
the shares in its own capital acquired by the company.
A resolution to amend the Articles of Association of Fugro
N.V. or to wind up Fugro N.V. may only be passed on the
proposal of the Board of Management.
C o n s e q u e n c e s o f p u b l i c b i d fo r m a j o r
a g r e e m e n t s
Fugro N.V. differentiates three categories of agreements as
referred to in Article 10 section 1 under j of the Takeover
Directive:
a) Revolving credit facility with ABN AMRO Bank N.V. and
Rabobank of EUR 200 million for fi ve years. This
agreement was implemented in 2005 and has been
fully utilised. In the case of a ‘change of ownership’ of
Fugro the credit facility can be terminated.
Revolving credit facility with ING Groep N.V. of
EUR 100 million for two years. This agreement was
implemented in 2008 and the facility has not been
used yet. In the case of a ‘change of ownership’ of
Fugro the credit facility can be terminated.
73General Information
Pa y m e n t t o t h e B o a r d o f M a n a ge m e n t
o n t e r m i n a t i o n o f e m p l oy m e n t r e s u l t i n g
f r o m a p u b l i c b i d
Fugro N.V. has not concluded any agreements with
members of the Board of Management or employees that
provide for a specifi c payment in the case of termination
of employment resulting from a public bid in the sense of
Article 5:70 or 5:74 of the Financial Supervision Act. The
employment agreements with Messrs. Jonkman, Van Riel
and Steenbakker do – in conformance with the Corporate
Governance Code – provide for a general termination
recompense in the event of dismissal which is applicable
on the termination or annulment of the employment
agreement. This amounts to two years’ gross salary
for Mr. Van Riel during the fi rst four-year period of
appointment which ends in May 2010. The Code will
be applied when Mr. Van Riel is reappointed. The
termination recompense for Messrs. Jonkman and
Steenbakker amounts to one year’s gross salary. It has also
been stipulated that the aforementioned compensation is
also applicable in the event the persons named cannot
reasonably continue to perform their function on the
grounds of a change in circumstances such that
continuing to fulfi l this function can no longer be asked
of them. It is stated that this could be the case if the
company is wound-up, merged or acquired, or undergoes
a far-reaching reorganisation or a fundamental change of
policy. The agreement with Mr. Wester does not provide
for a specifi c payment in the case of a termination of
employment. This agreement was entered into before the
Code came into force. Fugro cannot rescind rights that
have been granted and this agreement will be honoured.
This means that general labour law provisions are
applicable.

1 Consolidated income statement 76
2 Consolidated statement of recognised
income and expense 77
3 Consolidated balance sheet 78
4 Consolidated statement of cash fl ows 79
5 Notes to the consolidated fi nancial statements 81
6 Subsidiaries and associates of Fugro N.V.
calculated using the equity method 138
7 Company balance sheet 141
8 Company income statement 142
9 Notes to the company fi nancial statements 143
10 Other information 147
10.1 Auditor’s report 147
10.2 Post balance sheet date events 148
10.3 Foundation Boards 148
10.4 Profi t appropriation 148
10.5 Proposed profi t appropriation 149
Report of Fugro Trust Offi ce Foundation 150
Report of ANT Trust & Corporate Services N.V. 151
Historic review 152
Glossary 154
F U G R O N . V.
A n n u a l a c c o u n t s 2 0 0 8
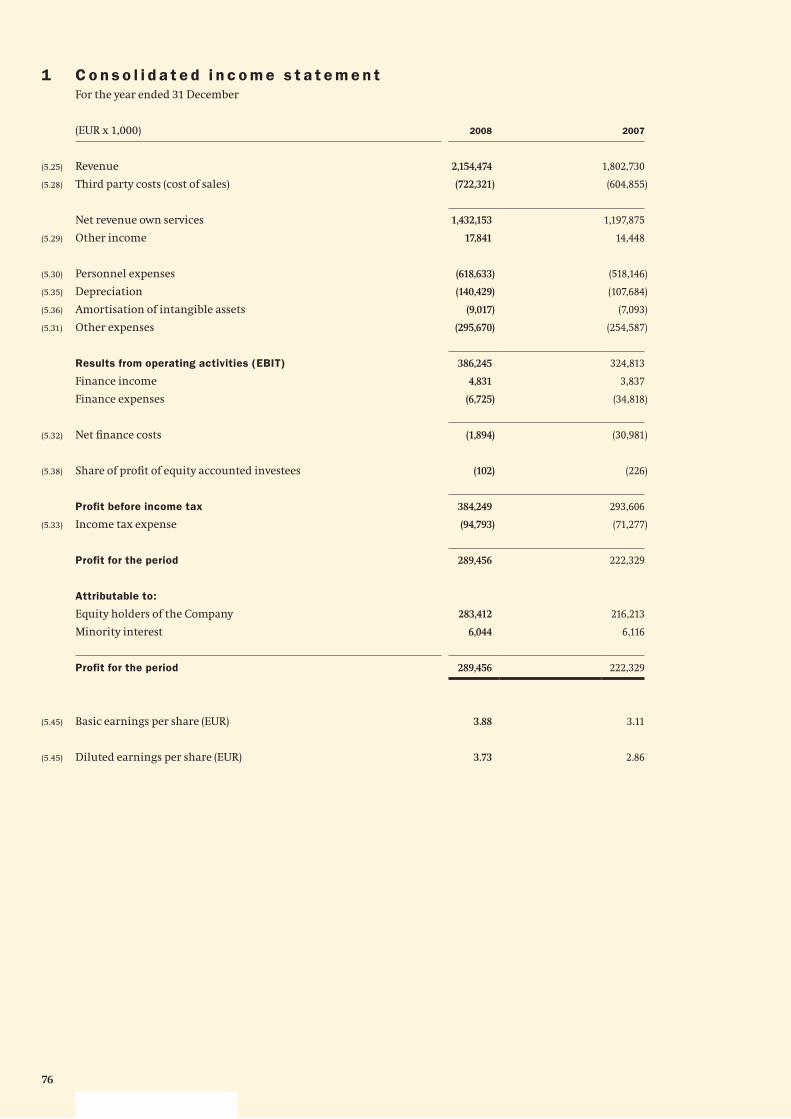
76
1 C o n s o l i d a t e d i n c o m e s t a t e m e n tFor the year ended 31 December
(EUR x 1,000) 2008 2007
(5.25) Revenue 2,154,474 1,802,730
(5.28) Third party costs (cost of sales) (722,321) (604,855)
Net revenue own services 1,432,153 1,197,875
(5.29) Other income 17,841 14,448
(5.30) Personnel expenses (618,633) (518,146)
(5.35) Depreciation (140,429) (107,684)
(5.36) Amortisation of intangible assets (9,017) (7,093)
(5.31) Other expenses (295,670) (254,587)
Results from operating activities (EBIT) 386,245 324,813
Finance income 4,831 3,837
Finance expenses (6,725) (34,818)
(5.32) Net fi nance costs (1,894) (30,981)
(5.38) Share of profi t of equity accounted investees (102) (226)
Profit before income tax 384,249 293,606
(5.33) Income tax expense (94,793) (71,277)
Profit for the period 289,456 222,329
Attributable to:
Equity holders of the Company 283,412 216,213
Minority interest 6,044 6,116
Profit for the period 289,456 222,329
(5.45) Basic earnings per share (EUR) 3.88 3.11
(5.45) Diluted earnings per share (EUR) 3.73 2.86
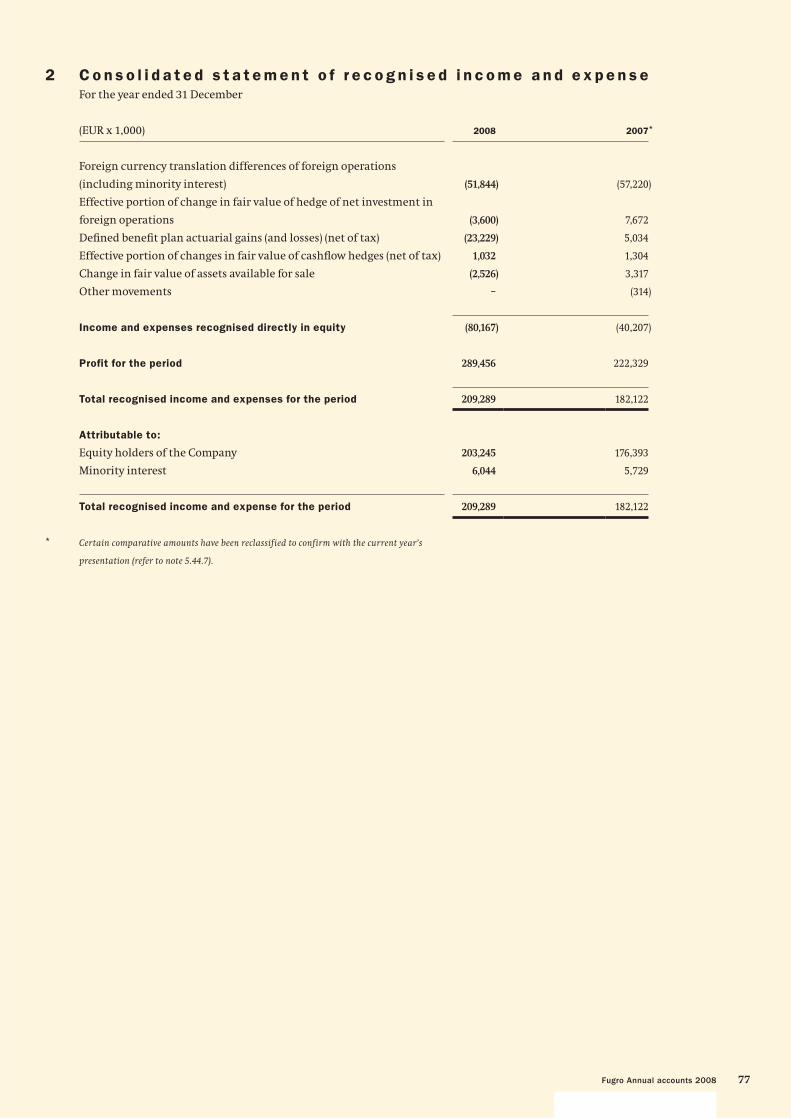
77Fugro Annual accounts 2008
2 C o n s o l i d a t e d s t a t e m e n t o f r e c o g n i s e d i n c o m e a n d e x p e n s e For the year ended 31 December
(EUR x 1,000) 2008 2007
Foreign currency translation differences of foreign operations
(including minority interest) (51,844) (57,220)
Effective portion of change in fair value of hedge of net investment in
foreign operations (3,600) 7,672
Defi ned benefi t plan actuarial gains (and losses) (net of tax) (23,229) 5,034
Effective portion of changes in fair value of cashfl ow hedges (net of tax) 1,032 1,304
Change in fair value of assets available for sale (2,526) 3,317
Other movements – (314)
Income and expenses recognised directly in equity (80,167) (40,207)
Profit for the period 289,456 222,329
Total recognised income and expenses for the period 209,289 182,122
Attributable to:
Equity holders of the Company 203,245 176,393
Minority interest 6,044 5,729
Total recognised income and expense for the period 209,289 182,122
* Certain comparative amounts have been reclassified to confirm with the current year’s
presentation (refer to note 5.44.7).
*
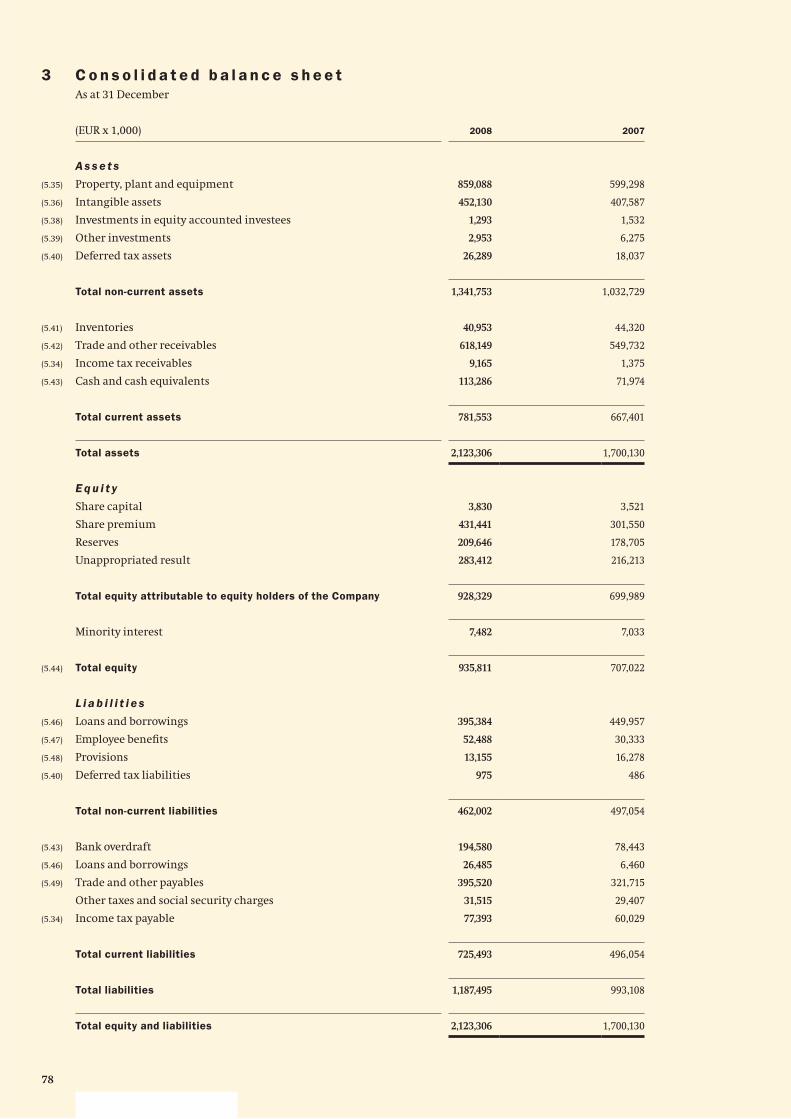
78
3 C o n s o l i d a t e d b a l a n c e s h e e tAs at 31 December
(EUR x 1,000) 2008 2007
A s s e t s
(5.35) Property, plant and equipment 859,088 599,298
(5.36) Intangible assets 452,130 407,587
(5.38) Investments in equity accounted investees 1,293 1,532
(5.39) Other investments 2,953 6,275
(5.40) Deferred tax assets 26,289 18,037
Total non-current assets 1,341,753 1,032,729
(5.41) Inventories 40,953 44,320
(5.42) Trade and other receivables 618,149 549,732
(5.34) Income tax receivables 9,165 1,375
(5.43) Cash and cash equivalents 113,286 71,974
Total current assets 781,553 667,401
Total assets 2,123,306 1,700,130
E q u i t y
Share capital 3,830 3,521
Share premium 431,441 301,550
Reserves 209,646 178,705
Unappropriated result 283,412 216,213
Total equity attributable to equity holders of the Company 928,329 699,989
Minority interest 7,482 7,033
(5.44) Total equity 935,811 707,022
L i a b i l i t i e s
(5.46) Loans and borrowings 395,384 449,957
(5.47) Employee benefi ts 52,488 30,333
(5.48) Provisions 13,155 16,278
(5.40) Deferred tax liabilities 975 486
Total non-current liabilities 462,002 497,054
(5.43) Bank overdraft 194,580 78,443
(5.46) Loans and borrowings 26,485 6,460
(5.49) Trade and other payables 395,520 321,715
Other taxes and social security charges 31,515 29,407
(5.34) Income tax payable 77,393 60,029
Total current liabilities 725,493 496,054
Total liabilities 1,187,495 993,108
Total equity and liabilities 2,123,306 1,700,130
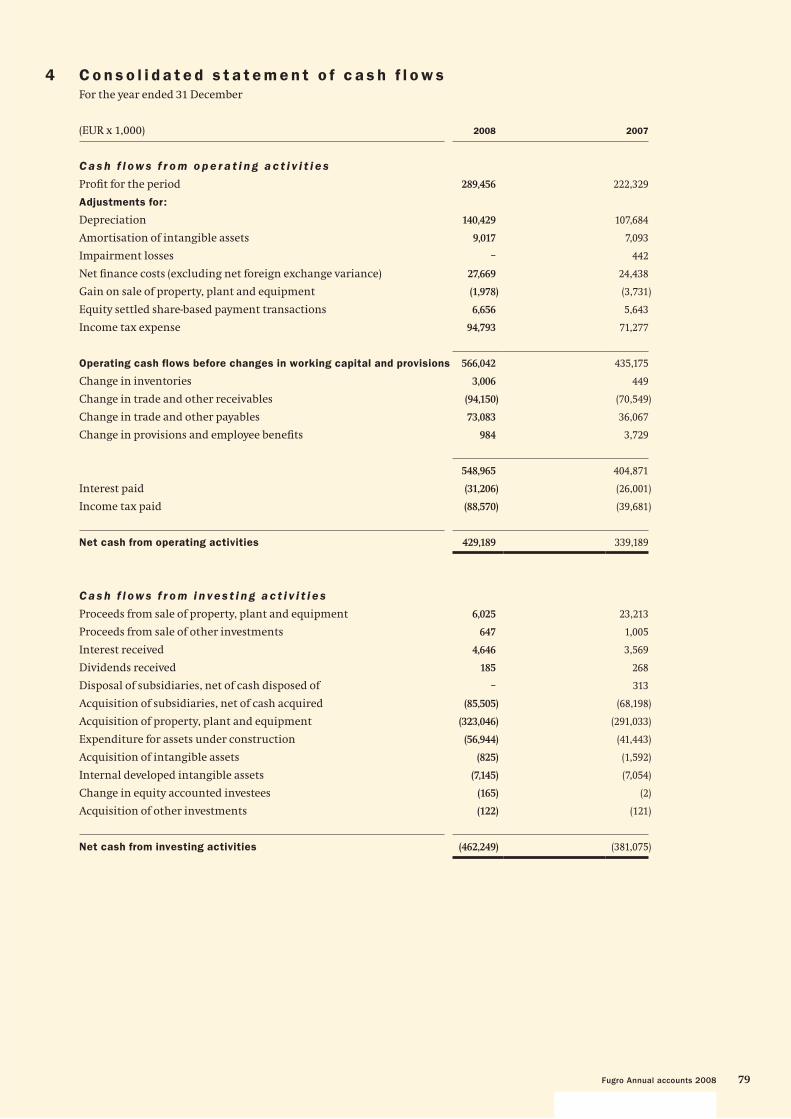
79Fugro Annual accounts 2008
4 C o n s o l i d a t e d s t a t e m e n t o f c a s h f l o w sFor the year ended 31 December
(EUR x 1,000) 2008 2007
C a s h f l ow s f r o m o p e r a t i n g a c t i v i t i e s
Profi t for the period 289,456 222,329
Adjustments for:
Depreciation 140,429 107,684
Amortisation of intangible assets 9,017 7,093
Impairment losses – 442
Net fi nance costs (excluding net foreign exchange variance) 27,669 24,438
Gain on sale of property, plant and equipment (1,978) (3,731)
Equity settled share-based payment transactions 6,656 5,643
Income tax expense 94,793 71,277
Operating cash flows before changes in working capital and provisions 566,042 435,175
Change in inventories 3,006 449
Change in trade and other receivables (94,150) (70,549)
Change in trade and other payables 73,083 36,067
Change in provisions and employee benefi ts 984 3,729
548,965 404,871
Interest paid (31,206) (26,001)
Income tax paid (88,570) (39,681)
Net cash from operating activities 429,189 339,189
C a s h f l ow s f r o m i n ve s t i n g a c t i v i t i e s
Proceeds from sale of property, plant and equipment 6,025 23,213
Proceeds from sale of other investments 647 1,005
Interest received 4,646 3,569
Dividends received 185 268
Disposal of subsidiaries, net of cash disposed of – 313
Acquisition of subsidiaries, net of cash acquired (85,505) (68,198)
Acquisition of property, plant and equipment (323,046) (291,033)
Expenditure for assets under construction (56,944) (41,443)
Acquisition of intangible assets (825) (1,592)
Internal developed intangible assets (7,145) (7,054)
Change in equity accounted investees (165) (2)
Acquisition of other investments (122) (121)
Net cash from investing activities (462,249) (381,075)
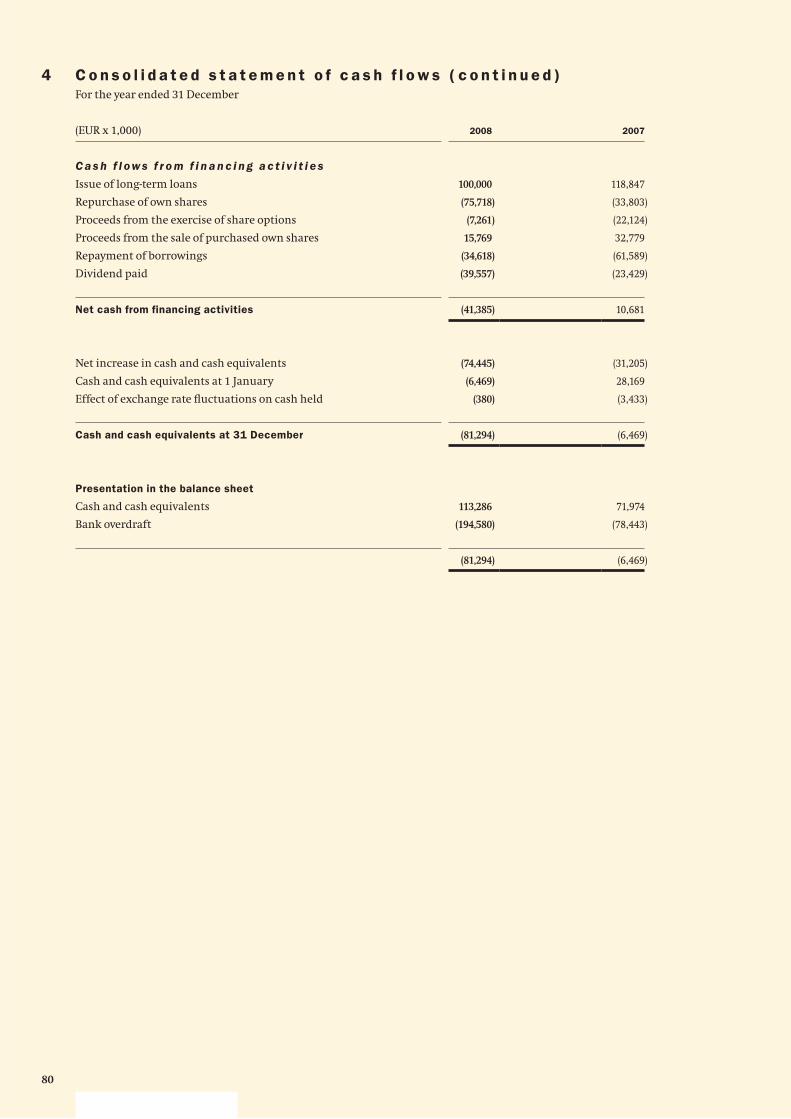
80
(EUR x 1,000) 2008 2007
C a s h f l ow s f r o m f i n a n c i n g a c t i v i t i e s
Issue of long-term loans 100,000 118,847
Repurchase of own shares (75,718) (33,803)
Proceeds from the exercise of share options (7,261) (22,124)
Proceeds from the sale of purchased own shares 15,769 32,779
Repayment of borrowings (34,618) (61,589)
Dividend paid (39,557) (23,429)
Net cash from financing activities (41,385) 10,681
Net increase in cash and cash equivalents (74,445) (31,205)
Cash and cash equivalents at 1 January (6,469) 28,169
Effect of exchange rate fl uctuations on cash held (380) (3,433)
Cash and cash equivalents at 31 December (81,294) (6,469)
Presentation in the balance sheet
Cash and cash equivalents 113,286 71,974
Bank overdraft (194,580) (78,443)
(81,294) (6,469)
4 C o n s o l i d a t e d s t a t e m e n t o f c a s h f l o w s ( c o n t i n u e d )For the year ended 31 December
81Fugro Annual accounts 2008
5 N o t e s t o t h e c o n s o l i d a t e d f i n a n c i a l s t a t e m e n t s
5.1 G e n e r a l
Fugro N.V. (‘the Company’) is a company domiciled in Leidschendam, the Netherlands. The consolidated fi nancial
statements of the Company for the year ended 31 December 2008 comprise the Company and its subsidiaries
(together referred to as the ‘Group’) and the Group’s interests in associates. A summary of the main subsidiaries
is included in chapter 6. The annual accounts have been prepared by the Board of Management and have been
authorised for issue by the Supervisory Board on 5 March 2009. Publication will take place on 6 March 2009.
The annual accounts will be submitted for adoption to the Annual General Meeting of Shareholders on 7 May
2009. The offi cial annual accounts are prepared in the Dutch language. With reference to the Company income
statement of Fugro N.V., use has been made of the exemption pursuant to Section 402 of Book 2 of the
Netherlands Civil Code.
5.2 S t a t e m e n t o f c o m p l i a n c e
The consolidated fi nancial statements have been prepared in accordance with International Financial Reporting
Standards (IFRS) as adopted by the European Union (EU-IFRS).
5.3 S i g n i f i c a n t a c c o u n t i n g p o l i c i e s
5.3.1 Basis of preparation
The fi nancial statements are presented in EUR x 1,000, unless mentioned otherwise. The Euro is the functional
and presentation currency of Fugro.
The fi nancial statements have been prepared on the historical cost basis except that the following assets and
liabilities are stated at their fair value: derivative fi nancial instruments, fi nancial instruments at fair value
through profi t or loss, available-for-sale fi nancial assets, and plan assets associated with defi ned benefi t plans.
The preparation of the fi nancial statements requires management to make judgements, estimates and
assumptions that affect the application of accounting policies and the reported amounts of assets and liabilities,
income and expenses. Actual results may differ from these estimates. The estimates and associated assumptions
are based on historical experience and various other factors that are believed to be reasonable under the
circumstances, the result of which form the basis of making the judgements about the carrying values of the
assets and liabilities that are not readily apparent from other sources. The estimates and the underlying
assumptions are reviewed on an ongoing basis. Revisions to accounting estimates are recognised in the period in
which the estimate is revised if the revision affects only that period, or in the period of the revision and future
periods if the revision affects both current and future periods.
Judgements made by management in the application of EU-IFRS that have a signifi cant effect on the fi nancial
statements and estimates with a signifi cant risk of material misstatement in the next year are disclosed in
note 5.60.
The accounting policies have been consistently applied by all subsidiaries and associates to all periods presented
in these consolidated fi nancial statements.
5.3.2 New standards and interpretations not yet adopted
A number of new standards, amendments to standards and interpretations are not yet effective for the year
ended 31 December 2008, and have not been applied in preparing these consolidated fi nancial statements:
– IFRS 8 Operating Segments introduces the ‘management approach’ to segment reporting. IFRS 8, which becomes
mandatory for the Group’s 2009 consolidated fi nancial statements, will require the disclosure of segment
information based on the internal reports regularly reviewed by the Group’s Chief Operating Decision Maker
in order to assess each segment’s performance and to allocate resources to them. The Group has not yet
determined the potential effect of the standard.
– Revised IAS 23 Borrowing Costs removes the option to expense borrowing costs and requires that an entity
capitalise borrowing costs directly attributable to the acquisition, construction or production of a qualifying
asset as part of the cost of that asset. The revised IAS 23 will become mandatory for the Group’s 2009
consolidated fi nancial statements and will constitute a change in accounting policy for the Group. In
accordance with the transitional provisions, IAS 23 will be applied prospectively and therefore there will be
no impact on prior periods in the Group’s 2009 consolidated fi nancial statements.
82
– Revised IAS 1 Presentation of Financial Statements (revised). There have been a few revisions in IAS 1 as part of the
IASB’s improvement project. The revisions mainly concern the introduction of the term total comprehensive
income, which represents changes in equity during a period other than those changes resulting from
transactions with shareholders in their capacity as shareholders. Total comprehensive income may be
presented in either a single statement of comprehensive total recognised income and expense (effectively
combining both the income statement and all non-shareholders changes in equity in a single statement), or in
an income statement and a separate statement of total recognised income and expense. Revised IAS 1, which
becomes mandatory for the Group’s 2009 consolidated fi nancial statements, is expected to have little impact
on the consolidated fi nancial statements. The Group plans to provide total comprehensive income in the
income statement and a separate statement of total recognised income and expense for its 2009 consolidated
fi nancial statements.
– Revised IFRS 3 Business Combinations (2008) incorporates the following changes that are likely to be relevant to
the Group’s operations:
– Contingent consideration will be measured at fair value, with subsequent changes therein recognised in
profi t or loss.
– Transaction costs, other than share and debt issue costs, will be expensed as incurred.
– Any pre-existing interest in the acquiree will be measured at fair value with the gain or loss recognised in
profi t or loss.
– Any non-controlling (minority) interest will be measured at either fair value, or at its proportionate
interest in the identifi able assets and liabilities of the acquiree, on a transaction-by-transaction basis.
Revised IFRS 3, which becomes mandatory for the Group’s 2010 consolidated fi nancial statements, will be
applied prospectively and therefore there will be no impact on prior periods in the Group’s 2010 consolidated
fi nancial statements.
– Amended IAS 27 Consolidated and Separate Financial Statements (2008) requires accounting for changes in
ownership interests by the Group in a subsidiary, while maintaining control, to be recognised as an equity
transaction. When the Group loses control of a subsidiary, any interest retained in the former subsidiary will
be measured at fair value with the gain or loss recognised in the income statement. The amendments to IAS
27, which become mandatory for the Group’s 2010 consolidated fi nancial statements, are not expected to have
a signifi cant impact on the consolidated fi nancial statements.
– Amendment to IFRS 2 Share-based Payment – Vesting Conditions and Cancellations clarifi es the defi nition of vesting
conditions, introduces the concept of non-vesting conditions, requires non-vesting conditions to be refl ected
in grant-date fair value and provides the accounting treatment for non-vesting conditions and cancellations.
The amendments to IFRS 2, will become mandatory for the Group’s 2009 consolidated fi nancial statements,
with retrospective application. The Group has not yet determined the potential effect on the consolidated
fi nancial statements.
– IFRIC 14 The Limit on a Defi ned Benefi t Asset, Minimum Funding Requirements and their Interaction clarifi es that
availability of pension assets is the case when, at the balance sheet date, there is an unconditional right to the
surplus now or in the future by means of reimbursements and/or reductions in future contributions.
Minimum funding requirements may have an impact on the availability. IFRIC 14, will become mandatory for
the Group’s 2009 consolidated fi nancial statements, with retrospective application. The Group has not yet
determined the potential effect of the interpretation.
– IFRIC 16 Hedges of a Net Investment in a Foreign Operation discusses a number of issues in relation to hedging
currency risks on foreign operations (net investment hedges). IFRIC 16 specifi cally confi rms only the risk from
differences between the functional currencies of the parent and the subsidiary can be hedged. Additionally,
currency risks can only be hedged by every (direct or indirect) parent company, as long as the risk is only
hedged once in the consolidated fi nancial statements. IFRIC 16 also determines the hedge instrument of a net
investment hedge can be held by every group company, except for foreign operation itself). IFRIC 16, will
become mandatory for the Group’s 2009 consolidated fi nancial statements, with prospective application. The
Group has not yet determined the potential effect of this interpretation.
83Fugro Annual accounts 2008
– Amendment to IAS 39 Financial Instruments: Recognition and Measurement – Eligible Hedged Items provides additional
guidance concerning specifi c positions that qualify for hedging (‘eligible hedged items’). The amendment to IAS 39,
will become mandatory for the Group’s 2010 consolidated fi nancial statements. The Group has not yet
determined the potential effect of this revised standard.
The following new standards, amendments to standards and interpretations which are not yet effective for the
year ended 31 December 2008, and have not been applied in preparing these consolidated fi nancial statements
will have no or limited impact on the Group’s consolidated fi nancial statements when they become mandatory:
– Amendments to IAS 32 Financial Instruments: Presentation and IAS 1 Presentation of Financial Statements – Puttable
Financial Instruments and Obligations Arising on Liquidation;
– Amendments to IFRS 1 First-time Adoption of IFRSs and IAS 27 Consolidated and Separate Financial Statements – Cost
of an Investment in a Subsidiary, Jointly-controlled Entity or Associate;
– Improvements to IFRSs (2008);
– IFRIC 13 Customer Loyalty Programmes;
– IFRIC 15 Agreements for the Construction of Real Estate;
– IFRIC 17 Distributions of Non-cash Assets to Owners;
– IFRIC 18 Transfers of Assets from Customers.
5.4 B a s i s o f c o n s o l i d a t i o n
5.4.1 Subsidiaries
Subsidiaries are those entities controlled by the Company, taking into account the impact of potential voting
rights that are presently exercisable. Control exists when the Company has the power, directly or indirectly, to
govern the fi nancial and operating policies of an entity so as to obtain benefi ts from its activities. The fi nancial
statements of subsidiaries are included in the consolidated fi nancial statements from the date that control
commences until the date that control ceases.
5.4.2 Associates (equity accounted investees)
Associates are those entities in which the Group has signifi cant infl uence, but no control, over the fi nancial and
operating policies. The consolidated fi nancial statements include the Group’s share of the total recognised gains
and losses of associates using the equity method (equity accounted investees), after adjustments to align the
accounting policies with those of the Group, from the date that signifi cant infl uence commences until the date
that signifi cant infl uence ceases. When the Group’s share of losses exceeds the carrying amount of the associate,
the carrying amount is reduced to nil and recognition of further losses is discontinued except to the extent that
the Group has incurred legal or constructive obligations or has made payments on behalf of the associate.
5.4.3 Other investments
Other investments are those entities in whose activities the Group holds a minority interest and has no control
or signifi cant infl uence. These investments are recognised at fair value and carried at cost in case the fair value
cannot be determined reliably. Dividends received are accounted for in the income statement when these
become due and the investments are carried at cost.
5.4.4 Transactions eliminated on consolidation
Intra-group balances, transactions, and any unrealised gains arising from intra-group transactions, are
eliminated in preparing the consolidated fi nancial statements. Unrealised gains arising from transactions with
equity accounted investees are eliminated to the extent of the Group’s interest in the investee. Unrealised gains
arising from transactions with associates are eliminated against the investment in the associate. Unrealised
losses are eliminated in the same way as unrealised gains, but only to the extent that there is no evidence of
impairment.
84
5.5 Fo r e i g n c u r r e n c y
5.5.1 Foreign currency transactions and translation
Transactions in foreign currencies are translated to EUR at exchange rates at the dates of the transactions.
Monetary assets and liabilities denominated in foreign currencies at the balance sheet date are translated to EUR
at the foreign exchange rate at that date. Foreign exchange differences arising on translation are recognised in
the income statement. Non-monetary assets and liabilities that are measured in terms of historical cost in a
foreign currency are translated using the exchange rate at the balance sheet date. Non-monetary assets and
liabilities denominated in foreign currencies that are stated at fair value are translated to EUR at foreign
exchange rates effective at the date the value was determined. Foreign currency differences arising on
translation are recognised in profi t or loss, except for exchange differences arising on the translation of a
fi nancial liability designated as a hedge of the net investment in a foreign operation.
A summary of the main currency exchange rates applied in the year under review and the preceding years reads
as follows:
USD at
year-end
USD
average
GBP at
year-end
GBP
average
2008 0.71 0.68 1.05 1.25
2007 0.68 0.73 1.36 1.46
2006 0.76 0.79 1.49 1.47
2005 0.85 0.81 1.46 1.46
2004 0.73 0.81 1.42 1.47
5.5.2 Financial statements of foreign operations
The assets and liabilities of foreign operations, including goodwill and fair value adjustments arising on
consolidation, are translated to EUR at foreign exchange rates effective at the balance sheet date. The income and
expenses of foreign operations are translated to EUR at rates approximating the foreign currency exchange rates
effective at the dates of the transactions. Foreign exchange differences arising on translation are recognised
directly in the Translation reserve, a separate component of equity since 1 January 2003, the Group’s date of
transition to IFRS. When a foreign operation is disposed of, in part or in full, the relevant amount in the
translation reserve is transferred to profi t or loss.
5.5.3 Net investment in foreign operations
Exchange differences arising from the translation of the net investment in foreign operations are taken to the
Translation reserve. They are released into the income statement upon disposal.
The portion of the gain or loss on an instrument used to hedge a net investment in a foreign operation that is
determined to be an effective hedge is recognised directly in equity. The ineffective portion is recognised
immediately in the income statement.
5.6 D e t e r m i n a t i o n o f f a i r va l u e s
Some of the Group’s accounting policies and disclosures require the determination of fair values, for both
fi nancial and non-fi nancial assets and liabilities. Fair values have been determined for measurement and/or
disclosure purposes based on the following methods. Additional information on the determination of fair values
is disclosed in the notes of the specifi c asset or liability, if applicable.
85Fugro Annual accounts 2008
5.6.1 Property, plant and equipment
The fair value of property, plant and equipment recognised as a result of a business combination is based on
market values. The market value of property is the estimated amount for which a property could be exchanged
on the date of valuation between a willing buyer and a willing seller in an arm’s length transaction after proper
marketing wherein the parties had each acted knowledgeably, prudently and without compulsion. The market
value of items of plant, equipment, fi xtures and fi ttings is based on the quoted market prices for similar items.
5.6.2 Intangible assets
The fair value of patents and trademarks acquired in a business combination is based on the discounted
estimated royalty payments that have been avoided as a result of the patent or trademark being owned. The fair
value of other intangible assets is based on the discounted cash fl ows expected to be derived from the use and
eventual sale of the assets.
5.6.3 Inventories
The fair value of inventory acquired in a business combination is determined based on its estimated selling price
in the ordinary course of business less the estimated costs of completion and sale, and a reasonable profi t margin
based on the effort required to complete and sell the inventory.
5.6.4 Trade and other receivables
The fair value of trade and other receivables, at initial recognition, is estimated as the present value of future
cash fl ows, discounted at the market rate of interest at the reporting date.
5.6.5 Derivatives
The fair value of forward exchange contracts is based on the listed market price, if available. If a listed market
price is not available, then fair value is estimated by discounting the difference between the contractual forward
price and the current forward price for the residual maturity of the contract using a risk-free interest rate (based
on government bonds).
5.6.6 Non-derivative financial liabilities
Fair value, which is determined for disclosure purposes, is calculated based on the present value of future
repayments and interest cash fl ows, discounted at the market rate of interest at the reporting date. In respect of
the liability component of convertible notes, the market rate of interest is determined by reference to similar
liabilities that do not have a conversion option. For fi nance leases the market rate of interest is determined by
reference to similar lease agreements.
5.6.7 Share based payment transactions
The valuation principles used for determining the expectation value are as follows:
The date of valuation is equal to the date of granting (year-end). The duration of the options is six years.
The volatility is based on the historical analysis of the daily share price fl uctuations over the period 1993 through
the reporting date. The expected return on dividend is based on a historical analysis of the dividends paid out
during the period 1994 through reporting date. Concerning early departure, different percentages for different
categories of staff are used: Directors 1%, Executive Committee members 2%, managers of operating companies
7%. The expected behaviour for exercising the options by the Directors is estimated till the end of the vesting
period and for the other two groups with a multiple of three.
5.7 D e r i va t i ve f i n a n c i a l i n s t r u m e n t s a n d h e d g i n g
5.7.1 Derivative financial instruments
The Group uses derivative fi nancial instruments to hedge its exposure to foreign exchange risks arising from
operational and fi nancing activities. In accordance with its treasury policy, the Group does not hold or issue
derivative fi nancial instruments for trading purposes. Derivatives that do not qualify for hedge accounting are
accounted for as trading instruments.
86
Derivative fi nancial instruments are recognised initially at fair value; attributable transaction costs are
recognised in profi t or loss when incurred. Subsequent to initial recognition, measurement of derivative
fi nancial instruments is at fair value. The gain or loss on remeasurement at fair value is recognised immediately
in the income statement except when hedge accounting is applied. Recognition of any resultant gain or loss on
hedge accounting depends on the nature of the item being hedged (refer to accounting policy 5.7.2 and beyond).
5.7.2 Cash flow hedges
Where a derivative fi nancial instrument is designated as a hedge of the variability in cash fl ows of a recognised
asset or liability, or a highly probable forecasted transaction, the effective part of any gain or loss on the
derivative fi nancial instrument is recognised directly in equity. When the forecasted transaction subsequently
results in the recognition of a non-fi nancial asset or a non-fi nancial liability, the associated cumulative gain or
loss is removed from equity and included in the initial cost or other carrying amount of the non-fi nancial asset
or liability.
If the hedge of a forecasted transaction subsequently results in the recognition of a fi nancial asset or a fi nancial
liability, the associated gains and losses that were recognised directly in equity are classifi ed into profi t or loss in
the same period or periods during which the asset acquired or liability assumed affects profi t or loss. For cash
fl ow hedges, other than those covered by the preceding two policy statements, the associated cumulative gain or
loss is removed from equity and recognised in the income statement in the same period or periods during which
the hedged forecast transaction affects profi t or loss. The ineffective part of any gain or loss is immediately
recognised in the income statement.
When a hedging instrument expires or is sold, terminated or exercised, or the entity revokes designation of the
hedge relationship but the hedged forecasted transaction is still expected to occur, the cumulative gain or loss at
that point remains in equity and is recognised in accordance with the above policy when the transaction occurs.
If the hedged transaction is no longer expected to take place, the cumulative gain or loss immediately recognised
in equity is recognised in the income statement.
5.7.3 Hedge of monetary assets and liabilities
Where a derivative fi nancial instrument is used to hedge economically the foreign exchange exposure of a
recognised monetary asset or liability any gain or loss on the hedging instrument is recognised in the income
statement.
5.8 P r o p e r t y , p l a n t a n d e q u i p m e n t
5.8.1 Owned assets
Property, plant and equipment are stated at cost less accumulated depreciation and impairment losses (refer
accounting policy 5.14). The cost of self-constructed assets includes the cost of materials, direct labour and an
appropriate proportion of overheads directly attributable to the construction of the assets.
Finance costs attributable to the acquisition or construction of qualifying assets is recognised in the income
statement when they occur.
Property, plant and equipment that is being constructed or developed for future use is classifi ed as property,
plant and equipment under construction and stated at cost until construction or development is complete, at
which time it is reclassifi ed as land and buildings or plant and equipment or vessels or other property, plant and
equipment.
Where an item of property, plant and equipment comprises major components having different useful lives,
these components are depreciated separately.
5.8.2 Leased assets
Leases with terms in which the Group assumes substantially all the risks and rewards of ownership are classifi ed
as fi nance leases. Plant and equipment acquired by way of fi nance lease is initially stated at an amount equal to
the lower of its fair value and the present value of the minimum lease payments at inception of the lease, less
accumulated depreciation (refer accounting policy 5.8.4) and impairment losses (refer accounting policy 5.14).
87Fugro Annual accounts 2008
Subsequent measurement is in accordance with the applicable accounting policy. Operating leases are not
recognised in the Group’s balance sheet. Lease payments are accounted for as described in accounting policy
5.22.2 and 5.22.3.
5.8.3 Subsequent cost
The Group recognises in the carrying amount of an item of property, plant and equipment the cost of replacing
part of such an item when that cost is incurred if it is probable that the future economic benefi ts embodied with
the item will fl ow to the Group and the cost of the item can be measured reliably. All other costs are recognised
in the income statement as an expense as incurred.
5.8.4 Depreciation
Depreciation is charged to the income statement on a straight-line basis over the estimated useful lives of each
part of an item of property, plant and equipment.
Depreciation methods, useful lives and residual values are reassessed at balance sheet date. The estimated useful
life of the different items of property, plant and equipment are:
Category Years
Land and buildings
Land infi nite
Buildings 20 – 40
Fixtures and fi ttings 5 – 10
Vessels
Vessels and platforms 2 – 25
Plant and equipment
Plant and equipment 4 – 10
Survey equipment 3 – 5
Aircraft 5 – 10
AUVs and ROVs 6 – 7
Computers and offi ce equipment 3 – 4
Transport equipment 4
Other
Maintenance 3 – 5
Used plant and machinery 1 – 2
5.9 I n t a n g i b l e a s s e t s
5.9.1 Goodwill
As part of its transition to IFRSs, the Group elected to restate only those business combinations that occurred on
or after 1 January 2003. In respect of acquisitions prior to 1 January 2003, goodwill represents the amount
recognised under the Group’s previous accounting framework, Dutch GAAP.
All business combinations are accounted for by applying the ‘purchase accounting method’. Goodwill
subsequent to 1 January 2003 represents amounts arising on acquisition of subsidiaries and equity accounted
investees. In respect of business acquisitions, goodwill represents the difference between the cost of the
acquisition and the fair value of the net identifi able assets, liabilities and contingent liabilities acquired.
The excess of the Group’s interest in the net fair value of identifi able assets, liabilities and contingent liabilities
88
over cost is recognised directly in the income statement. Goodwill arising on the acquisition of a minority
interest in a subsidiary represents the excess of the cost of the additional investment over the carrying amount
of the net assets acquired at the date of exchange.
Goodwill is stated at cost less any accumulated impairment losses. Goodwill is allocated to cash generating units
and is not amortised but is tested for impairment annually or when there is an indication for impairment (refer
accounting policy 5.14). In respect of equity accounted investees, the carrying amount of goodwill is included in
the carrying amount of the investment.
5.9.2 Research and development
Expenditure on research activities, undertaken with the prospect of gaining new scientifi c or technical
knowledge and understanding, is recognised in the income statement as an expense as incurred.
The Group spends signifi cant amounts on research. Since the majority of these activities take place within
contracts with third parties it is not feasible to properly determine the total costs spent for these technical
developments. Expenditure on development activities, whereby research fi ndings are applied to a plan or design
for new or improved software, is capitalised if the product is technically and commercially feasible and the
Group has suffi cient resources to complete development. The capitalised expenditure includes the cost of
materials, direct labour and an attributable proportion of direct overheads. The estimated useful life of
capitalised development costs is fi ve years.
5.9.3 Software and other intangible assets
Other intangible assets acquired or developed by the Group are stated at cost less accumulated amortisation
and impairment losses (refer accounting policy 5.14). The estimated useful life of software is fi ve years.
5.9.4 Subsequent expenditure
Subsequent expenditure on capitalised intangible assets is capitalised only when it increases the future
economic benefi ts embodied in the specifi c asset to which it relates. All other expenditure, including
expenditure on internally generated goodwill is expensed as incurred.
5.9.5 Amortisation
Amortisation is charged to the income statement on a straight-line basis over the estimated useful lives of
intangible assets unless such lives are indefi nite. Goodwill and intangibles assets with an indefi nite life are
systematically tested for impairment annually or when there is an indication for impairment. Other intangible
assets (software) are amortised from the date they are available for use.
5.10 Equity accounted investees
Associates are those entities in which the Group has signifi cant infl uence, but no control, over the fi nancial and
operating policies. The consolidated fi nancial statements include the Group’s share of the total recognised gains
and losses of associates using the equity method (equity accounted investees), after adjustments to align the
accounting policies with those of the Group, from the date that signifi cant infl uence commences until the date
that signifi cant infl uence ceases. When the Group’s share of losses exceeds the carrying amount of the associate,
the carrying amount is reduced to nil and recognition of further losses is discontinued except to the extent that
the Group has incurred legal or constructive obligations or has made payments on behalf of the associate.
5.11 I n ve n t o r i e s
5.11.1 Seismic data libraries
The seismic data libraries consist of completed and in progress collection of seismic data that can be sold non-
exclusively to one or more clients. These seismic data libraries are valued at the lower of cost or net realisable
value. Net realisable value is the estimated selling price in the ordinary course of business, less the estimated
costs of completion and selling expenses. Cost includes direct costs and an attributable portion of direct
overheads, but exclude a profi t element. As it is expected that sales lead to a lower net realisable value, these
89Fugro Annual accounts 2008
expected decreases in value are taken into account at the moment of sale throughout the fi nancial year. The
Group evaluates the net realisable value on a regular basis and reassesses the net realisable value at each balance
sheet date.
5.11.2 Work in progress
Work in progress concerning services rendered on work not yet completed, is stated at cost plus profi t recognised
to date (refer accounting policy 5.21.1) less a provision for foreseeable losses and less progress billings. Costs
include all expenditure related directly to specifi c projects and an allocation of fi xed and directly attributable
overheads incurred in the Group’s contract activities based on normal operating capacity. If payments received
from customers exceed the income recognised, then the difference is presented as advance instalments to work
in progress.
5.11.3 Other inventories
Other inventories are stated at the lower of cost or net realisable value. The cost of other inventories is based on
the fi rst-in fi rst-out principle and includes expenditure incurred in acquiring the inventories and bringing them
to their existing location and condition.
5.12 Trade and other receivables
Services rendered on contract work completed but not yet billed to customers are included in trade receivables
as unbilled revenues.
Trade and other receivables are recognised initially at fair value plus any directly attributable transaction costs.
Subsequent to initial recognition they are measured at amortised cost using the effective interest method less,
any impairment losses (refer accounting policy 5.14).
5.13 C a s h a n d c a s h e q u i va l e n t s
Cash and cash equivalents comprising cash balances and call deposits are recognised initially at fair value plus
any directly attributable transaction costs. Subsequent to initial recognition they are measured at amortised cost
using the effective interest method less, any impairment losses. Bank overdrafts that are repayable on demand
and form an integral part of the Group’s cash management are included as a component of cash and cash
equivalents for the purpose of the statement of cash fl ows.
5.14 I m p a i r m e n t
The carrying amounts of assets other than inventories, assets arising from employee benefi ts and deferred tax
assets (refer accounting policy 5.23), are reviewed at each balance sheet date to determine whether there is any
indication of impairment. If any such indication exists, the asset’s recoverable amount is calculated.
For goodwill, intangible assets with an indefi nite useful life and assets that are not available for use, the
recoverable amount is determined at each balance sheet date or when there is an indication for impairment.
An impairment loss is recognised whenever the carrying amount of an asset or its cash generating unit exceeds
its recoverable amount. Impairment losses are recognised in the income statement.
Impairment losses recognised in respect of cash-generating units are allocated fi rst to reduce the carrying
amount of any goodwill allocated to the cash-generating units and then to reduce the carrying amount of the
other assets in the unit on a pro rato basis.
5.14.1 Calculation of recoverable amount
The recoverable amount of the Group’s investments in held-to-maturity securities and receivables carried at
amortised cost is calculated at the present value of estimated future cash fl ows, discounted at the effective
interest rate computed at initial recognition of these assets. Short-term receivables are not discounted.
The recoverable amount of assets is the higher of their net selling price and value in use. In assessing the value in
use, the estimated future cash fl ows are discounted to their present value using a pre-tax discount rate that
refl ects current market assessments of the time value of money and the risks specifi c to the asset. For an asset
that does not generate largely independent cash infl ows, the recoverable amount is determined for the cash-
generating unit to which the asset belongs.
90
5.14.2 Reversals of impairment
An impairment loss in respect of a held-to-maturity security or receivable carried at amortised cost is reversed if
the subsequent increase in recoverable amount can be related objectively to an event occurring after the
impairment loss was recognised. An impairment loss in respect of goodwill is not reversed in a subsequent
period. In respect of other assets, an impairment loss is reversed if the estimates in the calculation of the
recoverable amount have changed. Prior period impairments are reviewed at balance sheet date to determine if
there is an indication that an impairment loss recognised in prior periods may no longer exist or may have
decreased.
An impairment loss is reversed only to the extent that the asset’s carrying amount does not exceed the carrying
amount that would have been determined, net of depreciation or amortisation, if no impairment loss had been
recognised.
5.15 S h a r e c a p i t a l
5.15.1 Share capital
Share capital is classifi ed as equity. The Group has not issued preference shares. The term ‘shares’ as used in the
Annual Accounts should, with respect to shares issued by Fugro N.V., be construed to include certifi cates of
shares (also referred to as ‘depositary receipts’ for shares) issued by Stichting Administratiekantoor Fugro (also
referred to as ‘Fugro Trust Offi ce Foundation’ or ‘Fugro Trust Offi ce’), unless the context otherwise requires or
unless it is clear from the context that this is not the case.
5.15.2 Repurchase and sale of shares
When shares are repurchased or sold, the amount of the consideration paid or received, including direct
attributable costs, is recognised as a change in equity. Repurchased shares and related results are reported
as reserve for own shares and presented separately as a component of total equity.
5.15.3 Dividends
Dividends are recognised as a liability in the period in which they are declared.
5.16 C o n ve r t i b l e n o t e s
Convertible notes that can be converted to share capital at the option of the holder, where the number of shares
issued does not vary with changes in their fair value, are accounted for as compound fi nancial instruments, net
of attributable transaction costs. Transaction costs that relate to the issue of a compound fi nancial instrument
are allocated to the equity and the liability components on a pro rata basis. The equity component of the
convertible notes is calculated as the excess of the issue proceeds over the present value of the future interest and
principal payments, discounted at the market interest rate applicable to similar liabilities that do not have a
conversion option. The interest expense recognised in the income statement is calculated using the effective
interest rate method.
5.17 L o a n s a n d b o r r ow i n g s
Borrowings are recognised initially at fair value, less attributable transaction costs. Subsequent to initial
recognition, borrowings are stated at amortised cost using the effective interest rate method.
5.18 E m p l oy e e b e n e f i t s
5.18.1 Defined contribution plans
Obligations for contributions to defi ned contribution pension plans are recognised as an expense
in the income statement when they are incurred.
91Fugro Annual accounts 2008
5.18.2 Defined benefit plans
The Group’s net obligation in respect of defi ned benefi t pension plans is calculated separately for each plan by
calculating the present value of future benefi t that employees have earned in return for their service in the
current and prior periods; that benefi t is discounted to determine the present value, and of any unrecognised
past service costs and the fair value of plan assets is deducted. The discount rate is the yield at balance sheet date
on high quality corporate or government bonds that have maturity dates approximating the terms of the Group’s
obligations. The calculation is performed by qualifi ed actuaries using the projected unit credit method. When
the benefi ts of a plan are improved, the portion of the increased benefi t relating to past service by employees is
recognised as an expense in the income statement on a straight-line basis over the average period until the
benefi ts become vested. To the extent that the benefi ts vest immediately, the expense is recognised immediately
in the income statement.
The Group recognises all actuarial gains and losses in the period in which they occur in the statement of
recognised income and expense.
Where the calculation results in a benefi t to the Group, the recognised asset is limited to the net total of any
unrecognised past service costs and the present value of any future refunds from the plan or reductions in future
contributions to the plan.
5.18.3 Long-term employee benefits
The Group’s net obligation in respect of long-term employee benefi ts, other than pension plans, is the amount
of future benefi t that employees have earned in return for their service in the current and prior periods.
The obligation is calculated using the projected unit credit method and is discounted based on high quality
corporate or government bonds that have maturity dates approximating the terms of the Group’s obligations.
Any actuarial gains or losses are recognised in the income statement in the period in which they arise.
5.18.4 Share based payment transactions
The share option programme allows Group employees to acquire shares of the Company. The fair value of options
is measured at grant date and recognised as an employee expense with a corresponding increase in equity over
the period during which the employees become unconditionally entitled to the options. The fair value of the
options granted from 7 November 2002 onwards is measured using a binominal model, taking into account the
terms and conditions upon which the options were granted. The amount recognised as an expense is adjusted
annually to refl ect the actual number of share options that can be exercised.
5.19 P r o v i s i o n s
A provision is recognised when the Group has a legal or constructive obligation as result of a past event, and it is
probable that an outfl ow of economic benefi ts will be required to settle the obligation. If the effect is material,
provisions are determined by discounting the expected future cash fl ows at a pre-tax rate that refl ects current
market assessments of the time value of money and, where appropriate, the risks specifi c to the liability.
5.19.1 Restructuring
A provision for restructuring is recognised when the Group has approved a detailed and formal restructuring
plan, and the restructuring has either commenced or has been announced publicly. Future operating costs are
not provided for.
5.19.2 Onerous contracts
A provision for onerous contracts is recognised when the expected benefi ts to be derived by the Group from
a contract are lower than the unavoidable cost of meeting its obligations under the contract.
5.20 Tr a d e a n d o t h e r p a ya b l e s
Trade and other payables are recognised initially at fair value less any directly attributable transaction costs.
Subsequent to initial recognition they are measured at amortised cost using the effective interest method.
92
5.21 R e ve n u e
5.21.1 Services rendered
Revenue from services rendered to third parties is recognised in the income statement in proportion to the stage
of completion of the transaction at the balance sheet date. The stage of completion is assessed using the
proportion of contract cost incurred for work performed to balance sheet date compared to total contract cost as
this method is most appropriate for the majority of the services provided by the Group (which are mainly based
on daily rates for staff and equipment or rates per (square) mile for vessels and airplanes).
For fi xed price contracts revenue is recognised when: (i) the total contract revenue can be measured reliably; (ii) it
is probable that future economic benefi ts will fl ow to the Group as a result of that contract; (iii) contract costs to
completion and the stage of completion at the balance sheet date can be measured reliably; and (iv) contract
costs can be identifi ed clearly and measured reliably so that actual cost can be compared with prior estimates.
In case of cost plus contracts (mainly daily rates or rates per (square) mile), revenue of the contract is recorded
when: (i) it is probable that future economic benefi ts will fl ow to the Group as a result of that contract; and (ii)
contract costs can be identifi ed clearly and measured reliably. Revenue from the sale of goods is recognised when
the signifi cant risks and rewards of ownership have been transferred to the buyer, recovery of the consideration
is probable, the associated costs and possible return of goods can be estimated reliably, and there is no
continuing management involvement with the goods.
No revenue is recognised if there are signifi cant uncertainties regarding recovery of the consideration due,
associated costs or the possible return of goods. An expected loss on a contract is recognised immediately in
the income statement.
5.21.2 Seismic data
Revenue on non-exclusive seismic data libraries is recognised in the period when the data has been collected,
processing has been completed and data has (substantially) been delivered to the client. Pre-commitments on
seismic data library sales are recorded as advance instalments unless data collection has commenced, then
revenue is recognised based on the stage of completion.
Separate (service) components/deliverables, such as annual maintenance fees or training fees, are accounted
for over the period in which these services have been delivered to the customer.
5.21.3 Royalty, software licences and subscription income
Royalty, software licences and subscription income are recognised in the period during which the underlying
services have been provided.
5.21.4 Government grants
An unconditional government grant is recognised in the balance sheet when the grant becomes receivable.
Any other government grant is initially recognised as deferred income when there is reasonable assurance that it
will be received and that the Group will comply with the conditions attached to it. Grants that compensate the
Group (partly) for expenses incurred are recognised in the income statement on a systematic basis in the same
periods in which the expenses are incurred. Grants that (partly) compensate the Group for the cost of an asset are
recognised in the income statement on a systematic basis over the useful life of the asset.
5.21.5 Other operating income
Other operating income concerns income not related to the key business activities of the Group, like income
from the sale of non-monetary assets and/or liabilities, exceptional and/or non-recurring income.
5.22 E x p e n s e s
5.22.1 Third party costs (cost of sales)
Third party costs are matched with related revenues on contracts and accounted for on a historical cost basis.
Net revenue own services is the sum of revenue realised from third parties less third party cost.
93Fugro Annual accounts 2008
5.22.2 Operating lease payments
Payments made under operating leases are recognised in the income statement on a straight-line basis over
the term of the lease. Lease incentives received are recognised in the income statement as an integral part of
the total lease expense.
5.22.3 Finance lease payments
Minimum lease payments are apportioned between the fi nance expense and the reduction of the outstanding
liability. The fi nance expense is allocated to each period in such a way that this results in a constant periodical
interest rate for the remaining balance of the liability during the lease term.
5.22.4 Net finance costs
Net fi nance costs comprise interest expense on borrowings calculated using the effective interest rate method,
accruing of interest on liabilities of employee benefi ts, interest income on funds invested, expected return on
plan assets, dividend income, foreign exchange gains and losses, and gains and losses on hedging instruments
that are recognised in the income statement (refer accounting policy 5.7).
Interest income is recognised in the income statement as it accrues, taking into account the effective yield on
the asset. Dividend income is recognised in the income statement on the date the entity’s right to receive the
payments is established which in the case of quoted shares is the ex-dividend date.
The interest component of fi nance lease payments is recognised in the income statement using the effective
interest rate method. Exchange gains and losses are reported on a net basis.
5.23 I n c o m e t a x
Income tax on the profi t or loss for the year comprises current and deferred tax. Income tax is recognised in the
income statement except to the extent that it relates to items recognised directly in equity, in which case it is
recognised in equity.
Current tax is the expected tax payable on the taxable income for the year, using tax rates enacted or
substantially enacted at the balance sheet date, and any adjustment to tax in respect of previous years.
Deferred tax is determined using the balance sheet method, providing for temporary differences between the
carrying amounts of assets and liabilities for fi nancial reporting purposes and the amounts used for taxation
purposes. The following temporary differences are not provided for: goodwill not deductible for tax purposes,
the initial recognition of assets or liabilities that affect neither accounting nor taxable profi t and differences
relating to investments in subsidiaries to the extent that they will probably not reverse in the foreseeable future.
The amount of deferred tax is based on the expected manner of realisation or settlement of the carrying amount
of assets and liabilities, using tax rates enacted or substantially enacted at the balance sheet date.
A deferred tax asset is recognised only to the extent that it is probable that future taxable profi ts will be available
against which the asset can be utilised. Deferred tax assets are reduced to the extent that it is no longer probable
that the related tax benefi t will be realised.
Additional income taxes that arise from the distribution of dividends are recognised at the same time as the
liability to pay the related dividend.
5.24 S t a t e m e n t o f c a s h f l ow s
The statement of cash fl ows is prepared using the indirect method. The cash fl ow statement distinguishes
between operational, investing and fi nancing activities. Cash fl ows in foreign currencies are converted at the
exchange rate at the dates of the transactions. Currency exchange differences on cash held are separately shown.
Payments and receipts of corporate taxes are included as cash fl ow from operational activities and interest paid
is shown as cash fl ow from operating activities. Cash fl ows as a result from acquisition/divestment of fi nancial
interest in subsidiaries and equity accounted investees are included as cash fl ow from investment activities,
taking into account the available cash in these interests. Dividends paid are part of the cash fl ow from fi nancing
activities.
94
5.25 S e g m e n t r e p o r t i n g
Segment information is presented in respect of the Group’s business and geographical segments. The primary
format, business segments, is based on the Group’s management and internal reporting structure. Inter-segment
pricing is determined on an arm’s length basis. Segment results, assets and liabilities include items directly
attributable to a segment as well as those that can be allocated on a reasonable basis. Unallocated items comprise
mainly deferred tax, loans and borrowings and corporate assets and expenses. Segment capital expenditure is
the total amount incurred during the period to acquire segment assets that are expected to be used for more
than one period. The Group defi nes a division as a segment in its reports.
5.25.1 Business segments
As an engineering fi rm with operations throughout the world, the Group delivers its services to clients located
all over the globe and collects and interprets data related to the earth’s surface and the soil and rock beneath.
On the basis of this data the Group provides advice, generally for purposes related to the oil and gas industry,
the mining industry and the construction industry. The Group recognises three groups of services as business
segments:
The Geotechnical division provides a group of related services. These concern investigations and advice
regarding the physical characteristics of the soil, foundation design and materials for construction.
The activities are mainly design related. The client base of the pre-design phase activities is focussed on advice
concerning the prime question of whether the foundation of a structure will be safe, both on- and offshore.
Laboratory testing supports the reporting service. In principle geotechnical services are rendered in a very early
stage of a development. The Survey division provides a group of related services. This concerns positioning
services, geological advice, topographic, hydrographical and geological mapping and support services for
construction projects and data management. These activities are mainly provided in the installation,
construction and maintenance phase. In a large number of cases, Group companies supply information like
weather forecasting, GNSS correction signals for precise positioning (the signals are also used for rig moves).
Moreover, special equipment is used to assist clients with construction of offshore structures (ROV, AUV, etc).
In general these activities do not include soil sampling nor penetration of the earth’s surface. Survey services are
rendered during a construction phase. The Geoscience division provides a range of related services. This concerns
gathering and interpreting geophysical data, quantitative and qualitative estimates of oil, gas, mineral and water
resources leading to advising on the optimisation of their production. These are mainly exploration related
activities (to determine what resources are there). The clients get advice about the potential presence of oil/gas,
minerals and water and also about the quantitative and qualitative data regarding these natural resources.
The division also has techniques which help clients to assess how to extract the natural resources in the most
optimal way. The segments are managed on a worldwide basis, and operate in four principal geographical areas,
The Netherlands, Europe other/Africa, Middle East/Asia/Australia and the Americas. In presenting information
on the basis of geographical segments, segment revenue is based on the geographical location of operating
companies. Segment assets are based on the geographical location of the assets. Inter-segment pricing is
determined on an arm’s length basis.
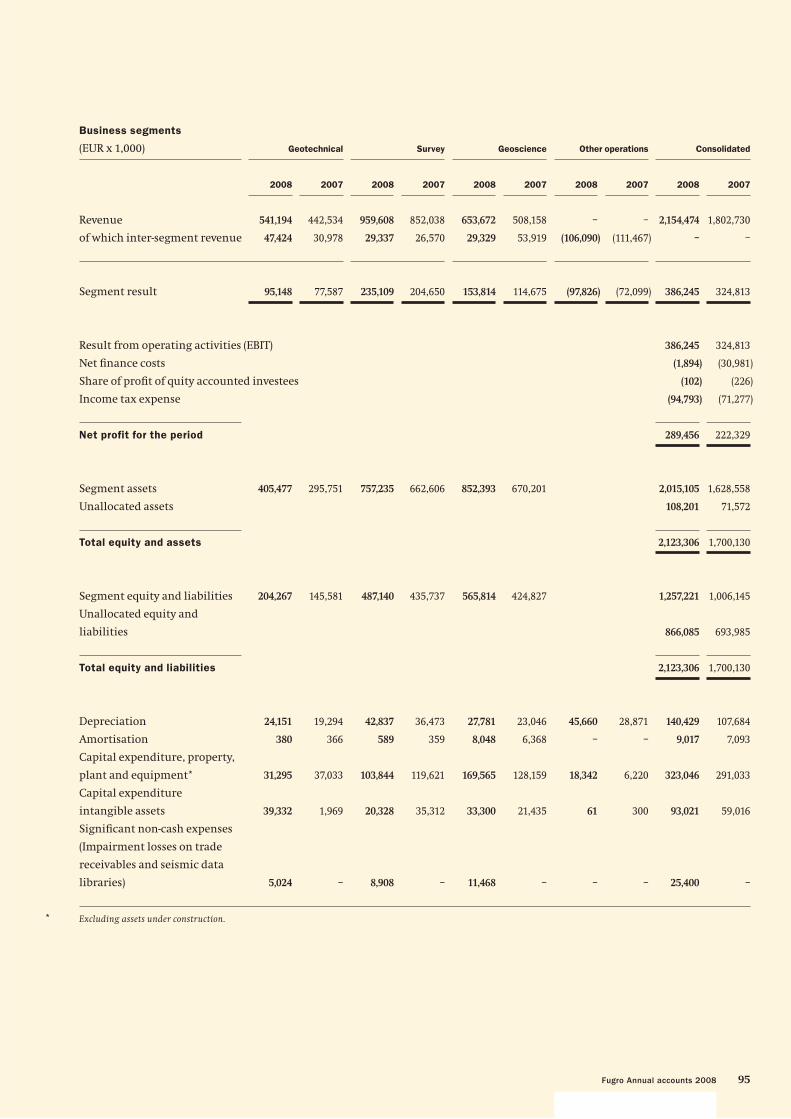
95Fugro Annual accounts 2008
Business segments
(EUR x 1,000) Geotechnical Survey Geoscience Other operations Consolidated
2008 2007 2008 2007 2008 2007 2008 2007 2008 2007
Revenue 541,194 442,534 959,608 852,038 653,672 508,158 – – 2,154,474 1,802,730
of which inter-segment revenue 47,424 30,978 29,337 26,570 29,329 53,919 (106,090) (111,467) – –
Segment result 95,148 77,587 235,109 204,650 153,814 114,675 (97,826) (72,099) 386,245 324,813
Result from operating activities (EBIT) 386,245 324,813
Net fi nance costs (1,894) (30,981)
Share of profi t of quity accounted investees (102) (226)
Income tax expense (94,793) (71,277)
Net profit for the period 289,456 222,329
Segment assets 405,477 295,751 757,235 662,606 852,393 670,201 2,015,105 1,628,558
Unallocated assets 108,201 71,572
Total equity and assets 2,123,306 1,700,130
Segment equity and liabilities 204,267 145,581 487,140 435,737 565,814 424,827 1,257,221 1,006,145
Unallocated equity and
liabilities 866,085 693,985
Total equity and liabilities 2,123,306 1,700,130
Depreciation 24,151 19,294 42,837 36,473 27,781 23,046 45,660 28,871 140,429 107,684
Amortisation 380 366 589 359 8,048 6,368 – – 9,017 7,093
Capital expenditure, property,
plant and equipment* 31,295 37,033 103,844 119,621 169,565 128,159 18,342 6,220 323,046 291,033
Capital expenditure
intangible assets 39,332 1,969 20,328 35,312 33,300 21,435 61 300 93,021 59,016
Signifi cant non-cash expenses
(Impairment losses on trade
receivables and seismic data
libraries) 5,024 – 8,908 – 11,468 – – – 25,400 –
* Excluding assets under construction.
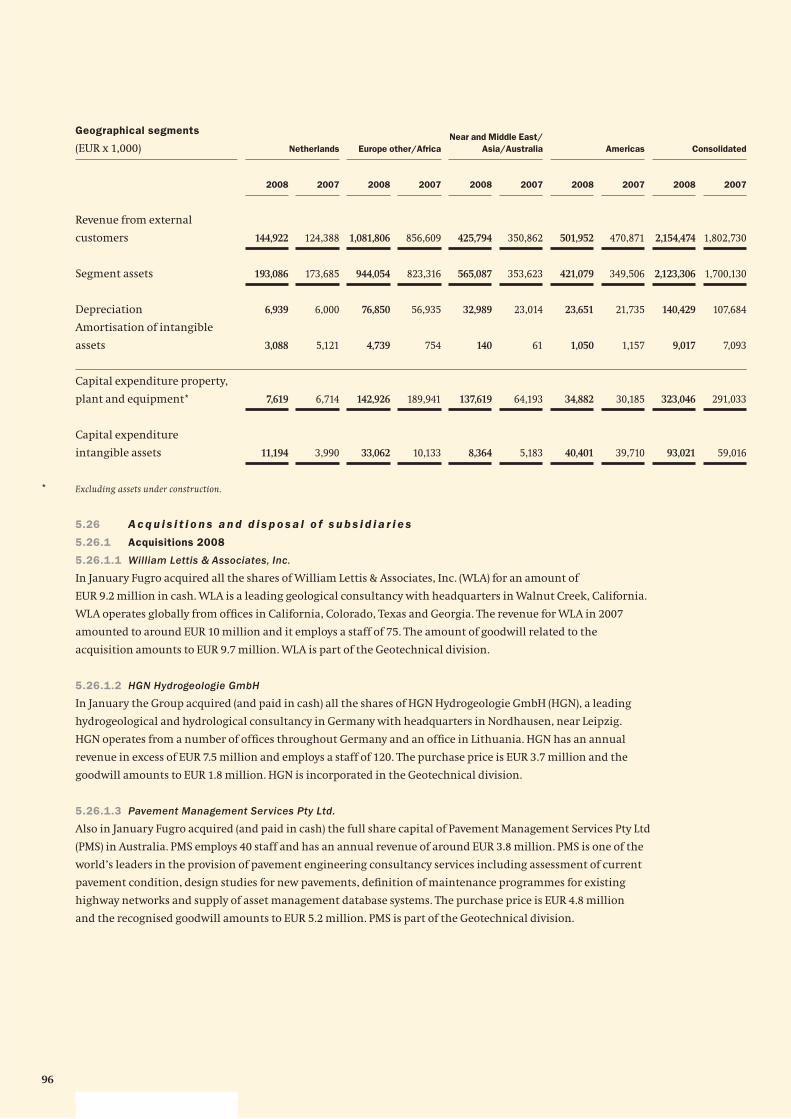
96
Geographical segments
(EUR x 1,000) Netherlands Europe other/Africa
Near and Middle East/
Asia/Australia Americas Consolidated
2008 2007 2008 2007 2008 2007 2008 2007 2008 2007
Revenue from external
customers 144,922 124,388 1,081,806 856,609 425,794 350,862 501,952 470,871 2,154,474 1,802,730
Segment assets 193,086 173,685 944,054 823,316 565,087 353,623 421,079 349,506 2,123,306 1,700,130
Depreciation 6,939 6,000 76,850 56,935 32,989 23,014 23,651 21,735 140,429 107,684
Amortisation of intangible
assets 3,088 5,121 4,739 754 140 61 1,050 1,157 9,017 7,093
Capital expenditure property,
plant and equipment* 7,619 6,714 142,926 189,941 137,619 64,193 34,882 30,185 323,046 291,033
Capital expenditure
intangible assets 11,194 3,990 33,062 10,133 8,364 5,183 40,401 39,710 93,021 59,016
* Excluding assets under construction.
5.26 A c q u i s i t i o n s a n d d i s p o s a l o f s u b s i d i a r i e s
5.26.1 Acquisitions 2008
5.26.1.1 William Lettis & Associates, Inc.
In January Fugro acquired all the shares of William Lettis & Associates, Inc. (WLA) for an amount of
EUR 9.2 million in cash. WLA is a leading geological consultancy with headquarters in Walnut Creek, California.
WLA operates globally from offi ces in California, Colorado, Texas and Georgia. The revenue for WLA in 2007
amounted to around EUR 10 million and it employs a staff of 75. The amount of goodwill related to the
acquisition amounts to EUR 9.7 million. WLA is part of the Geotechnical division.
5.26.1.2 HGN Hydrogeologie GmbH
In January the Group acquired (and paid in cash) all the shares of HGN Hydrogeologie GmbH (HGN), a leading
hydrogeological and hydrological consultancy in Germany with headquarters in Nordhausen, near Leipzig.
HGN operates from a number of offi ces throughout Germany and an offi ce in Lithuania. HGN has an annual
revenue in excess of EUR 7.5 million and employs a staff of 120. The purchase price is EUR 3.7 million and the
goodwill amounts to EUR 1.8 million. HGN is incorporated in the Geotechnical division.
5.26.1.3 Pavement Management Services Pty Ltd.
Also in January Fugro acquired (and paid in cash) the full share capital of Pavement Management Services Pty Ltd
(PMS) in Australia. PMS employs 40 staff and has an annual revenue of around EUR 3.8 million. PMS is one of the
world’s leaders in the provision of pavement engineering consultancy services including assessment of current
pavement condition, design studies for new pavements, defi nition of maintenance programmes for existing
highway networks and supply of asset management database systems. The purchase price is EUR 4.8 million
and the recognised goodwill amounts to EUR 5.2 million. PMS is part of the Geotechnical division.
97Fugro Annual accounts 2008
5.26.1.4 Roadware Group Inc.
In February Fugro acquired (and paid in cash) all the share capital of Roadware Group Inc, a leading provider of
technology and services for the assessment and mapping of highway and other pavement structures, for an
amount of EUR 3.3 million. Roadware’s headquarter and assembly centre is in Paris, Ontario, Canada.
The revenue for the fi nancial year 2007 was more than EUR 9 million and at the time of acquisition the company
employs 130 staff. The recognised goodwill amounts to EUR 10.4 million. Roadware Group Inc is included in the
Geotechnical division.
5.26.1.5 Electro Magnetic Marine Exploration Technologies (EMMET)
In March the Group acquired (and paid in cash) 60% of the share capital of EMMET for an amount of
EUR 10 million. The Group will also have the exclusive option to purchase the remaining shares. EMMET
is a company from the Russian Federation with 43 employees and offi ces in St. Petersburg and Moscow and
is a technology developer and provider of marine electromagnetic services for hydrocarbon exploration.
The recorded goodwill related to the acquisition is EUR 10.7 million. EMMET has been added to the Airborne
Survey group in the Geoscience division.
5.26.1.6 Falcon Technology
In November 2008 the Geosciene division acquired BHP Billiton’s proprietary Falcon™ geophysical technology.
The purchase price is around EUR 10.7 million and the recognised intangible assets amount to
EUR 7.9 million. Falcon™ is the world’s leading Airborne Gravity Gradiometer (AGG) technology and was jointly
developed by BHP Billiton and Lockheed Martin. BHP Billiton retains the exclusive use and priority access to the
technology for minerals exploration until March 2010.
5.26.1.7 BKS Surveys Ltd.
On 24 April all the shares of BKS Surveys Ltd. in Northern-Ireland were acquired (and paid in cash) by the
Group for an amount of EUR 3.9 million. BKS is a leading supplier of aerial mapping services and products.
The company employs 100 people and has an annual revenue of EUR 6.4 million. Total goodwill amount is
EUR 2.3 million. BKS is added to the Survey group.
5.26.1.8 Nigel Press Associates Ltd.
Also in April Fugro acquired (and paid in cash) a 100% stake in Nigel Press Associates Ltd. (NPA). The purchase
price was EUR 3.3 million and the company has an annual revenue of EUR 3.2 million. NPA is a satellite mapping
specialist in Europe. NPA has about 30 employees and the goodwill related to the acquisition is EUR 2.5 million.
NPA is part of both the Survey and Geoscience division.
5.26.1.9 Fugro-OceansatPEG 38%
In May the remaining 38% interest in Fugro-OceansatPEG S.A., Brazil, in the Survey group was acquired for a total
amount of EUR 6.6 million. In 2005 already 62% of the shares has been acquired. The transaction lead to an
additional goodwill amount of EUR 4.2 million. The company continues as Fugro Brasil Ltda.
5.26.1.10 In Situ Geotecnia Ltda.
In May the Group acquired (and paid in cash) a 100% share in In Situ Geotecnia Ltda. in Brazil for a total amount
of EUR 4.1 million. In Situ is a company in the fi eld of geotechnical services. In Situ has an annual revenue of
EUR 4 million and 100 employees. Total goodwill amounts to EUR 5.3 million. In Situ is added to the Geotechnical
division.
5.26.1.11 NexTerra Geophysical Solutions Pvt. Ltd.
In July NexTerra Geophysical Solutions Pvt. Ltd. in India was acquired (and paid in cash) for a total amount of
EUR 0.3 million. NexTerra specialises in the provision of land-based geoscientifi c data acquisition and associated
processing and consulting services. The company has an annual revenue of EUR 1.0 million and employs
12 people. Total recognised goodwill amount is EUR 0.7 million. Nexterra is included in the Geoscience division.
98
5.26.1.12 SureSpek ISS Pty Ltd.
In August all the shares of SureSpek ISS Pty Ltd, an Australian based company, were acquired (and paid in cash)
for EUR 3.5 million. The company manages and undertakes subsea inspections on offshore pipelines and
structures. The company has 16 staff and an annual revenue of EUR 2.5 million. Goodwill amount in the
acquisiton was EUR 3.4 million. SureSpek is part of the Survey group.
5.26.1.13 Beatty Marine Plant Ltd.
From Beatty Marine Plant Ltd. in Ireland six modular jack-up platforms including related business were acquired
for a total amount of EUR 9.5 million in cash. Total goodwill amount on the acquisition is EUR 3.1 million.
The jack-up platforms are used within the Geotechnical division.
5.26.1.14 Risk Engineering, Inc.
All the shares of Risk Engineering, Inc., United States., were acquired (and paid in cash) by the Group in August
for an amount of EUR 1.8 million. The company is specialised in risk analyses and earthquake sensitivity studies
of large scale projects. The annual revenue is EUR 1.5 million with 5 employees and the goodwill amount on
the acquisition is EUR 2.2 million. The company was integrated with the onshore activities of William
Lettis & Associates, Inc, United States in the Geotechnical division.
5.26.1.15 Phoenix Data Solutions Ltd.
Fugro acquired all the shares (and paid in cash) of the specialist privately owned data management company
Phoenix Data Solutions in the United Kingdom in September. Total purchase amount is EUR 3.0 million.
The company employs 6 staff and has an annual revenue of approximately EUR 3.0 million and provides services
specialising in the digital reconstruction of seismic images. Total goodwill amount involved is EUR 2.1 million.
The company is incorporated in Fugro Data Solutions Ltd. in the Geoscience division.
5.26.1.16 GeoLab Nor AS
Also in September Fugro Norway acquired (and paid in cash) a 100% share in Geolab Nor AS with its head offi ce
in Trondheim, Norway. Total purchase amount is EUR 2.9 million and the goodwill related to the acquisition is
EUR 2.3 million. Annual revenue of the company is EUR 2.3 million. The company specialises in supplying
petroleum, geochemical and consultancy services to the oil and gas industry on a worldwide basis. Geolab Nor
AS employs 15 employees and is added to the Geoscience division.
5.26.1.17 Allied Seismic Ltd.
The Group acquired (and paid in cash) all the shares of the privately owned data management company Allied
Seismic Ltd., in Calgary, Alberta, Canada, for a total amount of EUR 2.1 million. The company employs 22 staff
and has an annual revenue of approximately EUR 2.5 million and specialises in the storage of data related to oil
and gas, mainly to the seismic acquisition industry. Goodwill amount is EUR 2.0 million. The company is
incorporated in Fugro Data Solutions Canada Inc. in the Geoscience division.
5.26.1.18 GEO LLC
On 8 December Fugro acquired (and paid in cash) all the shares in GEO LLC, based in Anchorage, Alaska, United
States, for EUR 2.1 million. The company specialises in offshore geophysical surveys, as well as in geotechnical
investigations for new oil and gas fi elds offshore, especially in the arctic regions such as the Chukchi and
Beaufort Seas. GEO LLC has an annual revenue of EUR 7 million and the goodwill amount is EUR 0.8 million.
The company will be integrated with the offshore activities of one of the Group companies in the United States
and is added to the Geotechnical division.
5.26.2 Divestments
In 2008 no divestments took place.
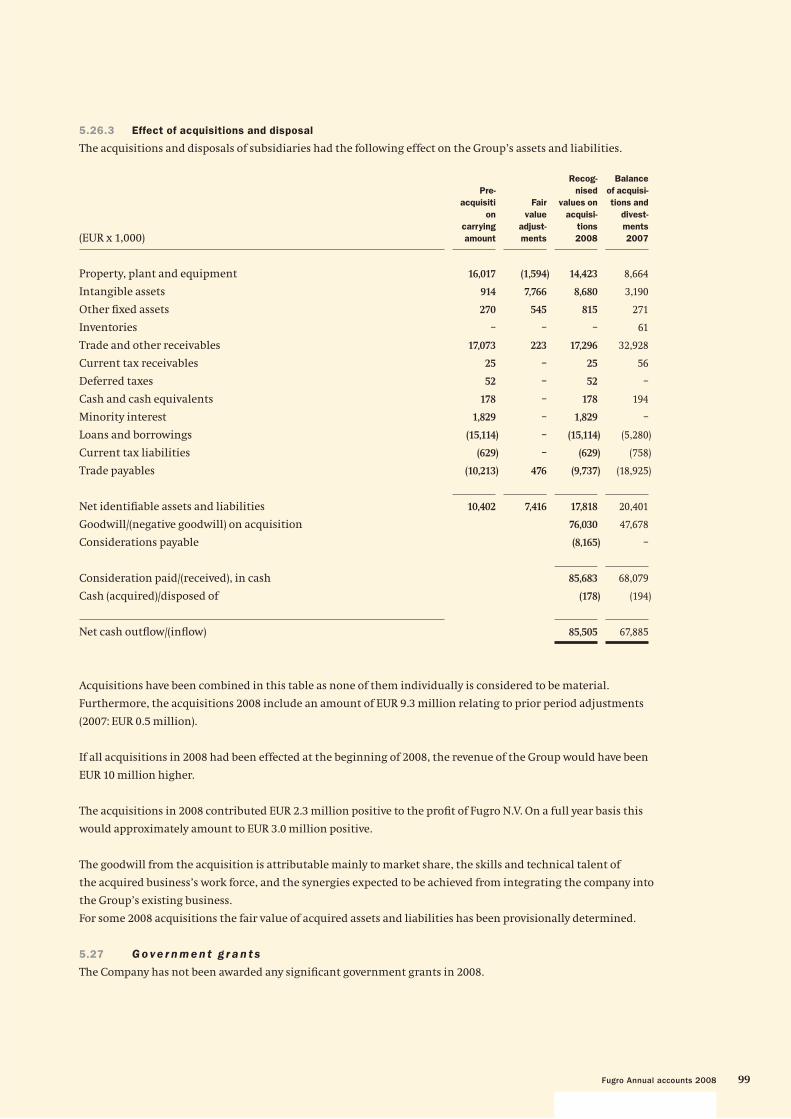
99Fugro Annual accounts 2008
5.26.3 Effect of acquisitions and disposal
The acquisitions and disposals of subsidiaries had the following effect on the Group’s assets and liabilities.
(EUR x 1,000)
Pre-
acquisiti
on
carrying
amount
Fair
value
adjust-
ments
Recog-
nised
values on
acquisi-
tions
2008
Balance
of acquisi-
tions and
divest-
ments
2007
Property, plant and equipment 16,017 (1,594) 14,423 8,664
Intangible assets 914 7,766 8,680 3,190
Other fi xed assets 270 545 815 271
Inventories – – – 61
Trade and other receivables 17,073 223 17,296 32,928
Current tax receivables 25 – 25 56
Deferred taxes 52 – 52 –
Cash and cash equivalents 178 – 178 194
Minority interest 1,829 – 1,829 –
Loans and borrowings (15,114) – (15,114) (5,280)
Current tax liabilities (629) – (629) (758)
Trade payables (10,213) 476 (9,737) (18,925)
Net identifi able assets and liabilities 10,402 7,416 17,818 20,401
Goodwill/(negative goodwill) on acquisition 76,030 47,678
Considerations payable (8,165) –
Consideration paid/(received), in cash 85,683 68,079
Cash (acquired)/disposed of (178) (194)
Net cash outfl ow/(infl ow) 85,505 67,885
Acquisitions have been combined in this table as none of them individually is considered to be material.
Furthermore, the acquisitions 2008 include an amount of EUR 9.3 million relating to prior period adjustments
(2007: EUR 0.5 million).
If all acquisitions in 2008 had been effected at the beginning of 2008, the revenue of the Group would have been
EUR 10 million higher.
The acquisitions in 2008 contributed EUR 2.3 million positive to the profi t of Fugro N.V. On a full year basis this
would approximately amount to EUR 3.0 million positive.
The goodwill from the acquisition is attributable mainly to market share, the skills and technical talent of
the acquired business’s work force, and the synergies expected to be achieved from integrating the company into
the Group’s existing business.
For some 2008 acquisitions the fair value of acquired assets and liabilities has been provisionally determined.
5.27 G o ve r n m e n t g r a n t s
The Company has not been awarded any signifi cant government grants in 2008.
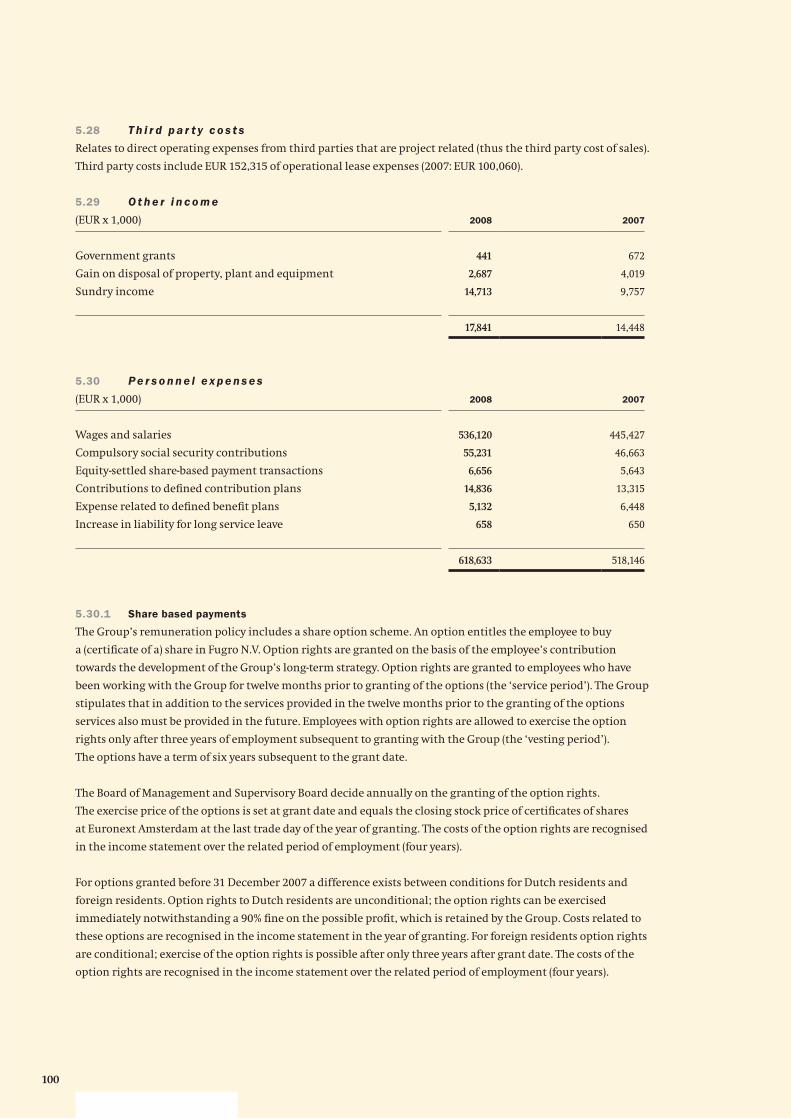
100
5.28 T h i r d p a r t y c o s t s
Relates to direct operating expenses from third parties that are project related (thus the third party cost of sales).
Third party costs include EUR 152,315 of operational lease expenses (2007: EUR 100,060).
5.29 O t h e r i n c o m e
(EUR x 1,000) 2008 2007
Government grants 441 672
Gain on disposal of property, plant and equipment 2,687 4,019
Sundry income 14,713 9,757
17,841 14,448
5.30 Pe r s o n n e l e x p e n s e s
(EUR x 1,000) 2008 2007
Wages and salaries 536,120 445,427
Compulsory social security contributions 55,231 46,663
Equity-settled share-based payment transactions 6,656 5,643
Contributions to defi ned contribution plans 14,836 13,315
Expense related to defi ned benefi t plans 5,132 6,448
Increase in liability for long service leave 658 650
618,633 518,146
5.30.1 Share based payments
The Group’s remuneration policy includes a share option scheme. An option entitles the employee to buy
a (certifi cate of a) share in Fugro N.V. Option rights are granted on the basis of the employee’s contribution
towards the development of the Group’s long-term strategy. Option rights are granted to employees who have
been working with the Group for twelve months prior to granting of the options (the ‘service period’). The Group
stipulates that in addition to the services provided in the twelve months prior to the granting of the options
services also must be provided in the future. Employees with option rights are allowed to exercise the option
rights only after three years of employment subsequent to granting with the Group (the ‘vesting period’).
The options have a term of six years subsequent to the grant date.
The Board of Management and Supervisory Board decide annually on the granting of the option rights.
The exercise price of the options is set at grant date and equals the closing stock price of certifi cates of shares
at Euronext Amsterdam at the last trade day of the year of granting. The costs of the option rights are recognised
in the income statement over the related period of employment (four years).
For options granted before 31 December 2007 a difference exists between conditions for Dutch residents and
foreign residents. Option rights to Dutch residents are unconditional; the option rights can be exercised
immediately notwithstanding a 90% fi ne on the possible profi t, which is retained by the Group. Costs related to
these options are recognised in the income statement in the year of granting. For foreign residents option rights
are conditional; exercise of the option rights is possible after only three years after grant date. The costs of the
option rights are recognised in the income statement over the related period of employment (four years).
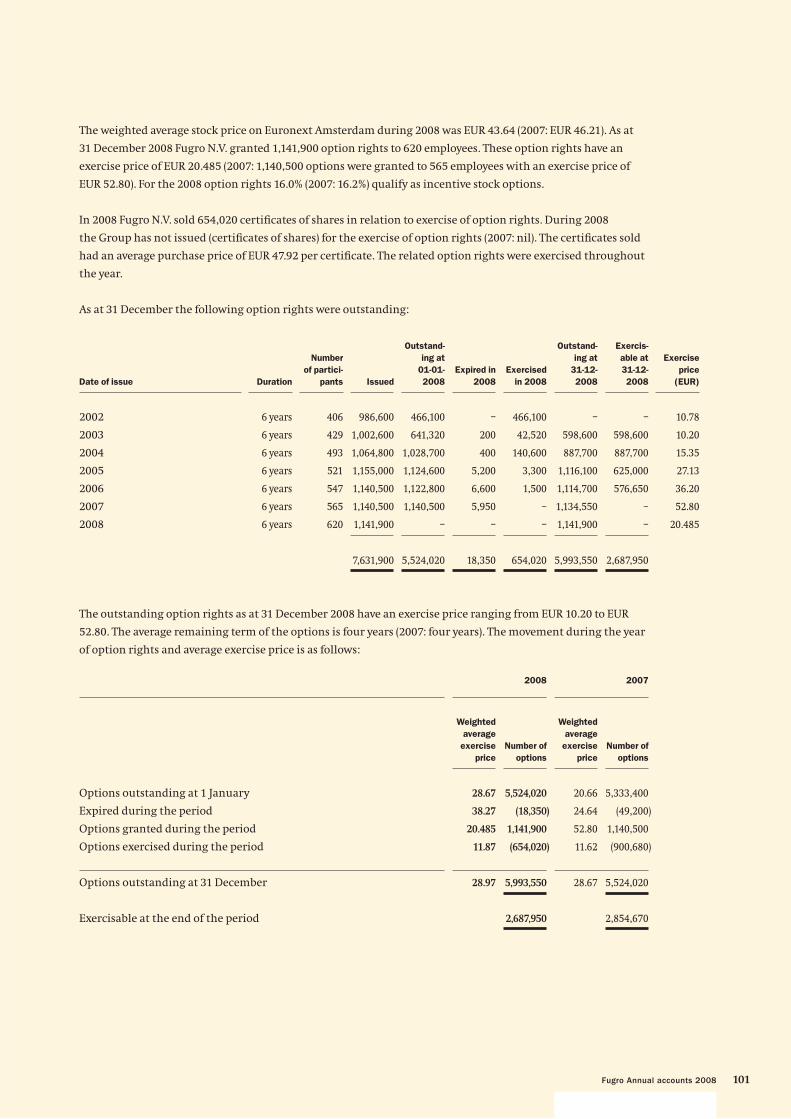
101Fugro Annual accounts 2008
The weighted average stock price on Euronext Amsterdam during 2008 was EUR 43.64 (2007: EUR 46.21). As at
31 December 2008 Fugro N.V. granted 1,141,900 option rights to 620 employees. These option rights have an
exercise price of EUR 20.485 (2007: 1,140,500 options were granted to 565 employees with an exercise price of
EUR 52.80). For the 2008 option rights 16.0% (2007: 16.2%) qualify as incentive stock options.
In 2008 Fugro N.V. sold 654,020 certifi cates of shares in relation to exercise of option rights. During 2008
the Group has not issued (certifi cates of shares) for the exercise of option rights (2007: nil). The certifi cates sold
had an average purchase price of EUR 47.92 per certifi cate. The related option rights were exercised throughout
the year.
As at 31 December the following option rights were outstanding:
Date of issue Duration
Number
of partici-
pants Issued
Outstand-
ing at
01-01-
2008
Expired in
2008
Exercised
in 2008
Outstand-
ing at
31-12-
2008
Exercis-
able at
31-12-
2008
Exercise
price
(EUR)
2002 6 years 406 986,600 466,100 – 466,100 – – 10.78
2003 6 years 429 1,002,600 641,320 200 42,520 598,600 598,600 10.20
2004 6 years 493 1,064,800 1,028,700 400 140,600 887,700 887,700 15.35
2005 6 years 521 1,155,000 1,124,600 5,200 3,300 1,116,100 625,000 27.13
2006 6 years 547 1,140,500 1,122,800 6,600 1,500 1,114,700 576,650 36.20
2007 6 years 565 1,140,500 1,140,500 5,950 – 1,134,550 – 52.80
2008 6 years 620 1,141,900 – – – 1,141,900 – 20.485
7,631,900 5,524,020 18,350 654,020 5,993,550 2,687,950
The outstanding option rights as at 31 December 2008 have an exercise price ranging from EUR 10.20 to EUR
52.80. The average remaining term of the options is four years (2007: four years). The movement during the year
of option rights and average exercise price is as follows:
2008 2007
Weighted
average
exercise
price
Number of
options
Weighted
average
exercise
price
Number of
options
Options outstanding at 1 January 28.67 5,524,020 20.66 5,333,400
Expired during the period 38.27 (18,350) 24.64 (49,200)
Options granted during the period 20.485 1,141,900 52.80 1,140,500
Options exercised during the period 11.87 (654,020) 11.62 (900,680)
Options outstanding at 31 December 28.97 5,993,550 28.67 5,524,020
Exercisable at the end of the period 2,687,950 2,854,670
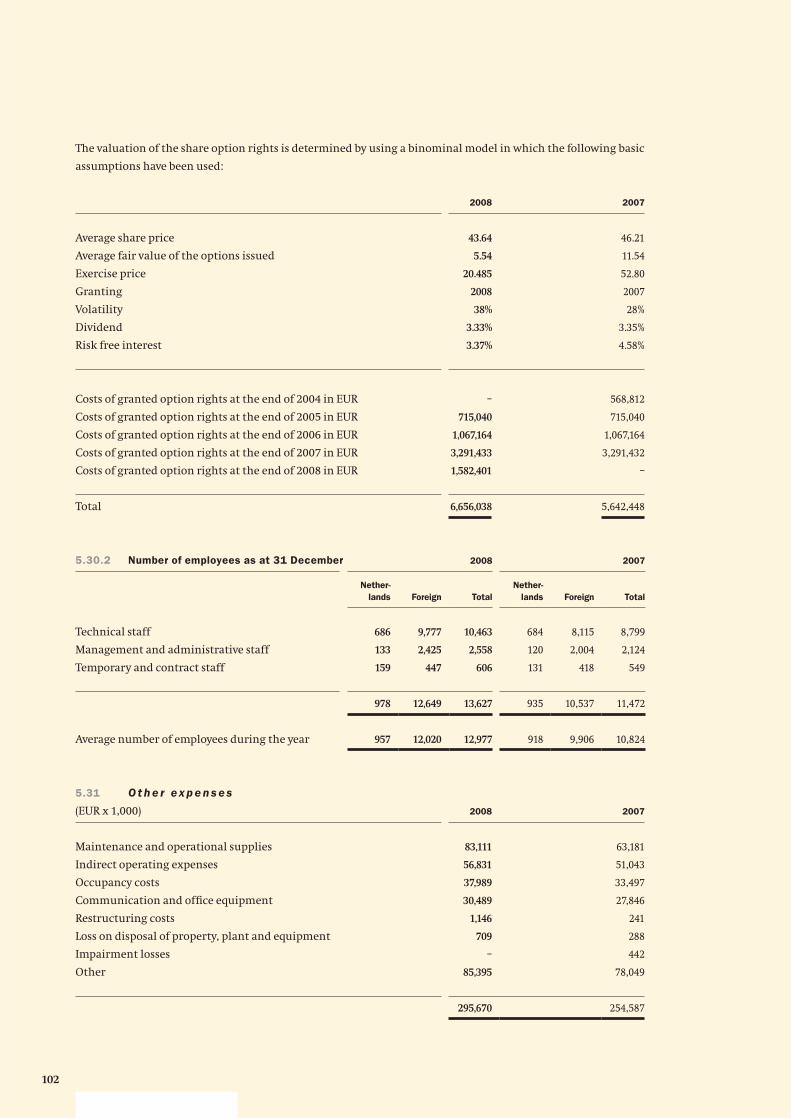
102
The valuation of the share option rights is determined by using a binominal model in which the following basic
assumptions have been used:
2008 2007
Average share price 43.64 46.21
Average fair value of the options issued 5.54 11.54
Exercise price 20.485 52.80
Granting 2008 2007
Volatility 38% 28%
Dividend 3.33% 3.35%
Risk free interest 3.37% 4.58%
Costs of granted option rights at the end of 2004 in EUR – 568,812
Costs of granted option rights at the end of 2005 in EUR 715,040 715,040
Costs of granted option rights at the end of 2006 in EUR 1,067,164 1,067,164
Costs of granted option rights at the end of 2007 in EUR 3,291,433 3,291,432
Costs of granted option rights at the end of 2008 in EUR 1,582,401 –
Total 6,656,038 5,642,448
5.30.2 Number of employees as at 31 December 2008 2007
Nether-
lands Foreign Total
Nether-
lands Foreign Total
Technical staff 686 9,777 10,463 684 8,115 8,799
Management and administrative staff 133 2,425 2,558 120 2,004 2,124
Temporary and contract staff 159 447 606 131 418 549
978 12,649 13,627 935 10,537 11,472
Average number of employees during the year 957 12,020 12,977 918 9,906 10,824
5.31 O t h e r e x p e n s e s
(EUR x 1,000) 2008 2007
Maintenance and operational supplies 83,111 63,181
Indirect operating expenses 56,831 51,043
Occupancy costs 37,989 33,497
Communication and offi ce equipment 30,489 27,846
Restructuring costs 1,146 241
Loss on disposal of property, plant and equipment 709 288
Impairment losses – 442
Other 85,395 78,049
295,670 254,587
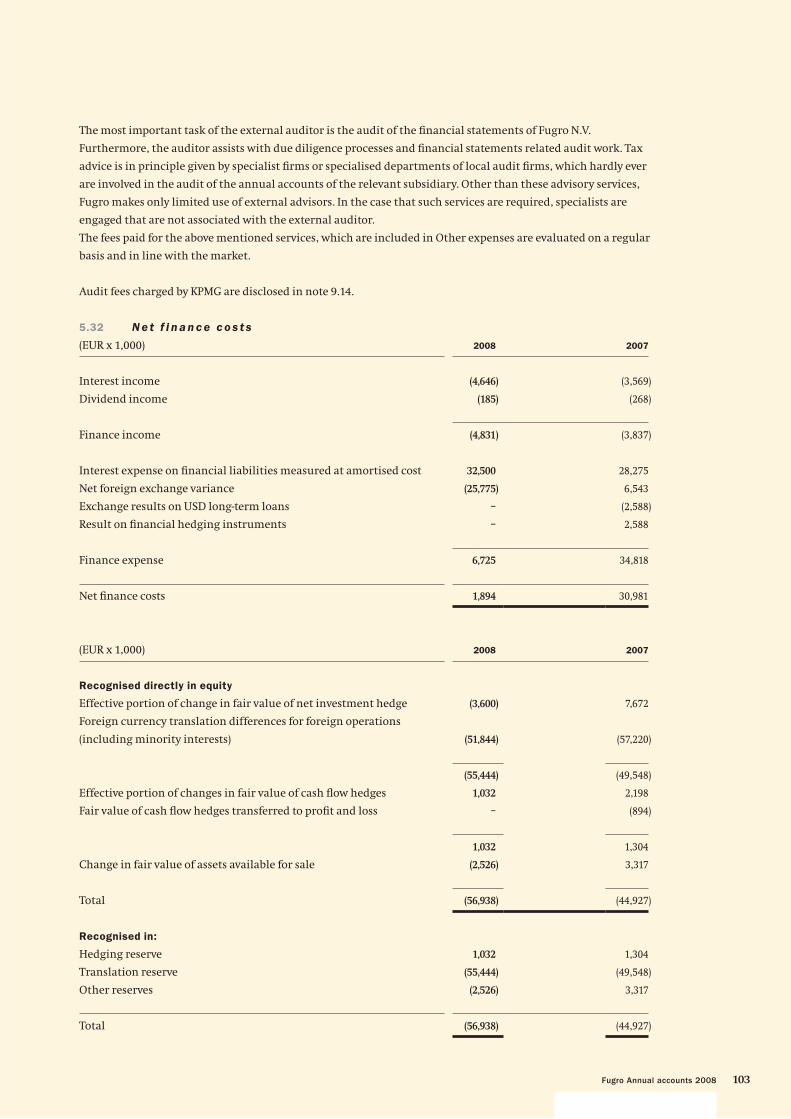
103Fugro Annual accounts 2008
The most important task of the external auditor is the audit of the fi nancial statements of Fugro N.V.
Furthermore, the auditor assists with due diligence processes and fi nancial statements related audit work. Tax
advice is in principle given by specialist fi rms or specialised departments of local audit fi rms, which hardly ever
are involved in the audit of the annual accounts of the relevant subsidiary. Other than these advisory services,
Fugro makes only limited use of external advisors. In the case that such services are required, specialists are
engaged that are not associated with the external auditor.
The fees paid for the above mentioned services, which are included in Other expenses are evaluated on a regular
basis and in line with the market.
Audit fees charged by KPMG are disclosed in note 9.14.
5.32 N e t f i n a n c e c o s t s
(EUR x 1,000) 2008 2007
Interest income (4,646) (3,569)
Dividend income (185) (268)
Finance income (4,831) (3,837)
Interest expense on fi nancial liabilities measured at amortised cost 32,500 28,275
Net foreign exchange variance (25,775) 6,543
Exchange results on USD long-term loans – (2,588)
Result on fi nancial hedging instruments – 2,588
Finance expense 6,725 34,818
Net fi nance costs 1,894 30,981
(EUR x 1,000) 2008 2007
Recognised directly in equity
Effective portion of change in fair value of net investment hedge (3,600) 7,672
Foreign currency translation differences for foreign operations
(including minority interests) (51,844) (57,220)
(55,444) (49,548)
Effective portion of changes in fair value of cash fl ow hedges 1,032 2,198
Fair value of cash fl ow hedges transferred to profi t and loss – (894)
1,032 1,304
Change in fair value of assets available for sale (2,526) 3,317
Total (56,938) (44,927)
Recognised in:
Hedging reserve 1,032 1,304
Translation reserve (55,444) (49,548)
Other reserves (2,526) 3,317
Total (56,938) (44,927)
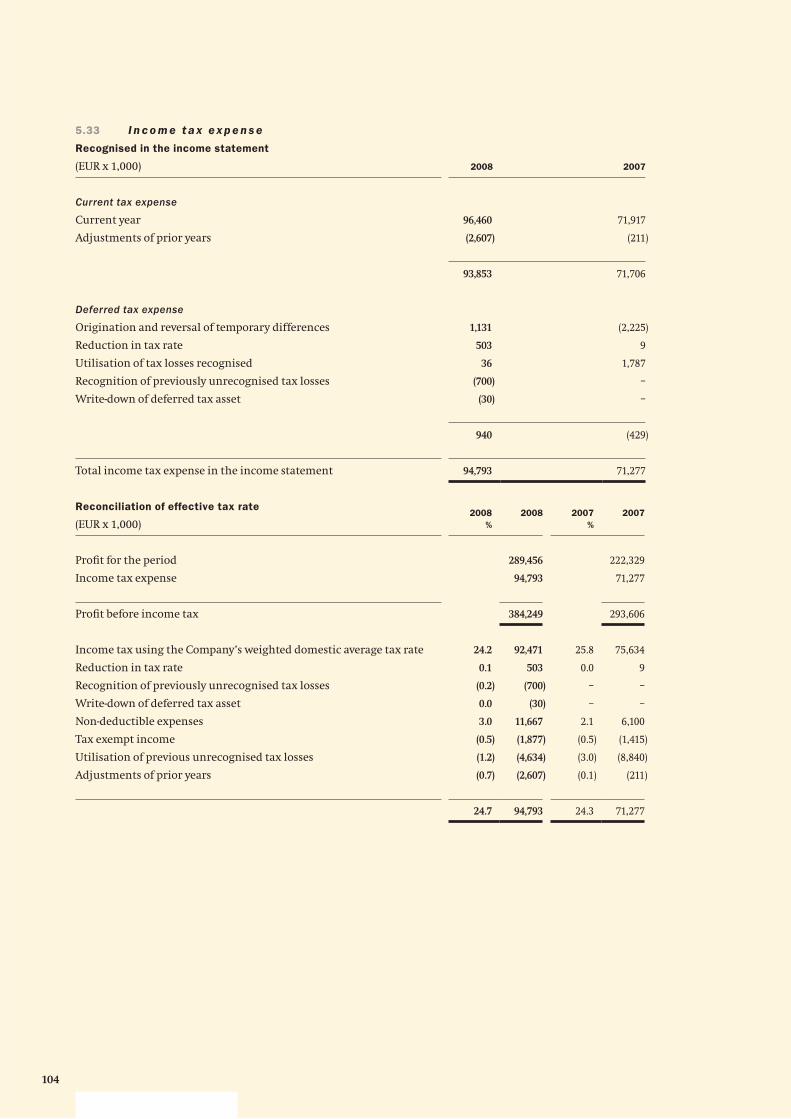
104
5.33 I n c o m e t a x e x p e n s e
Recognised in the income statement
(EUR x 1,000) 2008 2007
Current tax expense
Current year 96,460 71,917
Adjustments of prior years (2,607) (211)
93,853 71,706
Deferred tax expense
Origination and reversal of temporary differences 1,131 (2,225)
Reduction in tax rate 503 9
Utilisation of tax losses recognised 36 1,787
Recognition of previously unrecognised tax losses (700) –
Write-down of deferred tax asset (30) –
940 (429)
Total income tax expense in the income statement 94,793 71,277
Reconciliation of effective tax rate
(EUR x 1,000)2008
%
2008 2007
%
2007
Profi t for the period 289,456 222,329
Income tax expense 94,793 71,277
Profi t before income tax 384,249 293,606
Income tax using the Company’s weighted domestic average tax rate 24.2 92,471 25.8 75,634
Reduction in tax rate 0.1 503 0.0 9
Recognition of previously unrecognised tax losses (0.2) (700) – –
Write-down of deferred tax asset 0.0 (30) – –
Non-deductible expenses 3.0 11,667 2.1 6,100
Tax exempt income (0.5) (1,877) (0.5) (1,415)
Utilisation of previous unrecognised tax losses (1.2) (4,634) (3.0) (8,840)
Adjustments of prior years (0.7) (2,607) (0.1) (211)
24.7 94,793 24.3 71,277
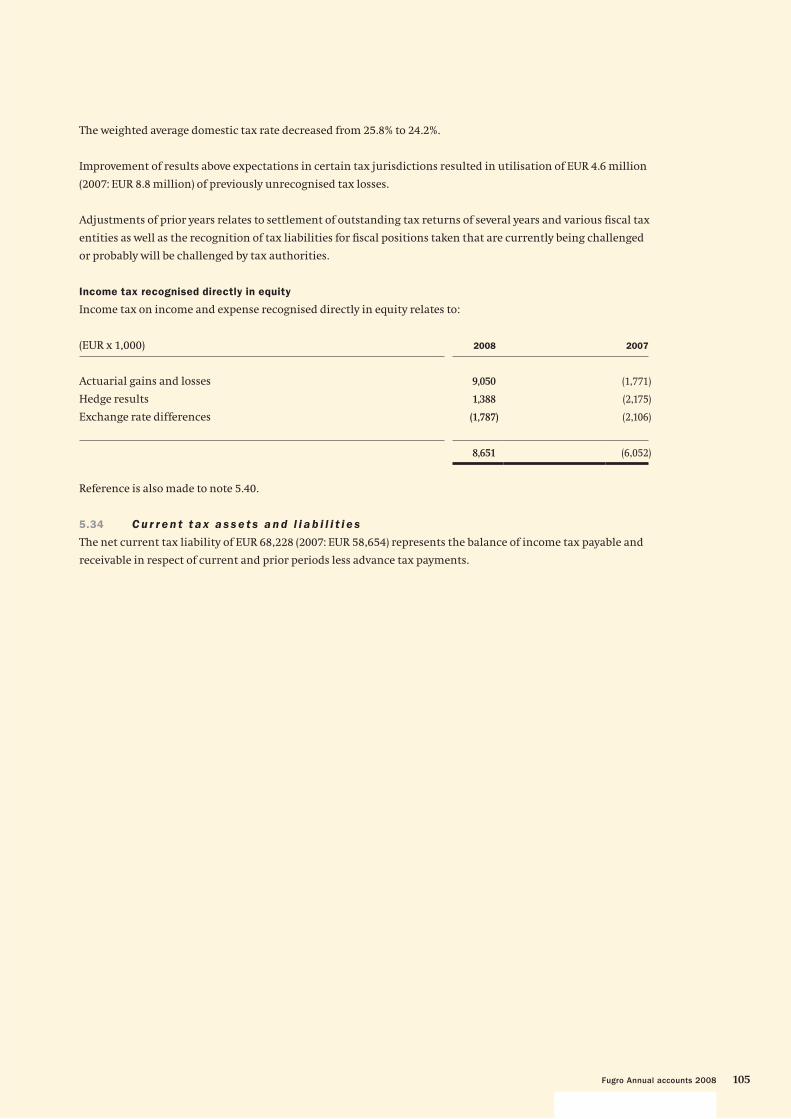
105Fugro Annual accounts 2008
The weighted average domestic tax rate decreased from 25.8% to 24.2%.
Improvement of results above expectations in certain tax jurisdictions resulted in utilisation of EUR 4.6 million
(2007: EUR 8.8 million) of previously unrecognised tax losses.
Adjustments of prior years relates to settlement of outstanding tax returns of several years and various fi scal tax
entities as well as the recognition of tax liabilities for fi scal positions taken that are currently being challenged
or probably will be challenged by tax authorities.
Income tax recognised directly in equity
Income tax on income and expense recognised directly in equity relates to:
(EUR x 1,000) 2008 2007
Actuarial gains and losses 9,050 (1,771)
Hedge results 1,388 (2,175)
Exchange rate differences (1,787) (2,106)
8,651 (6,052)
Reference is also made to note 5.40.
5.34 C u r r e n t t a x a s s e t s a n d l i a b i l i t i e s
The net current tax liability of EUR 68,228 (2007: EUR 58,654) represents the balance of income tax payable and
receivable in respect of current and prior periods less advance tax payments.
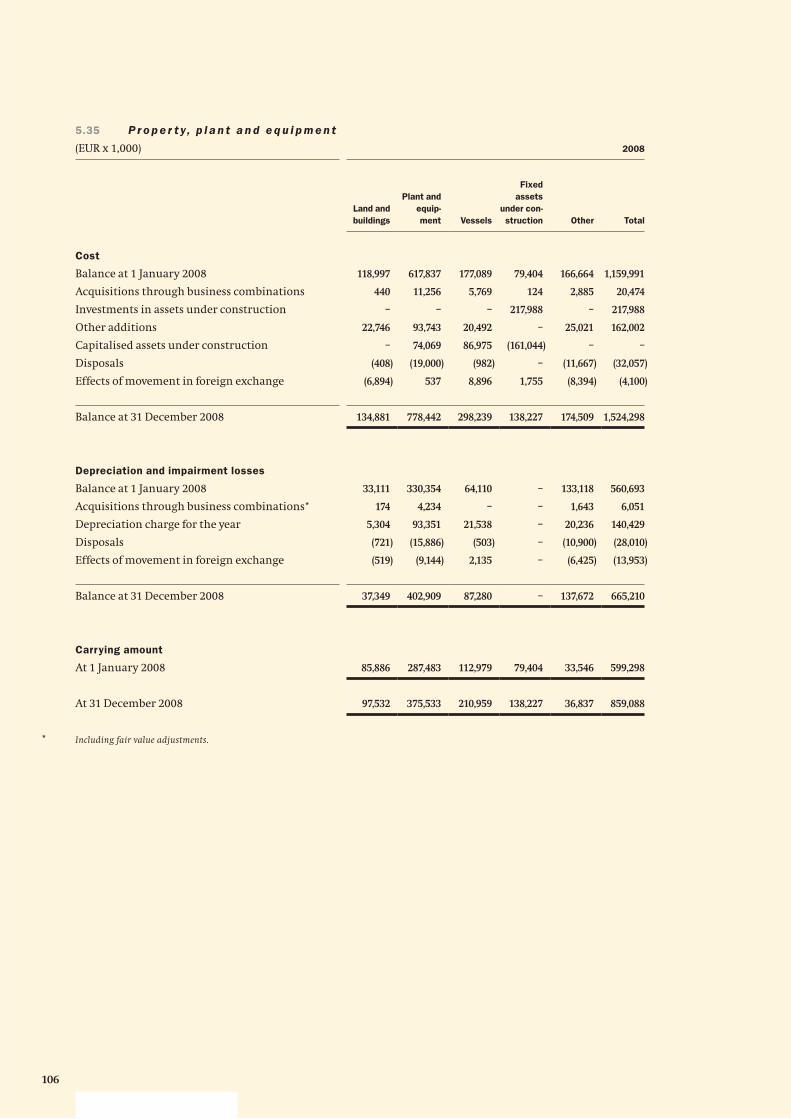
106
5.35 P r o p e r t y , p l a n t a n d e q u i p m e n t
(EUR x 1,000) 2008
Land and
buildings
Plant and
equip-
ment Vessels
Fixed
assets
under con-
struction Other Total
Cost
Balance at 1 January 2008 118,997 617,837 177,089 79,404 166,664 1,159,991
Acquisitions through business combinations 440 11,256 5,769 124 2,885 20,474
Investments in assets under construction – – – 217,988 – 217,988
Other additions 22,746 93,743 20,492 – 25,021 162,002
Capitalised assets under construction – 74,069 86,975 (161,044) – –
Disposals (408) (19,000) (982) – (11,667) (32,057)
Effects of movement in foreign exchange (6,894) 537 8,896 1,755 (8,394) (4,100)
Balance at 31 December 2008 134,881 778,442 298,239 138,227 174,509 1,524,298
Depreciation and impairment losses
Balance at 1 January 2008 33,111 330,354 64,110 – 133,118 560,693
Acquisitions through business combinations* 174 4,234 – – 1,643 6,051
Depreciation charge for the year 5,304 93,351 21,538 – 20,236 140,429
Disposals (721) (15,886) (503) – (10,900) (28,010)
Effects of movement in foreign exchange (519) (9,144) 2,135 – (6,425) (13,953)
Balance at 31 December 2008 37,349 402,909 87,280 – 137,672 665,210
Carrying amount
At 1 January 2008 85,886 287,483 112,979 79,404 33,546 599,298
At 31 December 2008 97,532 375,533 210,959 138,227 36,837 859,088
* Including fair value adjustments.
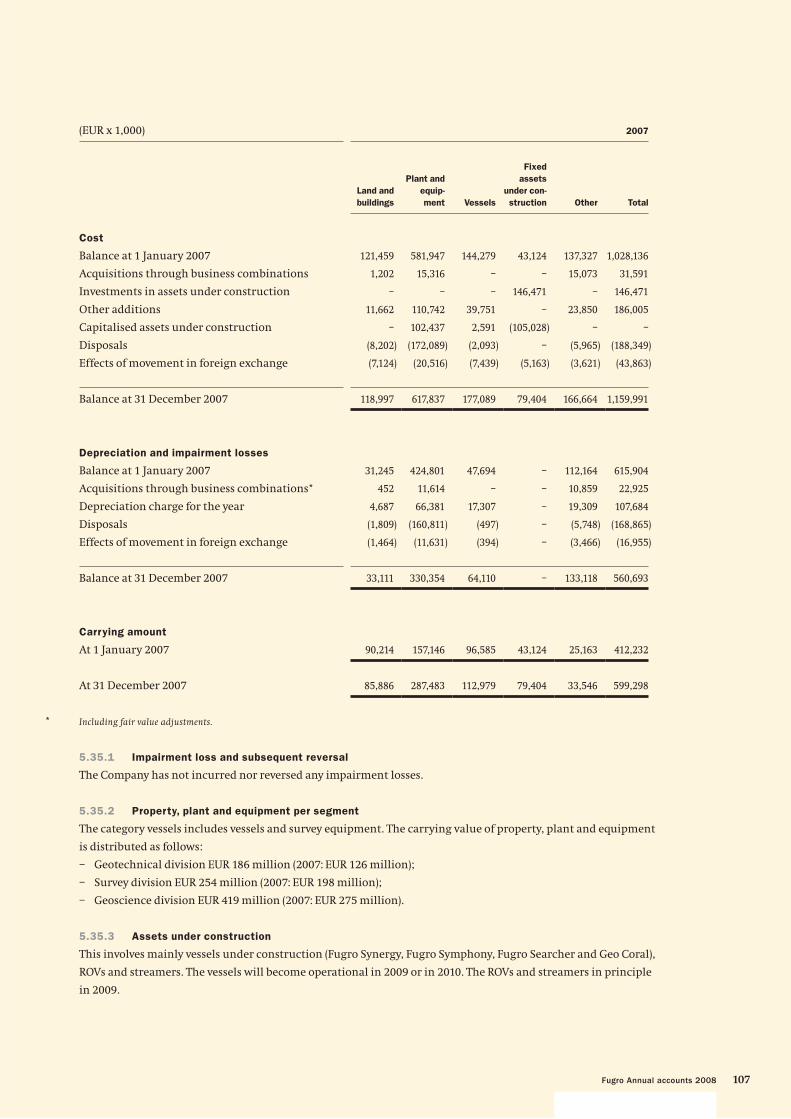
107Fugro Annual accounts 2008
(EUR x 1,000) 2007
Land and
buildings
Plant and
equip-
ment Vessels
Fixed
assets
under con-
struction Other Total
Cost
Balance at 1 January 2007 121,459 581,947 144,279 43,124 137,327 1,028,136
Acquisitions through business combinations 1,202 15,316 – – 15,073 31,591
Investments in assets under construction – – – 146,471 – 146,471
Other additions 11,662 110,742 39,751 – 23,850 186,005
Capitalised assets under construction – 102,437 2,591 (105,028) – –
Disposals (8,202) (172,089) (2,093) – (5,965) (188,349)
Effects of movement in foreign exchange (7,124) (20,516) (7,439) (5,163) (3,621) (43,863)
Balance at 31 December 2007 118,997 617,837 177,089 79,404 166,664 1,159,991
Depreciation and impairment losses
Balance at 1 January 2007 31,245 424,801 47,694 – 112,164 615,904
Acquisitions through business combinations* 452 11,614 – – 10,859 22,925
Depreciation charge for the year 4,687 66,381 17,307 – 19,309 107,684
Disposals (1,809) (160,811) (497) – (5,748) (168,865)
Effects of movement in foreign exchange (1,464) (11,631) (394) – (3,466) (16,955)
Balance at 31 December 2007 33,111 330,354 64,110 – 133,118 560,693
Carrying amount
At 1 January 2007 90,214 157,146 96,585 43,124 25,163 412,232
At 31 December 2007 85,886 287,483 112,979 79,404 33,546 599,298
* Including fair value adjustments.
5.35.1 Impairment loss and subsequent reversal
The Company has not incurred nor reversed any impairment losses.
5.35.2 Property, plant and equipment per segment
The category vessels includes vessels and survey equipment. The carrying value of property, plant and equipment
is distributed as follows:
– Geotechnical division EUR 186 million (2007: EUR 126 million);
– Survey division EUR 254 million (2007: EUR 198 million);
– Geoscience division EUR 419 million (2007: EUR 275 million).
5.35.3 Assets under construction
This involves mainly vessels under construction (Fugro Synergy, Fugro Symphony, Fugro Searcher and Geo Coral),
ROVs and streamers. The vessels will become operational in 2009 or in 2010. The ROVs and streamers in principle
in 2009.
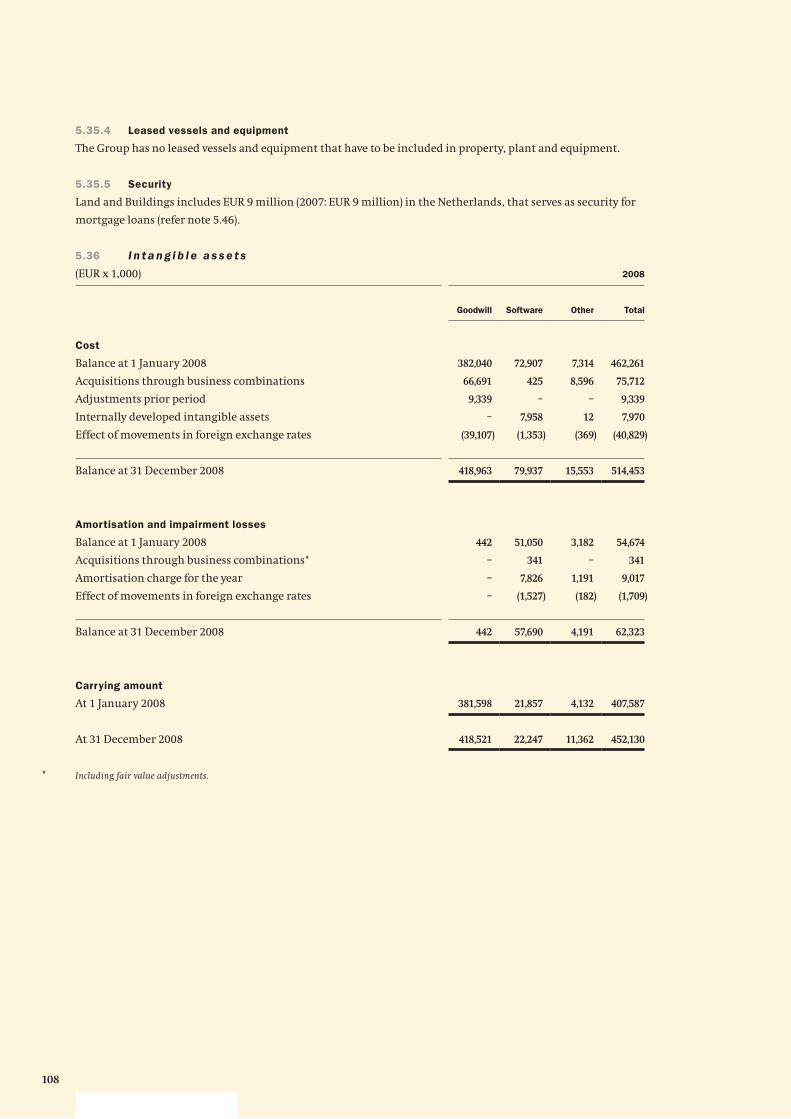
108
5.35.4 Leased vessels and equipment
The Group has no leased vessels and equipment that have to be included in property, plant and equipment.
5.35.5 Security
Land and Buildings includes EUR 9 million (2007: EUR 9 million) in the Netherlands, that serves as security for
mortgage loans (refer note 5.46).
5.36 I n t a n g i b l e a s s e t s
(EUR x 1,000) 2008
Goodwill Software Other Total
Cost
Balance at 1 January 2008 382,040 72,907 7,314 462,261
Acquisitions through business combinations 66,691 425 8,596 75,712
Adjustments prior period 9,339 – – 9,339
Internally developed intangible assets – 7,958 12 7,970
Effect of movements in foreign exchange rates (39,107) (1,353) (369) (40,829)
Balance at 31 December 2008 418,963 79,937 15,553 514,453
Amortisation and impairment losses
Balance at 1 January 2008 442 51,050 3,182 54,674
Acquisitions through business combinations* – 341 – 341
Amortisation charge for the year – 7,826 1,191 9,017
Effect of movements in foreign exchange rates – (1,527) (182) (1,709)
Balance at 31 December 2008 442 57,690 4,191 62,323
Carrying amount
At 1 January 2008 381,598 21,857 4,132 407,587
At 31 December 2008 418,521 22,247 11,362 452,130
* Including fair value adjustments.
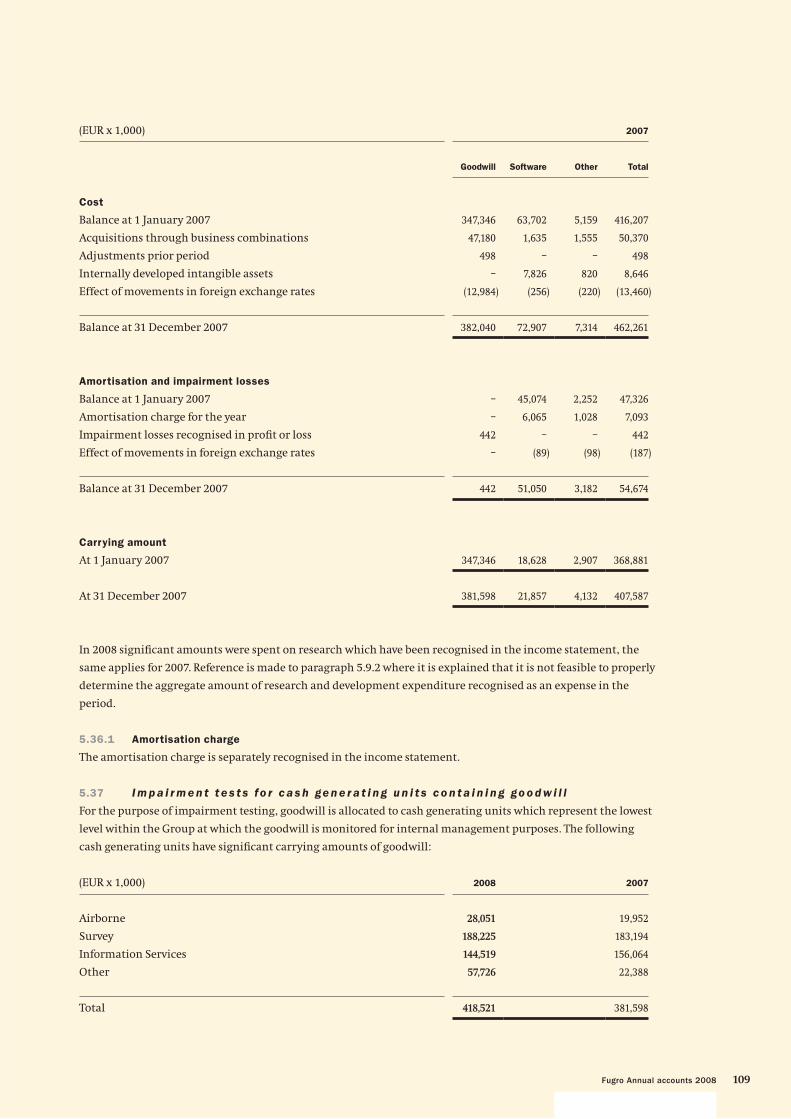
109Fugro Annual accounts 2008
(EUR x 1,000) 2007
Goodwill Software Other Total
Cost
Balance at 1 January 2007 347,346 63,702 5,159 416,207
Acquisitions through business combinations 47,180 1,635 1,555 50,370
Adjustments prior period 498 – – 498
Internally developed intangible assets – 7,826 820 8,646
Effect of movements in foreign exchange rates (12,984) (256) (220) (13,460)
Balance at 31 December 2007 382,040 72,907 7,314 462,261
Amortisation and impairment losses
Balance at 1 January 2007 – 45,074 2,252 47,326
Amortisation charge for the year – 6,065 1,028 7,093
Impairment losses recognised in profi t or loss 442 – – 442
Effect of movements in foreign exchange rates – (89) (98) (187)
Balance at 31 December 2007 442 51,050 3,182 54,674
Carrying amount
At 1 January 2007 347,346 18,628 2,907 368,881
At 31 December 2007 381,598 21,857 4,132 407,587
In 2008 signifi cant amounts were spent on research which have been recognised in the income statement, the
same applies for 2007. Reference is made to paragraph 5.9.2 where it is explained that it is not feasible to properly
determine the aggregate amount of research and development expenditure recognised as an expense in the
period.
5.36.1 Amortisation charge
The amortisation charge is separately recognised in the income statement.
5.37 I m p a i r m e n t t e s t s fo r c a s h ge n e r a t i n g u n i t s c o n t a i n i n g go o d w i l l
For the purpose of impairment testing, goodwill is allocated to cash generating units which represent the lowest
level within the Group at which the goodwill is monitored for internal management purposes. The following
cash generating units have signifi cant carrying amounts of goodwill:
(EUR x 1,000) 2008 2007
Airborne 28,051 19,952
Survey 188,225 183,194
Information Services 144,519 156,064
Other 57,726 22,388
Total 418,521 381,598
110
Annually or when there is an indication for impairment the Group carries out impairment tests on these
balances for the relevant cash-generating unit. The system and calculation method are already described in
separate notes. The period for the discounted cash fl ow calculations is in principle indefi nite. However the Group
has set the period at fi fty years, subject to periodic evaluation, for the following reasons.
About 75% of the Group’s activities relate to the oil and gas industry. The services are in principle of such a
nature that our clients use us to help them to explore and extract hydrocarbon and mineral resources. Experts
are without doubt that these resources will continue to be available to mankind for many decades and their
reports indicate periods between fi fty and hundred years.
Easily accessible places may ‘dry-up’ but with new techniques and means more hostile areas can also be
exploited. The Group has with its high market shares and specialised techniques a solid position to continue to
serve its customers.
The Group recognises that harnessing alternative means of energy, like wind, nuclear and hydro electric energy
will continue. These sources however have limited output and will be diffi cult to transport.
The recoverable amounts of the various cash generating units that carry goodwill are determined on
calculations of value in use. Those calculations use cash fl ow projections based on actual operating results and a
fi ve year forecast. Cash fl ows for further future periods are extrapolated using growth rate percentages varying
from 0 to 3.5% which are deemed appropriate because of the long-term nature of the business. These growth
rates are also consistent with the long-term averages in the industry based on value in use. A pre-tax discount
rate of 9.5% has been used for discounting the projected cash fl ows. The key assumptions and the approach to
determine their value are the growth rates that are based on analysis of the long-term market price trends in the
oil and gas industry adjusted for actual experience.
The carrying amounts of the units remain below the recoverable amounts and as such no impairment losses are
accounted for. Future adverse changes in the assumptions could however reduce the recoverable amounts below
the carrying amount. As at 31 December 2008 cumulative impairment losses of EUR 442 thousand
(2007: EUR 442 thousand) have been recognised.
5.38 I n ve s t m e n t s i n e q u i t y a c c o u n t e d i n ve s t e e s
The carrying amount of the equity accounted investees of the Group can be summarised as follows:
(EUR x 1,000) 2008 2007
Equity accounted investees 1,293 1,532
The Group’s share in realised profi t in the above mentioned equity accounted investees amounted to
EUR 102 thousand negative in 2008 (2007: EUR 226 thousand negative).
111Fugro Annual accounts 2008
5.39 O t h e r i n ve s t m e n t s
The Group holds the following other investments:
(EUR x 1,000) 2008 2007
Other investments 1,109 1,349
Long-term loans – 69
Assets available for sale 330 3,524
Other long-term receivables 1,514 1,333
2,953 6,275
The Group has the following other investments accounted for at cost:
(EUR x 1,000)
Name of the company Country
Owner-
ship Assets Liabilities Equity Revenues
Profi t/
loss
La Coste & Romberg-Scintrex, Inc. Canada 11% 15,056 2,519 12,537 16,452 5,035
The Group’s other investments are not listed. A reliable fair value estimate can therefore not be made. The fair
value of the assets available for sale is based with reference to quoted prices on the Australian Stock Exchange.
5.40 D e f e r r e d t a x a s s e t s a n d l i a b i l i t i e s
Deferred tax assets and liabilities are attributable to the following items:
(EUR x 1,000) Assets Liabilities Net
2008 2007 2008 2007 2008 2007
Property, plant and equipment 4,720 8,991 (3,995) (3,075) 725 5,916
Intangible assets 234 501 (6,055) (3,515) (5,821) (3,014)
Other investments 4,469 3,100 – – 4,469 3,100
Loans and borrowings 1,244 – (31) (772) 1,213 (772)
Employee benefi ts 14,495 8,353 – – 14,495 8,353
Provisions 8,454 5,007 (55) (423) 8,399 4,584
Tax value of recognised loss carry-forwards 1,215 551 – – 1,215 551
Exchange differences 640 17 (462) (1,037) 178 (1,020)
Other items 1,329 955 (888) (1,102) 441 (147)
Deferred tax assets/(liabilities) 36,800 27,475 (11,486) (9,924) 25,314 17,551
Set off of tax components (10,511) (9,438) 10,511 9,438 – –
Net deferred tax asset/(liability) 26,289 18,037 (975) (486) 25,314 17,551
112
The recognised deferred tax assets are dependent on future taxable profi ts in excess of profi ts arising from the
reversal of existing taxable temporary differences.
At 31 December 2008 no deferred tax liabilities relating to an investment in a subsidiary have been recognised
(2007: nil).
In some of the countries where the Group operates, local tax laws provide that gains on disposal of certain assets
are tax exempt, provided that the gains are not distributed. At balance sheet date, no reserves exist which would
result in a tax liability should the subsidiaries pay dividends from these reserves.
Movement in temporary differences during the year
(EUR x 1,000) 2008
Balance
01-01-08
Acqui si-
tions
Recog-
nised in
income
Recog-
nised in
equity
Balance
31-12-08
Property, plant and equipment 5,916 21 (5,212) – 725
Intangible assets (3,014) – (2,807) – (5,821)
Other investments 3,100 – 1,369 – 4,469
Loans and borrowings (772) – 597 1,388 1,213
Employee benefi ts 8,353 47 (2,955) 9,050 14,495
Provisions 4,584 3 3,812 – 8,399
Tax value of recognised loss carry-forward 551 – 664 – 1,215
Exchange differences (1,020) – 2,985 (1,787) 178
Other items (147) (19) 607 – 441
17,551 52 (940) 8,651 25,314
(EUR x 1,000) 2007
Balance
01-01-07
Acqui si-
tions
Recog-
nised in
income
Recog-
nised in
equity
Balance
31-12-07
Property, plant and equipment 4,136 – 1,780 – 5,916
Intangible assets (1,157) – (1,857) – (3,014)
Other investments 2,139 – 961 – 3,100
Loans and borrowings 1,186 – 217 (2,175) (772)
Employee benefi ts 10,931 – (807) (1,771) 8,353
Provisions 5,130 – (546) – 4,584
Tax value of recognised loss carry-forward 2,366 – (1,787) (28) 551
Exchange differences – – 1,058 (2,078) (1,020)
Other items (1,557) – 1,410 – (147)
23,174 – 429 (6,052) 17,551
113Fugro Annual accounts 2008
Deferred tax assets have not been recognised in respect of the following items:
Unrecognised deferred tax assets
(EUR x 1,000) 2008 2007
Deductible temporary differences 1,650 1,498
Tax losses 9,907 15,227
Capital allowances 3,310 8,013
Total 14,867 24,738
Unrecognised deferred tax receivables relates to tax unities previously suffering losses for which it is currently
not probable that suffi cient fi scal results will become available in the future to offset these losses, taking into
account fi scal restrictions on the utilisation of loss compensation.
Unrecognised tax assets changed over the period as follows:
Unrecognised deferred tax assets
(EUR x 1,000) 2008 2007
As of 1 January 24,738 25,647
Movements during the period:
Additional losses 922 5,578
Utilisation (4,634) (8,840)
Recognition of previously unrecognised tax losses (700) –
Effect of change in tax rates (739) –
Exchange rate differences (3,055) (1,085)
Change from reassessment (4,787) 3,342
Resulting from acquisitions 3,122 96
As of 31 December 14,867 24,738
Reassessment of tax compensation opportunities under applicable tax regulations has resulted in a decrease of
unrecognised deferred tax assets of EUR 4.8 million negative (2007: EUR 3.3 million positive).
Of the total recognised and unrecognised deferred tax assets in respect of tax losses carried forward an amount
of EUR 1,154 thousand expires in periods varying from two to fi ve years. An amount of EUR 477 thousand expires
between fi ve and ten years and an amount of EUR 9,491 thousand can be offset indefi nitely. The deductible
temporary differences and capital allowances do not expire under current tax legislation. Deferred tax assets
have not been recognised in respect of these items because it is not probable that future taxable profi t will be
available against which the Group can utilise these benefi ts.
Based on forecasted results per tax jurisdiction, management considered it probable that suffi cient future
taxable profi t will be generated to utilise deferred tax assets depending on taxable profi ts in excess of the profi ts
arising from the reversal of existing temporary differences.
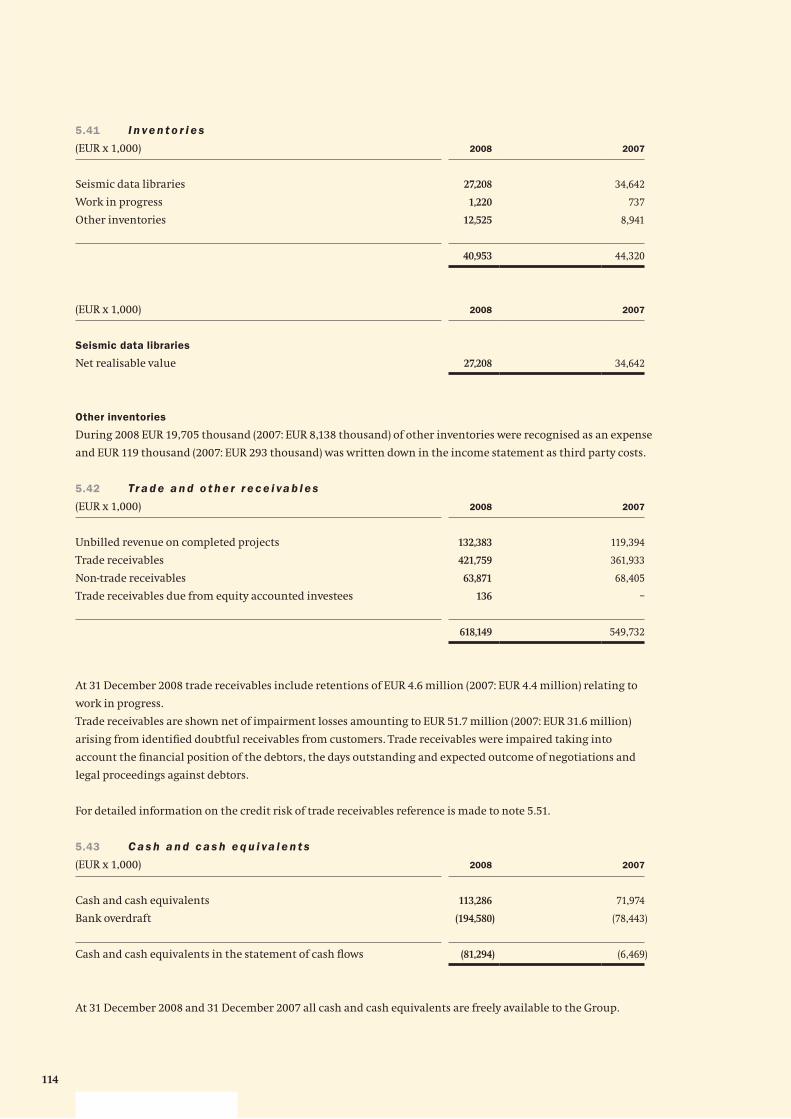
114
5.41 I n ve n t o r i e s
(EUR x 1,000) 2008 2007
Seismic data libraries 27,208 34,642
Work in progress 1,220 737
Other inventories 12,525 8,941
40,953 44,320
(EUR x 1,000) 2008 2007
Seismic data libraries
Net realisable value 27,208 34,642
Other inventories
During 2008 EUR 19,705 thousand (2007: EUR 8,138 thousand) of other inventories were recognised as an expense
and EUR 119 thousand (2007: EUR 293 thousand) was written down in the income statement as third party costs.
5.42 Tr a d e a n d o t h e r r e c e i va b l e s
(EUR x 1,000) 2008 2007
Unbilled revenue on completed projects 132,383 119,394
Trade receivables 421,759 361,933
Non-trade receivables 63,871 68,405
Trade receivables due from equity accounted investees 136 –
618,149 549,732
At 31 December 2008 trade receivables include retentions of EUR 4.6 million (2007: EUR 4.4 million) relating to
work in progress.
Trade receivables are shown net of impairment losses amounting to EUR 51.7 million (2007: EUR 31.6 million)
arising from identifi ed doubtful receivables from customers. Trade receivables were impaired taking into
account the fi nancial position of the debtors, the days outstanding and expected outcome of negotiations and
legal proceedings against debtors.
For detailed information on the credit risk of trade receivables reference is made to note 5.51.
5.43 C a s h a n d c a s h e q u i va l e n t s
(EUR x 1,000) 2008 2007
Cash and cash equivalents 113,286 71,974
Bank overdraft (194,580) (78,443)
Cash and cash equivalents in the statement of cash fl ows (81,294) (6,469)
At 31 December 2008 and 31 December 2007 all cash and cash equivalents are freely available to the Group.
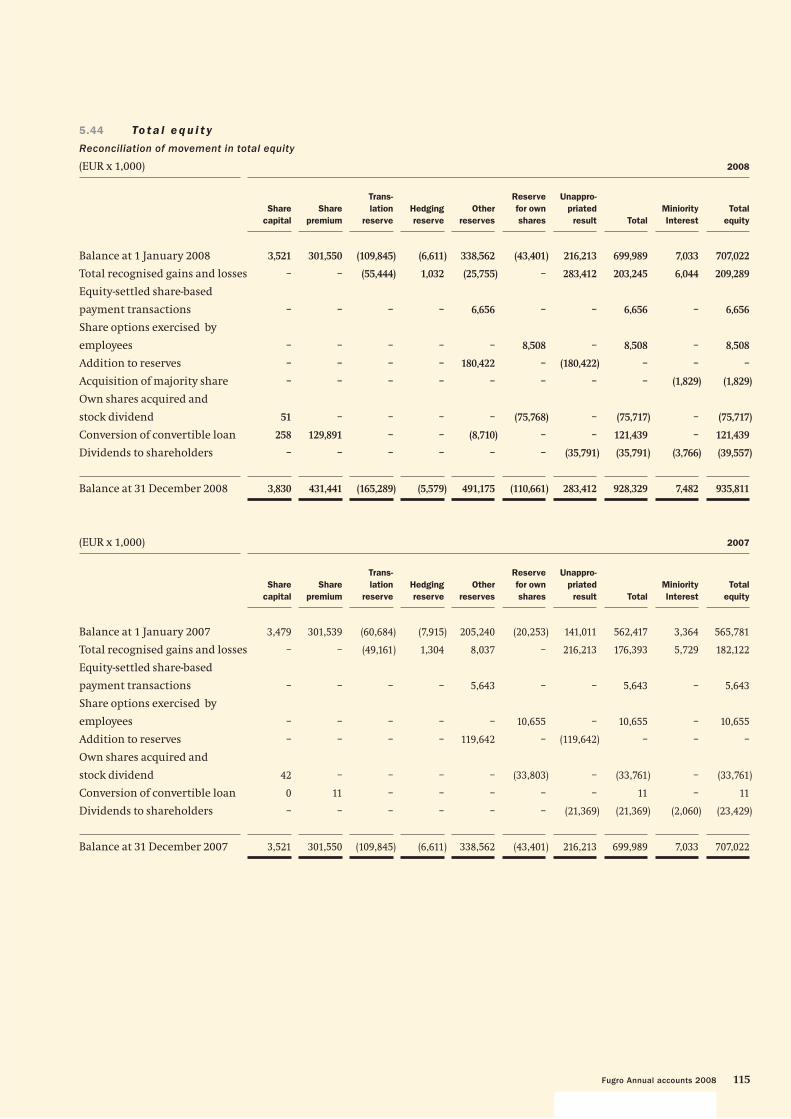
115Fugro Annual accounts 2008
5.44 To t a l e q u i t y
Reconciliation of movement in total equity
(EUR x 1,000) 2008
Share
capital
Share
premium
Trans-
lation
reserve
Hedging
reserve
Other
reserves
Reserve
for own
shares
Unappro-
priated
result Total
Miniority
Interest
Total
equity
Balance at 1 January 2008 3,521 301,550 (109,845) (6,611) 338,562 (43,401) 216,213 699,989 7,033 707,022
Total recognised gains and losses – – (55,444) 1,032 (25,755) – 283,412 203,245 6,044 209,289
Equity-settled share-based
payment transactions – – – – 6,656 – – 6,656 – 6,656
Share options exercised by
employees – – – – – 8,508 – 8,508 – 8,508
Addition to reserves – – – – 180,422 – (180,422) – – –
Acquisition of majority share – – – – – – – – (1,829) (1,829)
Own shares acquired and
stock dividend 51 – – – – (75,768) – (75,717) – (75,717)
Conversion of convertible loan 258 129,891 – – (8,710) – – 121,439 – 121,439
Dividends to shareholders – – – – – – (35,791) (35,791) (3,766) (39,557)
Balance at 31 December 2008 3,830 431,441 (165,289) (5,579) 491,175 (110,661) 283,412 928,329 7,482 935,811
(EUR x 1,000) 2007
Share
capital
Share
premium
Trans-
lation
reserve
Hedging
reserve
Other
reserves
Reserve
for own
shares
Unappro-
priated
result Total
Miniority
Interest
Total
equity
Balance at 1 January 2007 3,479 301,539 (60,684) (7,915) 205,240 (20,253) 141,011 562,417 3,364 565,781
Total recognised gains and losses – – (49,161) 1,304 8,037 – 216,213 176,393 5,729 182,122
Equity-settled share-based
payment transactions – – – – 5,643 – – 5,643 – 5,643
Share options exercised by
employees – – – – – 10,655 – 10,655 – 10,655
Addition to reserves – – – – 119,642 – (119,642) – – –
Own shares acquired and
stock dividend 42 – – – – (33,803) – (33,761) – (33,761)
Conversion of convertible loan 0 11 – – – – – 11 – 11
Dividends to shareholders – – – – – – (21,369) (21,369) (2,060) (23,429)
Balance at 31 December 2007 3,521 301,550 (109,845) (6,611) 338,562 (43,401) 216,213 699,989 7,033 707,022
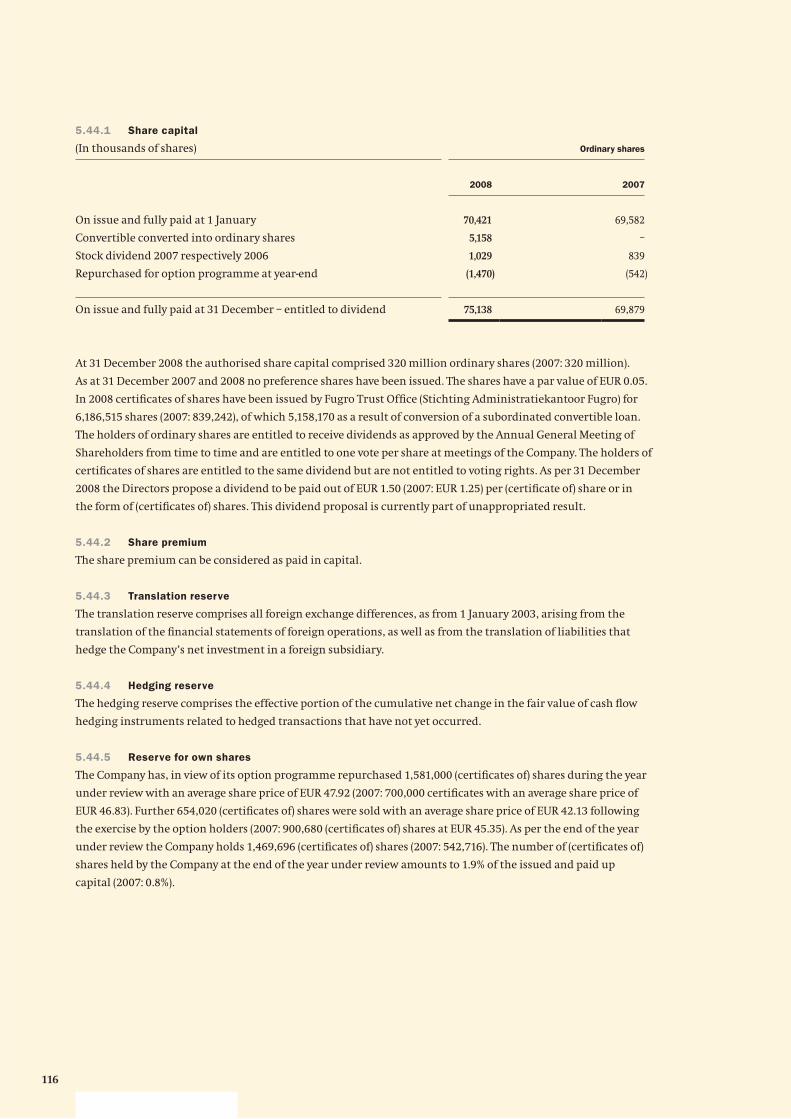
116
5.44.1 Share capital
(In thousands of shares) Ordinary shares
2008 2007
On issue and fully paid at 1 January 70,421 69,582
Convertible converted into ordinary shares 5,158 –
Stock dividend 2007 respectively 2006 1,029 839
Repurchased for option programme at year-end (1,470) (542)
On issue and fully paid at 31 December – entitled to dividend 75,138 69,879
At 31 December 2008 the authorised share capital comprised 320 million ordinary shares (2007: 320 million).
As at 31 December 2007 and 2008 no preference shares have been issued. The shares have a par value of EUR 0.05.
In 2008 certifi cates of shares have been issued by Fugro Trust Offi ce (Stichting Administratiekantoor Fugro) for
6,186,515 shares (2007: 839,242), of which 5,158,170 as a result of conversion of a subordinated convertible loan.
The holders of ordinary shares are entitled to receive dividends as approved by the Annual General Meeting of
Shareholders from time to time and are entitled to one vote per share at meetings of the Company. The holders of
certifi cates of shares are entitled to the same dividend but are not entitled to voting rights. As per 31 December
2008 the Directors propose a dividend to be paid out of EUR 1.50 (2007: EUR 1.25) per (certifi cate of) share or in
the form of (certifi cates of) shares. This dividend proposal is currently part of unappropriated result.
5.44.2 Share premium
The share premium can be considered as paid in capital.
5.44.3 Translation reserve
The translation reserve comprises all foreign exchange differences, as from 1 January 2003, arising from the
translation of the fi nancial statements of foreign operations, as well as from the translation of liabilities that
hedge the Company’s net investment in a foreign subsidiary.
5.44.4 Hedging reserve
The hedging reserve comprises the effective portion of the cumulative net change in the fair value of cash fl ow
hedging instruments related to hedged transactions that have not yet occurred.
5.44.5 Reserve for own shares
The Company has, in view of its option programme repurchased 1,581,000 (certifi cates of) shares during the year
under review with an average share price of EUR 47.92 (2007: 700,000 certifi cates with an average share price of
EUR 46.83). Further 654,020 (certifi cates of) shares were sold with an average share price of EUR 42.13 following
the exercise by the option holders (2007: 900,680 (certifi cates of) shares at EUR 45.35). As per the end of the year
under review the Company holds 1,469,696 (certifi cates of) shares (2007: 542,716). The number of (certifi cates of)
shares held by the Company at the end of the year under review amounts to 1.9% of the issued and paid up
capital (2007: 0.8%).
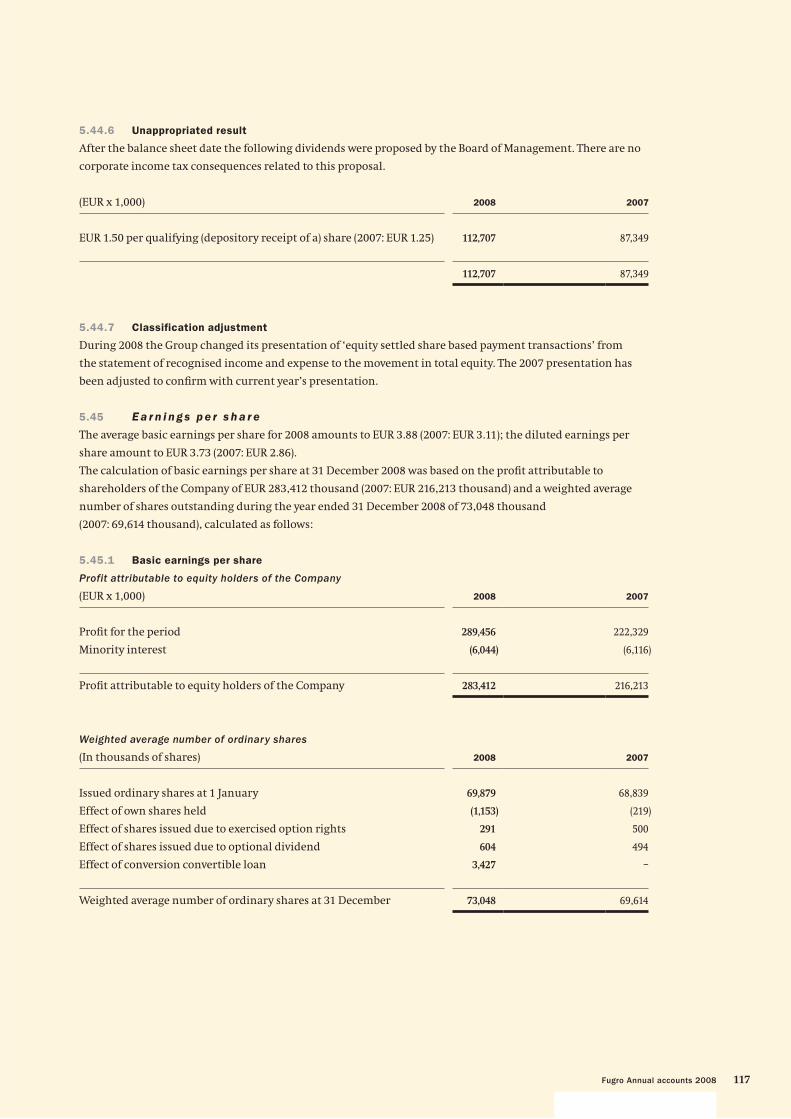
117Fugro Annual accounts 2008
5.44.6 Unappropriated result
After the balance sheet date the following dividends were proposed by the Board of Management. There are no
corporate income tax consequences related to this proposal.
(EUR x 1,000) 2008 2007
EUR 1.50 per qualifying (depository receipt of a) share (2007: EUR 1.25) 112,707 87,349
112,707 87,349
5.44.7 Classification adjustment
During 2008 the Group changed its presentation of ‘equity settled share based payment transactions’ from
the statement of recognised income and expense to the movement in total equity. The 2007 presentation has
been adjusted to confi rm with current year’s presentation.
5.45 E a r n i n g s p e r s h a r e
The average basic earnings per share for 2008 amounts to EUR 3.88 (2007: EUR 3.11); the diluted earnings per
share amount to EUR 3.73 (2007: EUR 2.86).
The calculation of basic earnings per share at 31 December 2008 was based on the profi t attributable to
shareholders of the Company of EUR 283,412 thousand (2007: EUR 216,213 thousand) and a weighted average
number of shares outstanding during the year ended 31 December 2008 of 73,048 thousand
(2007: 69,614 thousand), calculated as follows:
5.45.1 Basic earnings per share
Profit attributable to equity holders of the Company
(EUR x 1,000) 2008 2007
Profi t for the period 289,456 222,329
Minority interest (6,044) (6,116)
Profi t attributable to equity holders of the Company 283,412 216,213
Weighted average number of ordinary shares
(In thousands of shares) 2008 2007
Issued ordinary shares at 1 January 69,879 68,839
Effect of own shares held (1,153) (219)
Effect of shares issued due to exercised option rights 291 500
Effect of shares issued due to optional dividend 604 494
Effect of conversion convertible loan 3,427 –
Weighted average number of ordinary shares at 31 December 73,048 69,614
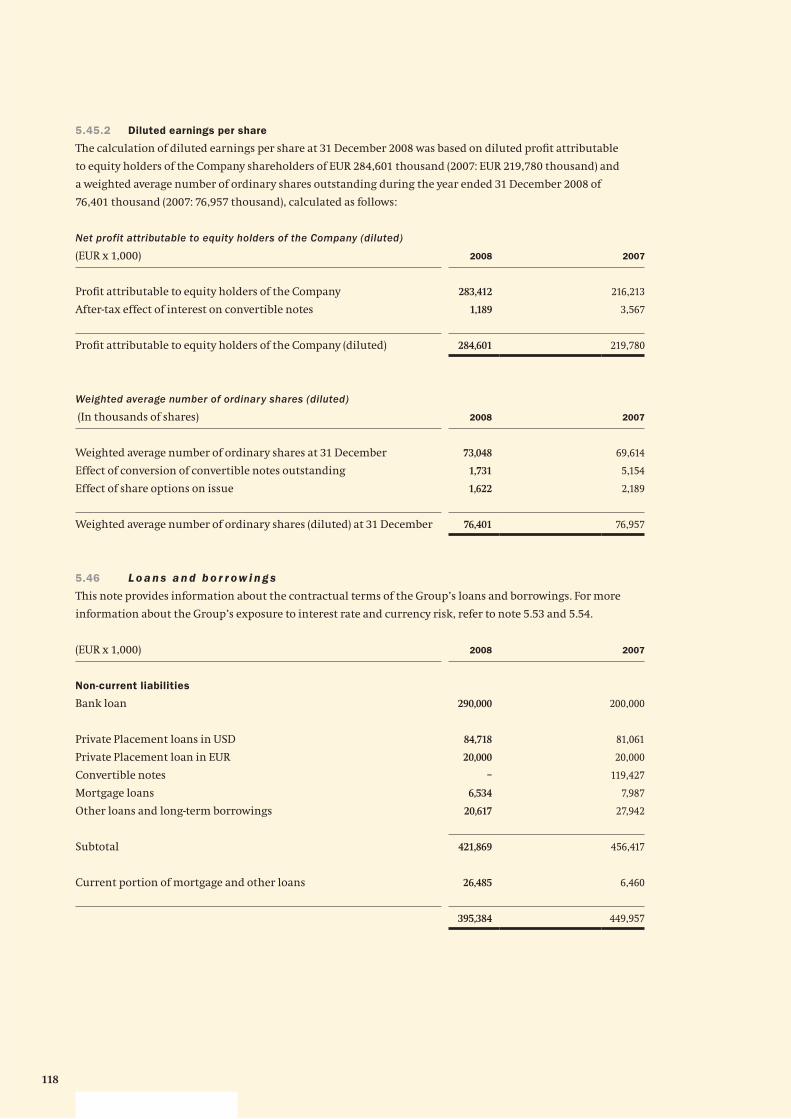
118
5.45.2 Diluted earnings per share
The calculation of diluted earnings per share at 31 December 2008 was based on diluted profi t attributable
to equity holders of the Company shareholders of EUR 284,601 thousand (2007: EUR 219,780 thousand) and
a weighted average number of ordinary shares outstanding during the year ended 31 December 2008 of
76,401 thousand (2007: 76,957 thousand), calculated as follows:
Net profit attributable to equity holders of the Company (diluted)
(EUR x 1,000) 2008 2007
Profi t attributable to equity holders of the Company 283,412 216,213
After-tax effect of interest on convertible notes 1,189 3,567
Profi t attributable to equity holders of the Company (diluted) 284,601 219,780
Weighted average number of ordinary shares (diluted)
(In thousands of shares) 2008 2007
Weighted average number of ordinary shares at 31 December 73,048 69,614
Effect of conversion of convertible notes outstanding 1,731 5,154
Effect of share options on issue 1,622 2,189
Weighted average number of ordinary shares (diluted) at 31 December 76,401 76,957
5.46 L o a n s a n d b o r r ow i n g s
This note provides information about the contractual terms of the Group’s loans and borrowings. For more
information about the Group’s exposure to interest rate and currency risk, refer to note 5.53 and 5.54.
(EUR x 1,000) 2008 2007
Non-current liabilities
Bank loan 290,000 200,000
Private Placement loans in USD 84,718 81,061
Private Placement loan in EUR 20,000 20,000
Convertible notes – 119,427
Mortgage loans 6,534 7,987
Other loans and long-term borrowings 20,617 27,942
Subtotal 421,869 456,417
Current portion of mortgage and other loans 26,485 6,460
395,384 449,957
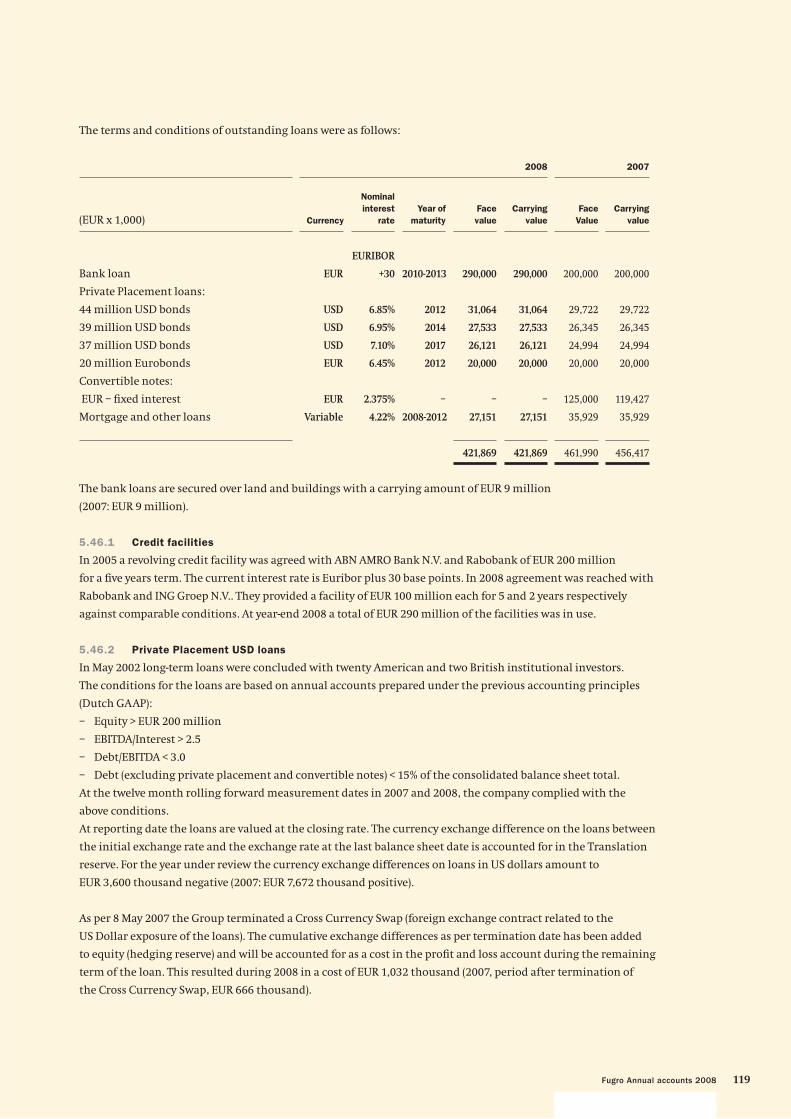
119Fugro Annual accounts 2008
The terms and conditions of outstanding loans were as follows:
2008 2007
(EUR x 1,000) Currency
Nominal
interest
rate
Year of
maturity
Face
value
Carrying
value
Face
Value
Carrying
value
Bank loan EUR
EURIBOR
+30 2010-2013 290,000 290,000 200,000 200,000
Private Placement loans:
44 million USD bonds USD 6.85% 2012 31,064 31,064 29,722 29,722
39 million USD bonds USD 6.95% 2014 27,533 27,533 26,345 26,345
37 million USD bonds USD 7.10% 2017 26,121 26,121 24,994 24,994
20 million Eurobonds EUR 6.45% 2012 20,000 20,000 20,000 20,000
Convertible notes:
EUR – fi xed interest EUR 2.375% – – – 125,000 119,427
Mortgage and other loans Variable 4.22% 2008-2012 27,151 27,151 35,929 35,929
421,869 421,869 461,990 456,417
The bank loans are secured over land and buildings with a carrying amount of EUR 9 million
(2007: EUR 9 million).
5.46.1 Credit facilities
In 2005 a revolving credit facility was agreed with ABN AMRO Bank N.V. and Rabobank of EUR 200 million
for a fi ve years term. The current interest rate is Euribor plus 30 base points. In 2008 agreement was reached with
Rabobank and ING Groep N.V.. They provided a facility of EUR 100 million each for 5 and 2 years respectively
against comparable conditions. At year-end 2008 a total of EUR 290 million of the facilities was in use.
5.46.2 Private Placement USD loans
In May 2002 long-term loans were concluded with twenty American and two British institutional investors.
The conditions for the loans are based on annual accounts prepared under the previous accounting principles
(Dutch GAAP):
– Equity > EUR 200 million
– EBITDA/Interest > 2.5
– Debt/EBITDA < 3.0
– Debt (excluding private placement and convertible notes) < 15% of the consolidated balance sheet total.
At the twelve month rolling forward measurement dates in 2007 and 2008, the company complied with the
above conditions.
At reporting date the loans are valued at the closing rate. The currency exchange difference on the loans between
the initial exchange rate and the exchange rate at the last balance sheet date is accounted for in the Translation
reserve. For the year under review the currency exchange differences on loans in US dollars amount to
EUR 3,600 thousand negative (2007: EUR 7,672 thousand positive).
As per 8 May 2007 the Group terminated a Cross Currency Swap (foreign exchange contract related to the
US Dollar exposure of the loans). The cumulative exchange differences as per termination date has been added
to equity (hedging reserve) and will be accounted for as a cost in the profi t and loss account during the remaining
term of the loan. This resulted during 2008 in a cost of EUR 1,032 thousand (2007, period after termination of
the Cross Currency Swap, EUR 666 thousand).
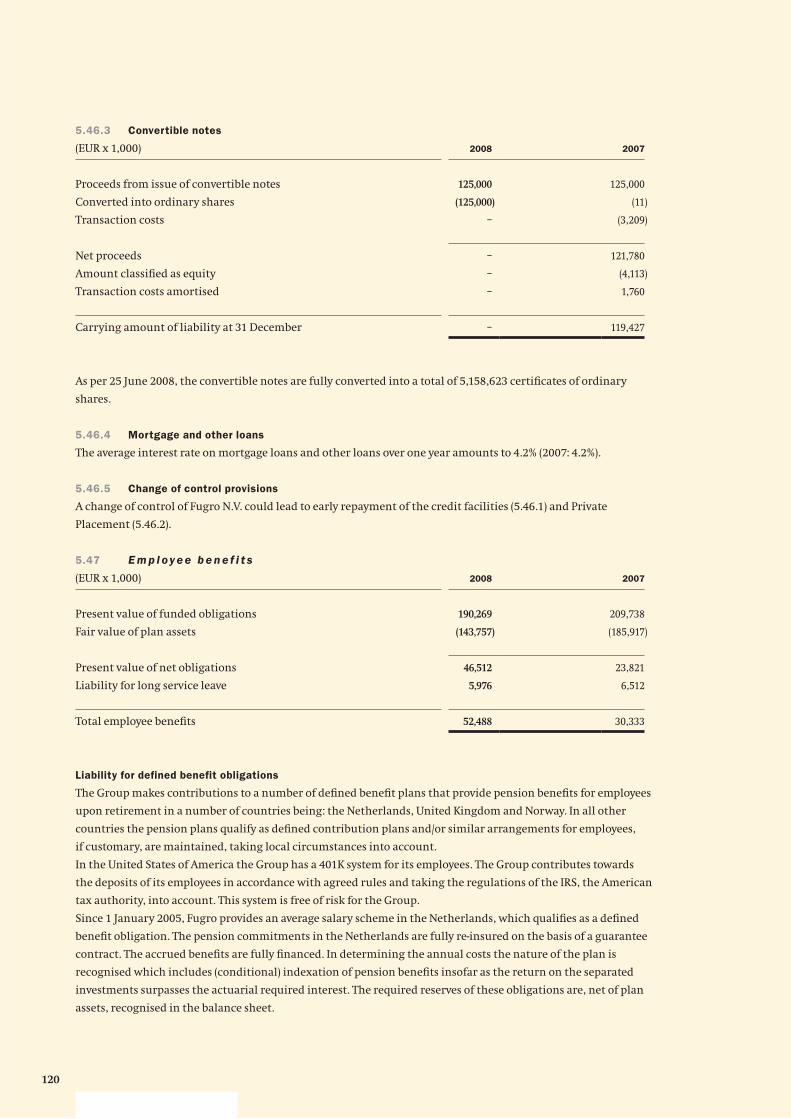
120
5.46.3 Convertible notes
(EUR x 1,000) 2008 2007
Proceeds from issue of convertible notes 125,000 125,000
Converted into ordinary shares (125,000) (11)
Transaction costs – (3,209)
Net proceeds – 121,780
Amount classifi ed as equity – (4,113)
Transaction costs amortised – 1,760
Carrying amount of liability at 31 December – 119,427
As per 25 June 2008, the convertible notes are fully converted into a total of 5,158,623 certifi cates of ordinary
shares.
5.46.4 Mortgage and other loans
The average interest rate on mortgage loans and other loans over one year amounts to 4.2% (2007: 4.2%).
5.46.5 Change of control provisions
A change of control of Fugro N.V. could lead to early repayment of the credit facilities (5.46.1) and Private
Placement (5.46.2).
5.47 E m p l oy e e b e n e f i t s
(EUR x 1,000) 2008 2007
Present value of funded obligations 190,269 209,738
Fair value of plan assets (143,757) (185,917)
Present value of net obligations 46,512 23,821
Liability for long service leave 5,976 6,512
Total employee benefi ts 52,488 30,333
Liability for defined benefit obligations
The Group makes contributions to a number of defi ned benefi t plans that provide pension benefi ts for employees
upon retirement in a number of countries being: the Netherlands, United Kingdom and Norway. In all other
countries the pension plans qualify as defi ned contribution plans and/or similar arrangements for employees,
if customary, are maintained, taking local circumstances into account.
In the United States of America the Group has a 401K system for its employees. The Group contributes towards
the deposits of its employees in accordance with agreed rules and taking the regulations of the IRS, the American
tax authority, into account. This system is free of risk for the Group.
Since 1 January 2005, Fugro provides an average salary scheme in the Netherlands, which qualifi es as a defi ned
benefi t obligation. The pension commitments in the Netherlands are fully re-insured on the basis of a guarantee
contract. The accrued benefi ts are fully fi nanced. In determining the annual costs the nature of the plan is
recognised which includes (conditional) indexation of pension benefi ts insofar as the return on the separated
investments surpasses the actuarial required interest. The required reserves of these obligations are, net of plan
assets, recognised in the balance sheet.
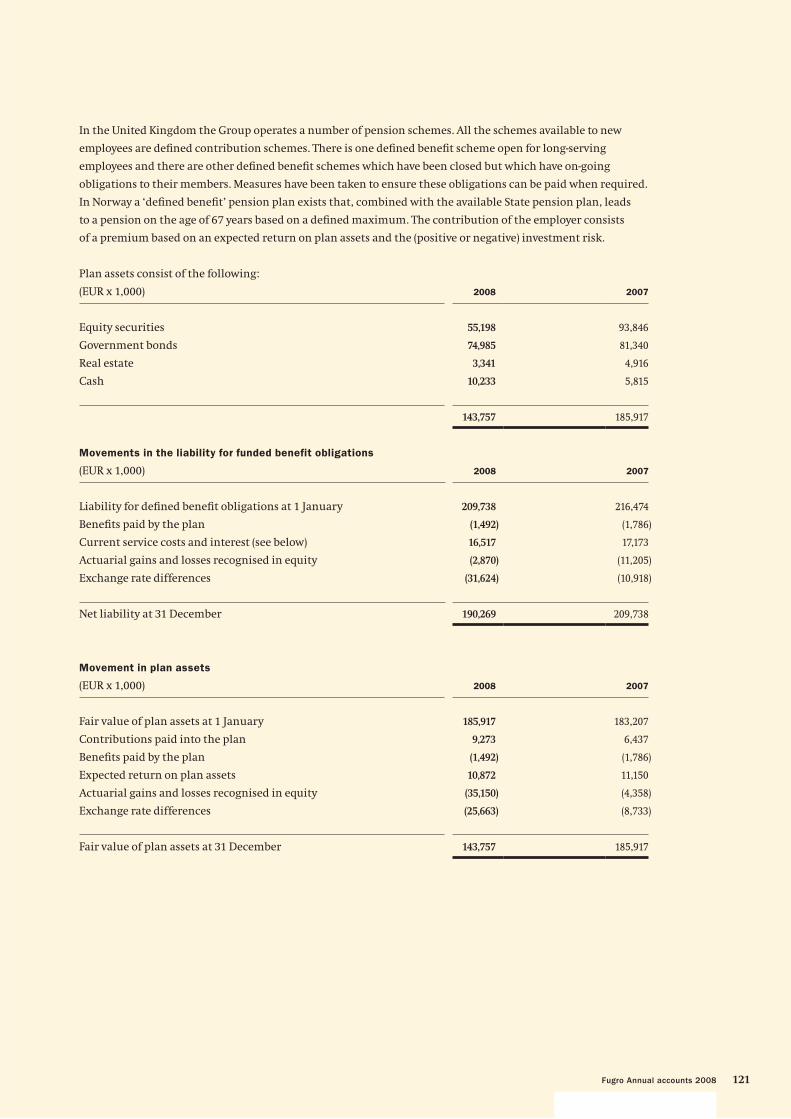
121Fugro Annual accounts 2008
In the United Kingdom the Group operates a number of pension schemes. All the schemes available to new
employees are defi ned contribution schemes. There is one defi ned benefi t scheme open for long-serving
employees and there are other defi ned benefi t schemes which have been closed but which have on-going
obligations to their members. Measures have been taken to ensure these obligations can be paid when required.
In Norway a ‘defi ned benefi t’ pension plan exists that, combined with the available State pension plan, leads
to a pension on the age of 67 years based on a defi ned maximum. The contribution of the employer consists
of a premium based on an expected return on plan assets and the (positive or negative) investment risk.
Plan assets consist of the following:
(EUR x 1,000) 2008 2007
Equity securities 55,198 93,846
Government bonds 74,985 81,340
Real estate 3,341 4,916
Cash 10,233 5,815
143,757 185,917
Movements in the liability for funded benefit obligations
(EUR x 1,000) 2008 2007
Liability for defi ned benefi t obligations at 1 January 209,738 216,474
Benefi ts paid by the plan (1,492) (1,786)
Current service costs and interest (see below) 16,517 17,173
Actuarial gains and losses recognised in equity (2,870) (11,205)
Exchange rate differences (31,624) (10,918)
Net liability at 31 December 190,269 209,738
Movement in plan assets
(EUR x 1,000) 2008 2007
Fair value of plan assets at 1 January 185,917 183,207
Contributions paid into the plan 9,273 6,437
Benefi ts paid by the plan (1,492) (1,786)
Expected return on plan assets 10,872 11,150
Actuarial gains and losses recognised in equity (35,150) (4,358)
Exchange rate differences (25,663) (8,733)
Fair value of plan assets at 31 December 143,757 185,917
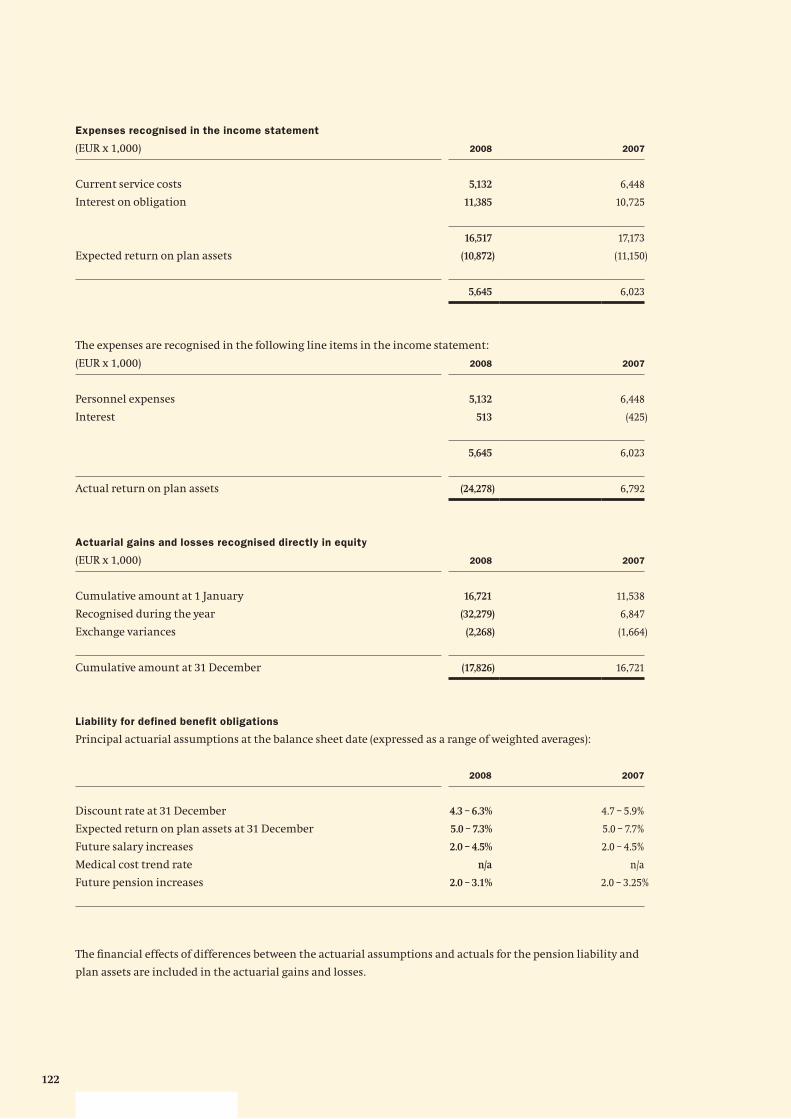
122
Expenses recognised in the income statement
(EUR x 1,000) 2008 2007
Current service costs 5,132 6,448
Interest on obligation 11,385 10,725
16,517 17,173
Expected return on plan assets (10,872) (11,150)
5,645 6,023
The expenses are recognised in the following line items in the income statement:
(EUR x 1,000) 2008 2007
Personnel expenses 5,132 6,448
Interest 513 (425)
5,645 6,023
Actual return on plan assets (24,278) 6,792
Actuarial gains and losses recognised directly in equity
(EUR x 1,000) 2008 2007
Cumulative amount at 1 January 16,721 11,538
Recognised during the year (32,279) 6,847
Exchange variances (2,268) (1,664)
Cumulative amount at 31 December (17,826) 16,721
Liability for defined benefit obligations
Principal actuarial assumptions at the balance sheet date (expressed as a range of weighted averages):
2008 2007
Discount rate at 31 December 4.3 – 6.3% 4.7 – 5.9%
Expected return on plan assets at 31 December 5.0 – 7.3% 5.0 – 7.7%
Future salary increases 2.0 – 4.5% 2.0 – 4.5%
Medical cost trend rate n/a n/a
Future pension increases 2.0 – 3.1% 2.0 – 3.25%
The fi nancial effects of differences between the actuarial assumptions and actuals for the pension liability and
plan assets are included in the actuarial gains and losses.
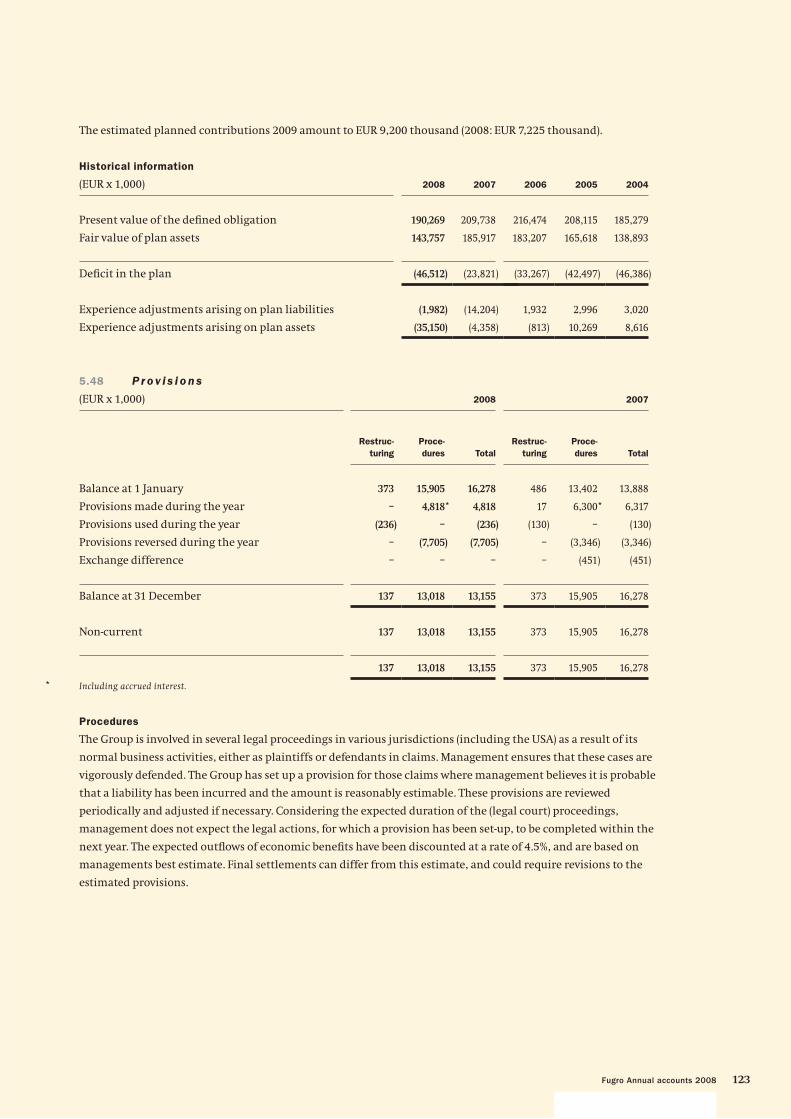
123Fugro Annual accounts 2008
The estimated planned contributions 2009 amount to EUR 9,200 thousand (2008: EUR 7,225 thousand).
Historical information
(EUR x 1,000) 2008 2007 2006 2005 2004
Present value of the defi ned obligation 190,269 209,738 216,474 208,115 185,279
Fair value of plan assets 143,757 185,917 183,207 165,618 138,893
Defi cit in the plan (46,512) (23,821) (33,267) (42,497) (46,386)
Experience adjustments arising on plan liabilities (1,982) (14,204) 1,932 2,996 3,020
Experience adjustments arising on plan assets (35,150) (4,358) (813) 10,269 8,616
5.48 P r o v i s i o n s
(EUR x 1,000) 2008 2007
Restruc-
turing
Proce-
dures Total
Restruc-
turing
Proce-
dures Total
Balance at 1 January 373 15,905 16,278 486 13,402 13,888
Provisions made during the year – 4,818 4,818 17 6,300 6,317
Provisions used during the year (236) – (236) (130) – (130)
Provisions reversed during the year – (7,705) (7,705) – (3,346) (3,346)
Exchange difference – – – – (451) (451)
Balance at 31 December 137 13,018 13,155 373 15,905 16,278
Non-current 137 13,018 13,155 373 15,905 16,278
137 13,018 13,155 373 15,905 16,278
* Including accrued interest.
Procedures
The Group is involved in several legal proceedings in various jurisdictions (including the USA) as a result of its
normal business activities, either as plaintiffs or defendants in claims. Management ensures that these cases are
vigorously defended. The Group has set up a provision for those claims where management believes it is probable
that a liability has been incurred and the amount is reasonably estimable. These provisions are reviewed
periodically and adjusted if necessary. Considering the expected duration of the (legal court) proceedings,
management does not expect the legal actions, for which a provision has been set-up, to be completed within the
next year. The expected outfl ows of economic benefi ts have been discounted at a rate of 4.5%, and are based on
managements best estimate. Final settlements can differ from this estimate, and could require revisions to the
estimated provisions.
* *
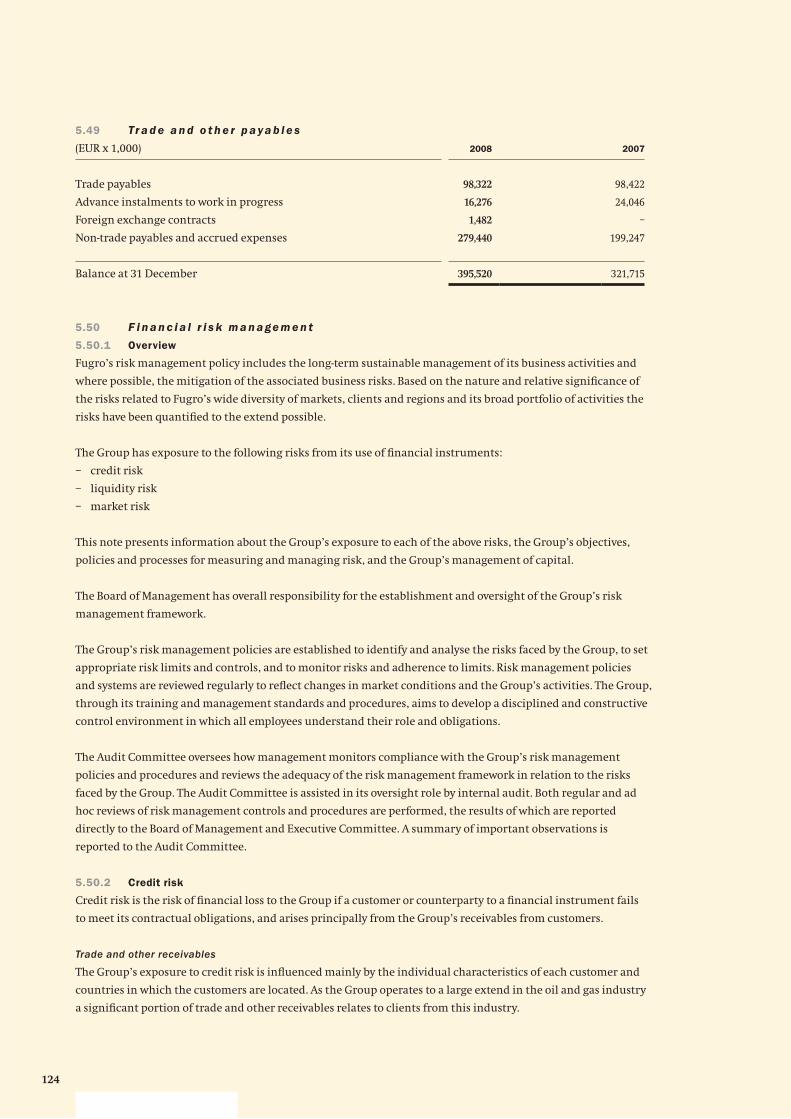
124
5.49 Tr a d e a n d o t h e r p a ya b l e s
(EUR x 1,000) 2008 2007
Trade payables 98,322 98,422
Advance instalments to work in progress 16,276 24,046
Foreign exchange contracts 1,482 –
Non-trade payables and accrued expenses 279,440 199,247
Balance at 31 December 395,520 321,715
5.50 F i n a n c i a l r i s k m a n a ge m e n t
5.50.1 Overview
Fugro’s risk management policy includes the long-term sustainable management of its business activities and
where possible, the mitigation of the associated business risks. Based on the nature and relative signifi cance of
the risks related to Fugro’s wide diversity of markets, clients and regions and its broad portfolio of activities the
risks have been quantifi ed to the extend possible.
The Group has exposure to the following risks from its use of fi nancial instruments:
– credit risk
– liquidity risk
– market risk
This note presents information about the Group’s exposure to each of the above risks, the Group’s objectives,
policies and processes for measuring and managing risk, and the Group’s management of capital.
The Board of Management has overall responsibility for the establishment and oversight of the Group’s risk
management framework.
The Group’s risk management policies are established to identify and analyse the risks faced by the Group, to set
appropriate risk limits and controls, and to monitor risks and adherence to limits. Risk management policies
and systems are reviewed regularly to refl ect changes in market conditions and the Group’s activities. The Group,
through its training and management standards and procedures, aims to develop a disciplined and constructive
control environment in which all employees understand their role and obligations.
The Audit Committee oversees how management monitors compliance with the Group’s risk management
policies and procedures and reviews the adequacy of the risk management framework in relation to the risks
faced by the Group. The Audit Committee is assisted in its oversight role by internal audit. Both regular and ad
hoc reviews of risk management controls and procedures are performed, the results of which are reported
directly to the Board of Management and Executive Committee. A summary of important observations is
reported to the Audit Committee.
5.50.2 Credit risk
Credit risk is the risk of fi nancial loss to the Group if a customer or counterparty to a fi nancial instrument fails
to meet its contractual obligations, and arises principally from the Group’s receivables from customers.
Trade and other receivables
The Group’s exposure to credit risk is infl uenced mainly by the individual characteristics of each customer and
countries in which the customers are located. As the Group operates to a large extend in the oil and gas industry
a signifi cant portion of trade and other receivables relates to clients from this industry.
125Fugro Annual accounts 2008
Some of the Group’s orders are awarded on the basis of long-term preferred supplier agreements. In the course of
a year Fugro often carries out multiple projects for the same client. The projects carried out for any single client
do not, however, account for more than 4% on an annual basis of the total revenue. Having a large number of
clients and short project time spans mitigates Fugro’s credit risk as the individual amounts receivable with the
same client are limited.
New customers are analysed individually for creditworthiness before payment and delivery terms and conditions
are offered. The Group’s review may include external ratings, where available, and in some cases bank
references. Customers that fail to meet the Group’s benchmark creditworthiness may transact with the Group
only on a prepayment basis or have to provide a bank guarantee.
The majority of the Group’s customers have been transacting with the Group for many years, and signifi cant
losses have occurred infrequently in prior years. However, as a result of the expected negative effects of the
current worldwide economic crisis the credit risk has increased signifi cantly. Customers that are known to have
negative credit characteristics are individually monitored by the group controllers. Findings are reported on a
bi-weekly basis to the Board of Management. If customers fail to pay timely the Group re-assesses the
creditworthiness and stronger debt collection is started if deemed necessary. The Group publishes an internal
list of customers that need extra attention before a contract is closed.
The Group establishes an allowance for impairment that represents its estimate of incurred losses in respect of
trade and other receivables. The main components of this allowance are a specifi c loss component that relates to
individually signifi cant exposures for clients or countries, and a collective loss component established for groups
of similar assets in respect of losses that have been incurred but not yet identifi ed. The collective loss allowance is
determined based on historical data of payment statistics.
Guarantees
In principle the Company does not provide parent company guarantees to its subsidiaries, unless signifi cant
commercial reasons exist. The Company has deposited declarations of joint and several liability for a number
of Dutch subsidiaries at the Chambers of Commerce. The Company has deposited a list with the Chamber of
Commerce, which includes all fi nancial interests of the Group in subsidiaries as well as a reference to each
subsidiary for which such a declaration of liability has been deposited. At 31 December 2008 and at 31 December
2007 no signifi cant guarantees were outstanding.
5.50.3 Liquidity risk
Liquidity risk is the risk that the Group will not be able to meet its fi nancial obligations as they fall due.
The group’s approach to managing liquidity is to ensure that it will always have suffi cient liquidity to meet its
liabilities when due, under both normal and stressed conditions, without incurring unacceptable losses or
risking damage to the Group’s reputation.
The Group monitors cash fl ow on a regular basis. Consolidated cash fl ow information including a six months
projection is reported on a monthly basis to the Executive Committee, ensuring that the Group has suffi cient
cash on demand (or available lines of credit) to meet expected operational expenses for the next half-year,
including the servicing of fi nancial obligations from off balance sheet lease commitments and investment
programs in vessels. Cash fl ows exclude the potential impact of extreme circumstances that cannot reasonably
be predicted, such as natural disasters and currently unpredictable further negative consequences resulting
from the current worldwide economic crisis. In addition to external fi nancing shown in the balance sheet the
Group maintains the following lines of credit:
126
– Revolving line of credit with ABN AMRO Bank N.V. and Rabobank of EUR 200 million maturing in May 2010.
Interest rate is currently EURIBOR plus 30 basis points. At 31 December 2008 and 2007 (EUR 200 million) the
facility is fully drawn.
– Revolving lines of credit with Rabobank and ING Groep N.V. as of 31 December 2008 of EUR 100 million each,
maturing in May 2013 respectively in May 2010. The Rabobank facility is fully drawn at 31 December 2008.
– A variety of unsecured overdraft facilities in various currencies totalling around EUR 300 million of which
EUR 123,525 thousand has been drawn at 31 December 2008 (2007: around EUR 300 million with EUR 62,430
thousand drawn).
5.50.4 Market risk
Market risk is the risk that changes in market prices, such as foreign exchange rates and interest rates will affect
the Group’s income or the value of its holdings of fi nancial instruments. The objective of market risk
management is to manage and control market risk exposures within acceptable parameters, while optimising
the return.
Currency risk
The global nature of the business of the Group exposes the operations and reported fi nancial results and cash
fl ows to the risks arising from fl uctuations in exchange rates. The Group’s business is exposed to currency risk
whenever it has revenues in a currency that is different from the currency in which it incurs the costs of
generating those revenues. In the case that the revenues can be offset against the costs incurred in the same
currency, the balance may be affected if the value of the currency in which the revenues and costs are generated
varies relative to the Euro. This risk exposure primarily affects those operations of the Group that generates a
portion of their revenues in foreign currencies and incur their costs primarily in euros.
Cash infl ows and outfl ows of the business segments are offset if they are denominated in the same currency.
This means that revenues generated in a particular currency balance out costs in the same currency, even if the
revenues arise from a different transaction than that in which the costs are incurred. As a result, only the
unmatched amounts are subject to currency risk.
To mitigate the impact of currency exchange rate fl uctuations, the Group continually assesses the exposure
to currency risks and if deemed necessary a portion of those risks is hedged by using derivative fi nancial
instruments. The principal derivative fi nancial instruments used to cover foreign currency exposure are forward
foreign currency exchange contracts. Given the current investment program in vessels and the fact that the
majority of the investments are denominated in USD, the Group has currently not used derivative fi nancial
instruments as positive cash fl ow in USD from operations is offset to a large extend by these investments.
Interest on borrowings is denominated in currencies that match the cash fl ows generated by the underlying
operations of the Group, primarily Euro and US dollar. This substantially provides an economic hedge and no
derivatives are entered into.
The Group’s investment in its subsidiaries in the United States of America is hedged by the USD Private
Placement loans, which mitigates the currency risk arising from the subsidiary’s net assets.
The hedge on the investment is fully effective. Consequently all exchange differences relating to this hedge have
been accounted for in equity.
Interest rate risk
The Group’s liabilities bear both fi xed and variable interests Interest rate risk on long term fi nancing is generally
mitigated by fi xed interest rates. Interest rate risks is therefore limited to the short-term fi nancing of the Group.
The Group’s objective is to limit the effect of interest rate changes on the results by matching long term
investment with long term (fi xed interest) fi nancing as much as possible. The Group continuously considers
interest rate swaps to limit signifi cant (short term) interest exposures.
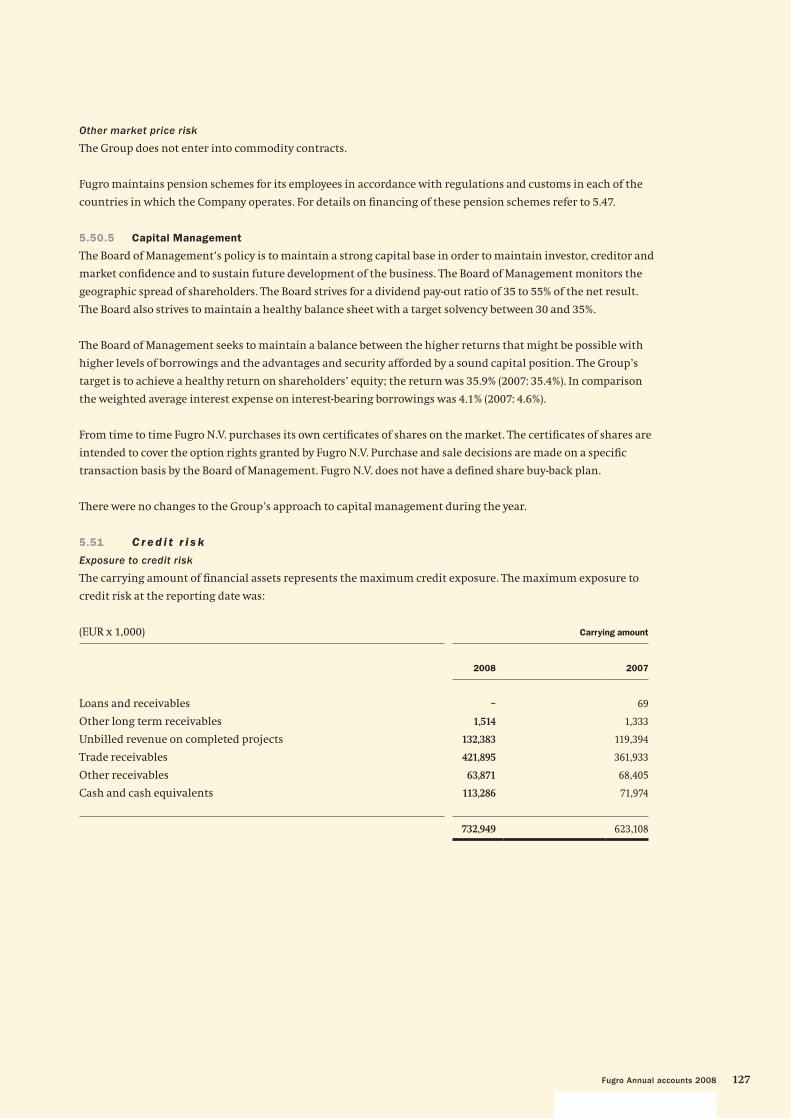
127Fugro Annual accounts 2008
Other market price risk
The Group does not enter into commodity contracts.
Fugro maintains pension schemes for its employees in accordance with regulations and customs in each of the
countries in which the Company operates. For details on fi nancing of these pension schemes refer to 5.47.
5.50.5 Capital Management
The Board of Management’s policy is to maintain a strong capital base in order to maintain investor, creditor and
market confi dence and to sustain future development of the business. The Board of Management monitors the
geographic spread of shareholders. The Board strives for a dividend pay-out ratio of 35 to 55% of the net result.
The Board also strives to maintain a healthy balance sheet with a target solvency between 30 and 35%.
The Board of Management seeks to maintain a balance between the higher returns that might be possible with
higher levels of borrowings and the advantages and security afforded by a sound capital position. The Group’s
target is to achieve a healthy return on shareholders’ equity; the return was 35.9% (2007: 35.4%). In comparison
the weighted average interest expense on interest-bearing borrowings was 4.1% (2007: 4.6%).
From time to time Fugro N.V. purchases its own certifi cates of shares on the market. The certifi cates of shares are
intended to cover the option rights granted by Fugro N.V. Purchase and sale decisions are made on a specifi c
transaction basis by the Board of Management. Fugro N.V. does not have a defi ned share buy-back plan.
There were no changes to the Group’s approach to capital management during the year.
5.51 C r e d i t r i s k
Exposure to credit risk
The carrying amount of fi nancial assets represents the maximum credit exposure. The maximum exposure to
credit risk at the reporting date was:
(EUR x 1,000) Carrying amount
2008 2007
Loans and receivables – 69
Other long term receivables 1,514 1,333
Unbilled revenue on completed projects 132,383 119,394
Trade receivables 421,895 361,933
Other receivables 63,871 68,405
Cash and cash equivalents 113,286 71,974
732,949 623,108
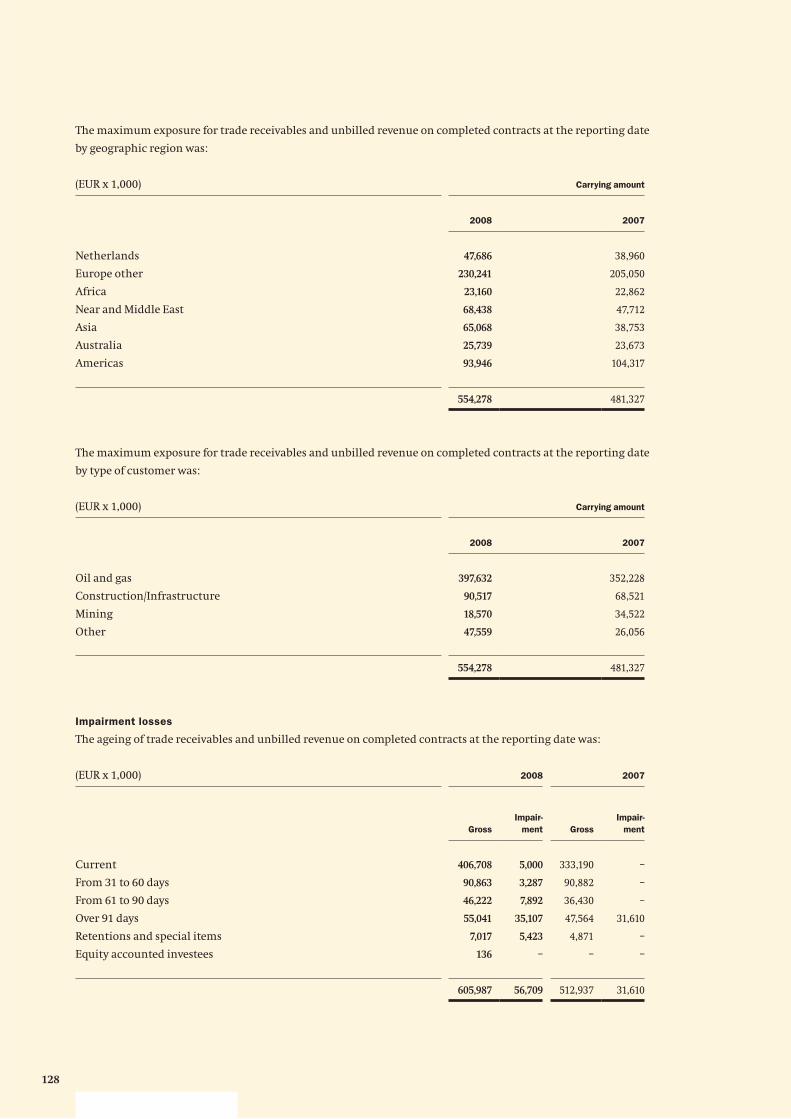
128
The maximum exposure for trade receivables and unbilled revenue on completed contracts at the reporting date
by geographic region was:
(EUR x 1,000) Carrying amount
2008 2007
Netherlands 47,686 38,960
Europe other 230,241 205,050
Africa 23,160 22,862
Near and Middle East 68,438 47,712
Asia 65,068 38,753
Australia 25,739 23,673
Americas 93,946 104,317
554,278 481,327
The maximum exposure for trade receivables and unbilled revenue on completed contracts at the reporting date
by type of customer was:
(EUR x 1,000) Carrying amount
2008 2007
Oil and gas 397,632 352,228
Construction/Infrastructure 90,517 68,521
Mining 18,570 34,522
Other 47,559 26,056
554,278 481,327
Impairment losses
The ageing of trade receivables and unbilled revenue on completed contracts at the reporting date was:
(EUR x 1,000) 2008 2007
Gross
Impair-
ment Gross
Impair-
ment
Current 406,708 5,000 333,190 –
From 31 to 60 days 90,863 3,287 90,882 –
From 61 to 90 days 46,222 7,892 36,430 –
Over 91 days 55,041 35,107 47,564 31,610
Retentions and special items 7,017 5,423 4,871 –
Equity accounted investees 136 – – –
605,987 56,709 512,937 31,610
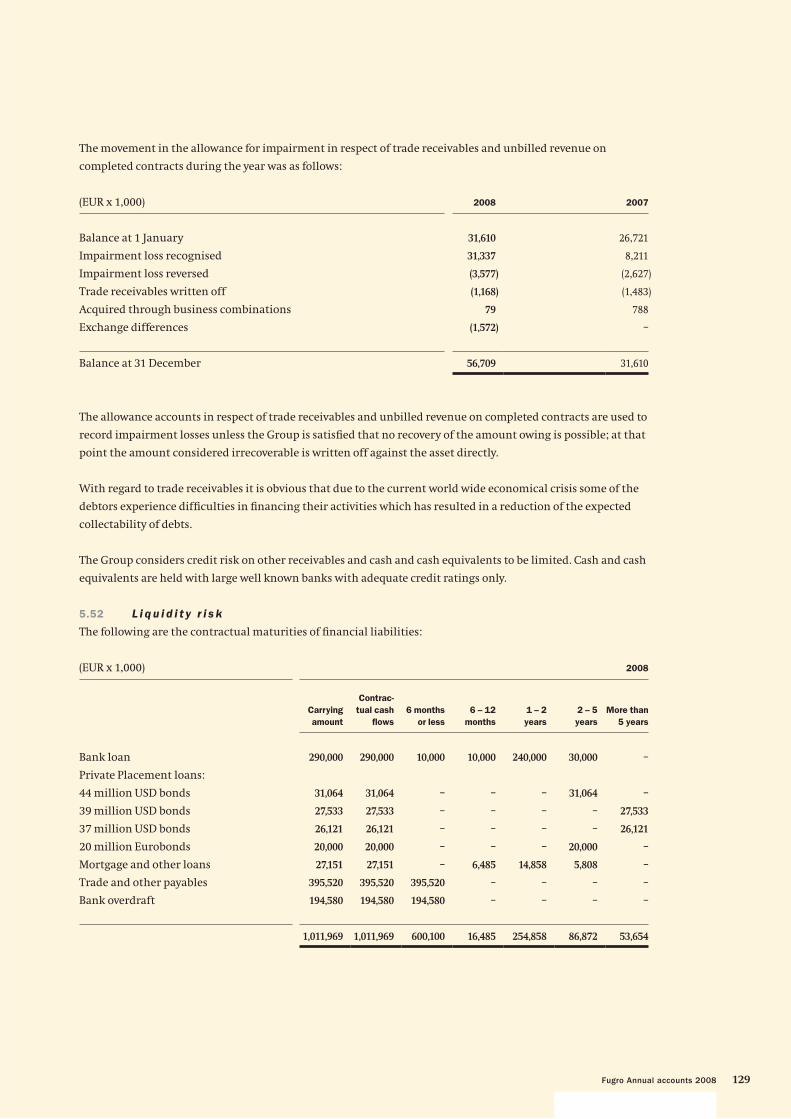
129Fugro Annual accounts 2008
The movement in the allowance for impairment in respect of trade receivables and unbilled revenue on
completed contracts during the year was as follows:
(EUR x 1,000) 2008 2007
Balance at 1 January 31,610 26,721
Impairment loss recognised 31,337 8,211
Impairment loss reversed (3,577) (2,627)
Trade receivables written off (1,168) (1,483)
Acquired through business combinations 79 788
Exchange differences (1,572) –
Balance at 31 December 56,709 31,610
The allowance accounts in respect of trade receivables and unbilled revenue on completed contracts are used to
record impairment losses unless the Group is satisfi ed that no recovery of the amount owing is possible; at that
point the amount considered irrecoverable is written off against the asset directly.
With regard to trade receivables it is obvious that due to the current world wide economical crisis some of the
debtors experience diffi culties in fi nancing their activities which has resulted in a reduction of the expected
collectability of debts.
The Group considers credit risk on other receivables and cash and cash equivalents to be limited. Cash and cash
equivalents are held with large well known banks with adequate credit ratings only.
5.52 L i q u i d i t y r i s k
The following are the contractual maturities of fi nancial liabilities:
(EUR x 1,000) 2008
Carrying
amount
Contrac-
tual cash
fl ows
6 months
or less
6 – 12
months
1 – 2
years
2 – 5
years
More than
5 years
Bank loan 290,000 290,000 10,000 10,000 240,000 30,000 –
Private Placement loans:
44 million USD bonds 31,064 31,064 – – – 31,064 –
39 million USD bonds 27,533 27,533 – – – – 27,533
37 million USD bonds 26,121 26,121 – – – – 26,121
20 million Eurobonds 20,000 20,000 – – – 20,000 –
Mortgage and other loans 27,151 27,151 – 6,485 14,858 5,808 –
Trade and other payables 395,520 395,520 395,520 – – – –
Bank overdraft 194,580 194,580 194,580 – – – –
1,011,969 1,011,969 600,100 16,485 254,858 86,872 53,654
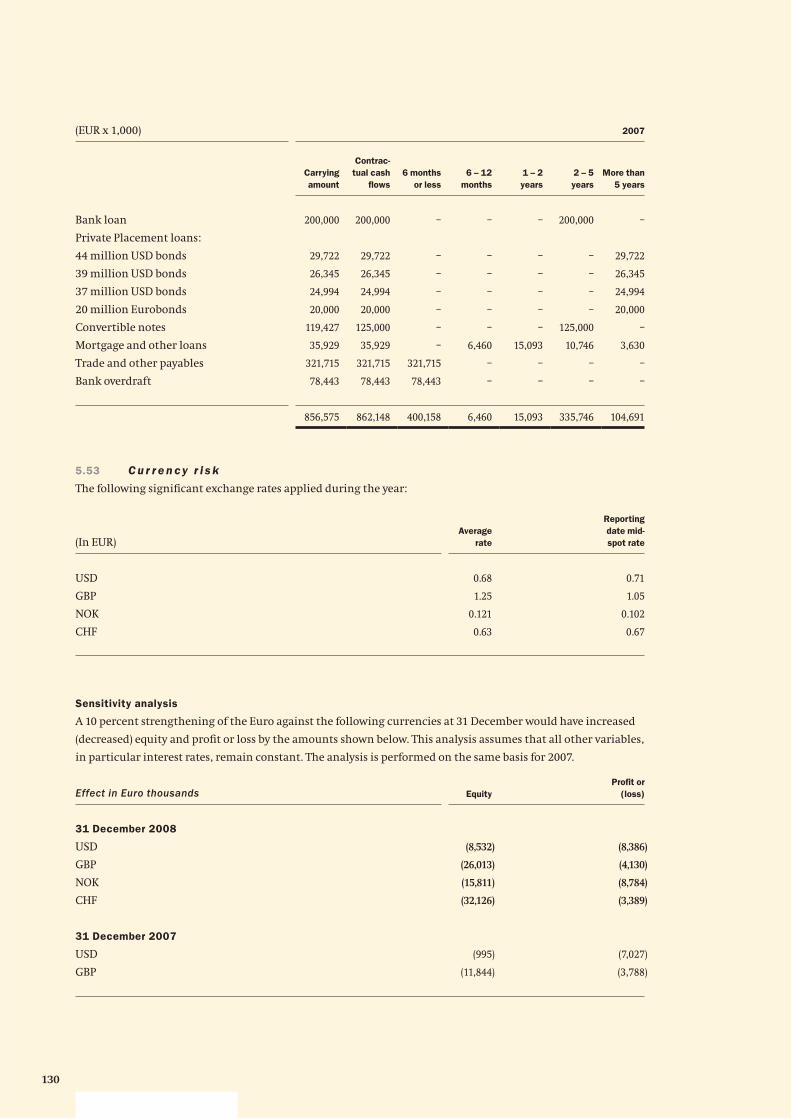
130
(EUR x 1,000) 2007
Carrying
amount
Contrac-
tual cash
fl ows
6 months
or less
6 – 12
months
1 – 2
years
2 – 5
years
More than
5 years
Bank loan 200,000 200,000 – – – 200,000 –
Private Placement loans:
44 million USD bonds 29,722 29,722 – – – – 29,722
39 million USD bonds 26,345 26,345 – – – – 26,345
37 million USD bonds 24,994 24,994 – – – – 24,994
20 million Eurobonds 20,000 20,000 – – – – 20,000
Convertible notes 119,427 125,000 – – – 125,000 –
Mortgage and other loans 35,929 35,929 – 6,460 15,093 10,746 3,630
Trade and other payables 321,715 321,715 321,715 – – – –
Bank overdraft 78,443 78,443 78,443 – – – –
856,575 862,148 400,158 6,460 15,093 335,746 104,691
5.53 C u r r e n c y r i s k
The following signifi cant exchange rates applied during the year:
(In EUR)Average
rate
Reporting
date mid-
spot rate
USD 0.68 0.71
GBP 1.25 1.05
NOK 0.121 0.102
CHF 0.63 0.67
Sensitivity analysis
A 10 percent strengthening of the Euro against the following currencies at 31 December would have increased
(decreased) equity and profi t or loss by the amounts shown below. This analysis assumes that all other variables,
in particular interest rates, remain constant. The analysis is performed on the same basis for 2007.
Effect in Euro thousands Equity
Profi t or
(loss)
31 December 2008
USD (8,532) (8,386)
GBP (26,013) (4,130)
NOK (15,811) (8,784)
CHF (32,126) (3,389)
31 December 2007
USD (995) (7,027)
GBP (11,844) (3,788)
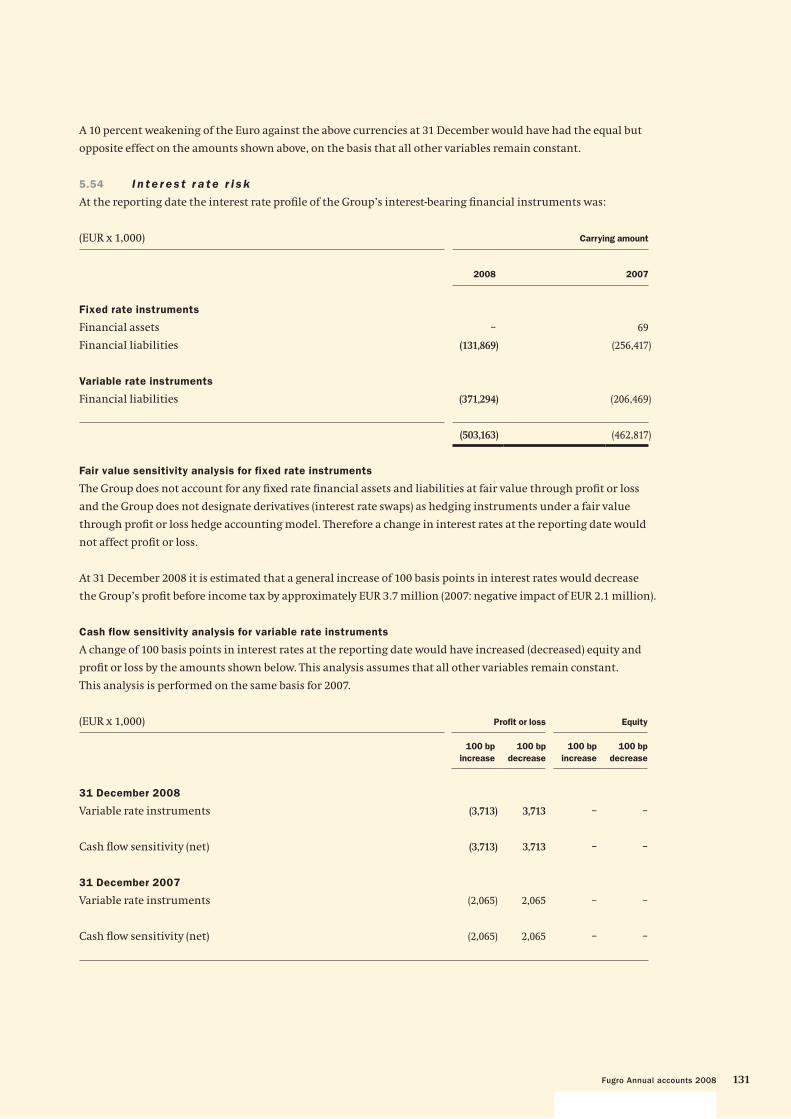
131Fugro Annual accounts 2008
A 10 percent weakening of the Euro against the above currencies at 31 December would have had the equal but
opposite effect on the amounts shown above, on the basis that all other variables remain constant.
5.54 I n t e r e s t r a t e r i s k
At the reporting date the interest rate profi le of the Group’s interest-bearing fi nancial instruments was:
(EUR x 1,000) Carrying amount
2008 2007
Fixed rate instruments
Financial assets – 69
Financial liabilities (131,869) (256,417)
Variable rate instruments
Financial liabilities (371,294) (206,469)
(503,163) (462,817)
Fair value sensitivity analysis for fixed rate instruments
The Group does not account for any fi xed rate fi nancial assets and liabilities at fair value through profi t or loss
and the Group does not designate derivatives (interest rate swaps) as hedging instruments under a fair value
through profi t or loss hedge accounting model. Therefore a change in interest rates at the reporting date would
not affect profi t or loss.
At 31 December 2008 it is estimated that a general increase of 100 basis points in interest rates would decrease
the Group’s profi t before income tax by approximately EUR 3.7 million (2007: negative impact of EUR 2.1 million).
Cash flow sensitivity analysis for variable rate instruments
A change of 100 basis points in interest rates at the reporting date would have increased (decreased) equity and
profi t or loss by the amounts shown below. This analysis assumes that all other variables remain constant.
This analysis is performed on the same basis for 2007.
(EUR x 1,000) Profi t or loss Equity
100 bp
increase
100 bp
decrease
100 bp
increase
100 bp
decrease
31 December 2008
Variable rate instruments (3,713) 3,713 – –
Cash fl ow sensitivity (net) (3,713) 3,713 – –
31 December 2007
Variable rate instruments (2,065) 2,065 – –
Cash fl ow sensitivity (net) (2,065) 2,065 – –
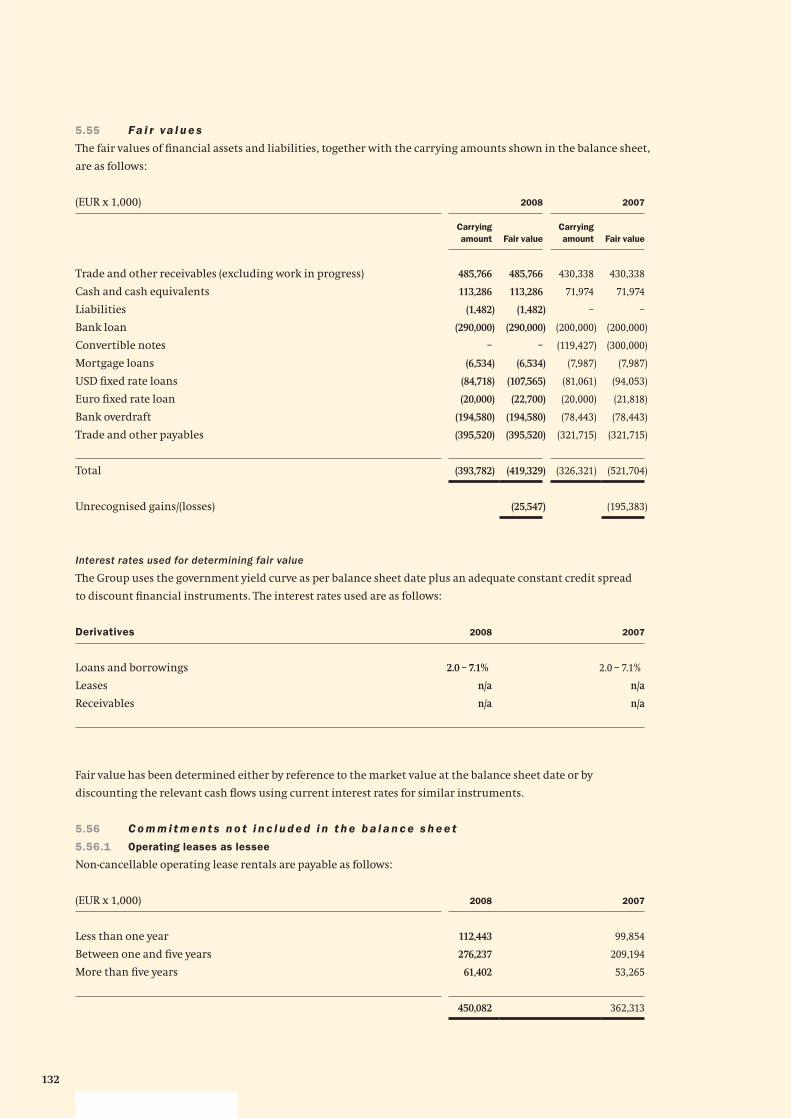
132
5.55 Fa i r va l u e s
The fair values of fi nancial assets and liabilities, together with the carrying amounts shown in the balance sheet,
are as follows:
(EUR x 1,000) 2008 2007
Carrying
amount Fair value
Carrying
amount Fair value
Trade and other receivables (excluding work in progress) 485,766 485,766 430,338 430,338
Cash and cash equivalents 113,286 113,286 71,974 71,974
Liabilities (1,482) (1,482) – –
Bank loan (290,000) (290,000) (200,000) (200,000)
Convertible notes – – (119,427) (300,000)
Mortgage loans (6,534) (6,534) (7,987) (7,987)
USD fi xed rate loans (84,718) (107,565) (81,061) (94,053)
Euro fi xed rate loan (20,000) (22,700) (20,000) (21,818)
Bank overdraft (194,580) (194,580) (78,443) (78,443)
Trade and other payables (395,520) (395,520) (321,715) (321,715)
Total (393,782) (419,329) (326,321) (521,704)
Unrecognised gains/(losses) (25,547) (195,383)
Interest rates used for determining fair value
The Group uses the government yield curve as per balance sheet date plus an adequate constant credit spread
to discount fi nancial instruments. The interest rates used are as follows:
Derivatives 2008 2007
Loans and borrowings 2.0 – 7.1% 2.0 – 7.1%
Leases n/a n/a
Receivables n/a n/a
Fair value has been determined either by reference to the market value at the balance sheet date or by
discounting the relevant cash fl ows using current interest rates for similar instruments.
5.56 C o m m i t m e n t s n o t i n c l u d e d i n t h e b a l a n c e s h e e t
5.56.1 Operating leases as lessee
Non-cancellable operating lease rentals are payable as follows:
(EUR x 1,000) 2008 2007
Less than one year 112,443 99,854
Between one and fi ve years 276,237 209,194
More than fi ve years 61,402 53,265
450,082 362,313
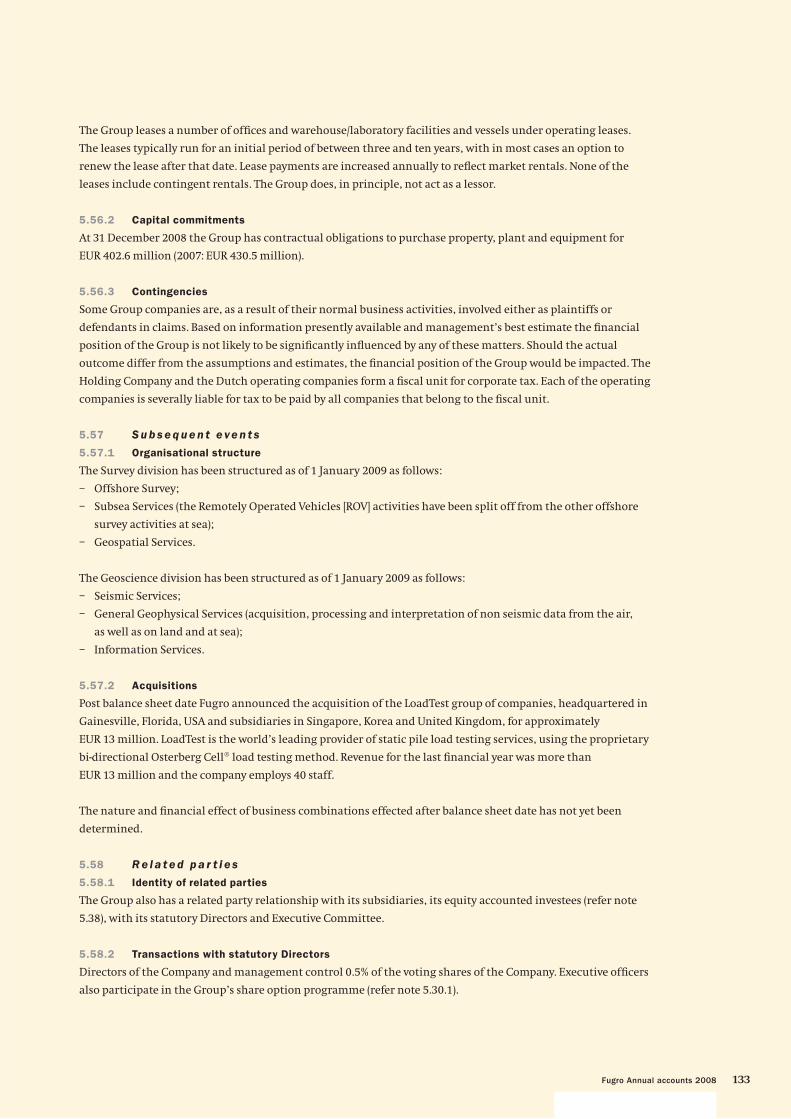
133Fugro Annual accounts 2008
The Group leases a number of offi ces and warehouse/laboratory facilities and vessels under operating leases.
The leases typically run for an initial period of between three and ten years, with in most cases an option to
renew the lease after that date. Lease payments are increased annually to refl ect market rentals. None of the
leases include contingent rentals. The Group does, in principle, not act as a lessor.
5.56.2 Capital commitments
At 31 December 2008 the Group has contractual obligations to purchase property, plant and equipment for
EUR 402.6 million (2007: EUR 430.5 million).
5.56.3 Contingencies
Some Group companies are, as a result of their normal business activities, involved either as plaintiffs or
defendants in claims. Based on information presently available and management’s best estimate the fi nancial
position of the Group is not likely to be signifi cantly infl uenced by any of these matters. Should the actual
outcome differ from the assumptions and estimates, the fi nancial position of the Group would be impacted. The
Holding Company and the Dutch operating companies form a fi scal unit for corporate tax. Each of the operating
companies is severally liable for tax to be paid by all companies that belong to the fi scal unit.
5.57 S u b s e q u e n t e ve n t s
5.57.1 Organisational structure
The Survey division has been structured as of 1 January 2009 as follows:
– Offshore Survey;
– Subsea Services (the Remotely Operated Vehicles [ROV] activities have been split off from the other offshore
survey activities at sea);
– Geospatial Services.
The Geoscience division has been structured as of 1 January 2009 as follows:
– Seismic Services;
– General Geophysical Services (acquisition, processing and interpretation of non seismic data from the air,
as well as on land and at sea);
– Information Services.
5.57.2 Acquisitions
Post balance sheet date Fugro announced the acquisition of the LoadTest group of companies, headquartered in
Gainesville, Florida, USA and subsidiaries in Singapore, Korea and United Kingdom, for approximately
EUR 13 million. LoadTest is the world’s leading provider of static pile load testing services, using the proprietary
bi-directional Osterberg Cell® load testing method. Revenue for the last fi nancial year was more than
EUR 13 million and the company employs 40 staff.
The nature and fi nancial effect of business combinations effected after balance sheet date has not yet been
determined.
5.58 R e l a t e d p a r t i e s
5.58.1 Identity of related parties
The Group also has a related party relationship with its subsidiaries, its equity accounted investees (refer note
5.38), with its statutory Directors and Executive Committee.
5.58.2 Transactions with statutory Directors
Directors of the Company and management control 0.5% of the voting shares of the Company. Executive offi cers
also participate in the Group’s share option programme (refer note 5.30.1).
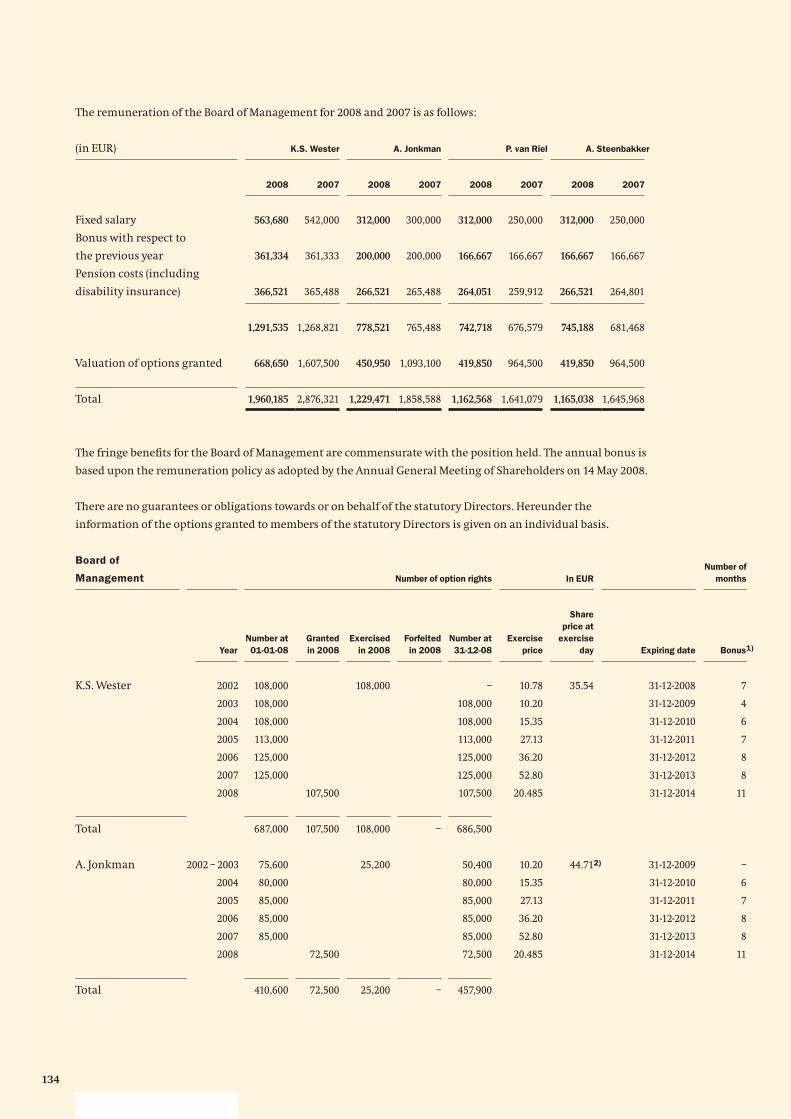
134
The remuneration of the Board of Management for 2008 and 2007 is as follows:
(in EUR) K.S. Wester A. Jonkman P. van Riel A. Steenbakker
2008 2007 2008 2007 2008 2007 2008 2007
Fixed salary 563,680 542,000 312,000 300,000 312,000 250,000 312,000 250,000
Bonus with respect to
the previous year 361,334 361,333 200,000 200,000 166,667 166,667 166,667 166,667
Pension costs (including
disability insurance) 366,521 365,488 266,521 265,488 264,051 259,912 266,521 264,801
1,291,535 1,268,821 778,521 765,488 742,718 676,579 745,188 681,468
Valuation of options granted 668,650 1,607,500 450,950 1,093,100 419,850 964,500 419,850 964,500
Total 1,960,185 2,876,321 1,229,471 1,858,588 1,162,568 1,641,079 1,165,038 1,645,968
The fringe benefi ts for the Board of Management are commensurate with the position held. The annual bonus is
based upon the remuneration policy as adopted by the Annual General Meeting of Shareholders on 14 May 2008.
There are no guarantees or obligations towards or on behalf of the statutory Directors. Hereunder the
information of the options granted to members of the statutory Directors is given on an individual basis.
Board of
Management Number of option rights In EUR
Number of
months
Year
Number at
01-01-08
Granted
in 2008
Exercised
in 2008
Forfeited
in 2008
Number at
31-12-08
Exercise
price
Share
price at
exercise
day Expiring date Bonus1)
K.S. Wester 2002 108,000 108,000 – 10.78 35.54 31-12-2008 7
2003 108,000 108,000 10.20 31-12-2009 4
2004 108,000 108,000 15.35 31-12-2010 6
2005 113,000 113,000 27.13 31-12-2011 7
2006 125,000 125,000 36.20 31-12-2012 8
2007 125,000 125,000 52.80 31-12-2013 8
2008 107,500 107,500 20.485 31-12-2014 11
Total 687,000 107,500 108,000 – 686,500
A. Jonkman 2002 – 2003 75,600 25,200 50,400 10.20 44.71 31-12-2009 –
2004 80,000 80,000 15.35 31-12-2010 6
2005 85,000 85,000 27.13 31-12-2011 7
2006 85,000 85,000 36.20 31-12-2012 8
2007 85,000 85,000 52.80 31-12-2013 8
2008 72,500 72,500 20.485 31-12-2014 11
Total 410,600 72,500 25,200 – 457,900
2)
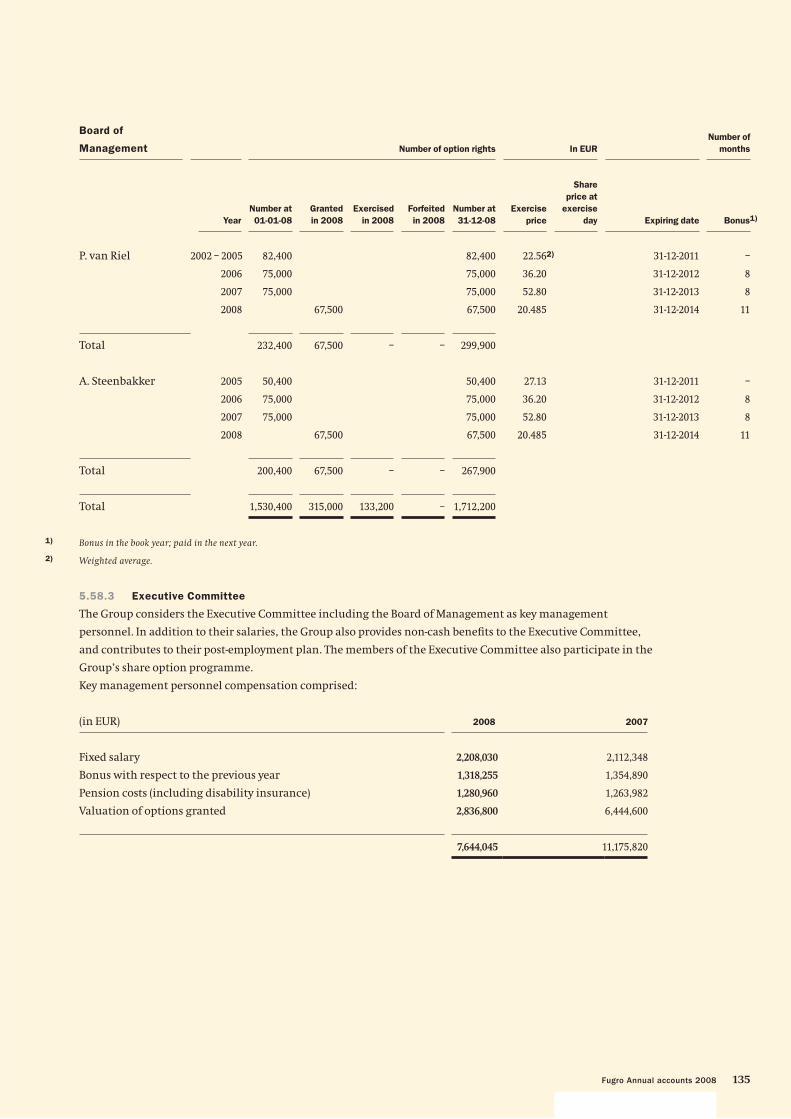
135Fugro Annual accounts 2008
Board of
Management Number of option rights In EUR
Number of
months
Year
Number at
01-01-08
Granted
in 2008
Exercised
in 2008
Forfeited
in 2008
Number at
31-12-08
Exercise
price
Share
price at
exercise
day Expiring date Bonus1)
P. van Riel 2002 – 2005 82,400 82,400 22.56 31-12-2011 –
2006 75,000 75,000 36.20 31-12-2012 8
2007 75,000 75,000 52.80 31-12-2013 8
2008 67,500 67,500 20.485 31-12-2014 11
Total 232,400 67,500 – – 299,900
A. Steenbakker 2005 50,400 50,400 27.13 31-12-2011 –
2006 75,000 75,000 36.20 31-12-2012 8
2007 75,000 75,000 52.80 31-12-2013 8
2008 67,500 67,500 20.485 31-12-2014 11
Total 200,400 67,500 – – 267,900
Total 1,530,400 315,000 133,200 – 1,712,200
1) Bonus in the book year; paid in the next year.
2) Weighted average.
5.58.3 Executive Committee
The Group considers the Executive Committee including the Board of Management as key management
personnel. In addition to their salaries, the Group also provides non-cash benefi ts to the Executive Committee,
and contributes to their post-employment plan. The members of the Executive Committee also participate in the
Group’s share option programme.
Key management personnel compensation comprised:
(in EUR) 2008 2007
Fixed salary 2,208,030 2,112,348
Bonus with respect to the previous year 1,318,255 1,354,890
Pension costs (including disability insurance) 1,280,960 1,263,982
Valuation of options granted 2,836,800 6,444,600
7,644,045 11,175,820
2)
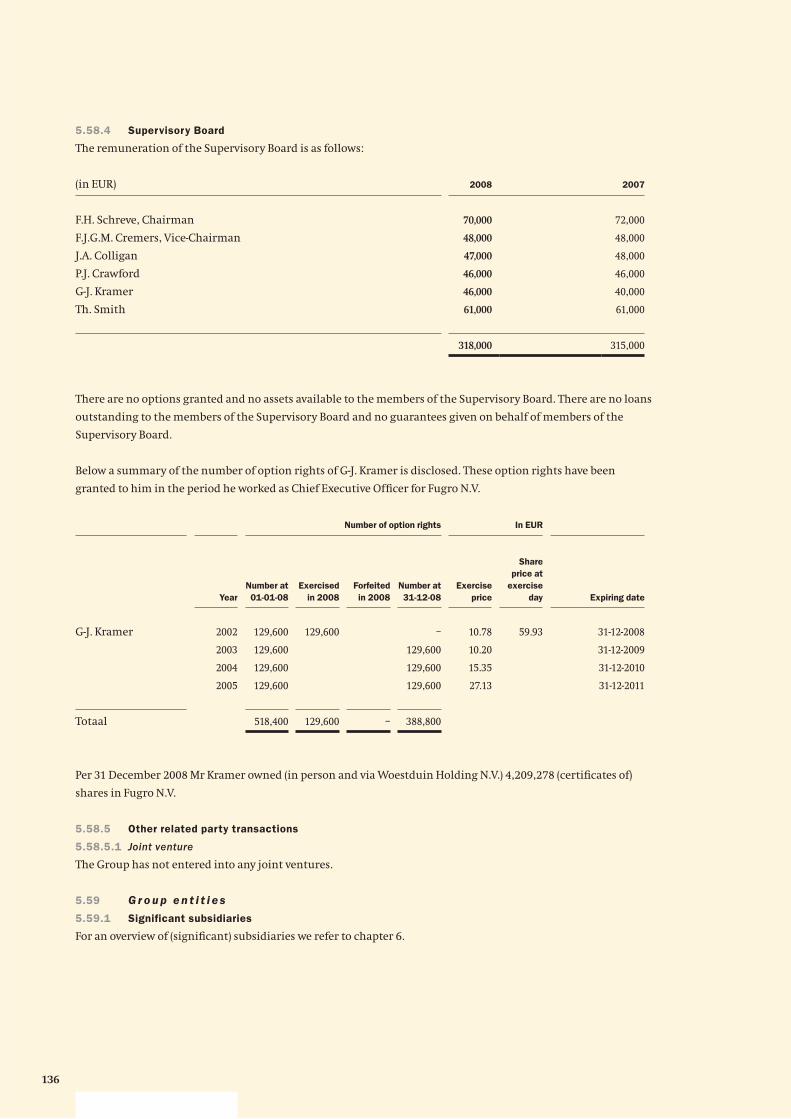
136
5.58.4 Supervisory Board
The remuneration of the Supervisory Board is as follows:
(in EUR) 2008 2007
F.H. Schreve, Chairman 70,000 72,000
F.J.G.M. Cremers, Vice-Chairman 48,000 48,000
J.A. Colligan 47,000 48,000
P.J. Crawford 46,000 46,000
G-J. Kramer 46,000 40,000
Th. Smith 61,000 61,000
318,000 315,000
There are no options granted and no assets available to the members of the Supervisory Board. There are no loans
outstanding to the members of the Supervisory Board and no guarantees given on behalf of members of the
Supervisory Board.
Below a summary of the number of option rights of G-J. Kramer is disclosed. These option rights have been
granted to him in the period he worked as Chief Executive Offi cer for Fugro N.V.
Number of option rights In EUR
Year
Number at
01-01-08
Exercised
in 2008
Forfeited
in 2008
Number at
31-12-08
Exercise
price
Share
price at
exercise
day Expiring date
G-J. Kramer 2002 129,600 129,600 – 10.78 59.93 31-12-2008
2003 129,600 129,600 10.20 31-12-2009
2004 129,600 129,600 15.35 31-12-2010
2005 129,600 129,600 27.13 31-12-2011
Totaal 518,400 129,600 – 388,800
Per 31 December 2008 Mr Kramer owned (in person and via Woestduin Holding N.V.) 4,209,278 (certifi cates of)
shares in Fugro N.V.
5.58.5 Other related party transactions
5.58.5.1 Joint venture
The Group has not entered into any joint ventures.
5.59 G r o u p e n t i t i e s
5.59.1 Significant subsidiaries
For an overview of (signifi cant) subsidiaries we refer to chapter 6.
137Fugro Annual accounts 2008
5.60 E s t i m a t e s a n d m a n a ge m e n t j u d ge m e n t s
Management discussed with the Audit Committee the development in and choice of critical accounting
principles and estimates and the application of such principles and estimates.
Key sources of estimation uncertainty
Note 5.37 contains information about the assumptions and their risk factors relating to goodwill impairment.
In note 5.50 a detailed analysis is given on the foreign currency exposure of the Group and risks in relation to
foreign exchange movements. Furthermore note 5.50 includes information on the credit risk of the Group as
well as the effects of the credit risk on the allowance for impairment in respect of trade receivables and unbilled
revenue on completed contracts.
Critical accounting judgements in applying the Group’s accounting policies
Except as already described in the notes to the fi nancial statements no other critical accounting judgements in
applying the Group’s accounting policies exist that require further explanation.
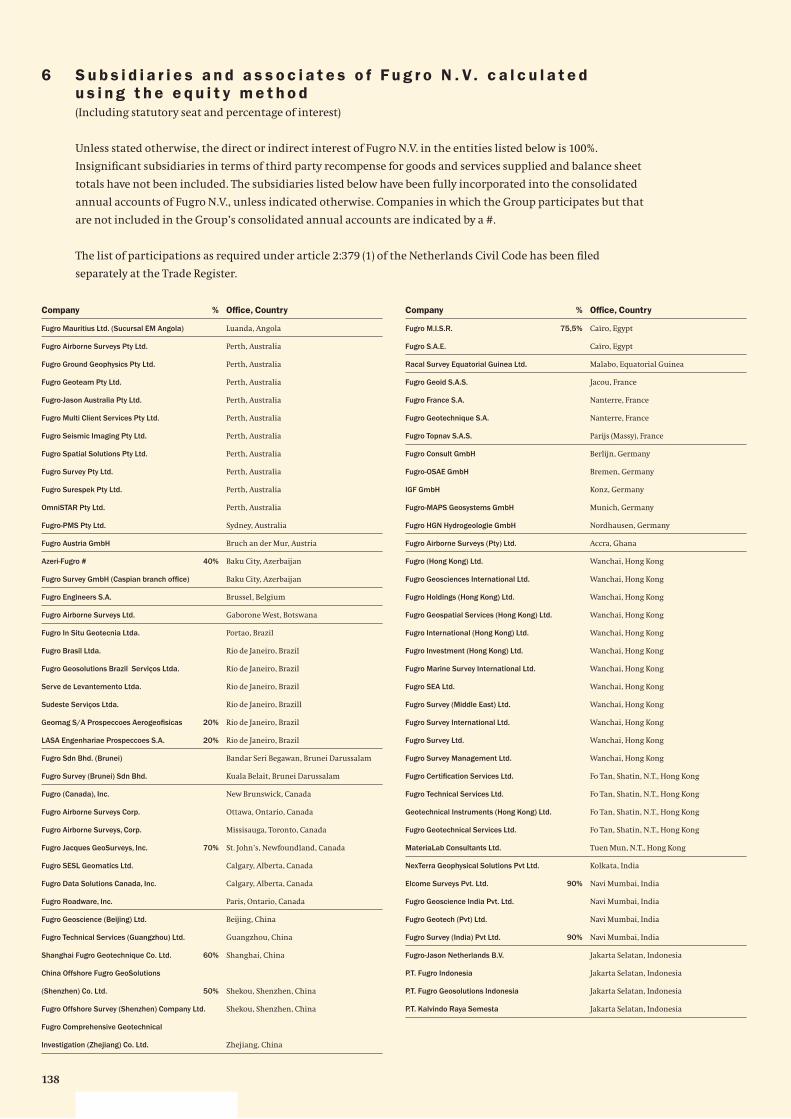
138
6 S u b s i d i a r i e s a n d a s s o c i a t e s o f F u g r o N . V. c a l c u l a t e d u s i n g t h e e q u i t y m e t h o d(Including statutory seat and percentage of interest)
Unless stated otherwise, the direct or indirect interest of Fugro N.V. in the entities listed below is 100%.
Insignifi cant subsidiaries in terms of third party recompense for goods and services supplied and balance sheet
totals have not been included. The subsidiaries listed below have been fully incorporated into the consolidated
annual accounts of Fugro N.V., unless indicated otherwise. Companies in which the Group participates but that
are not included in the Group’s consolidated annual accounts are indicated by a #.
The list of participations as required under article 2:379 (1) of the Netherlands Civil Code has been fi led
separately at the Trade Register.
Fugro Mauritius Ltd. (Sucursal EM Angola) Luanda, Angola
Fugro Airborne Surveys Pty Ltd. Perth, Australia
Fugro Ground Geophysics Pty Ltd. Perth, Australia
Fugro Geoteam Pty Ltd. Perth, Australia
Fugro-Jason Australia Pty Ltd. Perth, Australia
Fugro Multi Client Services Pty Ltd. Perth, Australia
Fugro Seismic Imaging Pty Ltd. Perth, Australia
Fugro Spatial Solutions Pty Ltd. Perth, Australia
Fugro Survey Pty Ltd. Perth, Australia
Fugro Surespek Pty Ltd. Perth, Australia
OmniSTAR Pty Ltd. Perth, Australia
Fugro-PMS Pty Ltd. Sydney, Australia
Fugro Austria GmbH Bruch an der Mur, Austria
Azeri-Fugro # 40% Baku City, Azerbaijan
Fugro Survey GmbH (Caspian branch offi ce) Baku City, Azerbaijan
Fugro Engineers S.A. Brussel, Belgium
Fugro Airborne Surveys Ltd. Gaborone West, Botswana
Fugro In Situ Geotecnia Ltda. Portao, Brazil
Fugro Brasil Ltda. Rio de Janeiro, Brazil
Fugro Geosolutions Brazil Serviços Ltda. Rio de Janeiro, Brazil
Serve de Levantemento Ltda. Rio de Janeiro, Brazil
Sudeste Serviços Ltda. Rio de Janeiro, Brazill
Geomag S/A Prospeccoes Aerogeofi sicas 20% Rio de Janeiro, Brazil
LASA Engenhariae Prospeccoes S.A. 20% Rio de Janeiro, Brazil
Fugro Sdn Bhd. (Brunei) Bandar Seri Begawan, Brunei Darussalam
Fugro Survey (Brunei) Sdn Bhd. Kuala Belait, Brunei Darussalam
Fugro (Canada), Inc. New Brunswick, Canada
Fugro Airborne Surveys Corp. Ottawa, Ontario, Canada
Fugro Airborne Surveys, Corp. Missisauga, Toronto, Canada
Fugro Jacques GeoSurveys, Inc. 70% St. John’s, Newfoundland, Canada
Fugro SESL Geomatics Ltd. Calgary, Alberta, Canada
Fugro Data Solutions Canada, Inc. Calgary, Alberta, Canada
Fugro Roadware, Inc. Paris, Ontario, Canada
Fugro Geoscience (Beijing) Ltd. Beijing, China
Fugro Technical Services (Guangzhou) Ltd. Guangzhou, China
Shanghai Fugro Geotechnique Co. Ltd. 60% Shanghai, China
China Offshore Fugro GeoSolutions
(Shenzhen) Co. Ltd. 50% Shekou, Shenzhen, China
Fugro Offshore Survey (Shenzhen) Company Ltd. Shekou, Shenzhen, China
Fugro Comprehensive Geotechnical
Investigation (Zhejiang) Co. Ltd. Zhejiang, China
Fugro M.I.S.R. 75,5% Caïro, Egypt
Fugro S.A.E. Caïro, Egypt
Racal Survey Equatorial Guinea Ltd. Malabo, Equatorial Guinea
Fugro Geoid S.A.S. Jacou, France
Fugro France S.A. Nanterre, France
Fugro Geotechnique S.A. Nanterre, France
Fugro Topnav S.A.S. Parijs (Massy), France
Fugro Consult GmbH Berlijn, Germany
Fugro-OSAE GmbH Bremen, Germany
IGF GmbH Konz, Germany
Fugro-MAPS Geosystems GmbH Munich, Germany
Fugro HGN Hydrogeologie GmbH Nordhausen, Germany
Fugro Airborne Surveys (Pty) Ltd. Accra, Ghana
Fugro (Hong Kong) Ltd. Wanchai, Hong Kong
Fugro Geosciences International Ltd. Wanchai, Hong Kong
Fugro Holdings (Hong Kong) Ltd. Wanchai, Hong Kong
Fugro Geospatial Services (Hong Kong) Ltd. Wanchai, Hong Kong
Fugro International (Hong Kong) Ltd. Wanchai, Hong Kong
Fugro Investment (Hong Kong) Ltd. Wanchai, Hong Kong
Fugro Marine Survey International Ltd. Wanchai, Hong Kong
Fugro SEA Ltd. Wanchai, Hong Kong
Fugro Survey (Middle East) Ltd. Wanchai, Hong Kong
Fugro Survey International Ltd. Wanchai, Hong Kong
Fugro Survey Ltd. Wanchai, Hong Kong
Fugro Survey Management Ltd. Wanchai, Hong Kong
Fugro Certifi cation Services Ltd. Fo Tan, Shatin, N.T., Hong Kong
Fugro Technical Services Ltd. Fo Tan, Shatin, N.T., Hong Kong
Geotechnical Instruments (Hong Kong) Ltd. Fo Tan, Shatin, N.T., Hong Kong
Fugro Geotechnical Services Ltd. Fo Tan, Shatin, N.T., Hong Kong
MateriaLab Consultants Ltd. Tuen Mun, N.T., Hong Kong
NexTerra Geophysical Solutions Pvt Ltd. Kolkata, India
Elcome Surveys Pvt. Ltd. 90% Navi Mumbai, India
Fugro Geoscience India Pvt. Ltd. Navi Mumbai, India
Fugro Geotech (Pvt) Ltd. Navi Mumbai, India
Fugro Survey (India) Pvt Ltd. 90% Navi Mumbai, India
Fugro-Jason Netherlands B.V. Jakarta Selatan, Indonesia
P.T. Fugro Indonesia Jakarta Selatan, Indonesia
P.T. Fugro Geosolutions Indonesia Jakarta Selatan, Indonesia
P.T. Kalvindo Raya Semesta Jakarta Selatan, Indonesia
Company % Offi ce, Country Company % Offi ce, Country
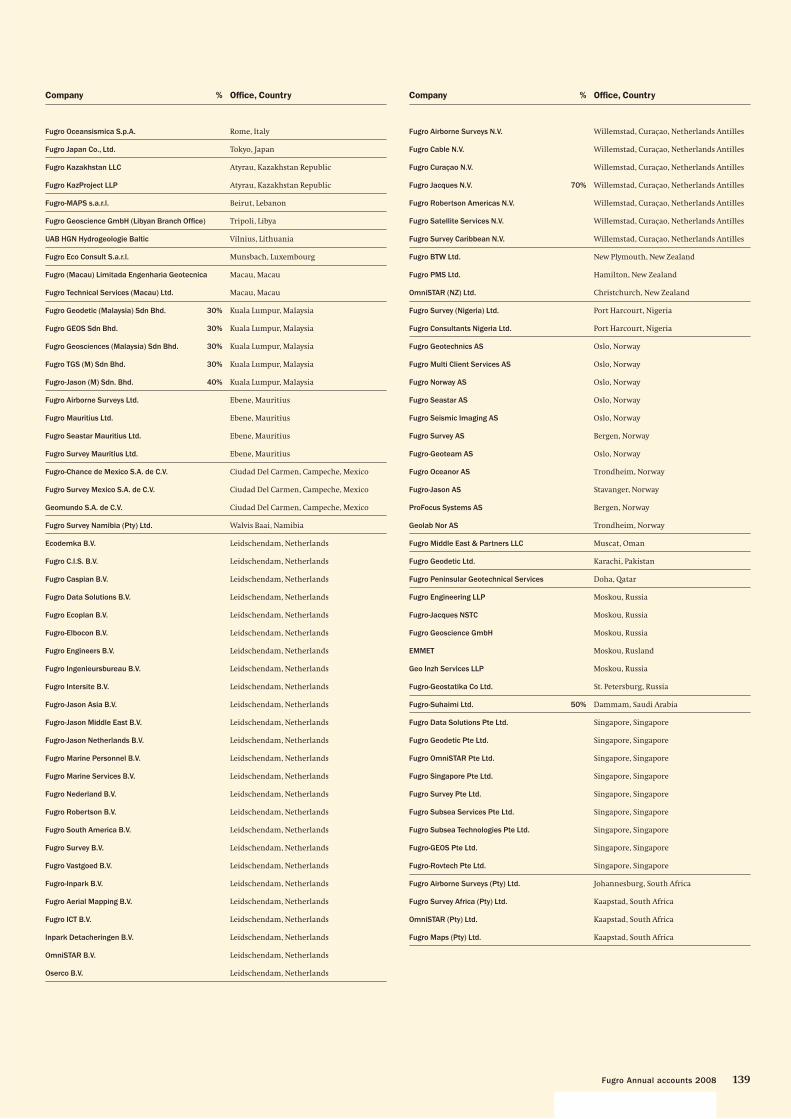
139Fugro Annual accounts 2008
Fugro Oceansismica S.p.A. Rome, Italy
Fugro Japan Co., Ltd. Tokyo, Japan
Fugro Kazakhstan LLC Atyrau, Kazakhstan Republic
Fugro KazProject LLP Atyrau, Kazakhstan Republic
Fugro-MAPS s.a.r.l. Beirut, Lebanon
Fugro Geoscience GmbH (Libyan Branch Offi ce) Tripoli, Libya
UAB HGN Hydrogeologie Baltic Vilnius, Lithuania
Fugro Eco Consult S.a.r.l. Munsbach, Luxembourg
Fugro (Macau) Limitada Engenharia Geotecnica Macau, Macau
Fugro Technical Services (Macau) Ltd. Macau, Macau
Fugro Geodetic (Malaysia) Sdn Bhd. 30% Kuala Lumpur, Malaysia
Fugro GEOS Sdn Bhd. 30% Kuala Lumpur, Malaysia
Fugro Geosciences (Malaysia) Sdn Bhd. 30% Kuala Lumpur, Malaysia
Fugro TGS (M) Sdn Bhd. 30% Kuala Lumpur, Malaysia
Fugro-Jason (M) Sdn. Bhd. 40% Kuala Lumpur, Malaysia
Fugro Airborne Surveys Ltd. Ebene, Mauritius
Fugro Mauritius Ltd. Ebene, Mauritius
Fugro Seastar Mauritius Ltd. Ebene, Mauritius
Fugro Survey Mauritius Ltd. Ebene, Mauritius
Fugro-Chance de Mexico S.A. de C.V. Ciudad Del Carmen, Campeche, Mexico
Fugro Survey Mexico S.A. de C.V. Ciudad Del Carmen, Campeche, Mexico
Geomundo S.A. de C.V. Ciudad Del Carmen, Campeche, Mexico
Fugro Survey Namibia (Pty) Ltd. Walvis Baai, Namibia
Ecodemka B.V. Leidschendam, Netherlands
Fugro C.I.S. B.V. Leidschendam, Netherlands
Fugro Caspian B.V. Leidschendam, Netherlands
Fugro Data Solutions B.V. Leidschendam, Netherlands
Fugro Ecoplan B.V. Leidschendam, Netherlands
Fugro-Elbocon B.V. Leidschendam, Netherlands
Fugro Engineers B.V. Leidschendam, Netherlands
Fugro Ingenieursbureau B.V. Leidschendam, Netherlands
Fugro Intersite B.V. Leidschendam, Netherlands
Fugro-Jason Asia B.V. Leidschendam, Netherlands
Fugro-Jason Middle East B.V. Leidschendam, Netherlands
Fugro-Jason Netherlands B.V. Leidschendam, Netherlands
Fugro Marine Personnel B.V. Leidschendam, Netherlands
Fugro Marine Services B.V. Leidschendam, Netherlands
Fugro Nederland B.V. Leidschendam, Netherlands
Fugro Robertson B.V. Leidschendam, Netherlands
Fugro South America B.V. Leidschendam, Netherlands
Fugro Survey B.V. Leidschendam, Netherlands
Fugro Vastgoed B.V. Leidschendam, Netherlands
Fugro-Inpark B.V. Leidschendam, Netherlands
Fugro Aerial Mapping B.V. Leidschendam, Netherlands
Fugro ICT B.V. Leidschendam, Netherlands
Inpark Detacheringen B.V. Leidschendam, Netherlands
OmniSTAR B.V. Leidschendam, Netherlands
Oserco B.V. Leidschendam, Netherlands
Fugro Airborne Surveys N.V. Willemstad, Curaçao, Netherlands Antilles
Fugro Cable N.V. Willemstad, Curaçao, Netherlands Antilles
Fugro Curaçao N.V. Willemstad, Curaçao, Netherlands Antilles
Fugro Jacques N.V. 70% Willemstad, Curaçao, Netherlands Antilles
Fugro Robertson Americas N.V. Willemstad, Curaçao, Netherlands Antilles
Fugro Satellite Services N.V. Willemstad, Curaçao, Netherlands Antilles
Fugro Survey Caribbean N.V. Willemstad, Curaçao, Netherlands Antilles
Fugro BTW Ltd. New Plymouth, New Zealand
Fugro PMS Ltd. Hamilton, New Zealand
OmniSTAR (NZ) Ltd. Christchurch, New Zealand
Fugro Survey (Nigeria) Ltd. Port Harcourt, Nigeria
Fugro Consultants Nigeria Ltd. Port Harcourt, Nigeria
Fugro Geotechnics AS Oslo, Norway
Fugro Multi Client Services AS Oslo, Norway
Fugro Norway AS Oslo, Norway
Fugro Seastar AS Oslo, Norway
Fugro Seismic Imaging AS Oslo, Norway
Fugro Survey AS Bergen, Norway
Fugro-Geoteam AS Oslo, Norway
Fugro Oceanor AS Trondheim, Norway
Fugro-Jason AS Stavanger, Norway
ProFocus Systems AS Bergen, Norway
Geolab Nor AS Trondheim, Norway
Fugro Middle East & Partners LLC Muscat, Oman
Fugro Geodetic Ltd. Karachi, Pakistan
Fugro Peninsular Geotechnical Services Doha, Qatar
Fugro Engineering LLP Moskou, Russia
Fugro-Jacques NSTC Moskou, Russia
Fugro Geoscience GmbH Moskou, Russia
EMMET Moskou, Rusland
Geo Inzh Services LLP Moskou, Russia
Fugro-Geostatika Co Ltd. St. Petersburg, Russia
Fugro-Suhaimi Ltd. 50% Dammam, Saudi Arabia
Fugro Data Solutions Pte Ltd. Singapore, Singapore
Fugro Geodetic Pte Ltd. Singapore, Singapore
Fugro OmniSTAR Pte Ltd. Singapore, Singapore
Fugro Singapore Pte Ltd. Singapore, Singapore
Fugro Survey Pte Ltd. Singapore, Singapore
Fugro Subsea Services Pte Ltd. Singapore, Singapore
Fugro Subsea Technologies Pte Ltd. Singapore, Singapore
Fugro-GEOS Pte Ltd. Singapore, Singapore
Fugro-Rovtech Pte Ltd. Singapore, Singapore
Fugro Airborne Surveys (Pty) Ltd. Johannesburg, South Africa
Fugro Survey Africa (Pty) Ltd. Kaapstad, South Africa
OmniSTAR (Pty) Ltd. Kaapstad, South Africa
Fugro Maps (Pty) Ltd. Kaapstad, South Africa
Company % Offi ce, Country Company % Offi ce, Country
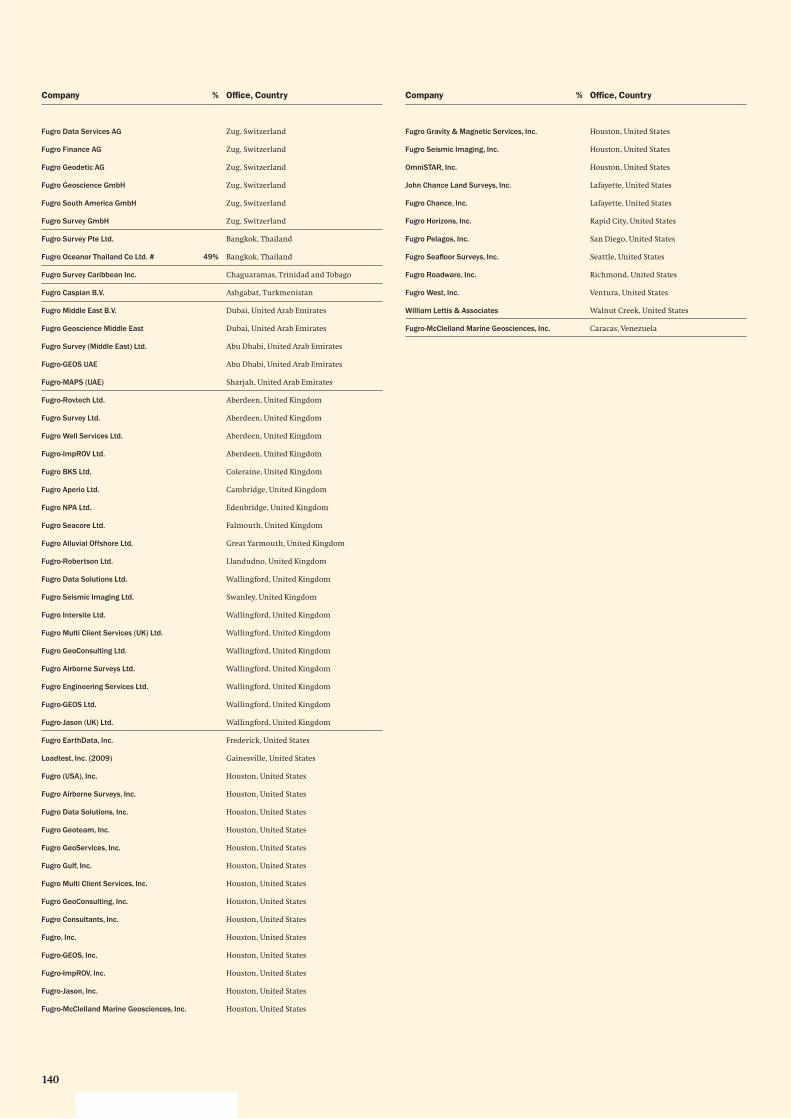
140
Fugro Data Services AG Zug, Switzerland
Fugro Finance AG Zug, Switzerland
Fugro Geodetic AG Zug, Switzerland
Fugro Geoscience GmbH Zug, Switzerland
Fugro South America GmbH Zug, Switzerland
Fugro Survey GmbH Zug, Switzerland
Fugro Survey Pte Ltd. Bangkok, Thailand
Fugro Oceanor Thailand Co Ltd. # 49% Bangkok, Thailand
Fugro Survey Caribbean Inc. Chaguaramas, Trinidad and Tobago
Fugro Caspian B.V. Ashgabat, Turkmenistan
Fugro Middle East B.V. Dubai, United Arab Emirates
Fugro Geoscience Middle East Dubai, United Arab Emirates
Fugro Survey (Middle East) Ltd. Abu Dhabi, United Arab Emirates
Fugro-GEOS UAE Abu Dhabi, United Arab Emirates
Fugro-MAPS (UAE) Sharjah, United Arab Emirates
Fugro-Rovtech Ltd. Aberdeen, United Kingdom
Fugro Survey Ltd. Aberdeen, United Kingdom
Fugro Well Services Ltd. Aberdeen, United Kingdom
Fugro-ImpROV Ltd. Aberdeen, United Kingdom
Fugro BKS Ltd. Coleraine, United Kingdom
Fugro Aperio Ltd. Cambridge, United Kingdom
Fugro NPA Ltd. Edenbridge, United Kingdom
Fugro Seacore Ltd. Falmouth, United Kingdom
Fugro Alluvial Offshore Ltd. Great Yarmouth, United Kingdom
Fugro-Robertson Ltd. Llandudno, United Kingdom
Fugro Data Solutions Ltd. Wallingford, United Kingdom
Fugro Seismic Imaging Ltd. Swanley, United Kingdom
Fugro Intersite Ltd. Wallingford, United Kingdom
Fugro Multi Client Services (UK) Ltd. Wallingford, United Kingdom
Fugro GeoConsulting Ltd. Wallingford, United Kingdom
Fugro Airborne Surveys Ltd. Wallingford, United Kingdom
Fugro Engineering Services Ltd. Wallingford, United Kingdom
Fugro-GEOS Ltd. Wallingford, United Kingdom
Fugro-Jason (UK) Ltd. Wallingford, United Kingdom
Fugro EarthData, Inc. Frederick, United States
Loadtest, Inc. (2009) Gainesville, United States
Fugro (USA), Inc. Houston, United States
Fugro Airborne Surveys, Inc. Houston, United States
Fugro Data Solutions, Inc. Houston, United States
Fugro Geoteam, Inc. Houston, United States
Fugro GeoServices, Inc. Houston, United States
Fugro Gulf, Inc. Houston, United States
Fugro Multi Client Services, Inc. Houston, United States
Fugro GeoConsulting, Inc. Houston, United States
Fugro Consultants, Inc. Houston, United States
Fugro, Inc. Houston, United States
Fugro-GEOS, Inc. Houston, United States
Fugro-ImpROV, Inc. Houston, United States
Fugro-Jason, Inc. Houston, United States
Fugro-McClelland Marine Geosciences, Inc. Houston, United States
Company % Offi ce, Country Company % Offi ce, Country
Fugro Gravity & Magnetic Services, Inc. Houston, United States
Fugro Seismic Imaging, Inc. Houston, United States
OmniSTAR, Inc. Houston, United States
John Chance Land Surveys, Inc. Lafayette, United States
Fugro Chance, Inc. Lafayette, United States
Fugro Horizons, Inc. Rapid City, United States
Fugro Pelagos, Inc. San Diego, United States
Fugro Seafl oor Surveys, Inc. Seattle, United States
Fugro Roadware, Inc. Richmond, United States
Fugro West, Inc. Ventura, United States
William Lettis & Associates Walnut Creek, United States
Fugro-McClelland Marine Geosciences, Inc. Caracas, Venezuela
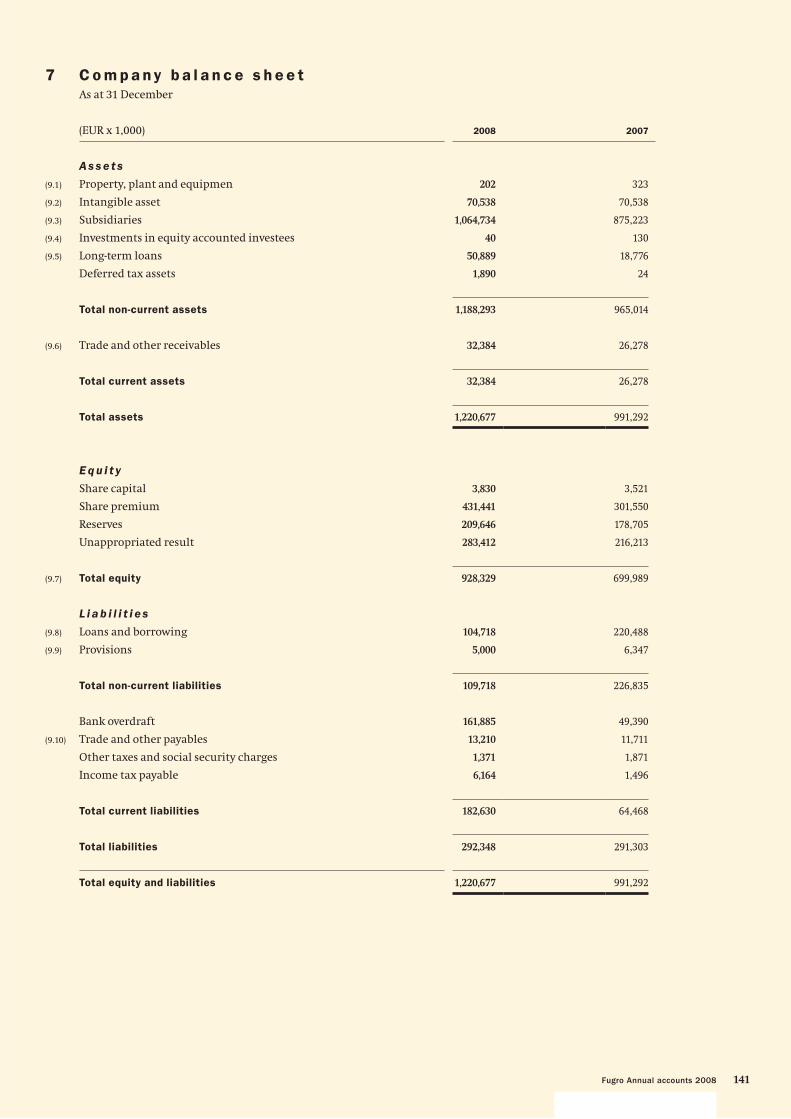
141Fugro Annual accounts 2008
7 C o m p a ny b a l a n c e s h e e tAs at 31 December
(EUR x 1,000) 2008 2007
A s s e t s
(9.1) Property, plant and equipmen 202 323
(9.2) Intangible asset 70,538 70,538
(9.3) Subsidiaries 1,064,734 875,223
(9.4) Investments in equity accounted investees 40 130
(9.5) Long-term loans 50,889 18,776
Deferred tax assets 1,890 24
Total non-current assets 1,188,293 965,014
(9.6) Trade and other receivables 32,384 26,278
Total current assets 32,384 26,278
Total assets 1,220,677 991,292
E q u i t y
Share capital 3,830 3,521
Share premium 431,441 301,550
Reserves 209,646 178,705
Unappropriated result 283,412 216,213
(9.7) Total equity 928,329 699,989
L i a b i l i t i e s
(9.8) Loans and borrowing 104,718 220,488
(9.9) Provisions 5,000 6,347
Total non-current liabilities 109,718 226,835
Bank overdraft 161,885 49,390
(9.10) Trade and other payables 13,210 11,711
Other taxes and social security charges 1,371 1,871
Income tax payable 6,164 1,496
Total current liabilities 182,630 64,468
Total liabilities 292,348 291,303
Total equity and liabilities 1,220,677 991,292
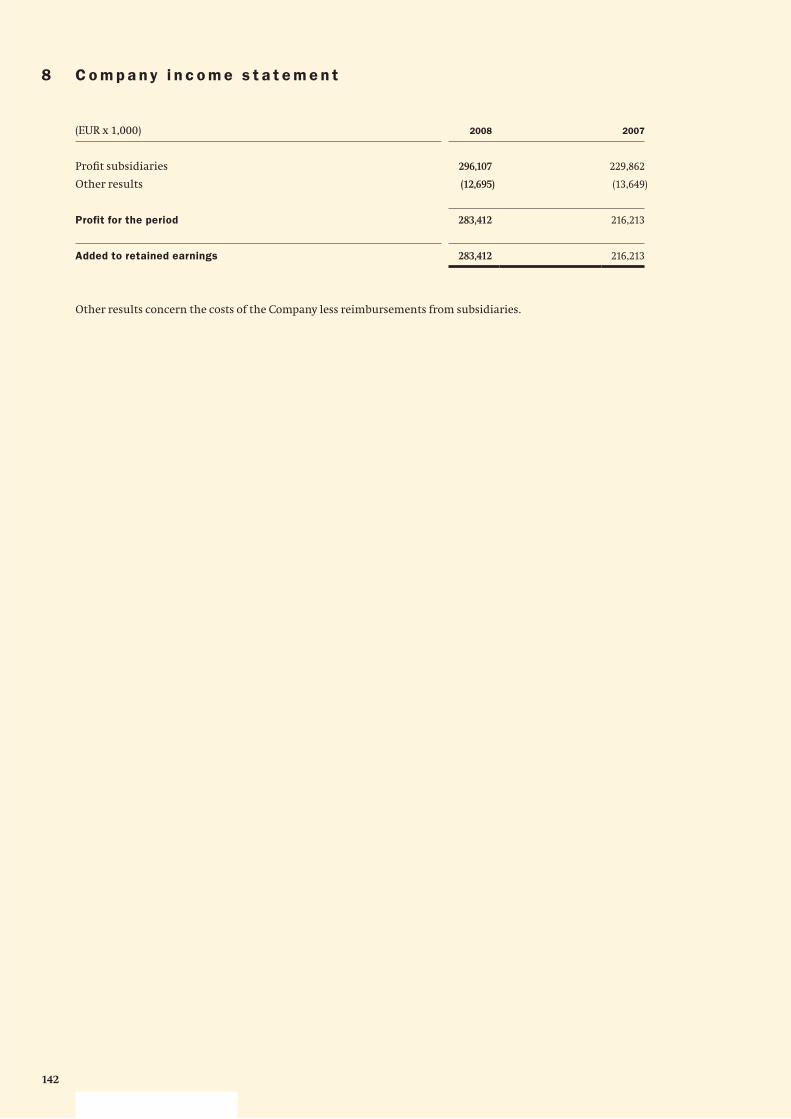
142
(EUR x 1,000) 2008 2007
Profi t subsidiaries 296,107 229,862
Other results (12,695) (13,649)
Profit for the period 283,412 216,213
Added to retained earnings 283,412 216,213
Other results concern the costs of the Company less reimbursements from subsidiaries.
8 C o m p a ny i n c o m e s t a t e m e n t
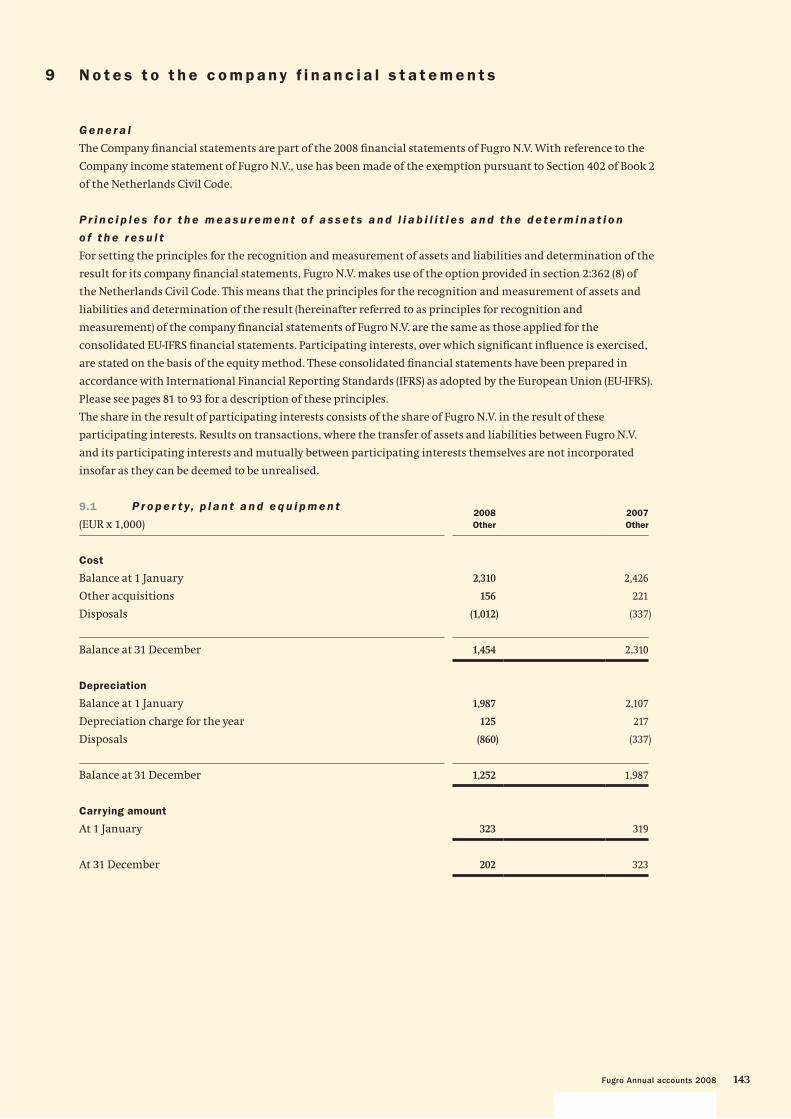
143Fugro Annual accounts 2008
9 N o t e s t o t h e c o m p a ny f i n a n c i a l s t a t e m e n t s
G e n e r a l
The Company fi nancial statements are part of the 2008 fi nancial statements of Fugro N.V. With reference to the
Company income statement of Fugro N.V., use has been made of the exemption pursuant to Section 402 of Book 2
of the Netherlands Civil Code.
P r i n c i p l e s fo r t h e m e a s u r e m e n t o f a s s e t s a n d l i a b i l i t i e s a n d t h e d e t e r m i n a t i o n
o f t h e r e s u l t
For setting the principles for the recognition and measurement of assets and liabilities and determination of the
result for its company fi nancial statements, Fugro N.V. makes use of the option provided in section 2:362 (8) of
the Netherlands Civil Code. This means that the principles for the recognition and measurement of assets and
liabilities and determination of the result (hereinafter referred to as principles for recognition and
measurement) of the company fi nancial statements of Fugro N.V. are the same as those applied for the
consolidated EU-IFRS fi nancial statements. Participating interests, over which signifi cant infl uence is exercised,
are stated on the basis of the equity method. These consolidated fi nancial statements have been prepared in
accordance with International Financial Reporting Standards (IFRS) as adopted by the European Union (EU-IFRS).
Please see pages 81 to 93 for a description of these principles.
The share in the result of participating interests consists of the share of Fugro N.V. in the result of these
participating interests. Results on transactions, where the transfer of assets and liabilities between Fugro N.V.
and its participating interests and mutually between participating interests themselves are not incorporated
insofar as they can be deemed to be unrealised.
9.1 P r o p e r t y , p l a n t a n d e q u i p m e n t
(EUR x 1,000)2008
Other
2007
Other
Cost
Balance at 1 January 2,310 2,426
Other acquisitions 156 221
Disposals (1,012) (337)
Balance at 31 December 1,454 2,310
Depreciation
Balance at 1 January 1,987 2,107
Depreciation charge for the year 125 217
Disposals (860) (337)
Balance at 31 December 1,252 1,987
Carrying amount
At 1 January 323 319
At 31 December 202 323
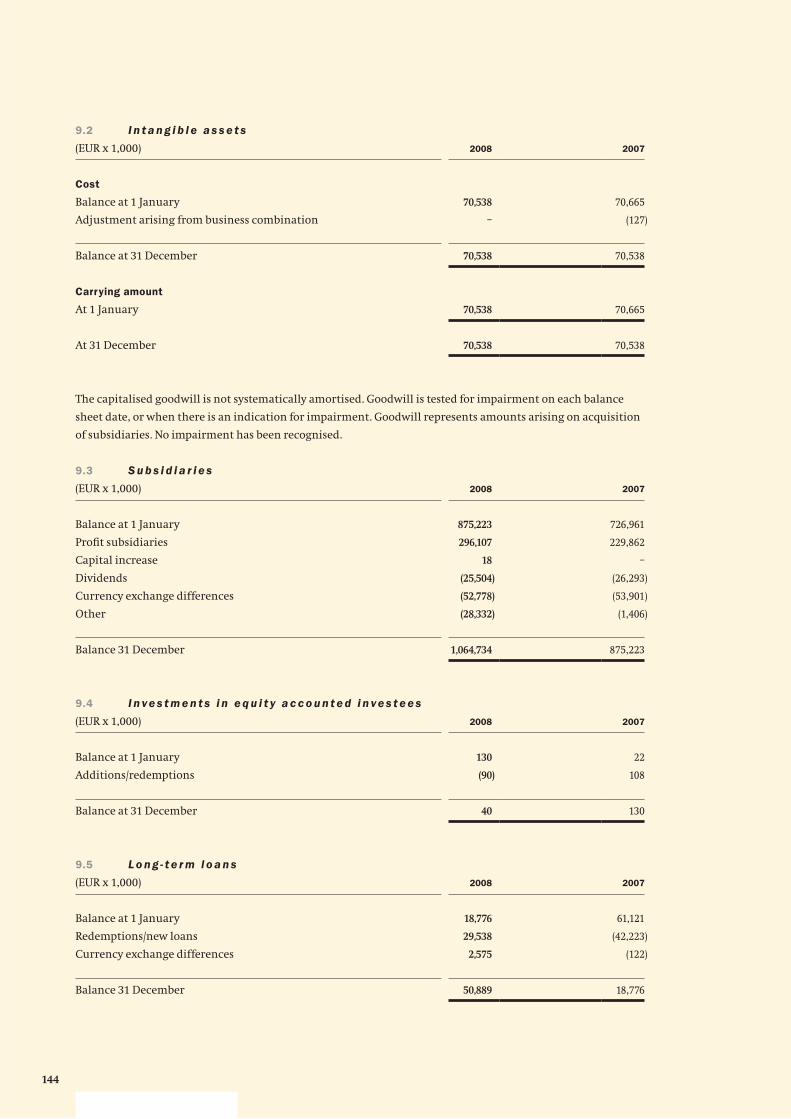
144
9.2 I n t a n g i b l e a s s e t s
(EUR x 1,000) 2008 2007
Cost
Balance at 1 January 70,538 70,665
Adjustment arising from business combination – (127)
Balance at 31 December 70,538 70,538
Carrying amount
At 1 January 70,538 70,665
At 31 December 70,538 70,538
The capitalised goodwill is not systematically amortised. Goodwill is tested for impairment on each balance
sheet date, or when there is an indication for impairment. Goodwill represents amounts arising on acquisition
of subsidiaries. No impairment has been recognised.
9.3 S u b s i d i a r i e s
(EUR x 1,000) 2008 2007
Balance at 1 January 875,223 726,961
Profi t subsidiaries 296,107 229,862
Capital increase 18 –
Dividends (25,504) (26,293)
Currency exchange differences (52,778) (53,901)
Other (28,332) (1,406)
Balance 31 December 1,064,734 875,223
9.4 I n ve s t m e n t s i n e q u i t y a c c o u n t e d i n ve s t e e s
(EUR x 1,000) 2008 2007
Balance at 1 January 130 22
Additions/redemptions (90) 108
Balance at 31 December 40 130
9.5 L o n g - t e r m l o a n s
(EUR x 1,000) 2008 2007
Balance at 1 January 18,776 61,121
Redemptions/new loans 29,538 (42,223)
Currency exchange differences 2,575 (122)
Balance 31 December 50,889 18,776
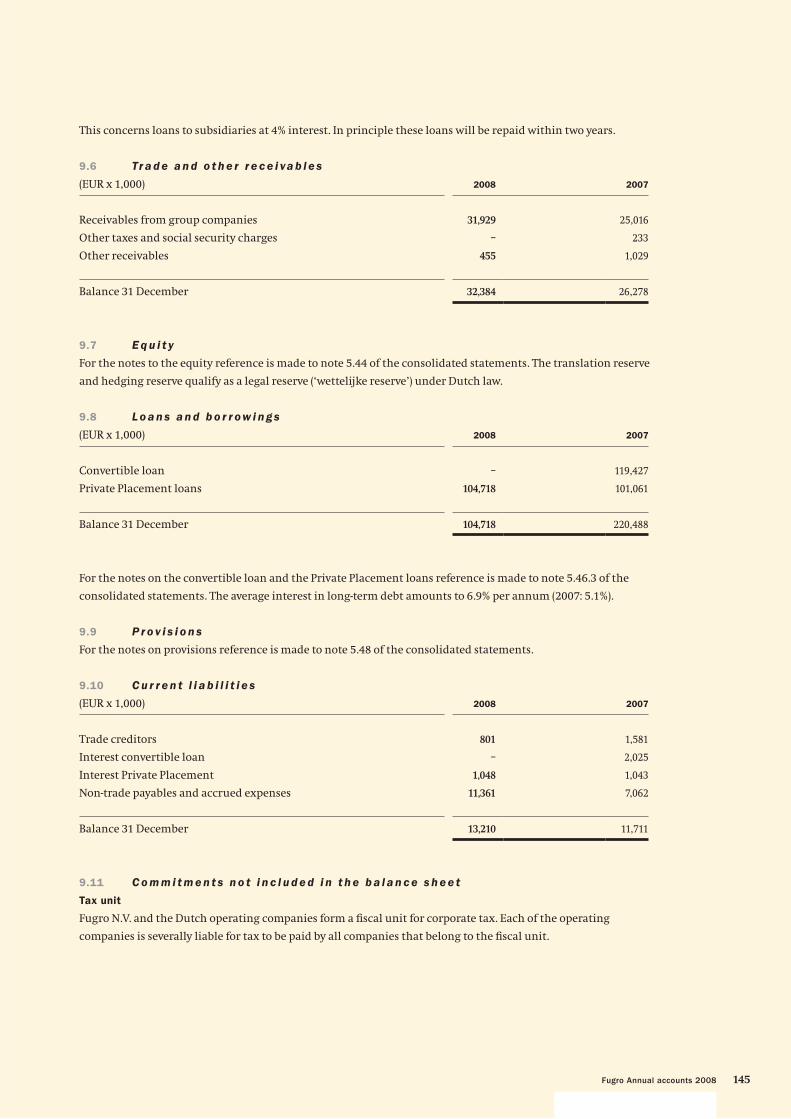
145Fugro Annual accounts 2008
This concerns loans to subsidiaries at 4% interest. In principle these loans will be repaid within two years.
9.6 Tr a d e a n d o t h e r r e c e i va b l e s
(EUR x 1,000) 2008 2007
Receivables from group companies 31,929 25,016
Other taxes and social security charges – 233
Other receivables 455 1,029
Balance 31 December 32,384 26,278
9.7 E q u i t y
For the notes to the equity reference is made to note 5.44 of the consolidated statements. The translation reserve
and hedging reserve qualify as a legal reserve (‘wettelijke reserve’) under Dutch law.
9.8 L o a n s a n d b o r r ow i n g s
(EUR x 1,000) 2008 2007
Convertible loan – 119,427
Private Placement loans 104,718 101,061
Balance 31 December 104,718 220,488
For the notes on the convertible loan and the Private Placement loans reference is made to note 5.46.3 of the
consolidated statements. The average interest in long-term debt amounts to 6.9% per annum (2007: 5.1%).
9.9 P r o v i s i o n s
For the notes on provisions reference is made to note 5.48 of the consolidated statements.
9.10 C u r r e n t l i a b i l i t i e s
(EUR x 1,000) 2008 2007
Trade creditors 801 1,581
Interest convertible loan – 2,025
Interest Private Placement 1,048 1,043
Non-trade payables and accrued expenses 11,361 7,062
Balance 31 December 13,210 11,711
9.11 C o m m i t m e n t s n o t i n c l u d e d i n t h e b a l a n c e s h e e t
Tax unit
Fugro N.V. and the Dutch operating companies form a fi scal unit for corporate tax. Each of the operating
companies is severally liable for tax to be paid by all companies that belong to the fi scal unit.
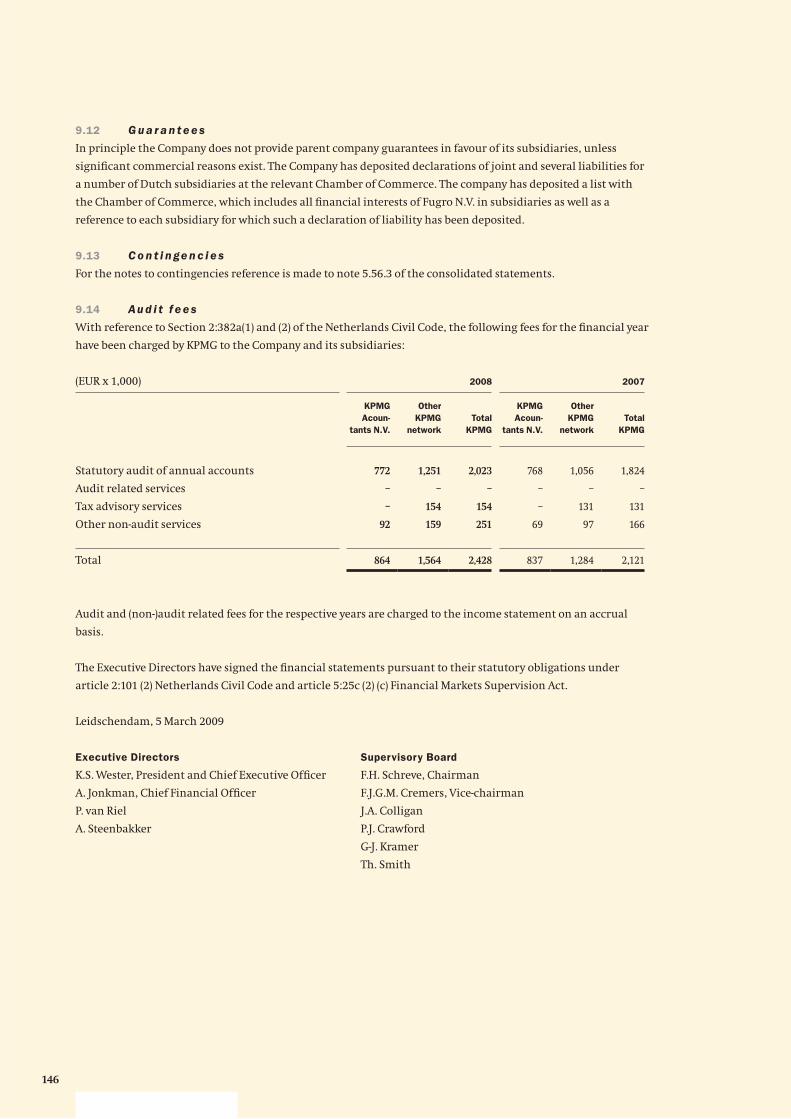
146
9.12 G u a r a n t e e s
In principle the Company does not provide parent company guarantees in favour of its subsidiaries, unless
signifi cant commercial reasons exist. The Company has deposited declarations of joint and several liabilities for
a number of Dutch subsidiaries at the relevant Chamber of Commerce. The company has deposited a list with
the Chamber of Commerce, which includes all fi nancial interests of Fugro N.V. in subsidiaries as well as a
reference to each subsidiary for which such a declaration of liability has been deposited.
9.13 C o n t i n ge n c i e s
For the notes to contingencies reference is made to note 5.56.3 of the consolidated statements.
9.14 Au d i t f e e s
With reference to Section 2:382a(1) and (2) of the Netherlands Civil Code, the following fees for the fi nancial year
have been charged by KPMG to the Company and its subsidiaries:
(EUR x 1,000) 2008 2007
KPMG
Acoun-
tants N.V.
Other
KPMG
network
Total
KPMG
KPMG
Acoun-
tants N.V.
Other
KPMG
network
Total
KPMG
Statutory audit of annual accounts 772 1,251 2,023 768 1,056 1,824
Audit related services – – – – – –
Tax advisory services – 154 154 – 131 131
Other non-audit services 92 159 251 69 97 166
Total 864 1,564 2,428 837 1,284 2,121
Audit and (non-)audit related fees for the respective years are charged to the income statement on an accrual
basis.
The Executive Directors have signed the fi nancial statements pursuant to their statutory obligations under
article 2:101 (2) Netherlands Civil Code and article 5:25c (2) (c) Financial Markets Supervision Act.
Leidschendam, 5 March 2009
Executive Directors Supervisory Board
K.S. Wester, President and Chief Executive Offi cer F.H. Schreve, Chairman
A. Jonkman, Chief Financial Offi cer F.J.G.M. Cremers, Vice-chairman
P. van Riel J.A. Colligan
A. Steenbakker P.J. Crawford
G-J. Kramer
Th. Smith
147Fugro Annual accounts 2008
1 0 O t h e r i n f o r m a t i o n
10.1 Au d i t o r ’s r e p o r t
To: the Supervisory Board and Shareholders of Fugro N.V.
Report on the financial statements
We have audited the accompanying fi nancial statements
2008 of Fugro N.V., Leidschendam as set out on pages 76
to 146. The fi nancial statements consist of the
consolidated fi nancial statements and the company
fi nancial statements. The consolidated fi nancial
statements comprise the consolidated balance sheet as
at 31 December 2008, income statement, statement of
recognised income and expense and statement of cash
fl ows for the year then ended, and a summary of
signifi cant accounting policies and other explanatory
notes. The company fi nancial statements comprise the
company balance sheet as at 31 December 2008, the
company income statement for the year then ended and
the notes.
Management’s responsibility
Management is responsible for the preparation and fair
presentation of the fi nancial statements in accordance
with International Financial Reporting Standards as
adopted by the European Union and with Part 9 of Book 2
of the Netherlands Civil Code, and for the preparation of
the report of the board of management in accordance
with Part 9 of Book 2 of the Netherlands Civil Code. This
responsibility includes: designing, implementing and
maintaining internal control relevant to the preparation
and fair presentation of the fi nancial statements that are
free from material misstatement, whether due to fraud or
error; selecting and applying appropriate accounting
policies; and making accounting estimates that are
reasonable in the circumstances.
Auditor’s responsibility
Our responsibility is to express an opinion on the
fi nancial statements based on our audit. We conducted
our audit in accordance with Dutch law. This law requires
that we comply with ethical requirements and plan and
perform the audit to obtain reasonable assurance
whether the fi nancial statements are free from material
misstatement.
An audit involves performing procedures to obtain audit
evidence about the amounts and disclosures in the
fi nancial statements. The procedures selected depend on
the auditor’s judgment, including the assessment of the
risks of material misstatement of the fi nancial
statements, whether due to fraud or error. In making
those risk assessments, the auditor considers internal
control relevant to the entity’s preparation and fair
presentation of the fi nancial statements in order to design
audit procedures that are appropriate in the
circumstances, but not for the purpose of expressing an
opinion on the effectiveness of the entity’s internal
control. An audit also includes evaluating the
appropriateness of accounting policies used and the
reasonableness of accounting estimates made by
management, as well as evaluating the overall
presentation of the fi nancial statements.
We believe that the audit evidence we have obtained is
suffi cient and appropriate to provide a basis for our audit
opinion.
Opinion with respect to the consolidated financial
statements
In our opinion, the consolidated fi nancial statements give
a true and fair view of the fi nancial position of Fugro N.V.
as at 31 December 2008, and of its result and its cash fl ow
for the year then ended in accordance with International
Financial Reporting Standards as adopted by the
European Union and with Part 9 of Book 2 of the
Netherlands Civil Code.
Opinion with respect to the company financial
statements
In our opinion, the company fi nancial statements give a
true and fair view of the fi nancial position of Fugro N.V. as
at 31 December 2008, and of its result for the year then
ended in accordance with Part 9 of Book 2 of the
Netherlands Civil Code.
Report on other legal requirements
Pursuant to the legal requirement under 2:393 sub 5 part
f of the Netherlands Civil Code, we report, to the extent of
our competence, that the management board report is
consistent with the fi nancial statements as required by
2:391 sub 4 of the Netherlands Civil Code.
Rotterdam, 5 March 2009
KPMG Accountants N.V.
H. Heijnraets RA
148
10.2 P o s t b a l a n c e s h e e t d a t e e ve n t s
Reference is made to note 5.57.
10.3 Fo u n d a t i o n B o a r d s
Stichting Administratiekantoor Fugro
The Board of the Stichting Administratiekantoor Fugro
comprises Messrs.:
name function term
R. van der Vlist, Chairman Board member 2012
L.P.E.M. van den Boom Board member 2009
J.F. van Duyne Board member 2011
W. Schatborn Board member 2010
Stichting Beschermingspreferente Aandelen Fugro
The Board of the Stichting Beschermingspreferente
Aandelen Fugro comprises Messrs.:
name function term
M.W. den Boogert, Chairman Board member B 2010
J.V.M. Commandeur Board member B 2012
J.C. de Mos Board member B 2009
P.H. Vogtländer Board member B 2011
F.H. Schreve Board member A 2010
Apart from Mr. Schreve no Board member has any links
with Fugro.
Stichting Continuïteit Fugro
The Board of the Stichting Continuïteit Fugro in the
Dutch Antilles is composed as follows:
name function term
M.A. Pourier, Chairman Board member B 2010
A.C.M. Goede Board member B 2009
R. de Paus Board member B 2011
M. van de Plank Board member B 2010
F.H. Schreve Board member A Perma-
nent
Apart from Mr. Schreve no Board member has any links
with Fugro.
10.4 P r o f i t a p p r o p r i a t i o n
Article 36 of the Articles of Association (as far as relevant):
36.2 a. The profi t shall, if suffi cient, be applied fi rst in
payment to the holders of white-knight
preference shares of a percentage as specifi ed
below of the compulsory amount paid on these
shares as at the commencement of the fi nancial
year for which the distribution is made.
b. The percentage referred to above in
subparagraph a. shall be equal to the average of
the Euribor interest charged for loans with a
term of one year – weighted by the number of
days for which this interest was applicable –
during the fi nancial year for which the
distribution is made, increased by at most four
percentage points; this increase shall each time
be fi xed by the Board of Management for a
period of fi ve years, after approval by the
Supervisory Board.
36.3 a. Next, if possible, a dividend shall be paid on the
fi nancing preference shares of each series and
on the convertible fi nancing preference shares
of each series, equal to a percentage calculated
on the amount effectively paid on the fi nancing
preference shares of the respective series and
the convertible fi nancing preference shares of
the respective series, including a share
premium, if any, upon the fi rst issue of the
series in question, and which percentage shall
be related to the average effective return on
‘state loans general with a term of 7 – 8 years’,
calculated and determined in the manner as
described hereinafter.
b. The percentage of the dividend for the fi nancing
preference shares of each or for the convertible
fi nancing preference shares of each series, as
the case may be, shall be calculated by taking
the arithmetic mean of the average effective
return on the aforesaid loans, as prepared by
the Central Bureau of Statistics (Centraal
Bureau voor de Statistiek) and published in the
Offi cial List of Euronext Amsterdam N.V. for the
last fi ve stock market trading days preceding the
day of the fi rst issue of fi nancing preference
shares of the respective series or the convertible
fi nancing preference shares of the respective
series, as the case may be, or preceding the day
on which the dividend percentage is adjusted,
increased or decreased, if applicable, by a
mark-up or mark-down set by the Board of
149Fugro Annual accounts 2008
Management upon issue and approved by the
Supervisory Board of at two percentage points,
depending on the market conditions then
obtaining, which mark-up or mark-down may
differ for each series.
36.4 In the event that in any fi nancial year the profi t
is insuffi cient to make the distributions
referred to in Paragraph 3 of this article, the
provisions contained in Paragraph 3 shall only
be applied in subsequent fi nancial years after
the defi cit has been made good and after the
provisions contained in Paragraph 3 have been
applied. The Board of Management shall be
authorised, subject to the approval of the
Supervisory Board, to resolve to distribute an
amount equal to the defi cit referred to in the
previous sentence from the reserves, with the
exception of the reserves formed by way of a
share premium on the issue of fi nancing
preference shares, respectively convertible
fi nancing preference shares.
36.5 In the event that the fi rst issue of fi nancing
preference shares, respectively convertible
fi nancing preference shares of a series, takes
place during the course of a fi nancial year, the
dividend on the relevant series of fi nancing
preference shares, respectively the convertible
fi nancing preference shares, will be
proportionately decreased to the fi rst day of
issue.
36.6 After application of the provisions contained in
Paragraphs 2 to 5 inclusive, no further dividend
distributions shall be made on the protective
preference shares or the fi nancing preference
shares, respectively the convertible fi nancing
preference shares.
36.7 From the profi t remaining after application of
the provisions contained in Paragraphs 2 to 5
inclusive, the Board of Management – subject to
the approval of the Supervisory Board – shall
make such reservations as the Board of
Management deems necessary. To the extent
that the profi t is not reserved by application of
the previous sentence, it shall be at the disposal
of the General Meeting either to be wholly or
partially reserved or to be wholly or partially
distributed to holders of ordinary shares in
proportion to the number of ordinary shares
they hold.
10.5 P r o p o s e d p r o f i t a p p r o p r i a t i o n
In accordance with Article 36 of the Articles of
Association, we propose a dividend of EUR 112.7 million
be paid out in the form of a cash payment of EUR 1.50 per
(depositary receipt of) share with a nominal value of EUR
0.05 or in the form of (certifi cates of) ordinary shares with
a nominal value of EUR 0.05 charged to the reserves.
150
R e p o r t o f S t i c h t i n g A d m i n i s t r a t i e k a n t o o r
F u g r o ( ‘ F u g r o Tr u s t O f f i c e Fo u n d a t i o n ’ )
In accordance with Article 19 of the Conditions of
Administration for the ordinary shares in the name of
Fugro N.V., the undersigned issue the following report to
the holders of certifi cates.
During the 2008 reporting year all the Fugro Trust Offi ce’s
activities were related to the administration of ordinary
shares against which certifi cates have been issued.
During 2008 the Board met twice: the meeting of 8 April
2008 was dedicated to the preparations for the Annual
General Meeting of Shareholders of Fugro N.V. (the
Company) and the meeting of 17 September 2008, after
the publication of the Company’s half-yearly results, was
dedicated to general business developments. Corporate
Governance within the Company and the Fugro Trust
Offi ce was also discussed, as well as the voting policy of
the Fugro Trust Offi ce. It was decided to post the voting
policy on the Company’s website.
All the Fugro Trust Offi ce’s Board members are
independent of the Company. The Board may offer holders
of certifi cates the opportunity to recommend candidates
for appointment to the Board. Further regulations related
to the holding of a meeting of holders of certifi cates have
been drawn-up. The Fugro Trust Offi ce is authorised to
accept voting instructions from holders of certifi cates and
to cast these votes during a General Meeting of
Shareholders.
The Board attended the Annual General Meeting of
Shareholders of the Company held on 14 May 2008 and
represented 64.9% of the votes cast. The Fugro Trust Offi ce
voted in favour of all the proposals submitted to the
meeting. In accordance with the Conditions of
Administration, holders of certifi cates were offered the
opportunity to vote, in accordance with their own
opinion, as authorised representatives of the Fugro Trust
Offi ce. This opportunity was taken by 128 holders of
certifi cates holding 18,360,878 certifi cates.
In accordance with the roster, on 30 June 2008 Mr. Van der
Vlist stepped down as a member of the Fugro Trust
Offi ce’s Board. The Fugro Trust Offi ce’s previous report
stated that, in accordance with Article 4.3 of the Articles
of Association, the Board offered holders of certifi cates
with a holding of 15% of the issued certifi cates the
opportunity to request, before 4 April 2008, that the Board
convene a meeting of holders of certifi cates in order to
recommend a candidate for membership of the Fugro
Trust Offi ce’s Board. As no request for a meeting of
holders of certifi cates was submitted, during its meeting
of 8 April 2008 the Board, in accordance with its
announced intention, reappointed Mr. Van der Vlist
as a Board member for a term of four years commencing
1 July 2008.
In accordance with the roster, on 30 June 2009,
Mr. Van den Boom will step down as a member of the
Fugro Trust Offi ce’s Board. The Fugro Trust Offi ce’s Board
intends reappointing Mr. Van den Boom as a Board
member for a term of four years. In accordance with
Article 4.3 of the Articles of Association, the Board offered
holders of certifi cates with a holding of 15% of the issued
certifi cates the opportunity to request, before 3 April
2009, that the Board convene a meeting of holders of
certifi cates in order to recommend a candidate to the
Fugro Trust Offi ce’s Board. The request should be
submitted in writing and should state the name and
address of the recommended candidate.
The Board of the Fugro Trust Offi ce comprises:
1. R. van der Vlist, Chairman
2. J.F. van Duyne
3. W. Schatborn
4. L.P.E.M. van den Boom
Mr. Van der Vlist was General Secretary of N.V. Koninklijke
Nederlandsche Petroleum Maatschappij.
Mr. Van Duyne was Chairman of the Board of
Management of Koninklijke Hoogovens N.V. and later CEO
of Corus.
Mr. Schatborn was a member of the Board of Management
of Stork.
Mr. Van den Boom was a member of the Board of
Management NIB Capital Bank N.V. and is also a Senior
Partner of PARK Corporate Finance.
In 2008 the total remuneration of the Board members
amounted to EUR 31,000 and the total costs of the Fugro
Trust Offi ce amounted to EUR 231,022.
On 31 December 2008 70,078,430 registered ordinary
shares with a nominal value of EUR 0.05 were in
administration against which 70,078,430 certifi cates of
ordinary shares with a nominal value of EUR 0.05 had
been issued. During the fi nancial year 300,623 certifi cates
151Fugro Annual accounts 2008
were exchanged into ordinary shares and 2,361,868
ordinary shares were exchanged into certifi cates. 863,747
certifi cates of ordinary shares were issued as a result of
the stock dividend and 5,158,170 certifi cates of ordinary
shares were issued in connection with the conversion of
a convertible bond.
The activities related to the administration of the shares
are carried out by the administrator of the Fugro Trust
Offi ce, Administratiekantoor van het Algemeen
Administratie en Trustkantoor B.V. in Amsterdam.
The Fugro Trust Offi ce’s address is: Veurse Achterweg 10,
2264 SG, Leidschendam, the Netherlands
Leidschendam, 25 March 2009
The Board
R e p o r t o f A N T Tr u s t & C o r p o r a t e S e r v i c e s
N . V. ( f o r m e r l y N . V. A l ge m e e n N e d e r l a n d s
Tr u s t k a n t o o r ) o ve r t h e y e a r 2 0 0 8
2.375% in certifi cates of ordinary shares convertible subordinated
debenture bond 2005 per 2010 originally of EUR 125,000,000 at
the cost of Fugro N.V.
To comply with the stipulations of Article 32 clause 2
of the deed of trust executed by notary F.K. Buijn in
Amsterdam on 27 April 2005, we issue the following
report.
Up to and including 20 April 2010 the bonds could
converted into certifi cates of ordinary shares in Fugro N.V.
(‘Fugro’) with a nominal value of EUR 0.05 at a conversion
price of EUR 24.25 (EUR 23.81 as per 30 May 2008 following
a contractual adjustment of the conversion price).
As from 11 May 2008 Fugro was entitled to redeem the
loan prior to the expiry date on condition that the Offi cial
Price List of Euronext Amsterdam shows that the closing
price of the certifi cates of ordinary shares in Fugro N.V.
has been at least 130% of the then prevailing conversion
price on at least twenty days out of thirty consecutive
trading days.
On 14 May 2008 Fugro announced the intention, to
redeem (the remainder of the) convertible bonds prior
to the expiry date and on 2 June 2008 Fugro announced
that this redemption would take place on 2 July 2008.
However redemption of the convertible bonds did not
take place because as per 25 June 2008 all remaining
convertible bonds outstanding, each with a nominal
value of EUR 1,000, were presented for conversion and
converted into certifi cates of ordinary shares in Fugro.
We have not found any cause for comment or action.
Amsterdam, 9 January 2009
ANT Trust & Corporate Services N.V.
152
H i s t o r i c r e v i e w 6)
IFRS
2008 IFRS
2007
IFRS
2006
IFRS
2005
IFRS
2004
IFRS
2003
I n c o m e a n d e x p e n s e s (x EUR 1,000)
Revenue 2,154,474 1,802,730 1,434,319 1,160,615 1,008,008 822,372
Third party costs (cost of sales) 722,321 604,855 503,096 405,701 364,644 273,372
Net revenue own services 1,432,153 1,197,875 931,223 754,914 643,364 549,000
Results from operating activities (EBIT) 3) 386,245 324,813 211,567 144,070 104,236 63,272
Cash fl ow 438,902 337,106 226,130 176,093 125,802 80,480
Net result 1) 3) 283,412 216,213 141,011 99,412 49,317 18,872
of which non-recurring items – – – – – –
B a l a n c e s h e e t (x EUR 1,000)
Property, plant and equipment 859,088 599,298 412,232 262,759 232,956 268,801
Investments 337,469 299,699 203,944 90,414 71,028 123,983
of which in acquisitions 14,423 8,666 21,041 10,057 2,296 70,888
Depreciation of property, plant and equipment 140,429 107,684 78,169 69,445 66,139 54,004
Net current assets 2) 56,060 171,347 150,733 222,485 (95,348) 114,852
Total assets 2,123,306 1,700,130 1,405,698 1,138,660 983,350 1,056,003
Non-current provisions 13,155 16,278 13,888 398 1,075 584
Interest bearing loans and borrowings 395,384 449,957 341,997 300,753 184,268 431,895
Equity attributable to equity holders of the company 2) 928,329 699,989 562,417 465,460 223,913 211,196
Key r a t i o s (in %) 3)
Results from operating activities (EBIT)/revenue 17.9 18.0 14.8 12.9 10.3 9.2
Profi t/revenue 13.2 12.0 9.8 8.6 4.9 2.3
Profi t/net revenue own services 19.8 18.0 15.1 13.2 7.7 8.3
Profi t/capital and reserves 2) 34.8 34.3 27.4 28.8 22.7 17.6
Total equity/total assets 2) 44.1 41.6 40.2 41.3 23.2 20.2
Interest cover 13.9 13.1 10.9 7.2 3.7 2.2
D a t a p e r s h a r e (x EUR 1.–) 3) 5)
Equity attributable to equity holders of the Company 2) 12.12 9.94 8.08 6.76 3.60 3.48
Results from operating activities (EBIT) 4) 5.29 4.67 3.08 2.18 1.76 1.09
Cash fl ow 4) 6.01 4.84 3.29 2.67 2.12 1.39
Net result 4) 3.88 3.11 2.05 1.51 0.83 0.33
Dividend paid in year under review 1.25 0.83 0.60 0.48 0.48 0.46
S h a r e p r i c e (x EUR 1.–) 5)
Year-end share price 20.485 52.80 36.20 27.13 15.35 10.20
Highest share price 59.95 62.00 36.64 27.40 16.41 12.86
Lowest share price 19.32 34.91 27.13 15.14 10.05 6.13
N u m b e r o f e m p l oy e e s
At year-end 13,627 11,472 9,837 8,534 7,615 8,472
S h a r e s i n i s s u e (x 1,000) 5)
Of nominal EUR 0.05 at year-end 76,608 70,421 69,582 68,825 62,192 60,664
1) The lower result is partly caused by IFRS adoption.
2) As of 2002 no accrued dividend has been incorporated.
3) For 2002 and earlier years, before amortisation of goodwill.
4) Unlike preceding years the figures as from the year 1999 have been calculated based upon the weighted average number of outstanding shares.
5) As a result of the share split (4:1) in 2005, the historical figures have been restated.
6) Based on IFRS as from 2003.
153Fugro Annual accounts 2008
Dutch
GAAP
2002
Dutch
GAAP
2001
Dutch
GAAP
2000
Dutch
GAAP
1999
Dutch
GAAP
1998
Dutch
GAAP
1997
Dutch
GAAP
1996
Dutch
GAAP
1995
Dutch
GAAP
1994
Dutch
GAAP
1993
945,899 909,817 712,934 546,760 578,207 482,096 375,276 296,636 300,130 221,490
328,401 331,685 250,132 176,067 197,258 172,346 123,337 99,378 100,104 65,344
617,498 578,132 462,765 370,648 380,948 309,750 251,939 197,258 200,026 156,146
111,873 98,470 73,697 61,805 61,669 46,195 25,911 12,434 21,146 18,015
119,161 105,301 85,596 77,233 74,057 60,670 39,479 26,773 33,625 26,728
72,220 61,732 46,024 40,704 37,800 31,084 16,018 7,170 13,931 12,388
– – – – – 3,630 – (4,538) – –
192,293 163,298 120,526 114,035 108,181 93,479 68,521 64,800 65,254 55,497
100,036 89,352 49,008 37,301 61,487 58,220 27,000 24,776 39,434 25,639
24,852 11,196 3,686 9,257 6,081 5,763 1,724 3,222 11,662 4,901
46,941 43,569 39,572 36,529 36,257 29,586 23,460 19,603 19,694 14,339
129,071 (50,514) 92,269 15,066 7,170 6,308 11,571 9,121 23,733 17,334
793,245 814,772 474,741 380,495 338,021 289,512 216,272 170,122 176,702 141,579
12,706 8,056 6,746 10,573 8,894 7,805 4,447 2,723 2,450 3,403
273,520 121,450 120,713 23,234 24,368 17,153 18,741 23,823 30,449 7,260
271,698 244,660 101,453 107,909 90,575 77,370 61,260 51,050 58,402 62,168
11.8 10.8 10.3 11.3 10.7 9.6 6.9 4.2 7.0 8.1
7.6 6.8 6.5 7.4 6.5 6.4 4.3 2.4 4.6 5.6
11.7 10.7 9.9 11.0 9.9 10.0 6.4 3.6 7.0 7.9
27.4 35.7 45.4 41.0 45.0 44.8 28.5 13.1 23.1 20.9
34.6 30.4 22.1 29.3 27.9 27.7 28.9 30.4 33.8 44.7
6.1 7.8 8.1 13.1 12.1 10.4 – – – –
4.57 4.17 2.10 2.29 1.91 1.65 1.36 1.11 1.39 1.71
1.95 1.86 1.48 1.27 1.30 0.98 0.58 0.27 0.50 0.50
2.08 1.98 1.72 1.59 1.56 1.29 0.88 0.58 0.80 0.74
1.26 1.16 0.92 0.84 0.80 0.66 0.36 0.16 0.33 0.34
0.46 0.40 0.34 0.31 0.28 0.25 0.17 0.08 0.17 0.17
10.78 12.53 17.19 9.23 4.99 7.01 3.48 1.96 3.88 4.17
16.50 18.91 17.81 9.98 10.99 8.28 3.71 4.14 4.75 4.46
9.88 10.75 9.31 4.10 4.06 3.44 1.93 1.45 3.69 2.64
6,923 6,953 5,756 5,114 5,136 4,429 4,222 3,968 3,557 2,824
59,449 58,679 51,048 50,449 48,682 47,673 46,053 46,044 46,040 36,370
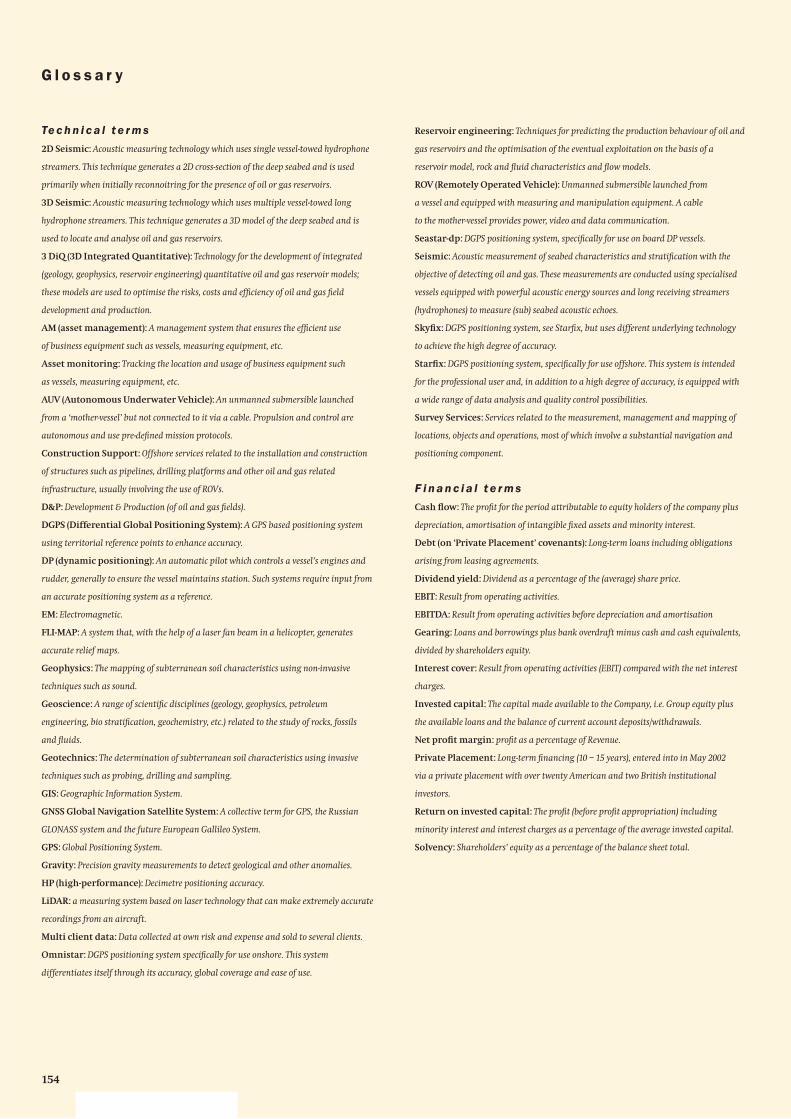
154
G l o s s a r y
Te c h n i c a l t e r m s
2D Seismic: Acoustic measuring technology which uses single vessel-towed hydrophone
streamers. This technique generates a 2D cross-section of the deep seabed and is used
primarily when initially reconnoitring for the presence of oil or gas reservoirs.
3D Seismic: Acoustic measuring technology which uses multiple vessel-towed long
hydrophone streamers. This technique generates a 3D model of the deep seabed and is
used to locate and analyse oil and gas reservoirs.
3 DiQ (3D Integrated Quantitative): Technology for the development of integrated
(geology, geophysics, reservoir engineering) quantitative oil and gas reservoir models;
these models are used to optimise the risks, costs and effi ciency of oil and gas fi eld
development and production.
AM (asset management): A management system that ensures the effi cient use
of business equipment such as vessels, measuring equipment, etc.
Asset monitoring: Tracking the location and usage of business equipment such
as vessels, measuring equipment, etc.
AUV (Autonomous Underwater Vehicle): An unmanned submersible launched
from a ‘mother-vessel’ but not connected to it via a cable. Propulsion and control are
autonomous and use pre-defi ned mission protocols.
Construction Support: Offshore services related to the installation and construction
of structures such as pipelines, drilling platforms and other oil and gas related
infrastructure, usually involving the use of ROVs.
D&P: Development & Production (of oil and gas fi elds).
DGPS (Differential Global Positioning System): A GPS based positioning system
using territorial reference points to enhance accuracy.
DP (dynamic positioning): An automatic pilot which controls a vessel’s engines and
rudder, generally to ensure the vessel maintains station. Such systems require input from
an accurate positioning system as a reference.
EM: Electromagnetic.
FLI-MAP: A system that, with the help of a laser fan beam in a helicopter, generates
accurate relief maps.
Geophysics: The mapping of subterranean soil characteristics using non-invasive
techniques such as sound.
Geoscience: A range of scientifi c disciplines (geology, geophysics, petroleum
engineering, bio stratifi cation, geochemistry, etc.) related to the study of rocks, fossils
and fl uids.
Geotechnics: The determination of subterranean soil characteristics using invasive
techniques such as probing, drilling and sampling.
GIS: Geographic Information System.
GNSS Global Navigation Satellite System: A collective term for GPS, the Russian
GLONASS system and the future European Gallileo System.
GPS: Global Positioning System.
Gravity: Precision gravity measurements to detect geological and other anomalies.
HP (high-performance): Decimetre positioning accuracy.
LiDAR: a measuring system based on laser technology that can make extremely accurate
recordings from an aircraft.
Multi client data: Data collected at own risk and expense and sold to several clients.
Omnistar: DGPS positioning system specifi cally for use onshore. This system
differentiates itself through its accuracy, global coverage and ease of use.
Reservoir engineering: Techniques for predicting the production behaviour of oil and
gas reservoirs and the optimisation of the eventual exploitation on the basis of a
reservoir model, rock and fl uid characteristics and fl ow models.
ROV (Remotely Operated Vehicle): Unmanned submersible launched from
a vessel and equipped with measuring and manipulation equipment. A cable
to the mother-vessel provides power, video and data communication.
Seastar-dp: DGPS positioning system, specifi cally for use on board DP vessels.
Seismic: Acoustic measurement of seabed characteristics and stratifi cation with the
objective of detecting oil and gas. These measurements are conducted using specialised
vessels equipped with powerful acoustic energy sources and long receiving streamers
(hydrophones) to measure (sub) seabed acoustic echoes.
Skyfi x: DGPS positioning system, see Starfi x, but uses different underlying technology
to achieve the high degree of accuracy.
Starfi x: DGPS positioning system, specifi cally for use offshore. This system is intended
for the professional user and, in addition to a high degree of accuracy, is equipped with
a wide range of data analysis and quality control possibilities.
Survey Services: Services related to the measurement, management and mapping of
locations, objects and operations, most of which involve a substantial navigation and
positioning component.
F i n a n c i a l t e r m s
Cash fl ow: The profi t for the period attributable to equity holders of the company plus
depreciation, amortisation of intangible fi xed assets and minority interest.
Debt (on ‘Private Placement’ covenants): Long-term loans including obligations
arising from leasing agreements.
Dividend yield: Dividend as a percentage of the (average) share price.
EBIT: Result from operating activities.
EBITDA: Result from operating activities before depreciation and amortisation
Gearing: Loans and borrowings plus bank overdraft minus cash and cash equivalents,
divided by shareholders equity.
Interest cover: Result from operating activities (EBIT) compared with the net interest
charges.
Invested capital: The capital made available to the Company, i.e. Group equity plus
the available loans and the balance of current account deposits/withdrawals.
Net profi t margin: profi t as a percentage of Revenue.
Private Placement: Long-term fi nancing (10 – 15 years), entered into in May 2002
via a private placement with over twenty American and two British institutional
investors.
Return on invested capital: The profi t (before profi t appropriation) including
minority interest and interest charges as a percentage of the average invested capital.
Solvency: Shareholders’ equity as a percentage of the balance sheet total.

155Fugro Annual accounts 2008

156
Fugro N.V.
Veurse Achterweg 10
P.O. Box 41
2260 AA Leidschendam
The Netherlands
Telephone: +31 (0)70 3111422
Fax: +31 (0)70 3202703
E-mail: [email protected]
www.fugro.com
Trade Register number 27120091
VAT number 00 56 21 409 B01
C o l o p h o n
Fugro N.V.
Veurse Achterweg 10
2264 SG Leidschendam
The Netherlands
Telephone: +31 (0)70 3111422
Fax: +31 (0)70 3202703
Concept and realisation:
C&F Report Amsterdam B.V.
Photography and images:
Max and Co., Aberdeen
Picture Report, Amsterdam
Fugro N.V.
Fugro has endeavoured to fulfil all legal requirements
related to copyright. Anyone who, despite this, is of
the opinion that other copyright regulations could
be applicable should contact Fugro.
Translation: Technical Editing Services Limited,
Tattenhall, United Kingdom
This annual report is a translation of the official
report published in the Dutch language.
This annual report is also available on www.fugro.com.
For complete information, see www.fugro.com.
Cautionary Statement regarding Forward-Looking Statements
This annual report may contain forward-looking statements. Forward-looking statements are statements that are not historical facts, including
(but not limited to) statements expressing or implying Fugro N.V.’s beliefs, expectations, intentions, forecasts, estimates or predictions (and the
assumptions underlying them). Forward-looking statements necessarily involve risks and uncertainties. The actual future results and situations
may therefore differ materially from those expressed or implied in any forward-looking statements. Such differences may be caused by various
factors (including, but not limited to, developments in the oil and gas industry and related markets, currency risks and unexpected operational
setbacks). Any forward-looking statements contained in this annual report are based on information currently available to Fugro N.V.’s manage-
ment. Fugro N.V. assumes no obligation to make a public announcement in each case where there are changes in information related to,
or if there are otherwise changes or developments in respect of, the forward-looking statements in this annual report.

GEOTECHNIEK
MILIEU ONDERZOEK
MARINER
AN
NU
AL
RE
PO
RT
20
08
FU
GR
O N
.V
.
Annua l R e p o r t 2008FUGRO N .V.