fugro n.v. annual report 2005 - jaarverslag.com · fugro operates around the world at sea, on land...
TRANSCRIPT

AN
NU
AL
RE
PO
RT
20
05
FU
GR
O N
.V.
A n n u a l R e p o r t 2 0 0 5F U G R O N . V.
GEOTECHNIEK
MILIEU ONDERZOEK
MARINER

Fugro N.V.
Veurse Achterweg 10
P.O. Box 41
2260 AA Leidschendam
The Netherlands
Telephone: +31 (0)70 3111422
Fax: +31 (0)70 3202703
E-mail: [email protected]
www.fugro.com
Chamber of Commerce Haaglanden
number 27120091
C o l o p h o n
Fugro N.V.
Veurse Achterweg 10
2264 SG Leidschendam
The Netherlands
Telephone: +31 (0)70 3111422
Fax: +31 (0)70 3202703
Concept and realisation:
C&F Report Amsterdam B.V.
Photography:
Fugro N.V.,
Picture Report, Amsterdam,
Peter Boer, and others.
Fugro has endeavored to
fulfil all legal requirements
related to copyright. Anyone
who, despite this, is of the
opinion that other copyright
regulations could be applicable
should contact Fugro.
Text:
Boogaard Communications
Consultancy (BCC) v.o.f.
This annual report is a
translation of the official
report published in the Dutch
language.
The annual report is also
available on our website
www.fugro.com.
For complete information, see www.fugro.com
Cautionary Statement regarding Forward-Looking Statements
This annual report may contain forward-looking statements. Forward-looking statements are statements that are not historical facts, including
(but not limited to) statements expressing or implying Fugro N.V.’s beliefs, expectations, intentions, forecasts, estimates or predictions (and the
assumptions underlying them). Forward-looking statements necessarily involve risks and uncertainties. The actual future results and situations
may therefore differ materially from those expressed or implied in any forward-looking statements. Such differences may be caused by various
factors (including, but not limited to, developments in the oil and gas industry and related markets, currency risks and unexpected operational
setbacks). Any forward-looking statements contained in this announcement are based on information currently available to Fugro N.V.’s manage-
ment. Fugro N.V. assumes no obligation to in each case make a public announcement if there are changes in that information or if there are
otherwise changes or developments in respect of the forward-looking statements in this annual report.
A n n u a l R e p o r t 2 0 0 5
C o n t e n t s
A n n u a l a c c o u n t s 2 0 0 5
1 Consolidated income statement 66
2 Consolidated statement of recognised income and expense 67
3 Consolidated balance sheet 68
4 Consolidated statement of cash flows 69
5 Notes to the consolidated financial statements 71
6 Subsidiaries and Associates of Fugro N.V. 116
7 Company balance sheet 120
8 Company income statement 121
9 Notes to the company financial statements 122
10 Other information 128
Auditors’ report 2005 128
Post balance sheet date events 128
Foundation Boards 129
Profit appropriation 129
Proposed profit appropriation 130
Historic review 132
Report of Stichting Administratiekantoor Fugro 134
Declaration of independence 135
Report N.V. Algemeen Nederlands Trustkantoor 135
Glossary 136
Major developments in 2005 2
Preface from the President and Chief Executive Officer 3
Profile 4
Fugro’s activities and markets 5
Key figures 6
Mission, financial targets, strategy and policy 8
Theme: Fugro active throughoutthe lifecycle of an oil or gas field 11
Report of the Supervisory Board 15
Report of the Board of Management 21
General business development 21
Historic overview based on average
currency rates over 2001 21
Financial developments 23
Dividend proposal 26
Organisation and personnel 26
Sustainable business 28
Information and Communication Technology 32
Business Principles 32
Research 33
Market development and trends 33
Backlog 35
Post balance sheet date events 36
Prospects 36
Geotechnical services 40
Survey services 42
Geoscience services 45
Corporate Governance 48
Safety awards 51
Risk management 54
Information for shareholders 58
Fugro’s contribution to society 62
Fugro takes the prize 63

• In the year under review turnover rose by 15.1% to
EUR 1,160.6 million (2004: EUR 1,008.0 million).
Organic growth was 12.0%, while acquisitions and disposals
on balance increased turnover by 0.3%. Turnover rose by 2.8%
due to currency effects other than those related to the USD.
• The net result improved by 102% and rose to EUR 99.4 million
(2004: EUR 49.3 million).
• The net profit margin based on the IFRS principles of
valuation which are now applicable rose to 8.6% (2004: 4.9%).
• Earnings per share rose by 82% to EUR 1.51 (2004: EUR 0.83,
taking into account the four for one share split of
20 June 2005). Cash flow per share was 26% higher at
EUR 2.67 (2004: EUR 2.12).
• All three divisions contributed towards the much improved
net result. The contribution towards profit made by the
offshore activities in the Survey division showed a
considerable improvement compared with 2004.
• In 2005 Fugro made several strategic acquisitions in China,
India and New Zealand. A new company called Fugro-
OceansatPEG was established in Brazil.
• As announced in several external publications, investments
by the oil and gas industry (in dollars) in 2005 were around
20% higher than in 2004. These investments are now leading
to a visible increase in demand for services from suppliers to
the oil and gas industry.
• In March 2005, about 95% of the 4.75% convertible
subordinated bond of EUR 100 million issued in 2000 was
converted into shares. The remainder was redeemed. Due to
the conversion the number of issued shares has risen by 9.5%
(68,825,192 shares per 31 December 2005).
• In April 2005 a five year senior unsecured convertible bond of
EUR 125 million was issued at 2.375%. The conversion price
is EUR 24.25.
• To finance further growth, in April 2005 Fugro also arranged
a five-year revolving credit line of EUR 100 million at an
interest rate of Euribor plus 35 base points.
• On 20 June 2005 a share split was implemented (four for one).
The number of issued shares on 31 December 2005 was
68,825,192 (31 December 2004: converted 62,191,556).
• It is proposed that the dividend in cash or (certificates of)
shares (whichever the shareholder prefers) be increased to
EUR 0.60, (2004: converted EUR 0.48).
• Mr. K.S. Wester (1946), who joined Fugro in 1981 and has
been a Director of Fugro N.V. since 1996, was appointed
President and Chief Executive Officer as of 1 October 2005.
He succeeded Mr. G-J. Kramer (1942) who retired on
31 December 2005 after nearly 23 years with Fugro.
• Fugro now has annual IFRS accounting figures covering the
past three years. Fugro’s financial reporting for 2004 and
2005 complied fully with the IFRS reporting regulations.
These IFRS reports are accompanied by an unqualified audit
opinion.
M a j o r d e v e l o p m e n t s i n 2 0 0 5
2

D e a r s h a r e h o l d e r s a n d
o t h e r s t a k e h o l d e r s ,
As the new President and Chief Executive Officer of Fugro
I am delighted to be able to present to you the best year in
Fugro’s history up till now. At the same time a special
word of thanks to my predecessor Mr. G-J. Kramer is called
for. He stepped down as President and Chief Executive
Officer on 1 October 2005 after having led Fugro in an
excellent manner since 1983. I consider that it is my job to
continue to follow the successful course on which the
company has been set. We make our strategy transparent
for all our stakeholders, the organisation is well equipped
on every front and the market conditions for the coming
period appear to be good.
The results for 2005 were good. Turnover rose to
a record level of EUR 1,161 million. Most of this growth
was organic. The net result (EUR 99 million) rose,
comparatively speaking, even more. The positive
development of the result meant that the net profit
margin rose to 8.6% (2004: 4.9%). The way we see things at
the moment we believe that under the current market
conditions a target margin of 8% – 8.5% under IFRS
regulations is feasible.
There are a number of factors that instil us with
confidence for the future. Since mid 2004, a major
portion of the global increase in investments by the oil
and gas industry has benefited suppliers such as Fugro.
Much of the investment has been made to compensate
for the depletion of existing fields. It is generally believed,
provided that the oil price remains above USD 30 –
USD 40, this type of investment is expected to continue in
the coming years. In addition to the depletion effect there
is also an increasing demand from up-and-coming
economies such as China and India.
To a certain extent the same development also
applies for Fugro’s other core activities in mining and
infrastructure. With economies picking up the need for
raw materials remains strong, which means a structural
increase in the demand for minerals. Fugro plays an
active role in the process of locating raw materials and
minerals, but is also involved in the search for, the
increasingly scarce, underground fresh water reserves.
The market for complex infrastructure projects, a market
in which Fugro is involved on a very regular basis, is still
regionally-oriented. There is a structural growth in the
world’s population. The transport of goods and people is
increasing and the protection of living and working
environments from natural forces requires continuous
and increasing attention. This is leading to construction
activities both on land and in coastal waters.
Fugro offers a wide range of services with as the
common denominator the collection and interpretation
of data related to the earth’s surface and the soils and
rocks beneath. A clear synergy effect is created within
Fugro because expertise and experience gained by one
business unit is developed further or used by other
services and activities. Our investments and strategic
acquisitions also contribute towards this goal.
These elements remain components of our policy,
which means that in the coming years there will be
substantial investments, including investment in
new seismic equipment.
The number of employees will also rise. The confidence
our employees place in Fugro is expressed by the low staff
turnover. We express the confidence to our shareholders
through the dividend that is increasing in-line with the
company’s development. It is proposed that for 2005
the dividend is increased with 25% to EUR 0.60 (2004:
converted EUR 0.48).
Fugro’s foundations are firm, the markets in which
we operate are picking up all over the world and our order
portfolio is healthy. We remain focussed on a healthy
autonomous growth supplemented by growth through
acquisitions. Possible acquisition candidates are always
evaluated extremely carefully and acquisitions only take
place if they fit within Fugro’s culture and global activity
portfolio. To summarise, we have confidence in the
future.
Yours faithfully,
Fugro N.V.
K.S. Wester
President and Chief Executive Officer
P r e f a c e f r o m t h e P r e s i d e n t a n d C h i e f E x e c u t i v e O f f i c e r
3

4
G e o s c i e n c e d i v i s i o nS u r v e y d i v i s i o nG e o t e c h n i c a l d i v i s i o n
Investigation of and advice
regarding the physical
characteristics of the soil,
foundation design and
construction materials.
Precise positioning services,
geological advice, topographic,
hydrographic and geological
mapping and support services
for offshore and onshore
construction projects, as well as
data management.
Acquisition, processing and
interpretation of seismic and
geological data, reservoir
modeling and estimation of
oil, gas, mineral and water
resources and the optimisation
of their exploration,
development and production.
F U G R O G R O U P
P r o f i l e
Fugro collects and interprets data related to the earth’s
surface and the soil and rocks beneath. On the basis of
this the Company provides advice, generally for purposes
related to the oil and gas industry, the mining industry
and the construction industry, including infrastructure
projects.
Fugro operates around the world at sea, on land and
from the air, using professional, highly specialised staff
supported by advanced technologies and systems, many
of which have been developed in-house. The equipment
Fugro uses to carry out its work includes over thirty
vessels, several hundred CPT (Cone Penetration Test)
and drilling units and approximately forty aeroplanes
and helicopters as well as some sixty ROVs (Remotely
Operated Vehicles).
Fugro’s objective is to hold a leading market position
due to its technological developments and quality.
This requires a strong international or regional market
presence.
Fugro was founded in 1962, has been listed on Euronext
N.V. in Amsterdam since 1992 and has been included in
the Amsterdam Midkap Index since March 2002.
Fugro has approximately 8,500 staff permanently
stationed in over 50 countries.
Organisationally Fugro comprises three divisions: Geotechnical, Survey and Geoscience.

5
F u g r o ’s a c t i v i t i e s a n d m a r k e t s
Fugro has no competitors offering the same scale of
cohesive activities world wide.
The offshore Geotechnical, offshore Survey, Development
& Production, Airborne Survey and Positioning business
units operate in a global market. Fugro holds a leading
position in almost all of these markets. The competition
varies per activity and geographical region. The oil and
gas industry is the major client in these markets.
The onshore activities revolve around local or regional
markets. Fugro operates in many countries and its market
positions vary per region. Most orders are carried out
within a hundred kilometres of the relevant office.
Market
Local/regional markets
Global market
Global market
Local/regional markets
Global market
Global market
Global market
Market position
Strong regional position,
varying by country/region
Strong leading position
Leading position
Strong regional position,
varying by country/region
Strong position in niche
markets
Leading position in niches
Leading position
G e o t e c h n i c a l
Onshore
Offshore
S u r v e y
Offshore
Onshore
Positioning
G e o s c i e n c e
Development & Production
Airborne Survey
Major clients
Government, industry and
construction contractors
Oil and gas companies,
contractors
Oil and gas companies
Government, industry and
construction contractors
Agriculture, mining and
survey services
Oil and gas companies
Mining and oil and gas
companies
IFRS2005
1,160.6
754.9
144.1
176.1
99.4
8.6
7.2
1,138.7
470.8
40.9
51.0
30.4
20.8
262.8
90.4
69.4
6.76
2.18
2.67
1.51
0.48
27.13
27.40
15.14
14.1
2.2
68,825
67,886
65,976
8,534
IFRS2004
1,008.0
643.4
104.2
125.8
49.3
4.9
3.7
983.4
228.2
22.8
32.9
25.9
14.5
233.0
71.0
66.1
3.60
1.76
2.12
0.83
0.48
15.35
16.41
10.05
15.9
3.6
62,192
60,548
59,360
7,615
IFRS2003
822.4
549.0
63.3
80.5
18.9
2.3
2.2
1,056.0
213.7
20.0
29.1
10.9
7.5
268.8
124.0
54.0
3.48
1.09
1.39
0.33
0.46
10.20
12.86
6.13
29.1
4.9
60,664
58,308
57,856
8,472
Change in %
15.1
17.3
38.3
40.0
101.6
75.5
94.6
15.8
106.3
79.4
55.0
17.4
43.4
12.8
27.3
5.0
87.8
23.9
25.9
81.9
–
76.7
67.0
50.6
(11.3)
(38.9)
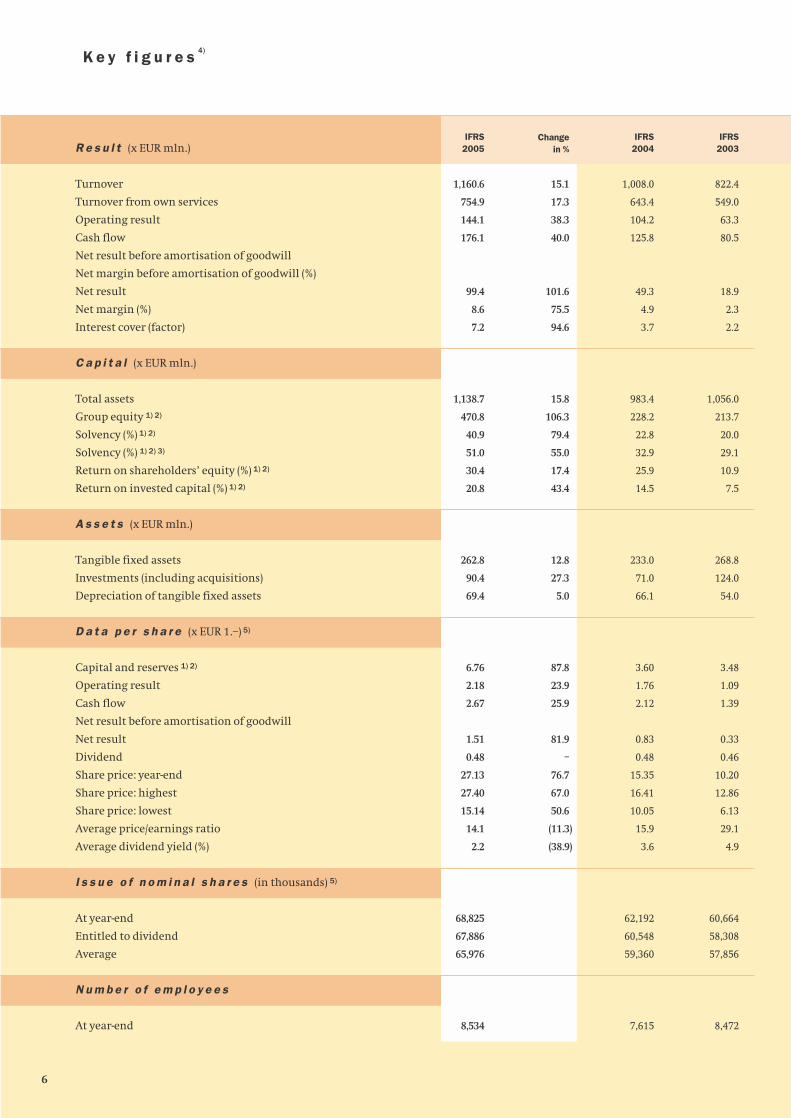
K e y f i g u r e s 4)
6
R e s u l t (x EUR mln.)
Turnover
Turnover from own services
Operating result
Cash flow
Net result before amortisation of goodwill
Net margin before amortisation of goodwill (%)
Net result
Net margin (%)
Interest cover (factor)
C a p i t a l (x EUR mln.)
Total assets
Group equity 1) 2)
Solvency (%) 1) 2)
Solvency (%) 1) 2) 3)
Return on shareholders’ equity (%) 1) 2)
Return on invested capital (%) 1) 2)
A s s e t s (x EUR mln.)
Tangible fixed assets
Investments (including acquisitions)
Depreciation of tangible fixed assets
D a t a p e r s h a r e (x EUR 1.–) 5)
Capital and reserves 1) 2)
Operating result
Cash flow
Net result before amortisation of goodwill
Net result
Dividend
Share price: year-end
Share price: highest
Share price: lowest
Average price/earnings ratio
Average dividend yield (%)
I s s u e o f n o m i n a l s h a r e s (in thousands) 5)
At year-end
Entitled to dividend
Average
N u m b e r o f e m p l o y e e s
At year-end

1) After providing for a cash dividend
of 50% in 2001.
2) Since 2002, no accrual for dividend
has been included.
3) Convertible bond treated as Group
equity.
4) Based on IFRS from 2003 onwards.
5) Figures 2001 through 2004 adjusted
for share split.
DutchGAAP2002
945.9
617.5
111.9
119.2
72.2
7.6
60.2
6.4
6.1
793.2
274.3
34.3
46.9
27.4
15.4
192.3
100.0
46.9
4.57
1.95
2.07
1.26
1.05
0.46
10.78
16.50
9.88
12.6
3.5
59,448
57,580
57,436
6,923
DutchGAAP2001
909.8
578.1
98.5
105.3
61.7
6.8
56.3
6.2
7.8
814.8
247.6
30.0
42.3
35.7
19.1
163.3
89.4
43.6
4.17
1.86
1.98
1.16
1.06
0.40
12.53
18.91
10.75
14.0
2.7
58,680
57,024
53,104
6,953
7
0
250
500
750
1,000
1,250
20052004200320022001
0
160
320
480
640
800
20052004200320022001
0
40
80
120
160
200
20052004200320022001
0
25
50
75
100
125
20052004200320022001
0.0
0.4
0.8
1.2
1.6
2.0
20052004200320022001
(x EUR 1 mln.)
T u r n o v e r 4)
(x EUR 1 mln.)
N e t r e v e n u e 4)
(x EUR 1 mln.)
C a s h f l o w 4)
(x EUR 1 mln.)
N e t r e s u l t 4)
(x EUR 1.–)
N e t r e s u l t p e r s h a r e 4)

8
M i s s i o n
Fugro’s mission is to be the world’s leading company in
the offshore, onshore and airborne collection and
interpretation of data related to the earth’s surface and
the soils and rocks beneath, primarily aimed at providing
advice to the:
• oil and gas industry;
• mining industry and
• construction industry.
This mission is achieved through:
• providing a high-quality service;
• professional, highly-specialised staff and
• advanced, generally state-of-the-art, unique
technologies and systems.
F i n a n c i a l t a r g e t s
Fugro’s target is to achieve a structural increase in
earnings per share for its shareholders. Fugro’s long-term
policy is aimed at generating a steady growth in net profit
by both improving the net margin and increasing
turnover. To achieve this a clear and consistently
implemented strategy for all stakeholders is vital.
Fugro is aiming for a net profit margin of around 8% of
turnover.
Other important financial targets are:
• maintaining a healthy balance sheet and solvency
(30 – 35%);
• a strong cash flow with an average annual growth
per share of 10%;
• a healthy interest cover of more than 5 (EBIT/Interest)
and
• a growth in earnings per share averaging 10%
per annum.
Fugro’s financing strategy is aimed at the utilisation
and/or optimisation of:
• the ratio between risk and return of the various
business activities;
• the relationship between shareholders’ equity and
short-term / long-term loans;
• the use of both public and private capital markets;
• the duration and phasing of the different financing
components.
The transition to IFRS has not had any influence on
Fugro’s (financing)strategy, operational development
and cash flow and does not materially alter the historic
picture of Fugro.
S t r a t e g y
Long-term (3 – 5 years)
In the long-term Fugro aims at achieving equilibrium
between its various activities in order to achieve its
targets. This is an essential component of its strategy.
Fugro strives for a good balance between services related
to exploration and production activities for the oil and
gas industry and those related to other markets, such as
mining and infrastructure. This also results in a certain
balance between offshore and onshore activities.
This diverse range of cohesive activities reduces Fugro’s
vulnerability to market fluctuations in one particular
sector and the broad spread of its activities, in terms of
both products and geography, ensures good control of
business risks. In the most important sector – oil and gas –
the spread of Fugro’s services across both the exploration
and exploitation phases is a key factor. Avoiding
dependence on one market or single group of clients is an
essential component of the Company’s strategy. The
result is a company that is less cyclical than it would be if
Fugro did not operate globally and for more than one
group of clients.
Profit margins vary per activity depending on the specific
market circumstances. On average, the target profit
margin is higher for the more risky and capital intensive
offshore and airborne activities than for the onshore
activities.
The aim is to achieve robust but controlled profit growth
through:
• a broad but cohesive activity portfolio;
• the manner in which Fugro is financed;
• the organisational structure;
• management based more on net result than on
turnover growth.
M i s s i o n , f i n a n c i a l t a r g e t s , s t r a t e g y a n d p o l i c y

– 60%
– 40%
– 20%
0%
20%
40%
60%
1995A
1994A
1996A
1997A
1998A
1999A
2000A
2001A
2002A
2003A
2004A
2006F
2005F
E&P spending
Oil price
A =
F =
Actual
Forecast
– 30%
– 20%
– 10%
0%
10%
20%
30%
C h a n g e i n o i l p r i c e a g a i n s t E & P s p e n d i n g
o f t h e o i l c o m p a n i e s (1994 – 2005)
One way a higher margin can be achieved is by having
substantial market shares for Fugro’s core activities and
in niche markets. The target margin can be achieved
through:
• increasing operational scale;
• strong market positions;
• considerable and continuous research;
• being selective about the projects that are
taken on and
• the acquisition of companies with a high
added-value.
Concluding, Fugro’s combination of professional and
specialised staff, technologies (mostly developed in-house)
and related high-value services enables Fugro to offer
clients more and more added-value.
Short-term (1 – 2 years)
Fugro’s short-term aim is to maintain a target margin of
at least 8% of turnover. The focus is also on achieving at
least the historical average annual organic turnover
growth of over 5%. Possible acquisitions will be evaluated
as and when they present themselves rather than being
planned systematically beforehand.
In the ICT area Fugro has developed an ICT security policy
that is in-line with the ISO 17799 and BS 7799 standards. A
major portion of the operating companies are ISO quality
certified. Fugro aims to achieve ISO quality certification
for all relevant operating companies within two years.
The organisational structure of the Development
& Production business unit was optimised in 2005.
The attention for this business unit will be continued
during the coming period, to further improve the
decisiveness and position in this promising market.
Fugro’s position in the offshore seismic market will be
strengthened further in 2006 to make operating on a
global basis more efficient. The balance between contract
and multi-client work will depend on the opportunities
that are available in the market, but both types of work
will continue to be components of Fugro’s strategy for
the seismic activities. Fugro will also invest in the further
expansion and modernisation of equipment, in particular
underwater measuring equipment.
P o l i c y
Sustainability, transparency and reliability have been
core policy themes for Fugro for a very long time.
Fugro’s (financial) targets and the implementation of
its strategy will be achieved on the basis of:
• market positions and acquisitions;
• research, and
• cooperation and scale advantages.
M a r k e t p o s i t i o n s a n d a c q u i s i t i o n s
Fugro’s policy is based primarily on rooting and, wherever
possible, expanding its existing strong market positions.
Complementing and broadening its package of closely
related services is a primary objective. Growth in other
sectors, by reacting positively and flexibly to
developments in new growth markets, is an equally
9
Brent Blend in percentage, scale left.
E&P spending in percentage, scale right.
important policy component. To broaden its base and
ensure continued sustainable growth Fugro generally
completes several acquisitions each year, usually to
strengthen or acquire good market positions or to obtain
valuable technologies. Because acquisitions always
involve a measure of risk, in general an extremely
thorough and extensive due diligence is carried out
before the decision to acquire a company is taken.
This limits the risks considerably. Acquisition evaluation
is based not only on financial criteria but also on:
• added-value for Fugro;
• cohesion with Fugro’s activities and culture;
• growth potential;
• a leading position in a niche market or region;
• technical and management qualities;
• risk profile.
R e s e a r c h
Research is of strategic importance for Fugro. The search
for ways to expand and improve its service to clients is
unceasing and cooperation with its clients plays an
important role in this. Many new ideas are generated
through joint development projects. Specific measuring
equipment and analytical models play an important role
in this. Each year Fugro invests an estimated minimum of
4% of turnover on research. Some of this investment takes
place during the execution of projects.
C o o p e r a t i o n a n d s c a l e a d v a n t a g e s
Effective cooperation between the various business
units and critical mass are key factors for the successful
execution of large assignments. Capacity utilisation
can be optimised by the exchange of equipment and
employees between the various activities and by
broadening staff training. Fugro stimulates cooperative
technological renewal, both within and outside the
Group, by clustering the available knowledge and
increasing its investment footprint. The integration
of information systems and the utilisation of scale
advantages enhance the service provided to clients.
10
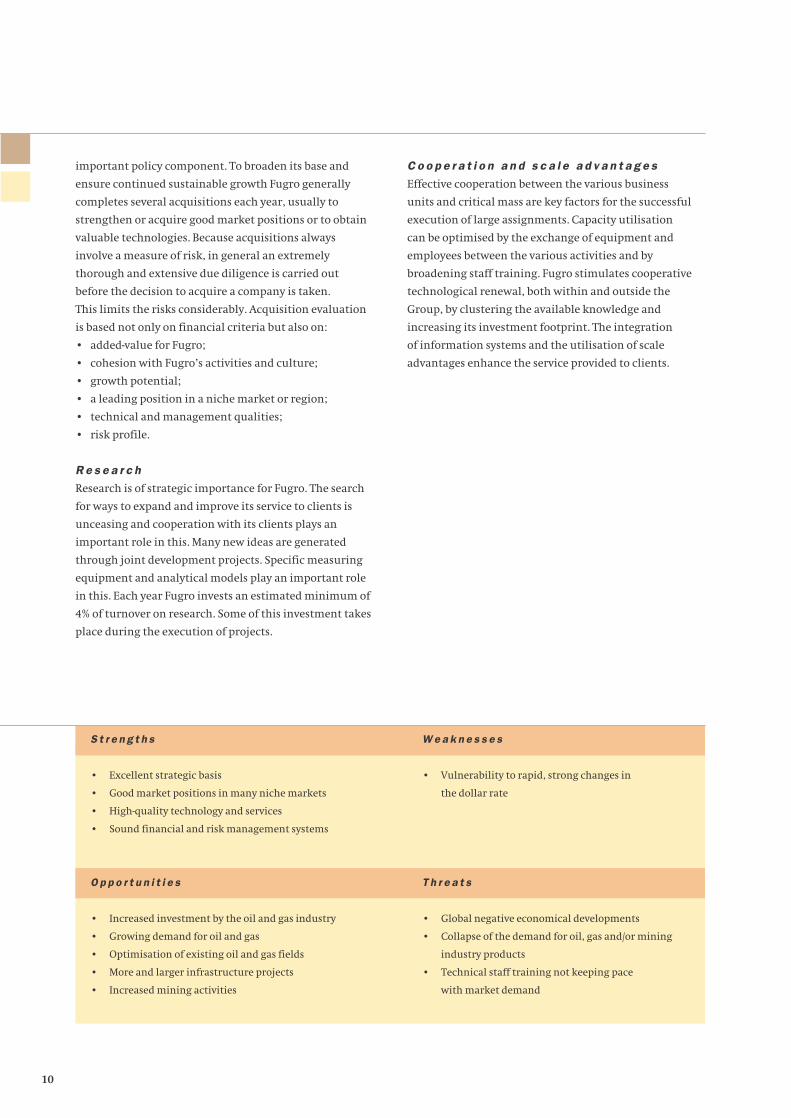
S t r e n g t h s
• Excellent strategic basis
• Good market positions in many niche markets
• High-quality technology and services
• Sound financial and risk management systems
W e a k n e s s e s
• Vulnerability to rapid, strong changes in
the dollar rate
O p p o r t u n i t i e s
• Increased investment by the oil and gas industry
• Growing demand for oil and gas
• Optimisation of existing oil and gas fields
• More and larger infrastructure projects
• Increased mining activities
T h r e a t s
• Global negative economical developments
• Collapse of the demand for oil, gas and/or mining
industry products
• Technical staff training not keeping pace
with market demand

O u r p l a n e t contains many natural resources, such as water, minerals, oil and gas.
Efficient exploration of these resources starts with identification of their possible locations.
Fugro supports this exploration by collecting and interpreting information about the earth’s
surface, seabed and subsurface. In oil and gas, Fugro provides this global industry with
specialist services at every phase of an oil or gas field’s life-cycle: from exploration and
development to the production and transportation of oil and gas. Fugro is also involved when
an installation is removed.
O i l , g a s a n d c o a l are fossil fuels formed in the earth’s crust from the remains of
plants and animals that lived millions of years ago. Oil, produced primarily from the remains
of tiny organisms (plankton) that lived in warm seas, is a liquid and seeps through the rocks
until it collects under an impermeable layer in a subterranean reservoir. Natural gas is formed
in the same way as oil and is also found in such reservoirs. This means that when searching for
oil as gas the focus is on locating areas with source rock and where the structure of the earth’s
crust indicates that oil or gas could have collected.
L a r g e o i l a n d g a s r e s e r v e s have been found all over the world. Sometimes they
are far from the users’ markets in inhospitable areas: in the polar regions, Alaska for example,
tropical rain forests in Nigeria and Indonesia, or under stormy seas, such as the North Sea.
The exploration for and sustainable production of oil and gas and its transportation, via
pipelines or vessels, are expensive but very important for human welfare. Today, natural gas
meets around a quarter of the world’s energy requirements and its importance is growing.
Natural gas is a clean fuel and can be piped to end users in a very simple way.
R e s e a r c h i n t o t h e h i s t o r y of tectonic plates (continental drift), and the ancient
earth’s flora and climate conditions has given us a good idea of the places where oil and gas
may be found. Fugro has advanced analysis techniques to assist in this. Drilling, laboratory
research and airborne and seismic surveys help towards defining the geological structure.
This increases the chance of success in locating extractable quantities of oil and gas.
T h e e n o r m o u s i n v e s t m e n t s that go hand-in-hand with the exploration for and
development of viable new fields means efficient exploitation of oil and gas is extremely
important. It was the shallow, easy to find onshore fields that were developed first; on the
shores of the Caspian Sea, in the USA (Pennsylvania, Oklahoma, California, Texas, et cetera)
and throughout the Middle and Far East. Subsequently, oil and gas were discovered offshore
continental shelf areas around the world. The steep global rise in the demand for energy and
the depletion of existing fields mean, however, that the oil and gas fields in areas that are
more difficult to explore and develop, particularly those in deep water, are becoming
economically interesting. This is now possible thanks to the dramatic improvements in the
technologies needed to map these fields and make their exploitation both economically viable
and sustainable.
F U G R O : a c t i v e t h r o u g h o u t t h e l i f e c y c l e
o f a n o i l o r g a s f i e l d
11

I N T R O D U C T I O N
F u g r o i s i n v o l v e d i n v i r t u a l l y t h e e n t i r e l i f e c y c l e o f o i l a n d
g a s f i e l d s . I t s t a r t s w i t h r e s e a r c h i n t o t h e f o r m a t i o n o f t h e
c o n t i n e n t s a n d s e a s o f o u r p l a n e t a n d c l i m a t e s t u d i e s t o
s e e k o u t c o n d i t i o n s w h i c h f a c i l i t a t e t h e d e v e l o p m e n t o f o i l
a n d g a s . I n a n e x t s t a g e F u g r o i s i n v o l v e d w i t h a c t i v i t i e s
r e l a t e d t o o i l a n d g a s f i e l d e x p l o r a t i o n a n d d e v e l o p m e n t a s
w e l l a s p r o d u c t i o n a n d t r a n s p o r t a t i o n . T h e b r o a d s p e c t r u m
o f c l i e n t s i n t h e o i l a n d g a s s e c t o r f o r w h i c h F u g r o c a r r i e s
o u t t h e s e a c t i v i t i e s i n c l u d e s t h e o i l c o m p a n i e s , b u t a l s o
t h e c o n s t r u c t i o n c o m p a n i e s t h a t d e s i g n , b u i l d a n d i n s t a l l
t h e s t r u c t u r e s .
There are many thousands of oil and gas
structures sited in seas and oceans all over
the globe. There are over 8,000 in the Gulf of
Mexico alone. Fugro is involved at various
stages of the development of many oil and
gas fields.
The study of plate tectonics
and the climate in the distant
past is of considerable
assistance when it comes to
searching for new oil and gas
fields now and in the future.

Renewables
Nuclear
Coal
HISTORY
World marketed energy use by fuel type
PROJECTIONS
Gas
Oil
Qud
rilli
on B
TU
0
50
100
150
200
250
202520152002199019801970
Extracting oil and gas in deeper and deeper water increases the complexity
of the installations because additional underwater connections have to be
made between the wells, pipelines and floating platforms.
Fugro checks the
placement and connection
of underwater
installations using ROVs
(un-manned submersibles)
equipped with
underwater cameras.
Although alternative energy sources can eventually
replace oil and gas, for many years ahead oil and gas
will remain the primary energy source.
The development of gas is of major importance because
in the medium term it can provide relatively clean
energy and in the longer term it could serve as basis for
the production of hydrogen gas.
©N
SW
Source: Energy Information Administration

14
From left to right:
F.J.G.M. Cremers, J.A. Colligan, P. Winsemius, F.H. Schreve (Chairman),
P.J. Crawford, Th. Smith.
S u p e r v i s o r y B o a r d
S u p e r v i s o r y B o a r d
Supervisory Board members do not hold any
position that could adversely affect their
independence.
During the year under review no Supervisory
Board member held shares, depository receipts of
shares or options on shares or depository receipts
of shares in Fugro. A profile of the Supervisory
Board is published on Fugro’s website.
name J.A. Colligan (1942) 1)
nationality British
first appointed 2003
current term up to May 2007
expertise management strategy and risks inherent to the
company’s business; management selection;
management recommendation and development; oil
and gas industry
other functions former Director of Shell Exploration & Production,
Director Society of Petroleum Engineers Foundation
name Th. Smith (1942) 1)
nationality American
first appointed 2002
current term up to May 2006
expertise management strategy and risks inherent to the
company’s business; management selection; manage-
ment recommendation and development; innovation
and technology development, oil and gas industry
other functions Chairman of the Board of Smith Global Services L.P.,
member of the University of Houston Board of Regents
and University of Houston College of Business Dean’s
Executive Advisory Board and Director of Houston
Area Research
name P. Winsemius (1942) 2)
nationality Dutch
first appointed 2000
current term up to May 2008
expertise management strategy and risks inherent to the
company’s business; innovation and technology
development
other functions former Minister of Housing, Physical Planning and
Environment, former partner of McKinsey & Company,
member of the Netherlands Scientific Council for
Government Policy, professor management of
sustainable development, University of Tilburg
(the Netherlands), chairman of the Supervisory Board
of Kempen & Co
Secretary to the Supervisory Board
Ms. J.M.E. Feije (1964)
name F.H. Schreve (1942) 1)
function Chairman
nationality Dutch
first appointed 1983
current term up to May 2006
expertise management strategy and risks inherent to the
company’s business; management selection;
management recommendation and development;
compliance; shareholders’ and employees’ relations
other functions Supervisory Board member of OPG N.V., as well as several
other companies; also various management functions
name P.J. Crawford (1951) 2)
nationality British
first appointed 1997
current term up to May 2009
expertise internal risk management and control systems;
information and communication technology;
innovation and technology development
other functions Supervisory Board member of Crimsonwing Ltd.
(chairman), and Avanti Capital plc. (chairman)
name F.J.G.M. Cremers (1952) 2)
nationality Dutch
first appointed 2005
current term up to May 2009
expertise financial administration and accounting; internal risk
management and control systems; compliance; oil and
gas industry; shareholders’ and employees’ relations
other functions former CFO and member of the Board of Management of
VNU N.V. from 1997 until the end of 2004. Prior to that,
21 years with Royal Dutch/Shell Group in different
management positions in several countries, member of
the Supervisory Board of N.V. Nederlandse Spoorwegen
(Dutch Railways), Vopak N.V. and Rodamco Europe N.V.,
member of the committee ‘Kapitaalmarkt’ of the Dutch
financial authority AFM.
1) Member of Remuneration and Nomination Committee2) Member of Audit Committee

15
Fugro can look back on a good year. Turnover and net
result rose to record levels. The further strengthening of
its global position meant 2005 was a successful year for
Fugro in other respects as well.
This was partly a consequence of the consistent
application of its strategy on a financial, organisational
and professional skills basis. This also forms a firm
foundation for good results in the future. Current market
conditions would appear to contribute towards this
positive long-term view.
A n n u a l a c c o u n t s a n d d i v i d e n d p r o p o s a l
This Annual Report includes the 2005 Annual Accounts,
which are accompanied by an unqualified auditors’
report. We propose that the shareholders adopt the 2005
Annual Accounts and discharge the Board of Management
for its management and the Supervisory Board for its
supervision.
As far as profit appropriation is concerned, we endorse
the Board of Management’s proposal, stated on page 26,
to increase the dividend to EUR 0.60 per ordinary
(certificate of) share (2004 converted: EUR 0.48). This
dividend comprises either a cash payment or a settlement
in (certificates of) ordinary shares, whichever the
shareholder prefers.
C o m p o s i t i o n a n d p r o f i l e o f
t h e S u p e r v i s o r y B o a r d
Since 1987, Fugro’s international character has been
clearly reflected in the composition of the Supervisory
Board. Three nationalities are represented: Dutch (3x),
British (2x) and American (1x). Information on each
member of the Supervisory Board is included on page 14
of this Annual Report. The profile of the Supervisory
Board describes the range of expertise that should be
represented in our Board. This relates to strategy, finance,
financial control, information technology, management
and organisation, HRM and social policy, marketing,
innovation and technology development and the oil and
gas industry. All six Supervisory Board members are
independent persons in the sense of the Dutch Corporate
Governance Code.
In our opinion the Supervisory Board meets the stipulated
requirements and we deem the composition to be
suitable. To remain up-to-date with new developments,
in 2005 the entire Supervisory Board devoted an
afternoon and evening to the study of the Corporate
Governance Code and the latest insights in this field.
An extensive visit to one or more Fugro companies is also
an annual activity. During the year under review the
operating companies in Australia and the Netherlands
were visited. Mr. Cremers, who joined the Supervisory
Board in 2005, followed an introduction programme.
P l e n a r y a c t i v i t i e s
In the year under review the entire Supervisory Board met
five times with the Board of Management. All meetings
were almost always attended by the entire Supervisory
Board. For the most part, these meetings were also
attended by the other members of the Executive
Committee. Two meetings were combined with visits to
various operating companies.
The major issues discussed during the meetings were
the financial results, the overall strategy, the strategies
of the different business units and the reports of each
committee. Intended acquisitions and disposals and
developments in the oil and gas and mining industries
were also discussed. Regular items on the agenda were
Health, Safety & Environment (HSE), major investments,
the filling of various senior management positions, ICT
and the risks inherent to the Company’s activities as well
as the Board’s opinion regarding the set-up and
functioning of the risk management and control systems.
Meetings between Board members took place on several
occasions. The functioning of the Board of Management,
the Supervisory Board and the individual Board members
was discussed in the absence of the Board of Management.
The findings of the external auditor during audits were
discussed with the external auditor.
Individual Supervisory Board members were in contact
with the Board of Management on a number of occasions.
The Chairman of the Supervisory Board in particular was
in frequent contact with the Chairman of the Board of
Management, but other Supervisory Board members
also had bilateral contact with individual members of
the Board of Management and the Executive Committee.
R e p o r t o f t h e S u p e r v i s o r y B o a r d

A u d i t C o m m i t t e e
The members of the Audit Committee are
Mr. F.J.G.M. Cremers (Chairman), Mr. P.J. Crawford and
Mr. P. Winsemius. Collectively these members possess the
required experience and financial expertise to supervise
the Company’s financial activities, annual accounts and
risk profile. The Audit Committee met three times during
2005 and a meeting that had been postponed took place
in January 2006. The external auditor attended these
meetings. During the relevant meetings the annual
accounts and half-yearly accounts were discussed. Topics
such as taxation, claims and disputes were discussed in
depth. Risk areas, such as hedging, fluctuations in foreign
currency exchange rates and insurance were also
discussed as were the functioning of the internal and
external control mechanisms and the internal audit
group’s working plan. The Audit Committee was
informed of important findings from the control visits.
During every meeting the external auditor was given the
opportunity to discuss issues with members of the Audit
Committee in the absence of Fugro staff.
R e m u n e r a t i o n a n d
N o m i n a t i o n C o m m i t t e e
The General Meeting of Shareholders of 19 May 2005
approved the proposal to amalgamate the Remuneration
Committee and the Nomination Committee.
The combined committee (henceforth the Remuneration
& Nomination Committee) met twice and the previously
separate Committees each met once. The members of
the Remuneration & Nomination Committee are
Mr. F.H. Schreve (Chairman), Mr. J.A.Colligan and
Mr. Th. Smith.
In the area of remuneration, the topics discussed
included the remuneration of the individual Directors
and the share option scheme. The remuneration of the
individual Board of Management members recommended
by the Remuneration Committee was approved by the
Supervisory Board, within the remuneration policy
approved by the Annual General Meeting of Shareholders
on 19 May 2004. This remuneration policy has been
published on the website www.fugro.com. For a summary
of the remuneration of the individual members of the
Board of Management, please see pages 113 and 114 of the
Annual Accounts. The remuneration report can also
be viewed on the website.
The main lines of Fugro’s remuneration policy are as
follows:
a) a fixed salary component. An external study carried out
in 2004 concluded that this component was not in-line
with comparable companies. It was decided to make
further inroads into the shortfall in 2005.
b) a variable component. This is determined annually and,
in 2005, amounted to a maximum of 58% of the fixed
salary. The variable component is determined on the
basis of three criteria:
1) the profitability of the Company over the financial
year;
2) strategic developments in the financial year;
3) the achievement of individual targets.
c) a long-term component (option scheme). Fugro has had an
option scheme for many years. An overview of the
option scheme is included in the Annual Accounts.
d) secondary employment benefits, including the pension
scheme. The secondary employment benefits conform
to the market. The pension agreement structure is
based on an available premium system.
Other topics discussed were the functioning of individual
members of the Board of Management, the transfer of
Mr. G-J. Kramer’s tasks to his successor Mr. K.S. Wester,
and the preparations for the Supervisory Board’s
nomination of members of the Board of Management.
The Supervisory Board’s proposals for appointments to
the Board of Management are presented to the Annual
General Meeting of Shareholders, which decides on
the appointments.
A p p o i n t m e n t s
Board of Management
First of all, a very special word of thanks to Mr. G-J. Kramer
who stepped down as President and Chief Executive
Officer on 1 October 2005 and retired on 31 December
2005. Mr. Kramer led the Board of Management for
23 years. Throughout these years he successfully and
energetically managed and steered the healthy growth
that enabled the Company to acquire a leading global
position. Considerable attention was paid to Mr. Kramer’s
retirement both within the company and amongst
external contacts.
Mr. Kramer’s successor, Mr. K.S. Wester, joined Fugro in
1981 and has been a member of the Board of Management
since 1996. We are convinced that he will be able to
extend Fugro’s firm foundations.
16

To supplement the Board of Management the Supervisory
Board will propose to the Annual General Meeting on
10 May 2006 that Messrs. P. van Riel and A. Steenbakker
be appointed as members of the Board of Management.
With these appointments expertise in both the oil and
gas industry and the construction industry will be well
represented within the Board of Management.
Mr. van Riel is a Dutch national. He founded Jason
Geosystems and has worked for Jason Geosystems since
1986. Jason was acquired by Fugro in 2001. In March 2004
Mr. van Riel was appointed a member of the Executive
Committee and COO (Chief Operating Officer) of the
Geoscience Services division’s Development & Production
activities, which include the offshore seismic survey
activities.
Mr. Steenbakker is a Dutch national. He joined Fugro in
September 2005 as COO of the Geotechnical Services
onshore activities and as a member of the Executive
Committee. Prior to joining Fugro Mr. Steenbakker
worked for Fluor where, since 1983 he filled various
international management positions within the oil and
gas division. In his last position with Fluor he was, as
Senior Vice-president, responsible for the oil and gas
division in Europe, Africa and the Middle East, strategy
development and the implementation of Fluor’s
international maintenance services.
Further details concerning Messrs. Van Riel and
Steenbakker will be presented under the relevant agenda
item. If approved by the Annual General Meeting of
Shareholders on 10 May 2006 the Board of Management
of Fugro N.V. will comprise, as of that date:
K.S. Wester, President and Chief Executive Officer
A. Jonkman, Chief Financial Officer
P. van Riel, Director
A. Steenbakker, Director
Supervisory Board
On 19 May 2005 Mr. F.J.G.M. Cremers was appointed as a
new member of the Supervisory Board for a term of four
years. On the same date Mr. P.J. Crawford was reappointed
for a new term of four years. The Supervisory Board will
propose to the shareholders that Messrs. F.H. Schreve and
Th. Smith, who will step down on 10 May 2006 in
accordance with the roster, be reappointed.
The proposal to appoint Mr. Schreve, whose first
appointment was in 1983 when Fugro was not a listed
company, constitutes a deviation from best practice
stipulation III.3.5 of the Corporate Governance Code
because he will have served as a member of the
Supervisory Board for longer than 12 years. However,
the Supervisory Board attaches great importance to the
reappointment of Mr. Schreve, amongst others in view of
the supervision by the Supervisory Board of the changes
in composition of the Board of Management. This requires
continuity from the Supervisory Board and continuity of
its composition. Reappointment of Mr. Schreve would
safeguard this, the more given his tenure and knowledge
of the company and his experience in this field.
Futhermore the Supervisory Board will propose to the
Annual General Meeting of Shareholders on 10 May 2006
that Mr G-J. Kramer is appointed a member of the
Supervisory Board. Mr Kramer can not be considered to be
an independent member of the Supervisory Board within
the sense of the Corporate Governance Code. However,
the Supervisory Board as such complies with the
requirement of independence, since all other members
are deemed to be independent.
The data of Messrs. Schreve, Smith and Kramer will be
presented to the Annual General Meeting of Shareholders
under the relevant agenda item.
I n c o n c l u s i o n
We would like to express our appreciation to the Board of
Management, the Executive Committee, the international
professional staff and all Fugro’s employees for
everything they achieved in 2005. Without their efforts
Fugro would not have reached the leading market
position it occupies today. The year 2005 was
exceptionally satisfying in many respects. From a long-
term perspective Fugro is in an excellent position for
sustained growth. The transparent strategy and good
management structure will continue to serve the
interests of all Fugro’s stakeholders.
Leidschendam, 9 March 2006
F.H. Schreve, Chairman
J.A. Colligan
P.J. Crawford
F.J.G.M. Cremers
Th. Smith
P. Winsemius
17

E X P L O R AT I O N
B a s e d o n g e o l o g i c a l s t u d i e s F u g r o u s e s
t e c h n o l o g i e s t h a t i n c l u d e m a r i n e s e i s m i c
t o s e a r c h f o r o i l a n d g a s r e s e r v o i r s u n d e r
t h e s e a b e d . T h e s e l o c a t i o n s a r e t h e r e f o r e
i n v e s t i g a t e d b y a m o n g s t o t h e r s s e i s m i c
s u r v e y s . T e s t d r i l l i n g i s e x t r e m e l y e x p e n s i v e .
S o i t i s i m p o r t a n t t h a t a p r e l i m i n a r y s t u d y
m a p s t h e f i e l d a s a c c u r a t e l y a s p o s s i b l e
b e f o r e t e s t b o r e s a r e d r i l l e d t o a s c e r t a i n
h o w m u c h o i l o r g a s i s p r e s e n t .
Offshore seismic surveys enable
Fugro to map the subsurface with
high accuracy. Such a survey is
carried out by towing cables fitted
with sensors behind a vessel.
Sound waves, generated by a source
just behind the vessel, provide
information regarding the structure
of the subsurface, which is
schematically represented on this
page.

Fugro’s experts can, with the help of
geological information and seismic
surveys, assess which geological
formations are conducive to holding
oil and gas.
Offshore seismic surveys are
carried out using cables up to
twelve kilometres long that are
fitted with sensors and towed behind
a vessel. The cables are deployed from
the quarter-deck of the vessel.
Increasingly Fugro is using low above land
flying aircrafts when searching for oil and gas.
These are fitted with sensors that detect changes
in the magnetic and gravity fields due to the
rocks below. As with a seismic survey the
information collected about the
subsurface is used to map the
earth’s structure.
E x p l o r a t i o n – A p p r a i s a l – D e v e l o p m e n t
Gas
Seal
Oil
Source rock
Reservoir rock
20
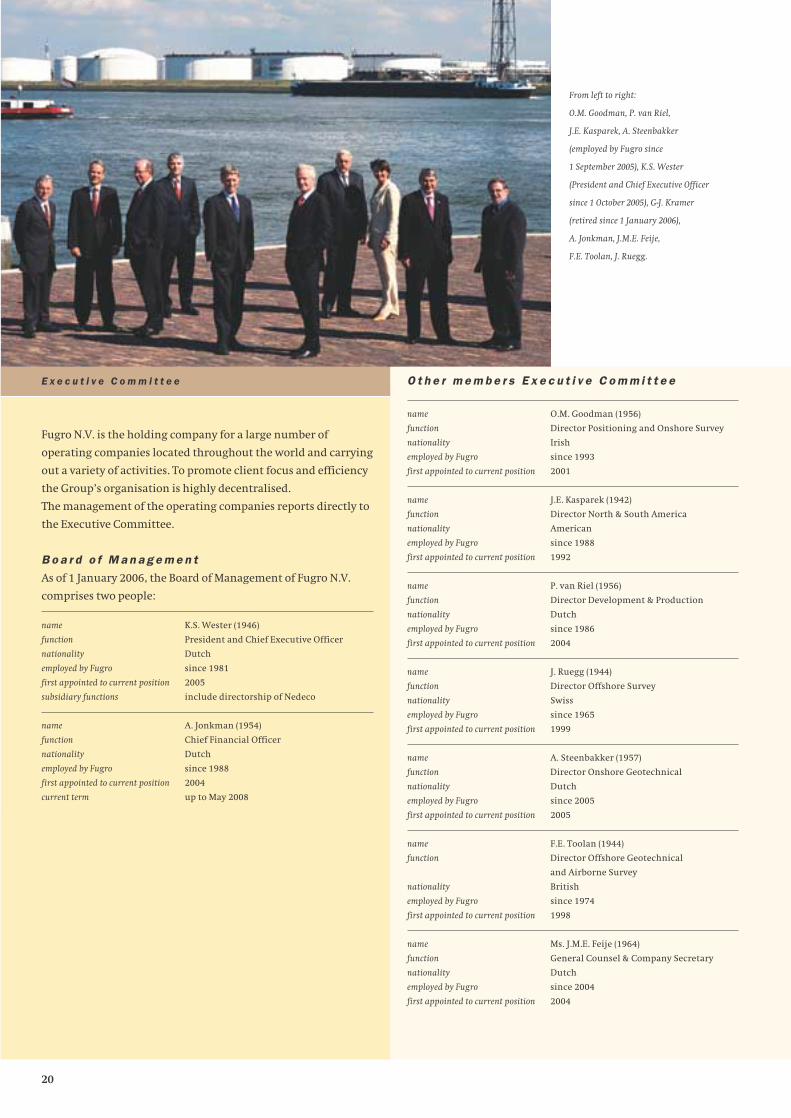
From left to right:
O.M. Goodman, P. van Riel,
J.E. Kasparek, A. Steenbakker
(employed by Fugro since
1 September 2005), K.S. Wester
(President and Chief Executive Officer
since 1 October 2005), G-J. Kramer
(retired since 1 January 2006),
A. Jonkman, J.M.E. Feije,
F.E. Toolan, J. Ruegg.
E x e c u t i v e C o m m i t t e e
Fugro N.V. is the holding company for a large number of
operating companies located throughout the world and carrying
out a variety of activities. To promote client focus and efficiency
the Group’s organisation is highly decentralised.
The management of the operating companies reports directly to
the Executive Committee.
B o a r d o f M a n a g e m e n t
As of 1 January 2006, the Board of Management of Fugro N.V.
comprises two people:
name K.S. Wester (1946)
function President and Chief Executive Officer
nationality Dutch
employed by Fugro since 1981
first appointed to current position 2005
subsidiary functions include directorship of Nedeco
name A. Jonkman (1954)
function Chief Financial Officer
nationality Dutch
employed by Fugro since 1988
first appointed to current position 2004
current term up to May 2008
O t h e r m e m b e r s E x e c u t i v e C o m m i t t e e
name O.M. Goodman (1956)
function Director Positioning and Onshore Survey
nationality Irish
employed by Fugro since 1993
first appointed to current position 2001
name J.E. Kasparek (1942)
function Director North & South America
nationality American
employed by Fugro since 1988
first appointed to current position 1992
name P. van Riel (1956)
function Director Development & Production
nationality Dutch
employed by Fugro since 1986
first appointed to current position 2004
name J. Ruegg (1944)
function Director Offshore Survey
nationality Swiss
employed by Fugro since 1965
first appointed to current position 1999
name A. Steenbakker (1957)
function Director Onshore Geotechnical
nationality Dutch
employed by Fugro since 2005
first appointed to current position 2005
name F.E. Toolan (1944)
function Director Offshore Geotechnical
and Airborne Survey
nationality British
employed by Fugro since 1974
first appointed to current position 1998
name Ms. J.M.E. Feije (1964)
function General Counsel & Company Secretary
nationality Dutch
employed by Fugro since 2004
first appointed to current position 2004
(Result x EUR 1 mln.)
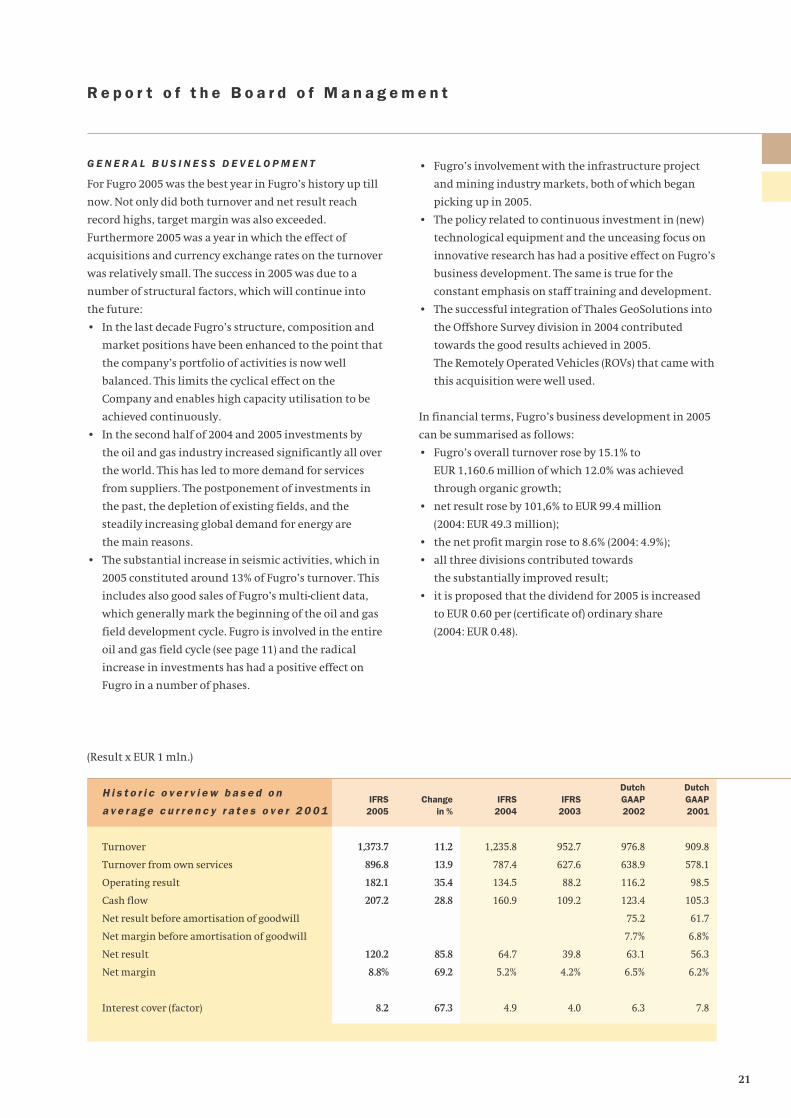
H i s t o r i c o v e r v i e w b a s e d o n
a v e r a g e c u r r e n c y r a t e s o v e r 2 0 0 1
Turnover
Turnover from own services
Operating result
Cash flow
Net result before amortisation of goodwill
Net margin before amortisation of goodwill
Net result
Net margin
Interest cover (factor)
Change in %
11.2
13.9
35.4
28.8
85.8
69.2
67.3
IFRS2004
1,235.8
787.4
134.5
160.9
64.7
5.2%
4.9
IFRS2003
952.7
627.6
88.2
109.2
39.8
4.2%
4.0
DutchGAAP2002
976.8
638.9
116.2
123.4
75.2
7.7%
63.1
6.5%
6.3
DutchGAAP2001
909.8
578.1
98.5
105.3
61.7
6.8%
56.3
6.2%
7.8
G E N E R A L B U S I N E S S D E V E L O P M E N T
For Fugro 2005 was the best year in Fugro’s history up till
now. Not only did both turnover and net result reach
record highs, target margin was also exceeded.
Furthermore 2005 was a year in which the effect of
acquisitions and currency exchange rates on the turnover
was relatively small. The success in 2005 was due to a
number of structural factors, which will continue into
the future:
• In the last decade Fugro’s structure, composition and
market positions have been enhanced to the point that
the company’s portfolio of activities is now well
balanced. This limits the cyclical effect on the
Company and enables high capacity utilisation to be
achieved continuously.
• In the second half of 2004 and 2005 investments by
the oil and gas industry increased significantly all over
the world. This has led to more demand for services
from suppliers. The postponement of investments in
the past, the depletion of existing fields, and the
steadily increasing global demand for energy are
the main reasons.
• The substantial increase in seismic activities, which in
2005 constituted around 13% of Fugro’s turnover. This
includes also good sales of Fugro’s multi-client data,
which generally mark the beginning of the oil and gas
field development cycle. Fugro is involved in the entire
oil and gas field cycle (see page 11) and the radical
increase in investments has had a positive effect on
Fugro in a number of phases.
• Fugro’s involvement with the infrastructure project
and mining industry markets, both of which began
picking up in 2005.
• The policy related to continuous investment in (new)
technological equipment and the unceasing focus on
innovative research has had a positive effect on Fugro’s
business development. The same is true for the
constant emphasis on staff training and development.
• The successful integration of Thales GeoSolutions into
the Offshore Survey division in 2004 contributed
towards the good results achieved in 2005.
The Remotely Operated Vehicles (ROVs) that came with
this acquisition were well used.
In financial terms, Fugro’s business development in 2005
can be summarised as follows:
• Fugro’s overall turnover rose by 15.1% to
EUR 1,160.6 million of which 12.0% was achieved
through organic growth;
• net result rose by 101,6% to EUR 99.4 million
(2004: EUR 49.3 million);
• the net profit margin rose to 8.6% (2004: 4.9%);
• all three divisions contributed towards
the substantially improved result;
• it is proposed that the dividend for 2005 is increased
to EUR 0.60 per (certificate of) ordinary share
(2004: EUR 0.48).
R e p o r t o f t h e B o a r d o f M a n a g e m e n t
21
IFRS2005
1,373.7
896.8
182.1
207.2
120.2
8.8%
8.2

During the year under review Fugro completed several
smaller but strategically important acquisitions:
• the acquisition of the business activities of BTW
Hydrographic in New Zealand, this comany provides
survey services to the oil and gas industry;
• the acquisition of a 100% interest in Comprehensive
Geotechnical Investigation in Zhejiang, China.
This company is licensed to carry out onshore
geotechnical activities throughout China;
• the acquisition of Elcome Surveys in Mumbai, India,
a major supplier of survey, geotechnical and
oceanographic services in India and the Middle East.
In addition, the market position in California, the USA,
was strengthened by the acquisition of geotechnical
engineering bureau España Geotechnical Consulting
(EGC) based in Roseville, Sacramento Valley.
Furthermore Fugro acquired Beardall, Parry and
Associates in Wales. This company is specialised in the
evaluation of oil and gas prospects and fields.
The organisation was also reinforced through the
establishment of the new company Fugro-OceansatPEG in
Brazil. The company will carry out offshore survey,
positioning, oceanographic, metocean, ROV and diving
activities primarily for the oil and gas industry. Fugro
holds a 62% interest in this company.
The seismic market has undergone robust growth and
Fugro’s goal is to improve its already strong position in
the offshore seismic market and its global services
offering. For this purpose Fugro wants to operate with a
fleet of around eight vessels, some owned by Fugro, some
chartered. At the end of 2005 Fugro took the first steps
towards this with the signing of a long-term charter
agreement from May 2006 for the ‘Geo Atlantic’, as well
as a multi-year charter for the ‘Geo Celtic’ – a 3-D seismic
new-build vessel that will be launched in mid 2007.
At the beginning of 2006 a three-year charter agreement
was signed for the seismic vessel ‘Geo Barents’ that will be
launched in November 2006. Fugro will obtain ownership
in November 2009. This expansion brings about a further
modernisation of the fleet and means Fugro has six
seismic vessels at its disposal for a number of years.
In addition, to maintain flexibility on a project and/or
short-term basis, two or three additional vessels will be
chartered to bring the fleet of vessels working in the
seismic market up to around eight.
In 2005 several divestments of a limited size took place:
• the sale of the 40% interest in Chartco, in the UK, active
in the field of nautical information for shipping;
• the sale of the standard diving activities in Mexico;
• the sale of two laboratory activities in Wales, the UK
(including environmental analyses).
The turnover from these activities amounted to
EUR 15 million per annum. These activities do not fit in
Fugro’s strategy for the future.
For the figures related to these acquisitions and
divestments please see the annual accounts pages 83
through 85 and 96.
In 2005 Fugro was awarded and completed a number of
major assignments, including:
• a large project for Brass LNG in Nigeria. A geophysical
and geotechnical survey was carried out (both onshore
and in coastal waters) for LNG/LPG facilities;
• the measurement, using the FLI-MAP system, of
approximately 700 km of dams for the
Hoogheemraadschap (polder authority) Delfland;
• a marine geotechnical survey offshore Brazil.
The ‘Fugro Explorer’ was used to collect data on
the seabed soils in water depths of up to 2,100 metres
that the client will use for the design and construction
of platforms, underwater installations and pipelines;
• hydrographic and geophysical investigation of the
western Nile delta (Egypt) for BP Exploration using
Fugro’s newest AUV (Autonomous Underwater
Vehicle);
• a geophysical, geotechnical and environmental survey
in the United Arab Emirates for Fluor Mideast;
• the mapping, using FLI-MAP of the damage caused to
levees around New Orleans by hurricane Katrina.
Fugro is also active in assisting to repair the damage to
offshore constructions caused by the two hurricanes in
the USA.
22
DutchGAAP2001
309
392
209
910
1.13
Dutch GAAP2002
323
371
252
946
1.06
IFRS2003*
282
354
186
822
0.88
IFRS2004
273
470
265
1,008
0.81
IFRS2005
304
565
292
1,161
0.81
23
In the year under review Fugro also acquired orders that
will be carried out or started in 2006, including:
• a geophysical airborne survey of various regions in
the Republic of Ghana;
• a five-year contract from the National Oceanic and
Atmospheric Administration (NOAA-NOS), part of
the US Department of Commerce, for hydrographic
surveys and related services in USA waters;
• various three-dimensional (3D) seismic surveys along
the coast of Norway for the Norwegian oil company
Statoil;
• a three-dimensional seismic survey off the coast
of Morocco: the collection of data over around
2,200 square kilometres of sea-bed;
• an airborne geophysical survey of areas of Papua
New Guinea that was started in July 2005 and will
take four years to complete.
In January 2006, the new company Fugro-OceansatPEG
SA, which was set-up in 2005 and in which Fugro holds
a 62% interest, received an order (contract value
USD 25.4 million) from the Brazilian oil company
Petrobras for inspection services and the management of
construction activities in Brazilian waters. The contract
was signed for two years with an option of extension for a
further two years.
F I N A N C I A L D E V E L O P M E N T
To enable a proper comparison of information regarding
the Fugro shares, all the 2004 figures take into account
the share split (four for one) of 20 June 2005.
G e n e r a l / d o l l a r e x c h a n g e r a t e
The average dollar rate for 2005 was EUR 0.81 equal to
EUR 0.81 in 2004. Due to – amongst others – a rising trend
of the US dollar rate in the course of the year, a positive
exchange rate result was realised of approximately
EUR 4 million (2004: an exchange loss of EUR 5.5 million).
In addition, the balance sheet was influenced by the
dollar. The dollar rate at the end of 2005 was EUR 0.85
compared with EUR 0.73 at the end of 2004. This resulted
in Fugro’s (shareholders’) equity position being 17%
higher at the end of 2005.
(on 31 December, x EUR 1 mln.)
T u r n o v e r d i s t r i b u t i o n p e r d i v i s i o n
Geotechnical
Survey
Geoscience
Total
USD average
* The turnover of Fugro-TGS has been consolidated as from its acquisition date (19 November 2003).
The historical figures for offshore Survey and Development & Production have been recalculated in line with the structure
introduced in 2002.
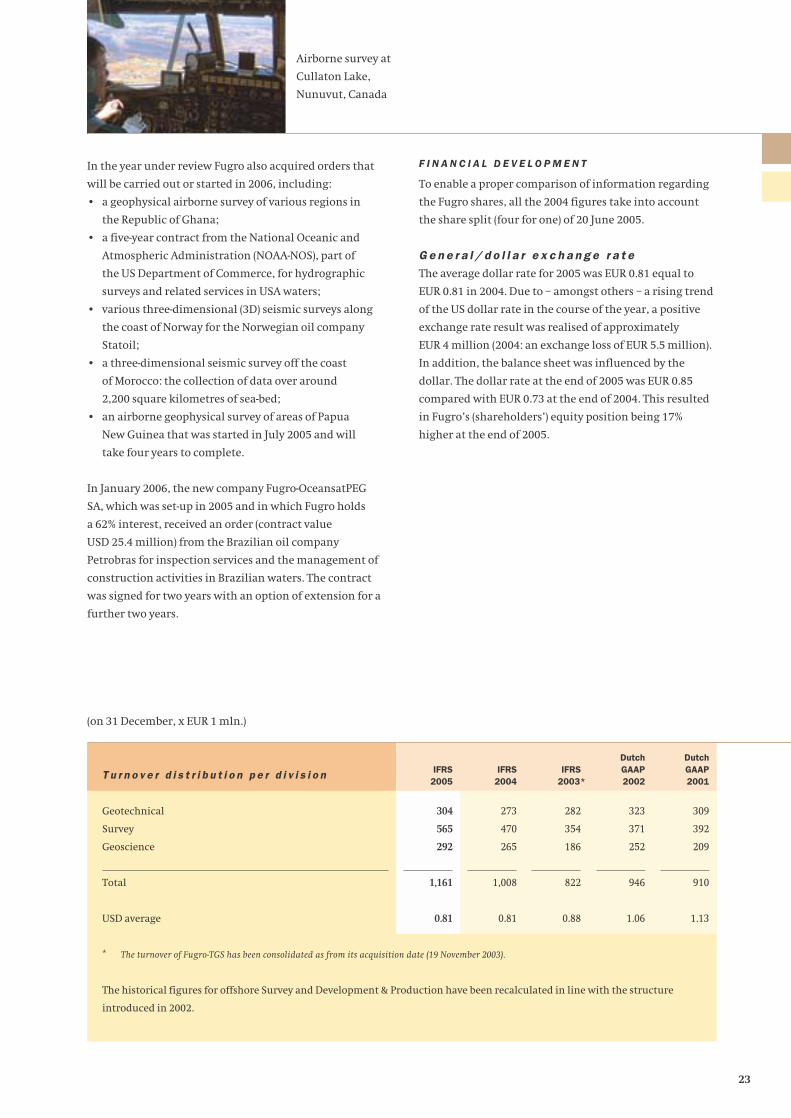
Airborne survey at
Cullaton Lake,
Nunuvut, Canada

T u r n o v e r d e v e l o p m e n t
In 2005 turnover rose by 15.1% to EUR 1,160.6 million,
compared with EUR 1,008.0 million in 2004. The increase
in turnover is depicted in the table below. This shows that
most of the turnover increase was achieved through
organic growth (12.0%).
C o s t s
As a result of the higher turnover there were also higher
costs.
The third party costs rose by 11.3% to EUR 405.7 million.
Personnel expenses rose by 9.0% to EUR 361.0 million.
Depreciation of tangible fixed assets rose by 5.0% to
EUR 69.4 million.
Other operating expenses rose by 22.5% to
EUR 184.7 million.
24
(on 31 December, x EUR 1 mln.)
G e o g r a p h i c a l d i s t r i b u t i o n o f t u r n o v e r *
The Netherlands
Europe other/Africa
Near and Middle East/Asia/Australia
North and South America
Total
* Based on the place of business of the subsidiary that executes the project.
** The turnover of Fugro-TGS has been consolidated as from its acquisition date (19 November 2003).
IFRS2005
100
489
234
338
1,161
IFRS2004
97
415
196
300
1,008
IFRS2003
102
327
167
226
822
DutchGAAP2002
136
326
206
278
946
DutchGAAP2001
125
305
207
273
910
(in percentages)
T u r n o v e r g r o w t h
2005 (IFRS)
2004 (IFRS)
2003 (IFRS)
2002
2001
2000
1999
1998
1997
1996
Average (1996 – 2005)
Total
15.1
22.6
(13.1)
4.0
27.6
30.4
(5.4)
20.0
28.0
27.0
15.6
Exchangerate
differences
2.8
(2.7)
(9.4)
(3.4)
0.6
10.6
2.9
(1.7)
10.9
4.0
1.5
Divest-ments
(1.1)
(0.6)
(0.6)
(7.4)
(1.0)
Acquisi-tions
1.4
16.2
4.9
4.0
8.6
8.9
1.8
3.2
6.0
3.0
5.8
Organic
12.0
9.7
(8.6)
3.4
18.4
10.9
(9.5)
18.5
18.5
20.0
9.3
**

25
N e t f i n a n c i n g c o s t a n d t a x e s
Net interest amounted to EUR 16.2 million (2004:
EUR 31.8 million). A new convertible bond loan of
EUR 125 million with an interest rate of 2.375% had a
positive influence on the net interest – the subordinated
convertible debenture bond of EUR 100 million redeemed
in 2005 carried an interest rate of 4.75%. In addition, less
use was made of the existing credit lines. Rate of
exchange differences are included in net financing costs
(2005: profit EUR 4 million, 2004: loss EUR 5.5 million).
Tax charges on the profit before tax decreased to 20.9%
(2004: 27.5%).
The effective tax rate is somewhat lower than originally
expected at the transition to IFRS.
This is the result of further efficiency in the company tax
and financing structure as well as the possibility to use
the non-recognised tax losses in a number of countries
due to the better results in these countries.
Considering the available non-recognised tax losses, the
effective tax charge is expected to stay at the same level
for the next few years to come.
N e t r e s u l t
The net result rose by 101.6% to EUR 99.4 million (2004:
EUR 49.3 million), after deducting third party interests
in the profits of subsidiary companies. This amounts to
EUR 1.51 per share (2004: EUR 0.83). Translation
differences improved the net result by circa EUR 3
million.
There were no impairments (extraordinary devaluations)
of assets in 2005.
M a r g i n d e v e l o p m e n t
The net profit margin rose to 8.6% (2004: 4.9%).
O p e r a t i n g r e s u l t
At EUR 144.1 million the operating result was 38.2%
higher than in 2004 (EUR 104.2 million).
C a s h f l o w a n d i n v e s t m e n t s
In 2005 the total cash flow from operations amounted
to EUR 176.1 million (2004: EUR 125.8 million).
This equates to EUR 2.67 per share (2004: EUR 2.12).
Investments in tangible fixed assets (including
acquisitions) against this cash flow amounted to
EUR 90.4 million (2004: EUR 71.0 million).
O u t s t a n d i n g r e c e i v a b l e s
The average number of days outstanding for receivables
was 68 days (2004: 67 days).
I n t a n g i b l e a s s e t s / g o o d w i l l
In 2005 the addition of intangible assets resulting from
acquisitions, or goodwill, amounted to EUR 8.3 million
(2004: EUR 22.9 million). The effect of exchange variance
amounted to EUR 6.5 million. Goodwill comprises the
amount paid over and above the real value of the
identifiable assets and liabilities and adjustment to
Fugro’s principles of valuation. At the end of 2005 the
book value of goodwill was EUR 289.2 million (2004:
EUR 274.4 million). Goodwill is not amortised but is
checked at least annually for impairments (extraordinary
devaluation).
0
30
60
90
120
150
200520042003200220010
25
50
75
100
125
20052004200320022001
(x EUR 1 mln.)
O p e r a t i n g r e s u l t *
(x EUR 1 mln.)
N e t r e s u l t *
FLI-MAP-project in
Schwandorf, Germany
* As of 2003 based on IFRS. * As of 2003 based on IFRS.

In 2005, as in previous years, Fugro invested in new
seismic survey data, which is presented on the balance
sheet as ‘Stocks’. Such a data library is typical of
companies that carry out this type of exploration surveys
and contains valuable information that is offered and
sold, under licence, to various interested parties and
which still could contain considerable profit potential.
Virtually no data acquired during or before 2003 is
included on the balance sheet.
The net book value amounts to EUR 48.8 million (2004:
EUR 39.7 million).
D I V I D E N D P R O P O S A L
It is proposed that the dividend for 2005 be increased to
EUR 0.60 per ordinary share (2004: EUR 0.48), and paid,
depending on the choice of the shareholder, either:
• in cash, or
• in (certificates of) ordinary shares.
The proposed dividend corresponds to a dividend
percentage of 40% of the net result.
Shareholders and certificate holders have until 26 May
2006 to indicate their dividend preference. The number of
(certificates of) ordinary shares that entitle the
shareholder to one new (certificate of) share will be
determined on 31 May 2006 based on the average share
price at the close of business on the stock exchange on 29,
30 and 31 May. To arrive at a whole number, a maximum
of 5% of the share price will be added or deducted.
The dividend will be made payable on 2 June 2006.
O R G A N I S A T I O N A N D P E R S O N N E L
O r g a n i s a t i o n a l s t r u c t u r e
Fugro is organised in three divisions: Geotechnical,
Survey and Geoscience. The Board of Management is
responsible for Group policy, strategy, acquisitions,
investments, risk management, financing and internal
coordination. The Holding Company also handles matters
which, for reasons of efficiency, (high-value)
specialisation or financing are best handled centrally.
Fugro’s philosophy is that the divisions’ operating
companies should be able to operate as autonomously as
possible within the framework of the Group’s policy,
business principles and internal risk management
systems. This enhances the quality of the operating
companies’ management. Delegation is firmly
interwoven into the Company’s culture. Where
appropriate for the client, cooperative links are forged
between or within the divisions. This results in synergy
26
B a l a n c e s h e e t r a t i o s
Solvency at the end of 2005 was 40.9% (end of 2004: 22.8%).
Shareholders’ equity, excluding the convertible bond,
amounted to EUR 465.5 million.
In March 2005, about 95% of the 4.75% convertible
subordinated bond of EUR 100 million taken out in 2000
was converted. The remainder was redeemed. As a result,
the number of issued shares rose by 9.5%. In April 2005 a
new convertible bond of EUR 125 million at 2.375% was
taken out. This loan has a term of five years and a
conversion price of EUR 24.25.
In April 2005 Fugro also arranged a five-year revolving
credit line of EUR 100 million at an interest rate of
Euribor plus 35 base points for the utilised portion.
At the end of 2005 the current ratio was 1.7 (end of 2004:
0.8). Working capital rose by EUR 317.8 million to
EUR 222.5 million (2004: EUR 95.3 million negative).
D e v e l o p -
m e n t o f
g o o d w i l l *
1987
1988
1989
1990
1991
1992
1993
1994
1995
1996
1997
1998
1999
2000
2001
2002 (IFRS)
2003 (IFRS)
2004 (IFRS)
2005 (IFRS)
Total
Goodwill(EURmln.)
0.3
0.5
0.1
0.7
17.1
14.1
2.9
40.3
5.2
3.0
18.1
16.9
35.3
37.4
242.8
3.2
68.2
22.9
8.3
537.3
* Up until 2000 goodwill was deducted directly from the
shareholders’ equity; the goodwill under IFRS has been
recalculated as of 31 December 2002.
Book valueas of
31 -12
0
0
0
0
0
0
0
0
0
0
0
0
0
0
237.9
190.9
253.1
274.4
289.2

27
developing naturally, particularly when complex and
integrated projects are involved, and increases
profitability. It also increases the creativity and
involvement of the organisation as a whole, as well as the
staff’s opportunities for professional challenges and self-
development.
P e r s o n n e l p o l i c y
Fugro’s personnel policy is aimed at attracting and
employing professional and skilled people and offering
them, on a continuous basis, opportunities for training.
The advice and services provided by Fugro must be state-
of-the-art and reliable. Fugro’s personnel policy is also
aimed at offering its staff opportunities to develop as far
as possible. Fugro’s goal is to be a good employer and one
which takes local customs into account. The very low
outflow of highly trained management and staff indicates
the Company’s success in this respect. Nevertheless, in
2005 the outflow was slightly higher than normal. Clients
were, and are, interested in our professional staff – a
scarce commodity in the labour market. This means that a
good internal career development policy is vital to retain,
and utilise to the full, good people and specific skills for
the organisation. The policy is aimed at developing staff
who are flexible and who are capable of rising to fill
management positions or to become technical specialists.
To foster the recruitment of new talent Fugro has built-up
good contacts with universities. Business and
management skills are becoming increasingly important.
Fugro supports talent development and management
development and this is reflected in the operating
companies’ training schemes. Fugro also has at its
disposal a worldwide pool of experienced freelance
professionals who are employed regularly on a project
basis.
Staff pension schemes and other such benefits are
maintained and take local customs and regulations into
account. In the Netherlands changes related to the
pension (average salary regulation) and medical
insurance schemes have been implemented. Absence due
to sickness is also monitored at the individual operating
company level. Fugro does not consider that including a
total picture of all the Human Resources policies within
the Group in the Annual Report would be constructive
due to the diversity in the many countries in which Fugro
operates.
Flexibility through exchangeability is an important
aspect of Fugro’s policy. To this end, the same systems are
used throughout the Group whenever possible and both
short and long-term staff exchange programmes have
been developed. Once again, during 2005 a number of
staff were asked to work in fields other than those for
which they were primarily employed. This policy
contributed towards maintaining a high level of capacity
utilisation and allowed (valuable) employees to be
retained.
In view of the favourable market conditions and
prospects, the number of employees was increased by
919 to 8,534 during the year (2004: 7,615). Approximately
Cone Penetration Test for
the foundation of a bridge
near Roßla, Germany.
P e r s o n n e l d a t a
Average number of employees during the year
Turnover per employee (x EUR 1, 000)
Turnover own services per employee (x EUR 1, 000)
Geographical distribution at year-end
The Netherlands
Europa other/Africa
Middle East/Asia/Australia
North and South America
Total at year-end
Dutch GAAP2001
6,523
139.5
88.6
1,164
1,999
2,132
1,658
6,953
Dutch GAAP2002
7,003
135.1
88.2
1,121
2,002
2,137
1,663
6,923
IFRS2003
7,160
114.9
76.7
993
2,707
2,439
2,333
8,472
IFRS2004
7,864
128.2
81.8
890
2,232
2,225
2,268
7,615
IFRS2005
8,121
142.9
93.0
839
2,457
2,594
2,644
8,534
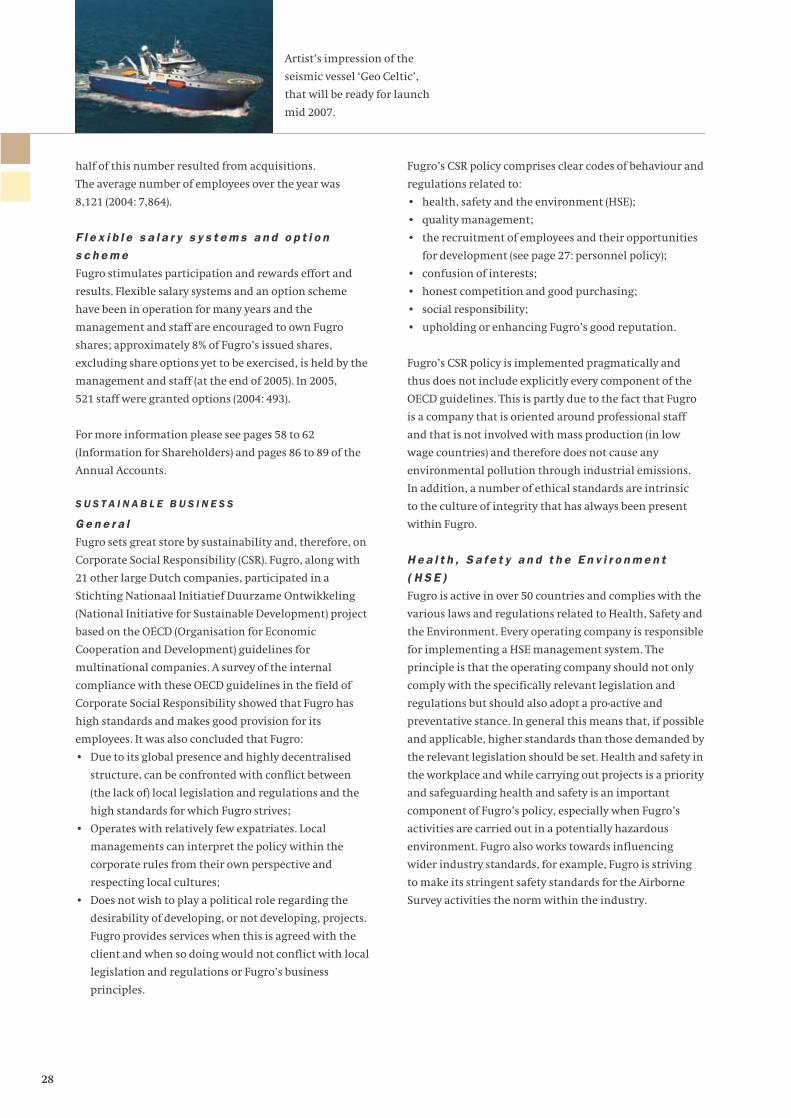
half of this number resulted from acquisitions.
The average number of employees over the year was
8,121 (2004: 7,864).
F l e x i b l e s a l a r y s y s t e m s a n d o p t i o n
s c h e m e
Fugro stimulates participation and rewards effort and
results. Flexible salary systems and an option scheme
have been in operation for many years and the
management and staff are encouraged to own Fugro
shares; approximately 8% of Fugro’s issued shares,
excluding share options yet to be exercised, is held by the
management and staff (at the end of 2005). In 2005,
521 staff were granted options (2004: 493).
For more information please see pages 58 to 62
(Information for Shareholders) and pages 86 to 89 of the
Annual Accounts.
S U S T A I N A B L E B U S I N E S S
G e n e r a l
Fugro sets great store by sustainability and, therefore, on
Corporate Social Responsibility (CSR). Fugro, along with
21 other large Dutch companies, participated in a
Stichting Nationaal Initiatief Duurzame Ontwikkeling
(National Initiative for Sustainable Development) project
based on the OECD (Organisation for Economic
Cooperation and Development) guidelines for
multinational companies. A survey of the internal
compliance with these OECD guidelines in the field of
Corporate Social Responsibility showed that Fugro has
high standards and makes good provision for its
employees. It was also concluded that Fugro:
• Due to its global presence and highly decentralised
structure, can be confronted with conflict between
(the lack of) local legislation and regulations and the
high standards for which Fugro strives;
• Operates with relatively few expatriates. Local
managements can interpret the policy within the
corporate rules from their own perspective and
respecting local cultures;
• Does not wish to play a political role regarding the
desirability of developing, or not developing, projects.
Fugro provides services when this is agreed with the
client and when so doing would not conflict with local
legislation and regulations or Fugro’s business
principles.
Fugro’s CSR policy comprises clear codes of behaviour and
regulations related to:
• health, safety and the environment (HSE);
• quality management;
• the recruitment of employees and their opportunities
for development (see page 27: personnel policy);
• confusion of interests;
• honest competition and good purchasing;
• social responsibility;
• upholding or enhancing Fugro’s good reputation.
Fugro’s CSR policy is implemented pragmatically and
thus does not include explicitly every component of the
OECD guidelines. This is partly due to the fact that Fugro
is a company that is oriented around professional staff
and that is not involved with mass production (in low
wage countries) and therefore does not cause any
environmental pollution through industrial emissions.
In addition, a number of ethical standards are intrinsic
to the culture of integrity that has always been present
within Fugro.
H e a l t h , S a f e t y a n d t h e E n v i r o n m e n t
( H S E )
Fugro is active in over 50 countries and complies with the
various laws and regulations related to Health, Safety and
the Environment. Every operating company is responsible
for implementing a HSE management system. The
principle is that the operating company should not only
comply with the specifically relevant legislation and
regulations but should also adopt a pro-active and
preventative stance. In general this means that, if possible
and applicable, higher standards than those demanded by
the relevant legislation should be set. Health and safety in
the workplace and while carrying out projects is a priority
and safeguarding health and safety is an important
component of Fugro’s policy, especially when Fugro’s
activities are carried out in a potentially hazardous
environment. Fugro also works towards influencing
wider industry standards, for example, Fugro is striving
to make its stringent safety standards for the Airborne
Survey activities the norm within the industry.
28
Artist’s impression of the
seismic vessel ‘Geo Celtic’,
that will be ready for launch
mid 2007.

29
In general Fugro’s activities have little effect on the
environment. Even so, Fugro pays due attention to the
environment and is careful to protect it. Preventing or
reducing environmental damage is a fundamental policy
component. Through its work within its own disciplines
Fugro has gained extensive knowledge of environmental
problems and contributes towards their solution. A high
proportion of Fugro’s activities is carried out on behalf
of the oil and gas industry and, when involved in these
activities, Fugro complies with the stringent demands
the industry places on contractors.
Q u a l i t y m a n a g e m e n t
Fugro pays a great deal of attention to quality. The
trustworthiness of the data or advice provided is a high
priority. By developing the right systems, such as those
for use in deepwater, Fugro remains abreast of its clients’
changing needs. A programme for monitoring client
satisfaction has been in operation for many years and
the conclusions have, where desirable or useful, been
implemented. In Fugro’s view, quality should not only
apply to the service provided to clients, it should also
apply to general standards and values, a people-friendly
working environment and mutual respect.
To this end, (recognised) quality management systems are
applied within operating companies.
C o r p o r a t e S o c i a l R e s p o n s i b i l i t y
Fugro is part of society and involvement in the
community is, therefore, an important aspect of its
operations. This is why Fugro supports a large number of
social initiatives. Sometimes this support is in the form of
a financial contribution, sometimes Fugro contributes
expertise and experience or some other form of active
support. Fugro focuses on general social goals by
supporting institutions such as universities and other
education establishments and industry branch
organisations which may promote our interests. Fugro
also provides support in specific social fields, such as
music, art, culture and sport. Operating company
managers are encouraged to become actively involved in
their local community and to support charitable and
cultural events.
U p h o l d i n g o r e n h a n c i n g F u g r o ’ s g o o d
r e p u t a t i o n
Although each operating company is, in fact, a separate
enterprise, each one contributes towards the reputation
of the Group. Because Fugro’s good reputation is priceless
when it comes to maintaining and expanding our client
base, upholding and protecting our reputation has the
highest priority.

A thorough investigation of the
seabed is vital to ensure that
underwater installations are
securely supported or anchored.
To this end Fugro collects sea-bed
samples and brings them to the
surface in their original condition.
The profile of the sea-bed often resembles a
mountainous landscape. In regions such as the Gulf of
Mexico, where a great many oil and gas installations
are sited, the accurate charting of the sea-bed is
essential for the design of these structures and for
pipeline routing.
© O
RIG
INAL
IMAG
E M
AD
E B
Y S
HELL
& P
TEC
HN
OLO
GY C
O.

Starfix antenna
Acoustic modems
USBL transducer
Generally the installations are built in a
dock or a shipyard and then towed to their
predefined location. Precise positioning and
secure anchoring at the site are essential.
T h o r o u g h r e s e a r c h i s v i t a l f o r t h e d e s i g n a n d s a f e
p l a c e m e n t o f i n s t a l l a t i o n s r e l a t e d t o t h e p r o d u c t i o n
o f o i l a n d g a s f r o m o f f - s h o r e f i e l d s . F u g r o i s
a c t i v e l y i n v o l v e d i n t h e c h a r t i n g o f t h e c o m p o s i t i o n
o f t h e s e a - b e d , c u r r e n t s , w a t e r d e p t h s , e t c e t e r a .
D E V E L O P M E N T
©SBM
Autonomous Underwater Vehicles are
ideally suited for surveys in very deep
water (up to over 3,000 metres), as the
use of towed equipment has some
limitations, e.g., due to ocean currents
and less accurate positioning.

Palaeo plate reconstruction.
I N F O R M A T I O N A N D C O M M U N I C A T I O N
T E C H N O L O G Y
ICT systems play an important role in Fugro’s global
activities. This is driven not only by the need to improve
communications and efficiency, but also by the need to
generate a competitive advantage.
Fugro pays a great deal of attention to the security aspects
of the ICT infrastructure. Fugro’s ICT security team
comprises a global security officer, who reports directly to
the Executive Board, and four regional security officers.
Fugro’s ICT security team is responsible for maintaining
and supervising the e-security aspects of the ICT
infrastructure used by the operating companies to access
the Intranet and for Extranet and Internet applications.
Fugro interfaces with the outside world via a number of
well-protected Internet access gateways. The ICT security
systems on these gateways and the Virtual Private
Network (VPN) infrastructure via which the operating
companies are connected to these gateways are
maintained and monitored by a leading Managed
Security Service Provider (MSSP) 24 hours a day, seven
days a week.
The operating companies are responsible for the security
of their own data and ICT systems within their Local Area
Network (LAN) under guidelines and policy set centrally.
Fugro’s ICT security team also plays a role in the training
of local ICT staff regarding such aspects as security and
the best way to make optimum use of Fugro ICT facilities.
In 2005 ‘security audits’ were carried out at a number of
operating companies to evaluate the effectiveness of their
security measures, the extent to which they complied
with the Group’s ICT security policy and to highlight, in
good time, any system problems.
B U S I N E S S P R I N C I P L E S
Within Fugro a number of ‘Golden Rules’ have been
developed which cover Fugro’s most important
organisational, operational and other characteristics.
These are not unbreakable rules and deviation from them
is permitted if this can be justified. The ‘Golden Rules’ do,
however, put Fugro’s culture and way of working into
words.
The most important rules concern market position,
authorisation levels, divisional cooperation,
communication and the use of Company standards.
When an operating company takes these rules to heart it
has grasped the essence of the Fugro culture.
The other rules are the result of experience and relate to
Group relationships, such as the use of resources within
the Group and the sharing of technology, or concern the
control of risks and provide guidelines regarding the
expansion of activities. Operational issues, such as quality
and safety, project and contract management and
training are explained and financial guidelines are also
provided.
The ‘Golden Rules’ sometimes appear to be very obvious.
Implementing them can, however, involve a great deal of
work and can result in decisions being overturned or a
business opportunity not being acted upon. But applying
the ‘Golden Rules’ not only protects managers – and
Fugro as a whole – against a great many risks, it also
stimulates fellowship within the Group.
32

Soil investigation
offshore Doha, Qatar.
33
R E S E A R C H
During 2005 Fugro once again made considerable
progress with regard to regular (product) development.
Technological research plays a key role for Fugro as the
Company’s market position and services rely, in part,
on state-of-the-art equipment and software that enables
information to be acquired more and more precisely and
complex data to be interpreted more and more
accurately. (Product) developments often take place in
close cooperation with the client as the client is
interested in solving a specific problem. The most
important technological (product) developments of 2005
are listed below:
• the further improvement and expansion of the inertial
navigation system that was introduced successfully in
2004. This development is aimed primarily at sub-sea
positioning in deep water. Development will continue
in 2006;
• the development of extremely accurate time
measurement systems with which measurements can
be compared and correlated with millisecond
precision. This is primarily needed to compensate for
vessel movement when using Dynamic Positioning
systems.
• the improvement of satellite navigation systems to
achieve measurements with a (vertical) accuracy of
5 centimetres;
• the optimisation and visualisation of multi-beam data
processing with which the sea bed can be measured
extremely accurately and the measurements displayed
graphically;
• putting the digital video into operation on the
Remotely Operated Vehicles (ROVs). Digital video and
storage provides considerable improvements in both
the reporting of and access to the information;
• various software developments related to improving
the processing and interpretation of (geophysical) data
and for reservoir modelling;
• the first, and successful, employment of the
Autonomous Underwater Vehicle (AUV), the ‘Hugin’,
for a large project in Egypt. The ‘Hugin’, one of the
three AUVs of this type in the world, operates in deep
water where it collects extremely high-quality data
very efficiently. The Hugin’s following ‘assignments’
will be in Indonesia, Brazil and Nigeria;
• the further improvement of the ‘Georanger I’
(Unmanned Airborne Vehicle) to optimise airborne
measuring by flying a remotely controlled airborne
vehicle along a pre-programmed route. The UAV,
which is equipped with various sensors, was used
regularly during 2005.
In addition to the regular (innovative) research activities
directly related to its core activities, Fugro was also
involved in a number of complementary activities and
initiatives including:
• wind energy, where Fugro provides the Chairman of
the IRO wind group, because this form of energy
generation generally also involves (offshore)
infrastructure-related activities;
• the Eurogia-cluster. This is an initiative for sustainable
and safe energy provision in the context of a cleaner
and safer future;
• Fugro’s participation in two investigations related to
gas hydrates (frozen gas crystals) in deep water.
These are potential energy sources and, in addition,
this knowledge could also be used when giving advice
regarding drilling for oil and gas sources in deep water.
M A R K E T D E V E L O P M E N T A N D T R E N D S
T h e o i l a n d g a s m a r k e t
During 2004 and in 2005 the investment budgets of many
oil and gas companies rose substantially. In 2005 this
made a considerable contribution towards the increased
turnover of suppliers to this sector such as Fugro.
The depletion of existing fields, the postponement of
investments in previous years, and the world’s rising
energy needs mean that in the coming years the oil
and gas industry must continue to make substantial
investments in new fields in order to be able to continue
meeting the demand.
The oil and gas related portion of Fugro’s turnover
amounts to 71% (2004: 72%). Fugro’s strategic focus in this
sector is on two segments and two money streams: the
exploration for and development of new fields, and the
optimisation of the production of oil and gas from
existing fields. This means that over a period of 20 to 30
years Fugro can be involved at different times and with
different services throughout virtually the entire life-
cycle of gas and oil fields. Clearly Fugro is profiting from
the increase in the oil and gas companies’ investment
budgets which focus on both onshore and offshore fields.
Many of the exploration and development activities,
especially the deep water projects, continue to be located
in the Gulf of Mexico, West Africa and Brazil. The Middle

Geo-environmental
measurements of Antwerp
harbour, Belgium.
East, the Caspian Sea, Mexico and parts of Asia and
Australia are also active regions. There is also far more
interest in detailed knowledge regarding reservoirs
aimed at maintaining production levels from existing
fields for as long as possible and extracting the maximum
amount of oil and gas from these reservoirs.
Gas is also a strong growth market. The global demand for
gas continues to increase. Liquid natural gas (LNG) meets
some of this demand. The increasing number of LNG
terminals under development, for which Fugro provides
services in various parts of the world, plus high oil prices,
is making the development of gas fields located at some
distance from the user markets more attractive. This is
especially applicable in the Middle East where there are
considerable gas reserves within transportation distance
of India, China and Japan. Further large-scale
developments are also taking places in countries that
have been exporting gas for some time, such as Australia
and Indonesia. The use of LNG also means that the
purchasing countries can more readily comply with the
stipulations of the Kyoto Agreement. This will strengthen
the trend towards the creation of a global gas market and
could result in gas remaining more attractive than the
alternatives.
The oil and gas companies will, therefore, invest in both
deep water fields and in existing offshore and onshore
fields. Fugro is in an excellent position to offer this sector
a wide range of services anywhere in the world. According
to recent external market research, investment (in
dollars) by oil and gas companies increased by around 20%
in 2005 and will increase by around 15% more in 2006.
Despite the high investment involved in their
development, the deep water fields are, in general, larger
and more productive and, therefore, more attractive.
The global economic growth (demand side) and the
relatively limited production and logistics capacity that
cannot be increased quickly (supply side) meant that oil
prices remained at well over USD 55 a barrel for most of
the year. The average price per barrel of Brent in 2005 was
USD 56.70 (2004: USD 38.22). Oil prices are expected to
remain high (over USD 40) for the time being. Various
publications have indicated that, because demand is
outstripping supply, oil companies are basing their
investment viability calculations on an oil price of USD 25
– 30 or higher per barrel instead of the historical USD 15
or the USD 20 that was applicable in 2003. This will make
more projects economically viable. Taking into account
the development time of projects, Fugro expects to be able
to profit from this situation in 2006 and the ensuing
years.
O t h e r m a r k e t s e g m e n t s
In 2005, Fugro’s non oil and gas related activities showed
an improvement compared with the previous year.
This was due to the gradual strengthening of the
economies in a number of regions, which resulted in the
construction related activities in several countries
picking up. These infrastructure related activities, which
have a very regional nature, account for around 21% of
Fugro’s activities (2004: 21%). Relatively speaking, the
share of this sector is currently lower than the historic
norm for Fugro partly due to the good opportunities
offered by the oil and gas industry. Having said that,
as far as turnover is concerned Fugro’s construction
and infrastructure related activities could increase
structurally. The need for infrastructure development
will remain high for a considerable time. Fugro carried
out large orders involving airports, land reclamation,
(LNG) harbour expansions, railways, tunnels and large
buildings all over the world. This is another segment
in which Fugro has, over the years, steadily and
continuously strengthened its market position. One
reason for this is that clients increasingly want to place
the responsibility for more and more of a project’s various
investigation activities in the hands of a single supplier.
Thanks to its unique combination of activities,
specialisms, equipment and technologies, combined with
its scale and market position, Fugro can profit from this
trend. Cooperation between the different Group business
units is increasing. The clustering of activities is
especially noticeable in large infrastructure projects in
coastal waters.
The high price of minerals has led to a significant increase
in exploration-related investment by mining companies.
The extra investment in this sector means more demand
for the necessary data. This has had a positive effect on the
Airborne Survey activities and here too Fugro saw an
increase in the demand for projects in 2005.
The mining industry related activities accounted for
around 6% of the turnover (2004: 5%).
34

35
B A C K L O G
At the beginning of 2006 the backlog amounted to
EUR 814.1 million – an increase of EUR 224.9 million
compared with a year earlier (2005: EUR 589.2 million).
The backlog calculation is based on end of year exchange
rates. Partly due to the increase in the dollar rate from
EUR 0.73 to EUR 0.85 for one USD, the backlog in EUR was
38% higher compared with 2005. Had the dollar rate
remained the same the increase would have been 29%.
(x EUR 1 mln.)
B a c k l o g a t s t a r t o f t h e y e a r
( f o r t h e n e x t t w e l v e m o n t h s )
Geotechnical
Onshore definite
Onshore probable
Offshore definite
Offshore probable
Survey
Offshore definite
Offshore probable
Onshore definite
Onshore probable
Positioning definite
Positioning probable
Geoscience
Development & Production definite
Development & Production probable
Airborne Survey definite
Airborne Survey probable
Total
Applicable USD-rate
2002
78.2
32.1
30.8
24.5
165.6
69.9
119.1
11.8
24.4
14.6
2.6
242.4
38.5
32.2
25.8
17.4
113.9
521.9
EUR 1.13
2003
61.5
32.8
35.7
17.1
147.1
79.6
84.5
10.2
15.6
13.2
6.6
209.7
37.0
42.2
20.4
9.5
109.1
465.9
EUR 0.95
2004
50.9
35.8
24.3
20.4
131.4
118.6
122.5
7.4
13.2
12.9
3.8
278.4
64.8
60.1
26.2
12.2
163.3
573.1
EUR 0.79
2005
49.8
25.0
37.9
24.0
136.7
131.5
121.8
10.0
13.1
15.8
3.2
295.4
72.1
51.0
25.1
8.9
157.1
589.2
EUR 0.73
2006
63.3
34.2
50.6
18.4
166.5
202.4
169.3
16.1
16.7
19.0
5.6
429.1
130.2
40.5
32.5
15.3
218.5
814.1
EUR 0.85
Recalculated at the exchange rates of 31 December 2004, the backlog at the start of 2006 would have been EUR 54.0 million lower
(EUR 760.1 million).
Backlog comprises turnover for the coming twelve months and includes:
– awarded projects not yet started, and unfinished elements of on-going projects (definite);
– projects that are highly likely to be awarded (probable).
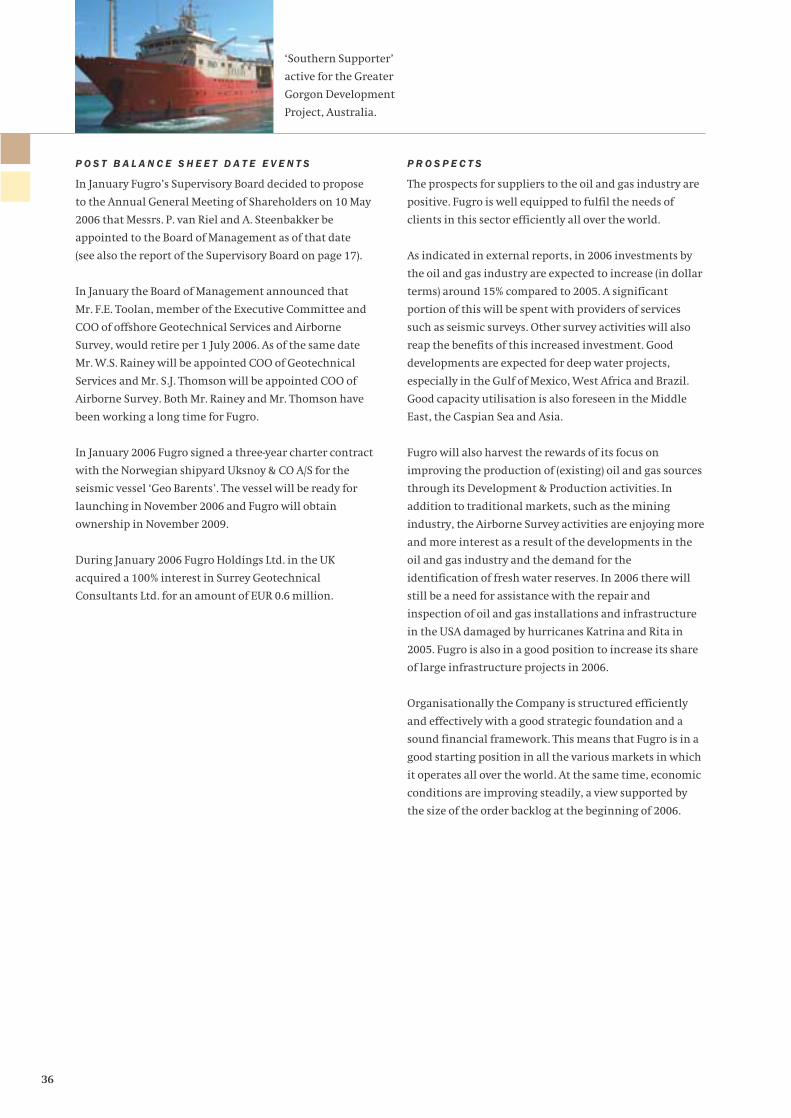
‘Southern Supporter’
active for the Greater
Gorgon Development
Project, Australia.
P O S T B A L A N C E S H E E T D A T E E V E N T S
In January Fugro’s Supervisory Board decided to propose
to the Annual General Meeting of Shareholders on 10 May
2006 that Messrs. P. van Riel and A. Steenbakker be
appointed to the Board of Management as of that date
(see also the report of the Supervisory Board on page 17).
In January the Board of Management announced that
Mr. F.E. Toolan, member of the Executive Committee and
COO of offshore Geotechnical Services and Airborne
Survey, would retire per 1 July 2006. As of the same date
Mr. W.S. Rainey will be appointed COO of Geotechnical
Services and Mr. S.J. Thomson will be appointed COO of
Airborne Survey. Both Mr. Rainey and Mr. Thomson have
been working a long time for Fugro.
In January 2006 Fugro signed a three-year charter contract
with the Norwegian shipyard Uksnoy & CO A/S for the
seismic vessel ‘Geo Barents’. The vessel will be ready for
launching in November 2006 and Fugro will obtain
ownership in November 2009.
During January 2006 Fugro Holdings Ltd. in the UK
acquired a 100% interest in Surrey Geotechnical
Consultants Ltd. for an amount of EUR 0.6 million.
P R O S P E C T S
The prospects for suppliers to the oil and gas industry are
positive. Fugro is well equipped to fulfil the needs of
clients in this sector efficiently all over the world.
As indicated in external reports, in 2006 investments by
the oil and gas industry are expected to increase (in dollar
terms) around 15% compared to 2005. A significant
portion of this will be spent with providers of services
such as seismic surveys. Other survey activities will also
reap the benefits of this increased investment. Good
developments are expected for deep water projects,
especially in the Gulf of Mexico, West Africa and Brazil.
Good capacity utilisation is also foreseen in the Middle
East, the Caspian Sea and Asia.
Fugro will also harvest the rewards of its focus on
improving the production of (existing) oil and gas sources
through its Development & Production activities. In
addition to traditional markets, such as the mining
industry, the Airborne Survey activities are enjoying more
and more interest as a result of the developments in the
oil and gas industry and the demand for the
identification of fresh water reserves. In 2006 there will
still be a need for assistance with the repair and
inspection of oil and gas installations and infrastructure
in the USA damaged by hurricanes Katrina and Rita in
2005. Fugro is also in a good position to increase its share
of large infrastructure projects in 2006.
Organisationally the Company is structured efficiently
and effectively with a good strategic foundation and a
sound financial framework. This means that Fugro is in a
good starting position in all the various markets in which
it operates all over the world. At the same time, economic
conditions are improving steadily, a view supported by
the size of the order backlog at the beginning of 2006.
36

Structural Health Moni-
toring System for bridge
the Shenzhen Western
Corridor, Hong Kong.
37
Investments, including investments in new seismic and
underwater measuring equipment, are essential for
Fugro, we expect that investments in 2006 will be around
EUR 100 million higher than normal. We will also
continue recruiting and training new staff in order to be
able to meet the demand. Due to the short-term nature of
a part of our projects we only can, like in previous years,
give a forecast for the full year at the presentation of the
half-yearly report 2006 in August.
Leidschendam, 9 March 2006
K.S. Wester, President and Chief Executive Officer
A. Jonkman, Chief Financial Officer
P r o s p e c t s s u m m a r i s e d :
• good prospects for suppliers to the oil and gas
industry;
• according to external reports the investments
by oil and gas companies expected to increase by
15% in 2006;
• high demand for offshore seismic survey;
• continuous demand for minerals (mining industry);
• due to the growth in the world’s population
further expansion of transportation systems (for
which large infrastructural projects are
necessary, such as roads, harbours and airports);
• positive developments, both offshore and
onshore, in many regions;
• leading market positions in which investments
will continue.
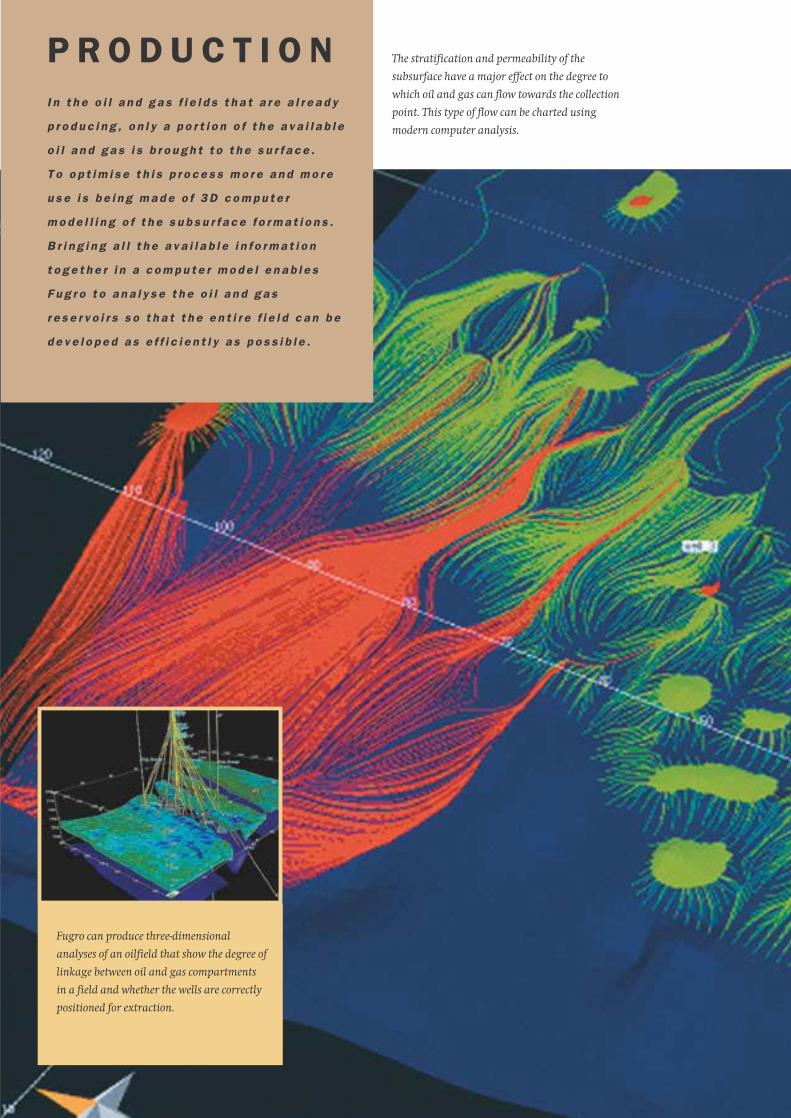
I n t h e o i l a n d g a s f i e l d s t h a t a r e a l r e a d y
p r o d u c i n g , o n l y a p o r t i o n o f t h e a v a i l a b l e
o i l a n d g a s i s b r o u g h t t o t h e s u r f a c e .
T o o p t i m i s e t h i s p r o c e s s m o r e a n d m o r e
u s e i s b e i n g m a d e o f 3 D c o m p u t e r
m o d e l l i n g o f t h e s u b s u r f a c e f o r m a t i o n s .
B r i n g i n g a l l t h e a v a i l a b l e i n f o r m a t i o n
t o g e t h e r i n a c o m p u t e r m o d e l e n a b l e s
F u g r o t o a n a l y s e t h e o i l a n d g a s
r e s e r v o i r s s o t h a t t h e e n t i r e f i e l d c a n b e
d e v e l o p e d a s e f f i c i e n t l y a s p o s s i b l e .
P R O D U C T I O N
Fugro can produce three-dimensional
analyses of an oilfield that show the degree of
linkage between oil and gas compartments
in a field and whether the wells are correctly
positioned for extraction.
The stratification and permeability of the
subsurface have a major effect on the degree to
which oil and gas can flow towards the collection
point. This type of flow can be charted using
modern computer analysis.

Fugro’s satellite positioning
systems enable offshore
installations to be positioned
– with decimetre accuracy –
anywhere in the ocean.
Infrared satellite photographs enable ocean
currents to be charted. The Gulf of Mexico is
one of the regions where Fugro has carried
out this type of analysis.
The exponential increase in computer
capacity means that we can now work
far more quickly and accurately.
Fugro assists in the design of offshore oil
and gas installations such that they can
withstand the forces of nature.
©CORB IS/ZE F A
In the Gulf of Mexico there is a vast
network of oil and gas pipelines,
most of them underwater, and their
positions must be accurately
recorded. Fugro has a unique
database of information collected
over decades at its disposal.
Just how useful this database is was
proven after the Katrina en Rita
hurricanes.
©OCEANNUMERICS

G o a l s a n d s t r a t e g y
The Geotechnical services division investigates and
advises on the physical characteristics of soils and rocks,
both onshore and offshore. It also investigates and advises
on materials used in construction.
The onshore geotechnical services are oriented primarily
towards infrastructure projects, land reclamation and
construction activities. Fugro is active in many countries
and generally occupies strong local positions. To a great
extent the Division’s results are dependent on
developments in the local economies. In addition to its
regular work the business unit concentrates primarily on
larger and technically challenging projects with better
margins.
The offshore activities focus mainly on the oil and gas
industry but also on larger projects in coastal waters.
The size of the oil and gas companies’ investment budgets
influences the results. Due to its strong leading position
and scale advantages, Fugro can maintain its
technological lead and focus on new markets, or niche
markets such as deepwater projects.
The Division’s longer-term target is an improvement of
the result through higher rmargins on an increasing
turnover. Where it is worthwhile the geographical spread
will be broadened.
G e n e r a l b u s i n e s s d e v e l o p m e n t
Although, as expected, onshore Geotechnical Services’
turnover and result rose slightly, there is still room for
a further improvement of the results. Offshore
Geotechnical Services showed an improvement, especially
where work was related to the development of new oil
and gas fields.
On balance turnover rose by 11% to EUR 304 million
(2004: EUR 273 million). The operating result rose by 15%
to EUR 46 million (2004: EUR 40 million). This equates to a
margin on turnover of 15% (2004: 15%). Expressed as a
percentage of the invested capital the operating result
was 26% (2004: 21%).
O n s h o r e G e o t e c h n i c a l s e r v i c e s
The onshore activities are characterised by local or
regional markets and competition. Fugro has a presence
in many countries and its market position varies per
region or country. In most countries there are many
competitors who do not have the expertise and global
support enjoyed by the Fugro offices. The Company’s size
puts Fugro in a strong market position when it comes to
large infrastructure projects.
G e o t e c h n i c a l s e r v i c e s
40
0
70
140
210
280
350
20052004200320022001
(x EUR 1 mln.)
T u r n o v e r *
A. Steenbakker
(as of 1 September 2005)
F.E. Toolan
O n s h o r e
• probing, drilling and measuring;
• quality testing of construction materials;
• laboratory and environmental testing;
• advisory and design assignments related to foundations
for buildings and land reclamation.
O f f s h o r e
• seabed soil investigations;
• advising on foundations for offshore structures,
tunnels, bridges and harbour construction;
• collecting data for a variety of purposes including the
laying of underwater pipelines and cables;
• monitoring large structures such as offshore platforms,
bridges and tunnels.
* As of 2003 based on IFRS.
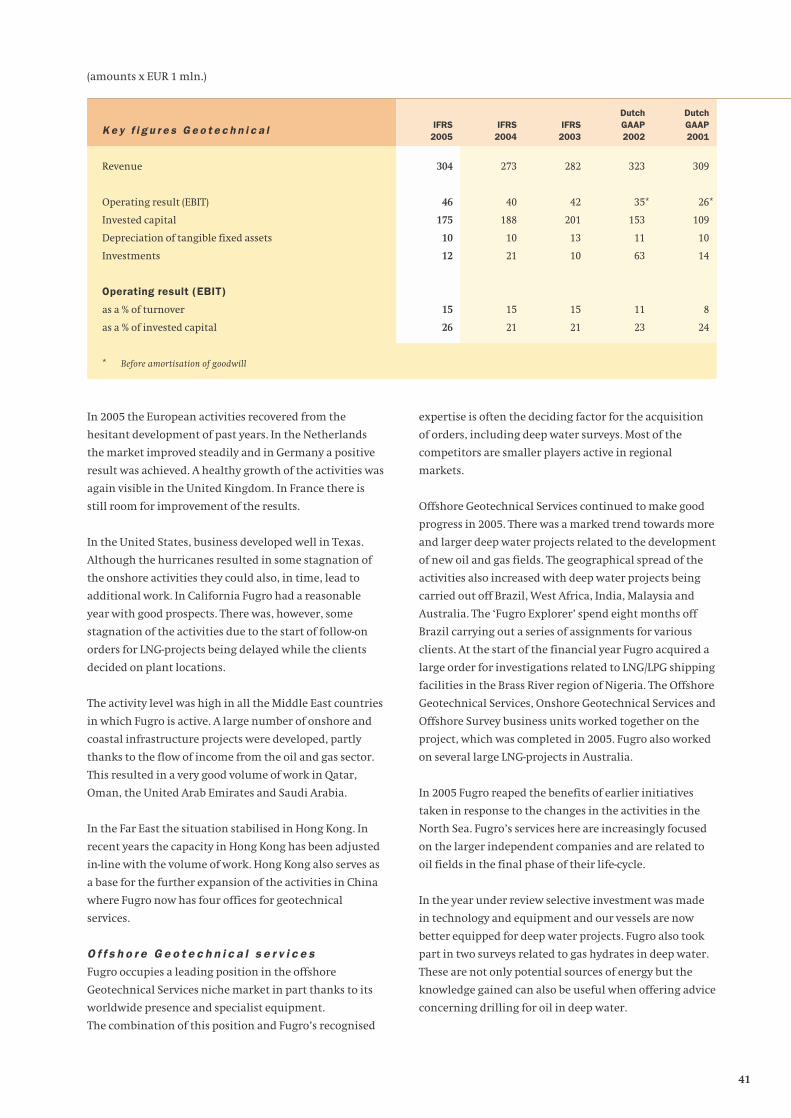
In 2005 the European activities recovered from the
hesitant development of past years. In the Netherlands
the market improved steadily and in Germany a positive
result was achieved. A healthy growth of the activities was
again visible in the United Kingdom. In France there is
still room for improvement of the results.
In the United States, business developed well in Texas.
Although the hurricanes resulted in some stagnation of
the onshore activities they could also, in time, lead to
additional work. In California Fugro had a reasonable
year with good prospects. There was, however, some
stagnation of the activities due to the start of follow-on
orders for LNG-projects being delayed while the clients
decided on plant locations.
The activity level was high in all the Middle East countries
in which Fugro is active. A large number of onshore and
coastal infrastructure projects were developed, partly
thanks to the flow of income from the oil and gas sector.
This resulted in a very good volume of work in Qatar,
Oman, the United Arab Emirates and Saudi Arabia.
In the Far East the situation stabilised in Hong Kong. In
recent years the capacity in Hong Kong has been adjusted
in-line with the volume of work. Hong Kong also serves as
a base for the further expansion of the activities in China
where Fugro now has four offices for geotechnical
services.
O f f s h o r e G e o t e c h n i c a l s e r v i c e s
Fugro occupies a leading position in the offshore
Geotechnical Services niche market in part thanks to its
worldwide presence and specialist equipment.
The combination of this position and Fugro’s recognised
expertise is often the deciding factor for the acquisition
of orders, including deep water surveys. Most of the
competitors are smaller players active in regional
markets.
Offshore Geotechnical Services continued to make good
progress in 2005. There was a marked trend towards more
and larger deep water projects related to the development
of new oil and gas fields. The geographical spread of the
activities also increased with deep water projects being
carried out off Brazil, West Africa, India, Malaysia and
Australia. The ‘Fugro Explorer’ spend eight months off
Brazil carrying out a series of assignments for various
clients. At the start of the financial year Fugro acquired a
large order for investigations related to LNG/LPG shipping
facilities in the Brass River region of Nigeria. The Offshore
Geotechnical Services, Onshore Geotechnical Services and
Offshore Survey business units worked together on the
project, which was completed in 2005. Fugro also worked
on several large LNG-projects in Australia.
In 2005 Fugro reaped the benefits of earlier initiatives
taken in response to the changes in the activities in the
North Sea. Fugro’s services here are increasingly focused
on the larger independent companies and are related to
oil fields in the final phase of their life-cycle.
In the year under review selective investment was made
in technology and equipment and our vessels are now
better equipped for deep water projects. Fugro also took
part in two surveys related to gas hydrates in deep water.
These are not only potential sources of energy but the
knowledge gained can also be useful when offering advice
concerning drilling for oil in deep water.
41
(amounts x EUR 1 mln.)
K e y f i g u r e s G e o t e c h n i c a l
Revenue
Operating result (EBIT)
Invested capital
Depreciation of tangible fixed assets
Investments
Operating result (EBIT)
as a % of turnover
as a % of invested capital
* Before amortisation of goodwill
Dutch GAAP2001
309
26
109
10
14
8
24
Dutch GAAP2002
323
35
153
11
63
11
23
IFRS2003
282
42
201
13
10
15
21
IFRS2004
273
40
188
10
21
15
21
IFRS2005
304
46
175
10
12
15
26
* *

G o a l s a n d s t r a t e g y
The Survey services division concentrates on mapping
the topography and geological composition of the earth’s
surface, both on land and at sea, the registration of data
regarding the earth’s surface and precise positioning.
Most of the offshore services are carried out on behalf of
the oil and gas industry and are offered all over the world.
Fugro’s technological lead provides opportunities to
capture a large share of the growing market for the
development of deepwater fields. The results of this
business unit are closely linked to the level of investment
by the oil companies.
The onshore services focus on local/regional markets in
the government, utility, industry and construction
sectors. In addition to traditional land surveys, Fugro
focuses on technologically advanced solutions and new
applications. This opens up possibilities for further
growth for this business unit.
The positioning business unit offers precise satellite
positioning services throughout the world to onshore
markets such as agriculture and mining and to specific
offshore niche markets. Given the availability of free
public DGPS services, Fugro differentiates its satellite
positioning services through technical performance
(accuracy, reliability and coverage) and customer support.
G e n e r a l b u s i n e s s d e v e l o p m e n t
In the year under review the Survey division achieved a
turnover of EUR 565 million (2004: EUR 470 million) – an
increase of 20%. The operating result rose by 37% to
EUR 97 million (2004: EUR 71 million). This equates to 17%
of the turnover (2004: 15%). Expressed as a percentage of
the invested capital the operating result amounted to 44%
(2004: 40%).
S u r v e y s e r v i c e s
42
J. Ruegg O.M. Goodman
O f f s h o r e
• geophysical and site surveys related to the positioning
of drilling rigs;
• route surveys for pipelines and underwater cables;
• positioning services above water (Starfix and Skyfix) and
underwater;
• deepwater surveys using AUVs (Autonomous
Underwater Vehicles);
• survey support for construction projects at sea,
generally using DP (dynamically positioned) vessels and
ROVs (Remotely Operated Vehicles);
• (annual) inspections of pipelines;
• oceanography.
O n s h o r e
• advanced land survey activities;
• data management, conversion and mapping;
• LiDAR and photographic mapping;
• geographic registration and asset management.
• specialist services such as geomonitoring and
dimensional control.
P o s i t i o n i n g
• development and operation of extremely accurate
positioning services such as OmniSTAR, Starfix,
SkyFix and SeaSTAR-DP;
• support of professional end-users on land, at sea
and in the air;
• tracking services for vessels, vehicles, etc.
200520042003200220010
120
240
360
480
600
(x EUR 1 mln.)
T u r n o v e r *
* As of 2003 based on IFRS.
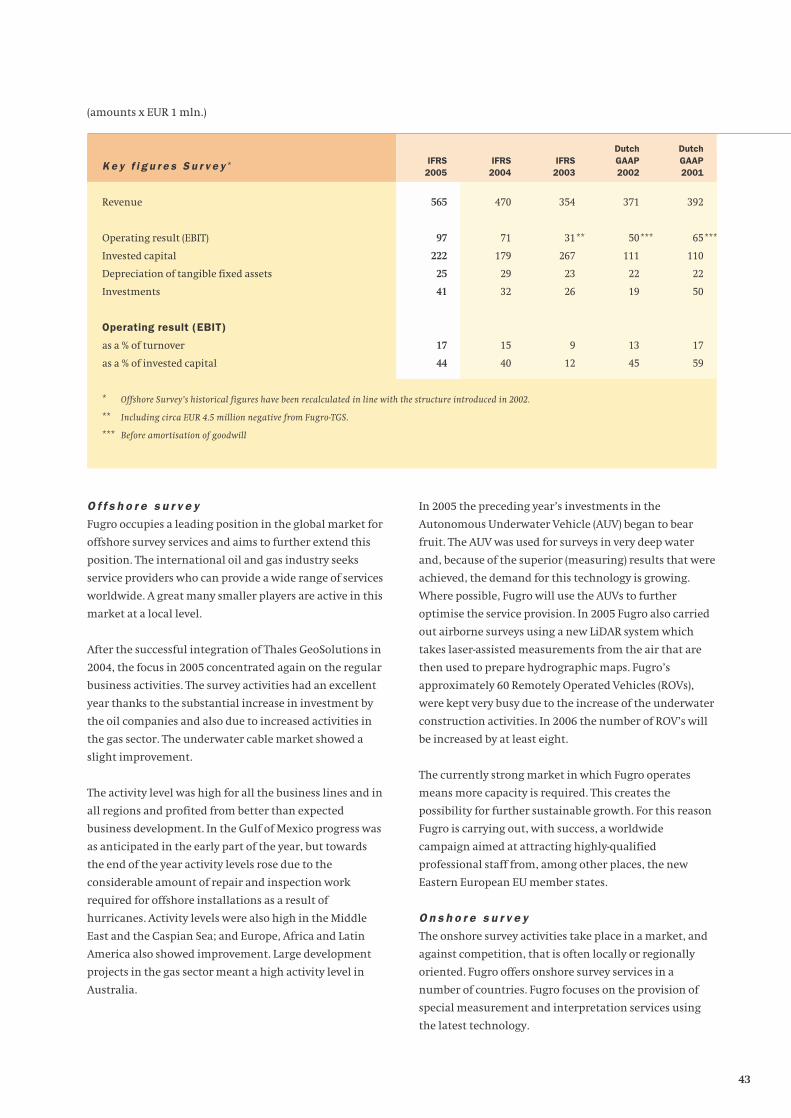
O f f s h o r e s u r v e y
Fugro occupies a leading position in the global market for
offshore survey services and aims to further extend this
position. The international oil and gas industry seeks
service providers who can provide a wide range of services
worldwide. A great many smaller players are active in this
market at a local level.
After the successful integration of Thales GeoSolutions in
2004, the focus in 2005 concentrated again on the regular
business activities. The survey activities had an excellent
year thanks to the substantial increase in investment by
the oil companies and also due to increased activities in
the gas sector. The underwater cable market showed a
slight improvement.
The activity level was high for all the business lines and in
all regions and profited from better than expected
business development. In the Gulf of Mexico progress was
as anticipated in the early part of the year, but towards
the end of the year activity levels rose due to the
considerable amount of repair and inspection work
required for offshore installations as a result of
hurricanes. Activity levels were also high in the Middle
East and the Caspian Sea; and Europe, Africa and Latin
America also showed improvement. Large development
projects in the gas sector meant a high activity level in
Australia.
In 2005 the preceding year’s investments in the
Autonomous Underwater Vehicle (AUV) began to bear
fruit. The AUV was used for surveys in very deep water
and, because of the superior (measuring) results that were
achieved, the demand for this technology is growing.
Where possible, Fugro will use the AUVs to further
optimise the service provision. In 2005 Fugro also carried
out airborne surveys using a new LiDAR system which
takes laser-assisted measurements from the air that are
then used to prepare hydrographic maps. Fugro’s
approximately 60 Remotely Operated Vehicles (ROVs),
were kept very busy due to the increase of the underwater
construction activities. In 2006 the number of ROV’s will
be increased by at least eight.
The currently strong market in which Fugro operates
means more capacity is required. This creates the
possibility for further sustainable growth. For this reason
Fugro is carrying out, with success, a worldwide
campaign aimed at attracting highly-qualified
professional staff from, among other places, the new
Eastern European EU member states.
O n s h o r e s u r v e y
The onshore survey activities take place in a market, and
against competition, that is often locally or regionally
oriented. Fugro offers onshore survey services in a
number of countries. Fugro focuses on the provision of
special measurement and interpretation services using
the latest technology.
43
Dutch GAAP2001
392
65
110
22
50
17
59
Dutch GAAP2002
371
50
111
22
19
13
45
IFRS2003
354
31
267
23
26
9
12
IFRS2004
470
71
179
29
32
15
40
IFRS2005
565
97
222
25
41
17
44
(amounts x EUR 1 mln.)
K e y f i g u r e s S u r v e y *
Revenue
Operating result (EBIT)
Invested capital
Depreciation of tangible fixed assets
Investments
Operating result (EBIT)
as a % of turnover
as a % of invested capital
* Offshore Survey’s historical figures have been recalculated in line with the structure introduced in 2002.
** Including circa EUR 4.5 million negative from Fugro-TGS.
*** Before amortisation of goodwill
***** ***

During 2005 the onshore survey activities developed well.
Although there is room for improvement the results were
clearly better than 2004 right across the board.
In Australia results improved partly thanks to the cost
reductions implemented in 2004. Here too a LiDAR
mapping system was introduced, which opened new
markets.
The Dutch infrastructure related activities still faced
weak market circumstances, but the organisation has
now been matched to the volume of work and is in a
position to benefit from the positive market trend that
appears to have settled in.
The onshore survey activities for the oil and gas industry
once again developed positively in the Middle East,
the United States and Canada.
In the year under review Fugro invested in FLI-MAP 400
and, with this new generation of systems, expects to
achieve a technological lead in the market. FLI-MAP 400 is
an ultra-modern measuring system for pipeline,
highways, utilities and railway routes. In the aftermath of
hurricane Katrina Fugro used the FLI-MAP laser system to
map the damage to the levees surrounding New Orleans.
The outsourcing of data management and conversion
projects to lower cost countries is continuing. As the focus
of this service is also on more and more added-value, use
is being made of the combined (international) Group
activities.
P o s i t i o n i n g
Although there are other companies active around the
world in the market for positioning services, in recent
years Fugro has built-up a leading market position in the
high-accuracy (sub-decimetre) sector.
In 2005 Fugro’s positioning activities once again achieved
a further improvement in turnover and result.
The increase in sales of OmniSTAR-HP system signal
subscriptions in the United States, Australia and Europe,
was mainly due to the fact that compatible hardware
(from third parties) became available at a reasonable
price. OmniSTAR-HP/XP is used primarily for applications
in the agriculture sector. Furthermore there has been no
slow-down in the growth of the offshore Dynamic
Positioning (DP) activities. This shows there is a clear need
for the high accuracy and reliability that Fugro’s systems
can provide.
In the market for high-precision positioning Fugro has
established itself as a leading player on land, at sea and in
the air. Fugro concentrates on the professional user who
needs high-performance services. Thanks to its
development of innovative products and systems, often in
cooperation with strategic business partners, Fugro can
offer measuring systems that are far more accurate (sub-
decimetre) than those offered by the competing
commercial service providers and ‘free services’.
Fugro is keeping a close watch on developments related to
the European Galileo satellite system and anticipates
being able to augment this system. This system may offer
greater accuracy than GPS, but will probably not become
operational during this decade.
44

G o a l s a n d s t r a t e g y
The Geoscience division concentrates on the gathering
and interpretation of geophysical and geological data and
the evaluation of resources including oil, gas and
minerals plus the optimisation of their production.
The Geoscience division comprises two business units:
Development & Production and Airborne Survey.
Development & Production concentrates on the gathering
and interpretation of data and on reducing the costs of
and improving the efficiency of oil field exploitation,
development and production. This is achieved by,
amongst other things, the application of advanced data
interpretation and modelling technology developed in-
house. To a great extent these services are funded out of
the less cyclical production budgets. Development &
Production is active worldwide and occupies a strong
position in the field of seismic surveys at sea and as a
supplier of non-exclusive data and high-value services in
the field of integrated geophysical and geological data
processing and interpretation aimed at improving
knowledge regarding reservoirs. The upstream oil and gas
industry is the major client for these services and Fugro
clearly targets the oil and gas companies in the sector.
Airborne Survey collects geophysical data around the
world for the mining industry and for oil and gas
companies. One result of Fugro’s stringent safety
demands and state-of-the-art technology is that the oil
and gas industry has rediscovered these services for the
regional geological mapping. There are also growth
opportunities in other markets and with aid
organisations such as the World Bank.
G e n e r a l b u s i n e s s d e v e l o p m e n t
The Geoscience division achieved a 10% higher
turnover of EUR 292 million (2004: EUR 265 million).
The operating result rose by 19% to EUR 44 million (2004:
EUR 37 million). This equates to a margin on turnover of
15% (2004: 14%). Expressed as a percentage of the invested
capital the operating result amounted to 24% (2004: 23%).
D e v e l o p m e n t & P r o d u c t i o n
Development & Production offers a broad spectrum of
related services worldwide. The seismic market comprises
a number of segments in which different players are
active. Fugro concentrates on specialist 2D work and
medium-sized 3D surveys. In this segment there are four
major competitors. The 3D market in particular showed a
strong recovery during 2005.
G e o s c i e n c e s e r v i c e s
45
D e v e l o p m e n t & P r o d u c t i o n
• seismic and gravity data acquisition;
• seismic and gravity data processing and interpolation
• geological interpretation and modelling;
• 3D integrated seismic reservoir characterisation;
• reservoir engineering;
• data management;
• non-exclusive data sales.
A i r b o r n e S u r v e y
• collection, processing and interpretation of
geophysical data for industries including mining
and oil and gas;
• mineral and water stocks location and saline layer
detection;
• geological mapping;
• environmental and engineering studies for a wide
range of purposes;
• non-exclusive data sales.
P. van Riel F.E. Toolan
0
60
120
180
240
300
20052004200320022001
(x EUR 1 mln.)
T u r n o v e r *
* As of 2003 based on IFRS.

In 2005 the Development & Production activities
continued to develop. Better contract conditions were
obtained, especially in the seismic market. The focus
continues to be aimed at the further improvement of
turnover and margins. Expectations in this respect are
positive due to the considerable effort put into optimising
project management in 2005. After several large
acquisitions in preceding years the streamlining of the
business unit is now virtually complete. The activities
that were acquired as part of past acquisitions but that
did not fit in with Fugro’s strategy, such as environmental
laboratories, have now been divested. The current
structure and clustering of activities is enabling more and
more benefits to be reaped from cooperation and synergy
between the various companies. This improves the
decisiveness and position in this very promising market.
There was an increase in willingness to invest within the
oil and gas industry which started in the second half of
2004 and continued throughout 2005. This led to a high
demand for and robust growth of our exploration
activities. The continuing decline in production from
existing oil fields (depletion effect), the increasing
demand for oil and gas and the persisting high oil and gas
prices mean this trend is expected to continue. This
resulted in far more seismic activities including sales of
Fugro’s geological and seismic multi-client data, such as
in the Gulf of Mexico.
In August Fugro placed a bid for the Norwegian company
Exploration Resources in order to acquire a number of the
company’s seismic vessels. These vessels were already
being used by Fugro in a cooperative undertaking
relationship. Fugro decided not to raise its bid as a result
of a higher bid from another bidder.
As the cooperation will come to an end during 2006,
Fugro has obtained the required capacity in another way.
In October 2005 Fugro took the first steps with the signing
of a long-term charter agreement for the ‘Geo Atlantic’.
This vessel, which was built in 2000, will be converted for
the collection of seismic data with state-of-the-art
technology. Fugro also placed orders for two 3D seismic
streamer installations one of which is destined for the
‘Geo Atlantic’. In November Fugro signed a long-term
charter agreement for a new 3D seismic vessel (Geo Celtic)
that will be ready for launch in mid 2007. Vessels’ deck
construction has been developed in accordance with
Fugro’s specification so it can be fitted with the newest
seismic equipment. This seismic equipment will
incorporate the latest developments, including 4D
capability. All the seismic equipment on
the Geo Celtic will be owned by Fugro. At the beginning of
2006, a three-year charter agreement was signed for the
3D ‘Geo Barents’ seismic vessel. The Geo Barents will be
ready for launch in November 2006 and its ownership will
be transferred to Fugro in November 2009.
The expansions mentioned above will bring about the
further modernisation of the fleet and will, by mid 2007,
put six seismic vessels at Fugro’s disposal. In addition, to
retain flexibility, two or three vessels will be chartered on
46
Dutch GAAP2001
209
7
250
8
25
3
3
Dutch GAAP2002
252
27
251
14
18
11
11
IFRS2003
186
4
105
13
13
2
4
IFRS2004
265
37
159
16
13
14
23
IFRS2005
292
44
180
18
18
15
24
(amounts x EUR 1 mln.)
K e y f i g u r e s G e o s c i e n c e *
Revenue
Operating result (EBIT)
Invested capital
Depreciation of tangible fixed assets
Investments
Operating result (EBIT)
as a % of turnover
as a % of invested capital
* The historical figures have been recalculated in line with the structure introduced in 2002.
** Before amortisation of goodwill.
** **

a project and/or short-term basis. This will enable Fugro to
operate in the seismic market with the desired fleet size
of around eight vessels.
In 2005, the seismic data processing activity showed a
healthy growth, partly through further international
expansion. The growth of this business unit is a
consequence not only of the increased amount of data
collected, but also as a result of the growing reservoir
characterisation activities. The results in the field of
reservoir modelling were satisfactory, but could be better.
In this sector Fugro plays a leading role worldwide, in
terms of both technology and expertise, which means
considerable added-value for the client. Towards the end
of 2005 the streamlining of this business unit was
completed, which also improved the geographical focus.
In the coming years this Fugro core activity will be further
developed with new technologies and services.
In 2005, the activities related to Data Solutions (data
management, storage and processing) – a fast-growing
market for oil and gas companies – also developed
positively. Further (international) expansion took place as
a result of new contracts in Norway and the Netherlands.
The goal for the geological service activities is
international and growing organically. Good steps in this
direction were taken with the acquisition of large
contracts in Mexico and Pakistan and the opening of a
service centre in Dubai. In the area of non-exclusive data
and studies good growth was achieved in a healthy
market.
A i r b o r n e S u r v e y
Fugro has a worldwide presence with its Airborne Survey
activities and, partly because of this, a leading market
position in the regions in which it is active. The (local)
competitors in these regional markets are also active in
niche markets for specific applications.
In 2005 the Airborne Survey activities continued to make
excellent progress in Canada, South America, Africa and
Australia. Thanks to this a higher turnover and a good
result was achieved. The oil and gas industry’s interest in
regional geological mapping using airborne survey is
increasing worldwide. The global demand for minerals
remains high, which means the mining activities
continued to develop energetically.
In Canada there was a high demand for surveys from the
mining industry, partly as a result of the continuing
global demand for minerals and raw materials.
In 2005 there was an improvement in business
development in South America due to increased activities
for the mining and oil and gas industries in Brazil.
In Africa orders were received from, among others, the
World Bank and the EU (including in Niger and Ghana). In
addition, projects started in 2004 were continued in
various countries including Nigeria, Angola and
Madagascar.
In Asia a significant order, which will take four years to
complete, was granted by the Ministry of Mining in Papua
New Guinea.
Australia continued to develop robustly as a result of
activities in the mining industry (uranium, diamonds and
base metals) and in the oil and gas industry.
In 2005 investments in both technological developments
and safety aspects related to Airborne Survey were once
again high. There were further improvements to the
‘Georanger I’ (Unmanned Airborne Vehicle) whereby
airborne measuring is optimised by flying a remotely
controlled aircraft along a pre-programmed route.
The UAV, which is equipped with various sensors, went
into commercial operation in 2005. In addition several
older piston engined aircraft were replaced with modern
twin turbine aircraft. New electromagnetic measuring
equipment was fitted in both helicopters and aircraft.
Fugro occupies a leading position in this global market.
Traditionally the most important market segment for the
Airborne activities is the mining industry: the search for
water (particularly in the Middle East) and surveys for
specific oil companies are new markets. Fugro can carry
out soil and rock surveys from the air for far lower costs
and in places where it would be difficult to do so from the
ground. This business unit, along with other Fugro
companies, utilises the growth opportunities offered by
synergy and (technological) cooperation within and
outside the Geoscience division.
47

G e n e r a l
Fugro sets great store by achieving a balance between the
interests of its various stakeholders. Enterprise, integrity,
openness and transparent management as well as good
supervision of the management are the starting points for
Fugro’s Corporate Governance policy. The Company also
endeavours to treat social interests with respect.
A p p r o v a l b y t h e A n n u a l G e n e r a l M e e t i n g
o f S h a r e h o l d e r s
Fugro complies with the Dutch Corporate Governance
Code. Fugro’s Corporate Governance was approved by the
Annual General Meeting of Shareholders of 19 May 2004.
The Company’s Articles of Association were amended
accordingly on 3 September 2004. During the meeting of
19 May 2005 the amalgamation of the Remuneration and
Nomination Committee, and the Chairmanship of the
Committee were approved. All the underlying
documentation, including the relevant rules and
regulations and the Articles of Association and the
Administrative Conditions of Stichting
Administratiekantoor Fugro, are published on the
Company’s website: www.fugro.com under Corporate
Governance.
T h e m a i n p o i n t s o f t h e C o r p o r a t e
G o v e r n a n c e S t r u c t u r e
Fugro applies the major part of the principles and
provisions of the Code, in so far as they are applicable,
with the following explanations.
Best practice provision II.1.1
The duration of the existing employment contract with
Mr. K.S. Wester deviates from this provision. This contract
was signed before the Code came into force. Fugro cannot
rescind rights that have been granted.
Best practice provision II.2.6
It has been decided to apply the notification obligation to
stocks in listed companies which operate in the same
area, or a related area, as the Company. While on the one
hand this does restrict the working of the provision it
does, on the other hand, extend the working to include
competing companies or clients listed on foreign
exchanges.
Best practice provision II.2.7
The employment agreement with Mr. K.S. Wester does not
include agreements regarding termination recompense.
This means that general Labour Law provisions are
applicable. Fugro does not intend to amend the existing
employment agreement.
Best practice provision III.3.5
The duration of the appointment of Mr. F.H. Schreve does
not comply with the condition laid down in this
provision. He was reappointed as a member of the
Supervisory Board by the Annual General Meeting of
Shareholders before the Code came into force.
Principle III.5
On 19 May 2005 the Remuneration Committee and the
Nomination Committee were amalgamated into one
committee that carries out the tasks in both areas.
Separate Remuneration and Nomination committees
(with separate meetings) has proven impractical due to
the fact that the Supervisory Board is small and three of
its members are not resident in the Netherlands.
Best practice provision III. 5.11
The Chairmanship of the Remuneration and Nomination
Committee is now carried out by the Chairman of the
Supervisory Board. In the Supervisory Board’s opinion this
Committee should be chaired by a Dutch national.
In view of the current composition of the Board and the
individual expertise of its members, the current
Chairman of the Supervisory Board has been chosen.
Principle IV.2
Maintaining its operational independence is crucial for
Fugro (see page 49 for the reasons for this). One of the
ways to safeguard this independence is to issue
certificates (depository receipts) of shares. The issuing
of share certificates is, therefore, considered by Fugro
to be a necessary protective measure. When Stichting
Administratiekantoor Fugro exercises its voting rights,
the criteria that is used is that the interests of the
Company, its associated companies and all others
involved are safeguarded in the best possible way.
Best practice provision IV.2.1
In deviance with this provision, the Administrative
Conditions of Stichting Administratiekantoor Fugro do
not stipulate in which instances and under what
C o r p o r a t e G o v e r n a n c e
48

conditions certificate holders may ask the Administrative
Office to convene a meeting, with the exception in respect
of the recommendation rights regarding the nomination
of a member of the Stichting’s Board (see the explanation
of Best practice provision IV.2.2).
Best practice provision IV.2.2
As a consequence of Best Practice Provision IV.2.2, the
Board of Stichting Administratiekantoor Fugro has
decided that certificate holders representing at least 15%
of the issued share capital in the form of certificates may
request that a meeting of certificate holders is convened
in order to make a recommendation regarding the
nomination of a member of the Stichting’s Board.
Best practice provision IV.2.8
Stichting Administratiekantoor Fugro’s regulations
include a provision regarding the granting of a proxy to
exercise the right to vote to holders of share certificates.
The proxy may, however, be limited, excluded or recalled
in the instances stated in the Administrative Conditions
of Stichting Administratiekantoor Fugro. This is in
accordance with the legal regulation that came into force
on 1 October 2004.
C o m p l i a n c e w i t h a n d o b s e r v a t i o n
o f t h e C o d e
In the 2005 financial year Fugro complied with its
Corporate Governance Code. In particular the Board of
Management deems that the Company has complied with
Best Practice Provisions II.3.2 to II.3.4 inclusive and III.6.1
to III.6.3 inclusive. No transactions have taken place in
which (potentially) conflicting interests of material
substance related to Board members or Supervisory Board
members have played a part. No transactions in the
context of Best Practice Provision III.6.4 have taken place.
Fugro will present every substantial amendment to its
Corporate Governance to the Annual General Meeting of
Shareholders for discussion.
P r o t e c t i v e m e a s u r e s
When carrying out assignments Fugro can have access to
clients’ extremely confidential information. For this
reason Fugro can only carry out its activities if it can
safeguard its independence in relation to its clients. The
centre of gravity of Fugro’s protection against an
unwanted take-over rests on the one hand on the issuing
of certificates of ordinary shares and, on the other hand,
on the possibility of issuing protective cumulative
preference shares. In addition, protective preference
shares may also be issued by the Fugro subsidiaries Fugro
Consultants International N.V. and Fugro Financial
International N.V. and to Stichting Continuïteit Fugro
(see page 50).
The protective measures are primarily intended to
safeguard Fugro’s independence in relation to its clients.
Only share certificates not entitled to voting rights are
listed and traded on Euronext N.V. in Amsterdam. The
restricted convertible certificates are issued by Stichting
Administratiekantoor Fugro and the Stichting’s
management exercises the voting rights of the underlying
shares in such a way that the interests of the Group, its
associated companies and all stakeholders are
safeguarded as far as is possible. For the composition of
the Management of the Stichting Administratiekantoor
Fugro see page 129.
Certificate holders:
• May, after the timely deposition of their certificates,
attend and speak at shareholders’ meetings;
• Are entitled to request from the Administratiekantoor
a proxy to exercise the right to vote for the shares that
underlie their certificates. The Board of the
Administratiekantoor may only limit, exclude or recall
this proxy if:
a) a public bid for the (certificates of) shares in Fugro
N.V. has been announced or issued or there is a
reasonable expectation that this will occur, without
the consent of the Company:
b) 25% or more of the subscribed capital of the
Company is held by one holder of (certificates of)
shares or by a number of holders collaborating on
the basis of a mutual agreement, or:
c) exercising the right to vote may, in the opinion of
the Administratiekantoor, conflict with the overall
interests of the Company;
• May, as long as they are natural persons, exchange
their certificates for ordinary shares up to a maximum
of 1% of the share capital per shareholder.
Any issuing of protective preference shares will be carried
out by Stichting Beschermingspreferente Aandelen Fugro.
On 19 May 2004 the Annual General Meeting of
Shareholders designated (for the most recent time) the
Board of Management of Fugro as the body which, for the
49

period until 19 May 2007 is authorised, with the approval
of the Supervisory Board, to: issue and/or grant rights to
acquire all preference shares – by which is understood
both protective preference shares and financing
preference shares – and ordinary shares in the subscribed
capital and, limit or exclude the priority rights on shares
to be issued. If no option agreement between Fugro and
Stichting Beschermingspreferente Aandelen Fugro has
been signed and the threat of an unwanted take-over is
such that an immediate issue of preference shares by
Stichting Beschermingspreferente Aandelen Fugro is
advisable, the Board of Management should, on the basis
of its appointment as the body authorised to issue shares,
with the approval of the Supervisory Board, decide to
issue preference shares.
The objective of Stichting Beschermingspreferente
Aandelen Fugro is the promotion of the interests of Fugro
and the companies maintained by Fugro as well as the
companies in the Fugro Group, in such a way that the
interests of Fugro and of all involved with Fugro are
safeguarded in the best possible manner and influences
which could damage the independence and/or continuity
and/or the identity of Fugro and its associated companies
to the detriment of those interests are prevented as far as
possible, as is the execution of anything that is related to
or could be beneficial to the above. The options on
protective preference shares granted to Fugro
Consultants International N.V. and Fugro Financial
International N.V. were approved by the Annual general
Meeting of Shareholders in 1999. The objective of
Stichting Continuïteit Fugro is the same as that of
Stichting Beschermingspreferente Aandelen Fugro.
The protective measures described above will, especially
in a take-over situation, be put into effect when this is in
the interests of protecting the confidentiality of clients’
data, safeguarding Fugro’s independence and defining
Fugro’s position in relation to that of the aggressor and
the aggressor’s plans and will create the possibility of
seeking the necessary alternatives. The protective
measures will not be put into effect to protect the Board
of Management’s own position. Due to the uncertainty
regarding the situations with which Fugro could be
confronted, the use of the protective measures in
circumstances other than those described above cannot
be discounted.
50
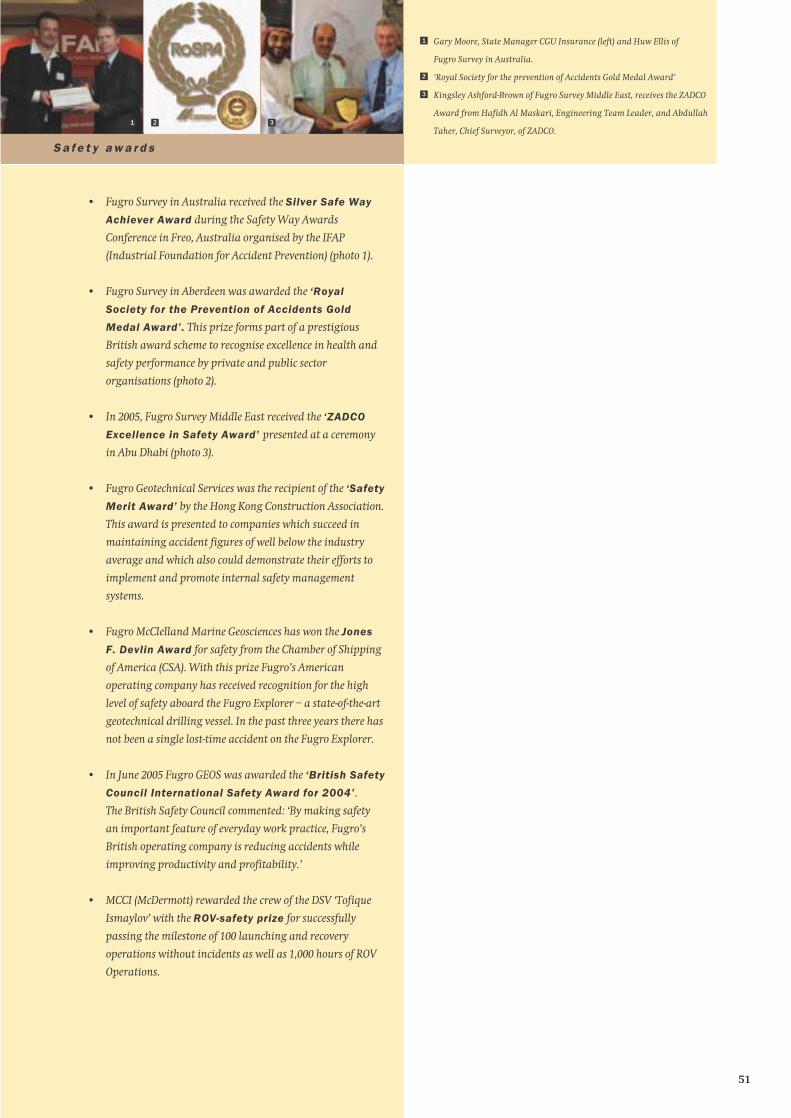
• Fugro Survey in Australia received the Silver Safe Way
Achiever Award during the Safety Way Awards
Conference in Freo, Australia organised by the IFAP
(Industrial Foundation for Accident Prevention) (photo 1).
• Fugro Survey in Aberdeen was awarded the ‘Royal
Society for the Prevention of Accidents Gold
Medal Award’. This prize forms part of a prestigious
British award scheme to recognise excellence in health and
safety performance by private and public sector
organisations (photo 2).
• In 2005, Fugro Survey Middle East received the ‘ZADCO
Excellence in Safety Award’ presented at a ceremony
in Abu Dhabi (photo 3).
• Fugro Geotechnical Services was the recipient of the ‘Safety
Merit Award’ by the Hong Kong Construction Association.
This award is presented to companies which succeed in
maintaining accident figures of well below the industry
average and which also could demonstrate their efforts to
implement and promote internal safety management
systems.
• Fugro McClelland Marine Geosciences has won the Jones
F. Devlin Award for safety from the Chamber of Shipping
of America (CSA). With this prize Fugro’s American
operating company has received recognition for the high
level of safety aboard the Fugro Explorer – a state-of-the-art
geotechnical drilling vessel. In the past three years there has
not been a single lost-time accident on the Fugro Explorer.
• In June 2005 Fugro GEOS was awarded the ‘British Safety
Council International Safety Award for 2004’.
The British Safety Council commented: ‘By making safety
an important feature of everyday work practice, Fugro’s
British operating company is reducing accidents while
improving productivity and profitability.’
• MCCI (McDermott) rewarded the crew of the DSV ‘Tofique
Ismaylov’ with the ROV-safety prize for successfully
passing the milestone of 100 launching and recovery
operations without incidents as well as 1,000 hours of ROV
Operations.
S a f e t y a w a r d s
Gary Moore, State Manager CGU Insurance (left) and Huw Ellis of
Fugro Survey in Australia.
‘Royal Society for the prevention of Accidents Gold Medal Award’
Kingsley Ashford-Brown of Fugro Survey Middle East, receives the ZADCO
Award from Hafidh Al Maskari, Engineering Team Leader, and Abdullah
Taher, Chief Surveyor, of ZADCO.
3
2
1
1 2 3
51

T h e s h a r p i n c r e a s e i n o i l p r i c e s m e a n s t h a t g a s i s b e c o m i n g a n
i n c r e a s i n g l y i m p o r t a n t g l o b a l e n e r g y s o u r c e . E x t r e m e c o o l i n g i s
u s e d t o l i q u e f y g a s ( L N G ) s o i t c a n b e t r a n s p o r t e d o v e r l o n g d i s t a n c e s
i n s p e c i a l s h i p s . S p e c i a l i n s t a l l a t i o n s t h a t c o m p l y w i t h e x t r e m e l y
s t r i n g e n t s a f e t y d e m a n d s a r e n e c e s s a r y f o r b o t h l o a d i n g a n d
u n l o a d i n g . P i p e l i n e s c a n b e u s e d t o t r a n s p o r t g a s o v e r s h o r t e r
d i s t a n c e s .
T R A N S P O R T A N D
S T O R A G E
© O
MA
N L
NG
.
Computer simulation is
used to design LNG
shipping facilities.
Fugro’s soil information
and current measurements
have considerable influence
on the final design.
In regions where the sea-bed
is irregular, selecting the right
route for underwater pipelines
so that they are not damaged by
bending is essential.

The liquid gas (LNG) storage tanks must
comply with stringent safety demands.
Fugro has a wide range of inspection and
monitoring techniques in-house with
which to check the condition of these
installations.
As the demand for gas is increasing
so too is the size of the LNG vessels
and the docking, mooring and
processing facilities. These on the
photograph are in the Middle East.
LNG installations are sometimes sited in remote areas such as this – the ‘Brass River’ LNG-project in the
Nigerian rain forest. Fugro’s investigations included determining the load bearing capacity of the soils which
was of vital importance for designing the foundations of the installation.

54
O P E R A T I O N A L
A c t i v i t y p o r t f o l i o
While the core activities show a high degree of cohesion,
they also target highly diverse markets, clients and
regions. A high proportion of the services provided
offshore and by the Development & Production unit are
related to the oil and gas market. Fugro’s dependence on
the cyclic investment in oil and gas exploration has been
reduced in favour of the more stable investments in oil
and gas production. The other activities are dependent on
developments in markets that include infrastructure,
construction and mining. The influence of positive and
negative cyclic effects is moderated by:
• the cohesion between the activities;
• the wide geographical spread;
• the diversity of clients;
• strong market positions, and,
• the size of the Group.
O r d e r s t r e a m a n d p r i c e c h a n g e s
Some of Fugro’s orders are awarded on the basis of long-
term preferred supplier agreements.
Having a large number of clients supports Fugro’s
independence and improves its stability. In the course
of a year Fugro executes many projects for clients.
The projects carried out for any individual client do not,
however, account for more than 4% of total turnover.
To carry out its assignments Fugro has at its disposal
highly trained staff and technically advanced, and
therefore costly, equipment. Much of Fugro’s work
involves short-term orders. Fugro is, to a degree, sensitive
to price changes and sudden changes in exchange rates,
to which the Company can adapt quickly. Fugro’s budgets
are, to a great extent, based on the expected investments
by the oil and gas companies. Substantial fluctuations in
oil prices (up or down) do not lead to rapid changes in
these investments, unless there is a structural drop in
prices to less than USD 30 – 40 per barrel.
R i s k m a n a g e m e n t
F u g r o ’ s l o n g - t e r m r i s k s a r e l i m i t e d d u e t o :
• the wide diversity of highly cohesive activities;
• no client or assignment accounting for more than 4% of Fugro’s total turnover;
• proprietory, state-of-the-art technologies, most of which are developed in house, and professional staff;
• the ability to adjust quickly to exchange rate and price changes due to mainly short contracts;
• a balanced and flexible fleet composition (Fugro owned and chartered);
• short-term loans (EUR 317 million) amounting to only 28% of the balance sheet total;
• limited risk, or no risks related to pension obligations;
• good internal risk management and control systems.
Fugro’s risk management policy is aimed at the long-term sustainable management of its business activities and limiting
or, where possible, appropriate hedging of the risks. Due to Fugro’s wide diversity of markets, clients and regions and its
broad portfolio of activities, quantifying all the existing risks relevant for the Group as a whole is virtually impossible.
Risks are, however, quantified wherever this is possible and useful. This applies in particular to the influence of the US
dollar.
Oil & gas
Construction/infrastructure
Mining
Other
2%
71%
6%
21%
(for the year 2005)
I n d i c a t i o n b r e a k d o w n
t u r n o v e r p e r s e c t o r

C a p a c i t y p l a n n i n g
Fugro is constantly alert for signals that indicate changes
in market conditions so it can react quickly and
efficiently. Sudden and very unexpected changes in
market conditions are, however, always possible. Some of
Fugro’s surveying activities precede investment by clients
and generally take place at the start of the activity or
investment cycle. This means Fugro’s activities can be the
first to be affected by changes in market conditions.
Delays and interruptions in the flow of orders can lead to
temporary losses due to under-utilisation of capacity.
The weather and the availability of vessels are key-factors
for offshore activities. Weather influences are calculated
into the budgets and averaged out over the year and the
regions in which Fugro is active. As far as vessels are
concerned, Fugro’s objective is a balanced fleet in which
around half the vessels are owned by the Company,
around 35% are chartered on a long-term basis and the
remaining 15% are chartered on a project basis.
The exchange of manpower and equipment between
the various business units results in increased capacity
utilisation.
F I N A N C I A L
B a l a n c e s h e e t
Fugro follows an active policy to optimise its balance
sheet ratios and thus limit financial risks and maintain
the Company’s long-term financial solvency. Being
quoted on the stock exchange provides a very worthwhile
contribution towards achieving the Company’s (financial)
targets and enables Fugro to make a well considered
selection of the optimum financing mix when, for
example, involved in an acquisition process.
Future interest rate risks are limited to short-term loans.
The Company’s objective is to limit the effect of interest
rate changes on the results. At the moment of closing
both the interest rate risk and the currency risk of the
Private Placement, expressed in USD, were fully hedged
for the full term.
Off balance sheet constructions are avoided, with the
exception of charters of a number of vessels, as part of
normal business. Software, whether purchased or
developed in-house, is not capitalised on the balance
sheet with the exception of substantial external
expenditure for software packages related to
administrative and technical applications. The seismic
and geological database is reduced quickly and
55
E x c h a n g e
r a t e s ( i n E U R )
31 December 2005
30 June 2005
31 December 2004
30 June 2004
31 December 2003
30 June 2003
31 December 2002
30 June 2002
31 December 2001
30 June 2001
GBPaverage
1.46
1.47
1.47
1.49
1.45
1.46
1.59
1.61
1.62
1.62
GBPend ofperiod
1.46
1.49
1.42
1.49
1.42
1.45
1.53
1.54
1.64
1.66
USDaverage
0.81
0.78
0.81
0.82
0.88
0.90
1.06
1.11
1.13
1.13
USDend ofperiod
0.85
0.83
0.73
0.82
0.79
0.88
0.95
1.00
1.13
1.18
USD
GBP
48%
12%
29%
11%
USD related
EUR and other
(for the year 2005)
I n d i c a t i o n b r e a k d o w n
t u r n o v e r p e r c u r r e n c y

systematically with an average term of less than 2.5 years.
Research costs are charged directly to the results.
A portion of these costs is accounted for as project-related
turnover costs. Fugro has evaluated the book value of its
assets, including goodwill, within the framework of its
normal balance sheet evaluation. This evaluation has
shown that no extraordinary depreciation of any of these
assets is necessary.
C u r r e n c y e x c h a n g e r a t e c o n v e r s i o n
Fugro limits its susceptibility to changes in foreign
currency exchange rates but is not immune to exchange
rate losses caused by rapid changes in the rates and
exchange rate differences. As most of Fugro’s income in
local currencies is used for local payments, the effect of
negative or positive currency movements on operational
activities at a local level is minimal. Fugro’s international
monetary streams are limited and, like the receivables
and liabilities, are generally in US dollars or dollar related
currencies.
Where possible and desirable forward exchange contracts
are signed (at a local level). The major factor with which
Fugro has to contend is translation effects. In addition,
rapid and radical changes in exchange rates can influence
the balance sheet and profit and loss account, partly due
to the duration between submitting quotes and the
(delayed) awarding of orders during which period forward
exchange contracts would not be appropriate. This
creates an additional foreign currency risk which cannot
be quantified in advance. The optimisation of the use of
forward exchange contracts is paid constant attention.
P e n s i o n p r o v i s i o n s
Fugro operates pension schemes for its staff in accordance
with regulations and customs in each of the countries in
which the Company operates. Since 1 January 2005, Fugro
has operated an average salary scheme in the
Netherlands. Under IFRS this is classified as a ‘defined
benefit’ scheme. In the Netherlands the pension
commitments are fully re-insured on the basis of a
guarantee contract. The accrued benefits are fully
financed.
In the United States Fugro has a 401K system for its staff.
Fugro contributes towards the deposits of its staff in
accordance with agreed principles and taking the
regulations of the American tax authorities – the IRS –
into account. This system is free of risk for Fugro.
In the UK Fugro operates a number of pension schemes.
The only pension schemes open for new staff are defined
contribution schemes. There is one defined benefits
scheme which remains open for long serving staff and
there are other defined benefit schemes which have been
closed but have ongoing liabilities to their members.
Measures have been taken that the reserves needed to
honour current and past defined benefit scheme
arrangements are available when required.
In the other countries where Fugro has organised
retirement provisions for its staff obligations arising from
these provisions are covered by items included in the
balance sheet of the relevant operating companies.
I n s u r a n c e a n d l e g a l r i s k s
Fugro is insured against a number of risks. Risks related
to occupational liability, general liability and equipment
are covered at a Group level. Risks related to equipment
are insured at a local level. In addition, adequate cover
for aspects related to normal business operations, such
as the vehicle fleet, medical insurance and buildings, is
arranged at a local level. Several operating companies are,
within the context of normal business operations,
involved in claims either as the claimant or the
defendant. Based on developments thus far, Fugro’s
financial position is not expected to be noticeably
influenced by any of these actions.
I N T E R N A L S Y S T E M S
G e n e r a l
Constant monitoring of its markets and its operational
and financial results is intrinsic to Fugro’s modus
operandi due to the generally short-term nature of its
assignments. Clarity and transparency are an absolute
must for assessing and evaluating risks. These are
fundamental characteristics of the Fugro culture.
Due to the wide variety of markets, clients and regions
and Fugro’s extensive activity portfolio the operating
company management is responsible for the application,
fulfilment and monitoring of the internal systems.
The monitoring systems are embedded within the
internal control framework described below.
56

C o r p o r a t e H a n d b o o k
Fugro’s Corporate Handbook contains precise
instructions for, among other aspects, risk management.
F i n a n c i a l H a n d b o o k
This contains detailed guidelines for the financial
reporting.
P l a n n i n g
The business plans of every unit are translated into
budgets. Adherence to the budgets is checked on a
quarterly basis. The operating company managements
must report immediately any unforeseen circumstances
that arise, or any substantial deviation from the budgets,
to the responsible member of the Executive Committee
and the Board. The monthly reports the operational
management submits to the Holding Company include
an analysis of the achievement of the approved plans.
A u t h o r i s a t i o n l e v e l
Managers are bound by clear restrictions regarding
representative authorisation. Projects and contracts with
value or risks that exceed specified amounts must be
approved by either Regional Managers or by either the
responsible member of the Executive Committee or the
Board as appropriate.
L e t t e r o f r e p r e s e n t a t i o n
Every six months all operating company managing
directors and the responsible member of the Executive
Committee sign a detailed statement related to the
financial reporting/internal control.
I n t e r n a l A u d i t
Additional internal audits are carried out by the Holding
Company regularly and frequently. The findings are
reported directly to the Board of Management.
P e e r r e v i e w s
In addition, regular so-called peer reviews are also carried
out whereby an operating company is investigated by a
team from other operating companies. The results are
reported directly to the Executive Committee.
A u d i t C o m m i t t e e
The Audit Committee, which comprises three members of
the Supervisory Board, ensures an independent
monitoring of the risk management process from the
perspective of its supervisory role. The Audit Committee
focuses on the quality of the internal and external
reporting, the effectiveness of the internal controls and
on the functioning of the internal and external auditors.
E x t e r n a l a u d i t s
The annual accounts of Fugro N.V. and subsidiaries are
checked regularly by external auditors on the basis of
International Standards of Auditing.
A d v i s o r y r o l e s
The external auditor fulfils no advisory roles (except for
due diligence projects and activities relating to the
annual accounts). These roles are fulfilled by using third
party experts in fields such as tax and insurance.
W h i s t l e - b l o w e r ’ s r e g u l a t i o n
Fugro operates a Whistle-blower’s regulation.
The objective is to ensure that a possible infringement
of the policy and procedures can be reported without
the reporting having any adverse consequences for
the ‘whistle-blower’.
D e c l a r a t i o n
The Board believes that the internal risk management
and control systems as described above provide a
reasonable level of assurance that the financial
statements do not include any material misstatements
and that these systems operated properly during the year
under review. The Board has no indication that these
systems shall not operate properly in the current year.
No substantial changes to these systems were introduced
during the 2005 financial year and no significant changes
are currently expected.
57

L i s t i n g o n t h e s t o c k e x c h a n g e
Fugro share certificates (depository receipts of shares) are
listed on Euronext N.V. in Amsterdam. Since 4 March 2002
Fugro has been included in Euronext’s Amsterdam
Midkap-index (AMX), with an estimated weighting factor
on 1 March 2006 of approximately 6% of the index.
The market capitalisation of the Company at the end of
February 2006 amounts to over EUR 2 billion. Since 8 July
2002, Fugro share (certificate) options have also been
traded on Euronext Amsterdam Derivative Markets. Since
May 2005 the convertible debenture bond, which expires
on 27 April 2010, has been traded on the stock exchange.
In 2005 trading in Fugro share certificates was stimulated
by four liquidity providers.
As far as is known, 76% of the certificates are held by
foreign investors, mainly from the United Kingdom and
the United States.
Information per share can be found on pages 6 and 7
(key figures) and on pages 60, 102 and 103.
D i v i d e n d p o l i c y
Fugro strives for a pay-out ratio of 35 to 55% of the net
result under the IFRS regulations. The shareholder may
choose between a dividend entirely in cash or entirely in
(certificates of) shares charged to the reserves. In 2005
around 51% of the shareholders opted to receive the
dividend for 2004 in (certificates of) shares (in 2004: 65%).
735,740 shares have been issued for this purpose.
A g e n d a s h a r e h o l d e r s m e e t i n g
The Agenda of the shareholders meeting will be published
as a pdf-document on our website www.fugro.com.
Hard copies of the agenda can be ordered by telephone
(+31 70 311 14 22) or by e-mail ([email protected]).
I n f o r m a t i o n f o r s h a r e h o l d e r s
58
10 March 2006
10 May 2006, 14.00 hrs
12 May 2006
26 May 2006
31 May 2006 (after trading hours)
2 June 2006
23 June 2006
11 August 2006
24 November 2006
9 March 2007
I m p o r t a n t d a t e s
Publication of the 2005 Annual Report, press conference with webcast,
analysts’ meeting with conference call facility and webcast
Annual General Meeting of Shareholders in Leidschendam, Green Park Hotel,
dual language webcast (Dutch and English)
Ex-dividend date
Latest date for notification of dividend preference
Determination and publication of the optional dividend in (certificates of)
shares, based on the average share price at the close of business on the stock
exchange on 29, 30 and 31 May
Payment of the 2005 dividend
Press release regarding developments in the first half of 2006
Publication of 2006 half-yearly result and announcement of profit forecast for
2006, press conference with webcast, analysts’ meeting with conference call
facility and webcast
Press release regarding developments in the second half of 2006
Publication of the 2006 annual results, press conference with webcast,
analysts’ meeting with conference call facility and webcast
C h a n g e i n i s s u e d
s h a r e
Issued on 1/1
Optional dividend
Conversion of subordinated
convertible bond
Issued on 31/12
Purchased for option plan
at 31/12
Entitled to dividend
as of 31/12
Average number of
outstanding shares
Maximum issue through
convertible loan
2004
60,663,648
1,527,908
–
62,191,556
1,641,604
60,549,952
59,358,920
6,229,560
2005
62,191,556
735,740
5,897,896
68,825,192
938,696
67,886,496
65,976,492
5,154,640

S h a r e / c e r t i f i c a t e h o l d i n g s
o f m o r e t h a n 5 %
In February 2006 the following share/certificate holders
with a holding of 5% or more were known to Fugro:
ING Verzekeringen N.V. (incl. certificates) 9.50%
Woestduin Holding N.V. (shares) 6.23%
Stichting Administratiekantoor Fugro (shares) 87.27%
R e m o t e v o t i n g b y p r o x y n o t p o s s i b l e
Within the limits specified in the Articles of Association,
Fugro allows proxy voting for shareholders and certificate
holders during an Annual General Meeting of
Shareholders. As soon as the relevant legislation comes
into force Fugro will consider whether it will make use of
the available options regarding remote voting and
electronic voting.
59
M o v e m e n t s t o s h a r e s
p u r c h a s e d f o r o p t i o n
p l a n
Situation on 1/1
Purchased
Exercised
Situation on 31/12
Granted, not exercised options
as of 31/12
A t t e n d a n c e
a t A G M s
AGM 19 May 2005*
AGM 15 May 2004*
AGM 15 May 2003*
AGM 17 May 2002
AGM 10 May 2001
AGM 10 May 2000
AGM 12 May 1999
* Certificates with voting authorisation (see page 134).
2005
1,641,604
92
(703,000)
938,696
5,351,200
2004
2,355,448
60,876
(774,720)
1,641,604
4,962,400
Shares (incl. SAF)
16,572,975
14,506,664
13,749,493
13,836,939
12,020,618
11,757,075
11,892,593
Certificates
4,007,242
1,882,628
439,486
191,814
5,546
35,190
711,959
% ofsubscribed
capital
99.4%
99.4%
99.6%
96.8%
95.0%
93.2%
92.6%
0
6
12
18
24
30
0
3,000
6,000
9,000
12,000
15,000
2000 2001 2002 2003 2004 2005
C e r t i f i c a t e p r i c e a n d v o l u m e t r e n d
Highest and lowest closing-prices per month in Euros,
(bar diagram, scale left).
Share trade volume per month (x 1,000),
(line diagram, scale right).
(January 2000 – December 2005)
Source: Datastream

2005
2.67
1.51
0.48
31
2004
2.12
0.83
0.48
54
2003
1.39
0.33
0.46
83
2002
2.08
1.26
1.05
0.46
37
44
2001
1.98
1.16
1.06
0.40
34
38
60
%year-end
2005
19.1
1.2
0.5
1.1
12.1
3.6
16.1
22.2
24.1
100.0
S a f e g u a r d i n g F u g r o ’ s i n d e p e n d e n c e
When carrying out assignments Fugro may have access to
clients’ extremely confidential information. This means
Fugro can only carry out its activities whilst its
independence can be guaranteed. For this reason, the
shareholders have, in the past, approved several
safeguards. Please see page 48 with regard to Corporate
Governance.
P a r t i c i p a t i o n s a n d o p t i o n s
As far as is known, on 31 December 2005 around 8% of
Fugro’s shareholders’ equity (and an unknown number of
certificates) were held by directors and staff as well as
5,351,200 options.
Of all the options issued from 1999 to 2005, on
31 December 2005 80% were still outstanding. These
options give rights to 5,351,200 (certificates of) shares.
On 31 December 2005 1,155,000 new options (exercise
price EUR 27.13 commencing date 1 January 2006) were
granted to a total of 521 people. Of these options 28% were
granted to the Board of Management of Fugro. See also
page 114.
(x EUR 1.–)
D a t a p e r s h a r e
Cash flow
Net result before amortisation of goodwill
Net result
Dividend
Dividend/net result before amortisation of goodwill (%)
Dividend/net result (%)
0
14,000
28,000
42,000
56,000
70,000
The Netherlands
United Kingdom
United States
France
Germany
Luxembourg
Belgium
Switzerland
Other
End ’05End ’04End ’03End ’02End ’01End ’00End ’99End ’98End ’97End ’96
(x 1,000)
D i s t r i b u t i o n o f s h a r e h o l d e r s

61
Option rights are granted to an extensive group of
employees. The granting of option rights is dependent on
the achievement of the targets of the Group in total and of
the individual operating companies. The individual
performance of the relevant employee is also taken into
consideration when deciding the number of option rights
to be granted.
Staff options are granted for an exercise price that is
equal to the stock exchange value of the certificates at the
end of the year. Since 2000 the annually issued options
have had an exercise period of six years. The exercise of
options within the first three years is financially very
unattractive for residents of the Netherlands and not
permitted for foreign option holders.
In 2005, the number of share certificates re-purchased by
Fugro was 92 at an average price of EUR 17.31.
At 31 december 2005 Fugro held 938,696 shares for the
purpose of the option scheme and are not entitled to
dividend. The exercise of options outstanding at the end
of 2005, including the options granted in December,
could – after using the re-purchased shares – lead to the
issued share capital being increased, in phases, by a
maximum of 6.4%. Since the beginning of 2006 83,800
options have been exercised.
I n v e s t o r R e l a t i o n s
In addition to the dates listed in the agenda,
presentations for analysts and investors are given every
year, particularly during the months of March/April and
August/September. During these presentations Fugro’s
strategy and activities are explained in detail by members
of the Board. In 2005 investors in many financial centres
around the world were visited. Individual and collective
personal contact with investors and analysts is also
maintained via one-on-one meetings (in 2005 over 300),
presentations and telephone conferences. Fugro also
offers information via its website: www.fugro.com.
On 3 November 2005, Fugro’s 2004 Annual Report was
awarded the Henri Sijthoff Prize for Mid and Smallkap
funds. Fugro had been nominated for this prize in each of
the three preceding years. The Henri Sijthoff Prize is
awarded annually to companies that stand out positively
through their public information and financial reporting.
P r e v e n t i o n o f m i s u s e o f i n s i d e r
i n f o r m a t i o n
Fugro considers the prevention of misuse of insider
information when trading in its stock to be essential to its
relationship with the outside world. Regulations to
prevent the misuse of inside information, in accordance
with the Supervision of Stock Transactions Act, are in
force within Fugro. Fugro has appointed a Compliance
Officer for many years.
O t h e r i n f o r m a t i o n
An interactive version of the Annual Report is available on
the website www.fugro.com. This version includes
extensive search functions.
More information about Fugro shares is available on the
website www.fugro.com. Fugro can be contacted via
e-mail: [email protected] and by telephone ( + 31 70 311 14 22).
0
50
100
150
200
250
AMX
Fugro
20022001 2003 2004 2005
D e v e l o p m e n t F u g r o s h a r e s a n d A M X i n d e x (January 2001 = 100)

62
F u g r o ’ s i n v o l v e m e n t i n s o c i e t y i s r e f l e c t e d
i n i t s s p o n s o r s h i p p o l i c y t h r o u g h w h i c h
F u g r o c o n t r i b u t e s t o w a r d s t h e p r e s e r v a t i o n
o f c u l t u r a l h e r i t a g e s u c h a s t h e H e r m i t a g e
i n A m s t e r d a m , t h e A m s t e r d a m ’ s C o n c e r t -
g e b o u w a s w e l l a s , f o r e x a m p l e , t h e s e a -
g o i n g t u g b o a t ‘ H o l l a n d ’ . C l a s s i c a l m u s i c ,
e d u c a t i o n a n d o t h e r s o c i a l g o a l s o c c u p y
a p r o m i n e n t p l a c e i n F u g r o ’ s s p o n s o r s h i p
p o l i c y .
F u g r o ’s c o n t r i b u t i o n s t o s o c i e t y
S e a - g o i n g t u g b o a t ‘ H o l l a n d ’
The sea-going tug ‘Holland’, built in 1951, has had an
illustrious history in which it has carried out around
200 notable rescues. Fugro supports the Foundation
that wants to maintain, renovate and exploit this
vessel as a sailing legacy.
S c h o l a r s h i p
Fugro is a knowledge-intensive company employing well
educated and trained staff. The Company wants to
motivate young people to follow technical courses. This is
why in 2005 Fugro established a scholarship for talented
students at the University of Port Harcourt, Nigeria.
The annual scholarship is awarded to the technical
student who has achieved the best overall marks in the
year-three examinations.
The Residentie Orkest performing in Concertgebouw Amsterdam
T h e R e s i d e n t i e O r k e s t
Fugro has been one of the main sponsors of the
Residentie Orkest, which celebrated its centenary
in 2000. At Fugro’s request, in October 2005,
this prominent orchestra left its home base in the
Dr Anton Philipszaal in The Hague to perform – with
Jaap van Zweden as Honorary Guest Conductor –
in Amsterdam’s Concertgebouw during the get-
together on the occasion of the retirement of
President and Chief Executive Officer G-J. Kramer.
T h e C o n c e r t g e b o u w i n A m s t e r d a m
The Concertgebouw in Amsterdam is one of the
world’s most famous concert halls and is renowned
for its perfect acoustics. Completed in 1888, the
Concertgebouw has been the Netherlands’ centre of
classical music for over a century. Fugro sponsors
special concerts in the Concertgebouw. This year
Fugro has also made a financial contribution towards
the production of a CD with performances of Mozart
works by the Koninklijk Concertgebouw chamber
orchestra.

I n 2 0 0 5 F u g r o o n c e a g a i n r e c e i v e d s e v e r a l
a w a r d s . T h e C o m p a n y s e e s e v e r y a w a r d a s
a r e c o g n i t i o n o f t h e d e d i c a t i o n w i t h w h i c h
F u g r o ’ s s t a f f c o n t r i b u t e t o w a r d s t h e
C o m p a n y ’ s f u r t h e r d e v e l o p m e n t . A m o n g t h e
m o r e n o t a b l e a w a r d s r e c e i v e d b y F u g r o i n
t h e p a s t y e a r w e r e :
‘ H e n r i S i j t h o f f - P r i j s 2 0 0 4 ’
( T h e N e t h e r l a n d s )
Fugro won the Henri Sijthoff-Prijs for the best financial
reporting over 2004 in the ‘Mid and Smallcap’ category.
The Henri-Sijthoff-Prijs is awarded annually by Het
Financieele Dagblad (financial daily newspaper) to
companies which stand out favourably through the
high quality of their public information and financial
reporting. Jury member Prof. J. Frijns: ‘It is a full and
orderly report that provides extensive insight into the
Company’s goals and strategy and that includes clear,
quantified information per division.’ The jury was also
very appreciative of the quality of the annual accounts
and, in particular, the clear way in which the IFRS link
was presented.
‘ B u s i n e s s o f t h e y e a r
2 0 0 5 ’ ( C a n a d a )
During the Annual Lunch of the
Dutch-Canadian Chamber of
Commerce which took place on
Canada Business Day in Rotterdam,
Fugro was proclaimed the winner of
the Business of the year 2005 award.
Fugro earned the honorary title
because over the past few years it
has successfully established or
acquired eleven companies in
six Canadian provinces that have
developed new technology in
Canada.
‘ A n g l o - D u t c h A w a r d
f o r E n t e r p r i s e ’
( U n i t e d K i n g d o m )
Fugro’s British operating
company, Fugro Survey Limited,
was proclaimed the winner
of the Anglo-Dutch Award
for Enterprise by the NBCC
(Netherlands British Chamber
of Commerce). This award is
given to companies which, in
the opinion of the NBCC,
have contributed successfully
towards British-Dutch trade
relationships.
‘ A l a s k a S u r v e y p r o j e c t o f t h e y e a r ’
( U S A )
The Alaska Surveying and Mapping Conference
Committee honoured Fugro Pelagos, Inc. with the
‘2005 Alaska Survey Project of the year-award’.
This prize is a recognition of the innovative manner
in which Fugro has contributed towards the nautical
charting of the Sitka region – a complex area of
islands and rugged coastlines for which no sea chart
was available. The survey was commissioned by the
National Oceanic and Atmospheric Administration
(NOAA) and carried out using both laser technology
and echo-sounding systems.
F u g r o t a k e s t h e p r i z e
63
K.S. Wester (in the middle), President
and CEO of Fugro, receives the award
from Mr W.F. Dutilh, Chairman of the
NCCC, and Her Excellency Mrs Colleen
Swards, Canada’s Ambassador to the
Netherlands.
Bob Richards, Vice President Alaska
Division and Jana Lage, projects and
logistics manager of Fugro Pelagos.
G-J. Kramer and Prof. J. Frijns

64

A n n u a l A c c o u n t s 2 0 0 5
F U G R O N . V .
1 Consolidated income statement 66
2 Consolidated statement of
recognised income and expense 67
3 Consolidated balance sheet 68
4 Consolidated statement of cash flows 69
5 Notes to the consolidated financial
statements 71
6 Subsidiaries and Associates of Fugro N.V. 116
7 Company balance sheet 120
8 Company income statement 121
9 Notes to the company financial statements 122
10 Other information 128

(EUR x 1,000)
(5.25) Revenue
(5.28) Third party costs
Net revenue own services
(5.29) Other operating income
(5.30) Personnel expenses
(5.35) Depreciation
(5.36) Amortisation
(5.31) Other operating expenses
Operating profit before financing costs (EBIT)
Financial income
Financial expenses
(5.32) Net financing costs
(5.38) Share of profit of associated subsidiaries
Profit before tax
(5.33) Income tax expense
Profit for the period
Profit for the period attributable to:
Equity holders of the parent
Minority interest
Profit for the period
(5.45) Basic earnings per share (EUR)
(5.45) Diluted earnings per share (EUR)
1 C o n s o l i d a t e d i n c o m e s t a t e m e n tFor the year ended 31 December
2004
1,008,008
(364,644)
643,364
16,540
(331,623)
(66,139)
(7,078)
(150,828)
104,236
2,391
(34,237)
(31,846)
139
72,529
(19,944)
52,585
49,317
3,268
52,585
0.83
0.82
2005
1,160,615
(405,701)
754,914
9,661
(361,002)
(69,445)
(5,318)
(184,740)
144,070
718
(16,953)
(16,235)
240
128,075
(26,745)
101,330
99,412
1,918
101,330
1.51
1.40
66

2004
(25,179)
2,330
(2,153)
(6,339)
–
(2,167)
(33,508)
52,585
19,077
17,218
1,859
19,077
2005
36,884
4,023
3,891
(2,062)
8,710
(167)
51,279
101,330
152,609
151,610
999
152,609
(EUR x 1,000)
Foreign exchange translation differences (incl. minority interests)
Stock option costs for employees (net of tax)
Actuarial gains and losses on pensions (net of tax)
Cash flow hedges:
Effective portion of changes in fair value (net of tax)
Issue of convertible loan
Other movements
Net result recognised directly in equity
Profit for the period
Total result for the period
Attributable to:
Equity holders of the parent
Minority interest
Total recognised income and expense for the period
2 C o n s o l i d a t e d s t a t e m e n t o f r e c o g n i s e d i n c o m e a n d e x p e n s eFor the year ended 31 December
67

(EUR x 1,000)
A s s e t s
(5.35) Property, plant and equipment
(5.36) Intangible assets
(5.38) Financial fixed assets
(5.40) Deferred tax assets
Total non-current assets
(5.41) Inventories
(5.42) Trade and other receivables
Income tax receivables
(5.43) Cash and cash equivalents
Total current assets
Total assets
E q u i t y
Issued and paid-in capital
Share premium
Reserves
Unappropriated result
Total equity attributable to equity holders of the parent
Minority interests
(5.44) Total equity
L i a b i l i t i e s
(5.46) Interest-bearing loans and borrowings
(5.47) Employee benefits
(5.48) Provisions
(5.40) Deferred tax liabilities
Total non-current liabilities
(5.43) Bank overdraft
(5.46) Interest-bearing loans and borrowings
(5.49) Trade and other payables
(5.48) Provisions
Other taxes and social security charges
Income tax payable
Total current liabilities
Total liabilities
Total equity and liabilities
3 C o n s o l i d a t e d b a l a n c e s h e e tAs at 31 December
2004
232,956
293,991
9,287
24,627
560,861
51,802
336,124
8,233
26,330
422,489
983,350
3,110
207,159
(35,673)
49,317
223,913
4,327
228,240
184,268
48,208
1,075
3,722
237,273
41,018
227,887
219,594
963
16,812
11,563
517,837
755,110
983,350
2005
262,759
310,270
5,012
21,512
599,553
61,949
400,354
1,912
74,892
539,107
1,138,660
3,441
301,539
61,068
99,412
465,460
5,326
470,786
300,753
47,155
398
2,946
351,252
35,430
1,122
248,096
1,047
17,951
12,976
316,622
667,874
1,138,660
68

2004
104,236
66,139
7,078
(11,052)
(1,150)
139
–
(723)
–
3,531
168,198
17,743
(20,684)
(45,281)
(19,720)
100,256
(25,668)
(18,985)
55,603
28,547
6,943
2,114
277
–
(4,638)
(80,963)
–
(4,436)
(1,560)
(53,716)
(EUR x 1,000)
C a s h f l o w s f r o m o p e r a t i n g a c t i v i t i e s
Operating profit before financing costs (EBIT)
Adjustments for:
Depreciation
Amortisation
Foreign exchange losses
Movement in minority interests
Share of profit of associates
Result on sale of activities
Gain on sale of property, plant and equipment
Result on sale of financial assets
Cost of granted option rights
Operating cash flow before changes in working capital
and provisions
Movement in trade and other receivables
Movement in inventories
Movement in trade and other payables
Movement in provisions and employee benefits
Cash generated from the operations
Interest paid
Income taxes paid
Net cash from operating activities
C a s h f l o w s f r o m i n v e s t i n g a c t i v i t i e s
Proceeds from sale of property, plant and equipment
Proceeds from sale of investments
Interest received
Dividends received
Disposal of subsidiaries, net of cash disposed of
Acquisition of subsidiaries, net of cash acquired
Acquisition of property, plant and equipment
Acquistion of intangible assets
Development intangible assets
Acquisition of other investments
Net cash from investing activities
4 C o n s o l i d a t e d s t a t e m e n t o f c a s h f l o w sFor the year ended 31 December
69
2005
144,070
69,445
5,318
(4,439)
(1,824)
240
(2,228)
(1,514 )
(403)
5,873
214,538
(16,821)
(4,014)
(8,628)
(507)
184,568
(20,990)
(16,543)
147,035
11,766
5,244
479
239
17,458
(25,861)
(82,973)
(334)
(4,416)
(42)
(78,440)

(EUR x 1,000)
C a s h f l o w s f r o m f i n a n c i n g a c t i v i t i e s
Proceeds from the issue of share capital
Proceeds from other non-current borrowings
Repurchase of own shares
Sale of own shares
Repayment of borrowings
Dividends paid
Net cash from financing activities
Net increase in cash and cash equivalents
Cash and cash equivalents at 1 January
Effect of exchange rate fluctuations on cash held
Cash and cash equivalents at 31 December
Presentation in the balance sheet
Cash and cash equivalents
Bank overdrafts
4 C o n s o l i d a t e d s t a t e m e n t o f c a s h f l o w s ( c o n t i n u e d )For the year ended 31 December
2004
–
–
(761)
8,016
(33,820)
(9,426)
(35,991)
(34,104)
20,801
(1,385)
(14,688)
26,330
(41,018)
(14,688)
2005
94,674
124,300
–
9,351
(231,330)
(14,088)
(17,093)
51,502
(14,688)
2,648
39,462
74,892
(35,430)
39,462
70
5.1 G e n e r a l
Fugro N.V. is a company domiciled in Leidschendam, the Netherlands. The consolidated financial statements of
the Company for the year ended 31 December 2005 comprise the Company and its subsidiaries (together referred
to as the ‘Group’) and the Group’s interest in associates. A summary of the main subsidiaries is included in
chapter 6. The financial statements have been prepared by the Board of Management and released for
publication on 10 March 2006. The financial statements 2005 have been approved by the Supervisory Board on
9 March 2006 and will be submitted for adoption to the Annual General Meeting of Shareholders on 10 May
2006.
5.2 S t a t e m e n t o f c o m p l i a n c e
The consolidated financial statements have been prepared in accordance with International Financial Reporting
Standards (IFRS) laid down by the International Accounting Standards Board and adopted by the European
Union (EU-IFRS).
S i g n i f i c a n t a c c o u n t i n g p o l i c i e s
5.3 B a s i s o f p r e p a r a t i o n
The financial statements are presented in EUR x 1,000, unless mentioned otherwise. The euro is the presentation
currency of Fugro. The financial statements are prepared on the historical cost basis except that the following
assets and liabilities are stated at their fair value: (derivative) financial instruments, and employee benefits
resulting from Defined Benefit plans.
The preparation of the financial statements in accordance with EU-IFRS requires management to make
judgements, estimates and assumptions that affect the application of policies and reported amounts of assets
and liabilities, income and expenses. The estimates and associated assumptions are based on historical
experience and various other factors that are believed to be reasonable under the circumstances, the result of
which form the basis of making the judgements about the carrying values of the assets and liabilities that are
not readily apparent from other sources. Actual results may differ from these estimates.
The estimates and the underlying assumptions are reviewed on an ongoing basis. Revisions to accounting
estimates are recognised in the period in which the estimate is revised if the revision affects only that period, or
in the period of the revision and future periods if the revision affects both current and future periods.
Judgements made by management in the application of EU-IFRS that have a significant effect on the financial
statements and estimates with a significant risk of material misstatement in the next year are disclosed in
note 5.62.
The accounting policies have been consistently applied to all periods presented in these consolidated
financial statements.
5.4 B a s i s o f c o n s o l i d a t i o n
5.4.1 Subsidiaries
Subsidiaries are those entities controlled by the Company, taking into account the impact of potential voting
rights that are presently exercisable. Control exists when the Company has the power, directly or indirectly, to
govern the financial and operating policies of an entity so as to obtain benefits from its activities. The financial
statements of subsidiaries are included in the consolidated financial statements from the date that control
commences until the date that control ceases.
5.4.2 Associates
Associates are those entities in which the Group has significant influence, but no control, over the financial and
operating policies. The consolidated financial statements include the Group’s share of the total recognised gains
and losses of associates on an equity accounted basis, from the date that significant influence commences until
the date that significant influence ceases. When the Group’s share of losses exceeds the carrying amount of the
associate, the carrying amount is reduced to nil and recognition of further losses is discontinued except to the
extent that the Group has incurred legal or constructive obligations on behalf of the associate.
71
5 N o t e s t o t h e c o n s o l i d a t e d f i n a n c i a l s t a t e m e n t s

5.4.3 Other investments
Other investments are those entities in whose activities the Group holds a minority interest and has no
significant influence. These investments are carried at cost and dividends received are accounted for in the
income statement when these become due.
5.4.4 Transactions eliminated on consolidation
Intra-group balances and transactions, and any unrealised gains arising from intra-group transactions, are
eliminated in preparing the consolidated financial statements. Unrealised gains arising from transactions with
associates and jointly controlled entities are eliminated to the extent of the Group’s interest in the enterprise.
Unrealised gains arising from transactions with associates are eliminated against the investment in the
associate. Unrealised losses are eliminated in the same way as unrealised gains, but only to the extent that there
is no evidence of impairment.
5.5 F o r e i g n c u r r e n c y
5.5.1 Foreign currency transactions and translation
Transactions in foreign currencies are translated to EUR at the average foreign exchange rate for the month in
which the transaction takes place. Monetary assets and liabilities denominated in foreign currencies at the
balance sheet date are translated to EUR at the foreign exchange rate effective at that date. Foreign exchange
differences arising on translation are recognised in the income statement. Non- monetary assets and liabilities
that are measured in terms of historical cost in a foreign currency are translated using the exchange rate at the
date of the transaction. Non-monetary assets and liabilities denominated in foreign currencies that are stated at
fair value are translated to EUR at foreign exchange rates effective at the date the value was determined.
A summary of the main currency exchange rates applied in the year under review and the preceding years
reads as follows:
2005
2004
2003
5.5.2 Financial statements of foreign operations
The assets and liabilities of foreign operations, including goodwill and fair value adjustments arising on
consolidation, are translated to EUR at foreign exchange rates effective at the balance sheet date. The revenues
and expenses of foreign operations are translated to EUR at rates approximating to the foreign currency
exchange rates effective at the dates of the transactions. Foreign exchange differences arising on translation are
recognised directly in a separate component of equity.
5.5.3 Net investment in foreign operations
Exchange differences arising from the translation of the net investment in foreign operations, and related
hedges are taken to the translation reserve. They are released into the income statement upon disposal.
5.6 D e r i v a t i v e f i n a n c i a l i n s t r u m e n t s
The Group uses derivative financial instruments to hedge its exposure to foreign exchange and interest rate
risks arising from operational, financing and investment activities. In accordance with its treasury policy,
the Group does not hold or issue derivative financial instruments for trading purposes. However, derivatives
that do not qualify for hedge accounting are accounted for as trading instruments.
72
GBP average
1.46
1.47
1.45
GBP at year-end
1.46
1.42
1.42
USD average
0.81
0.81
0.88
USD atyear-end
0.85
0.73
0.79

Derivative financial instruments are recognised initially at cost. The gain or loss on remeasurement at fair value
is recognised immediately in profit and loss. Recognition of any resultant gain or loss depends on the nature of
the item being hedged (refer accounting policy 5.7).
The fair value of interest rate swaps is the estimated amount that the Group would receive or pay to
terminate the swap at the balance sheet date, taking into account current interest rates and the current
creditworthiness of the swap counterparties. The fair value of forward exchange contracts is their quoted
market price at the balance sheet date.
5.7 H e d g i n g
5.7.1 Cash flow hedges
Where a derivative financial instrument is designated as a hedge of the variability in cash flows of a recognised
asset or liability, or a highly probable forecasted transaction, the effective part of any gain or loss on the
derivative financial instrument is recognised directly in equity. When the forecasted transaction subsequently
results in the recognition of a non-financial asset or a non financial liability, the associated cumulative gain or
loss is removed from equity and included in the initial cost or other carrying amount of the non-financial asset
or liability.
If the hedge of a forecasted transaction subsequently results in the recognition of a financial asset or a
financial liability, the associated gains and losses that were recognised directly in equity are classified into profit
or loss in the same period or periods during which the asset acquired or liability assumed affects profit or loss.
For cash flow hedges, other than those covered by the preceding two policy statements, the associated
cumulative gain or loss is removed from equity and recognised in the income statement in the same period
or periods during which the hedged forecast transaction affects profit or loss. The ineffective part of any
gain or loss is recognised in the income statement immediately.
When a hedging instrument expires or is sold, terminated or exercised, or the entity revokes designation of
the hedge relationship but the hedge forecast transaction is still expected to occur, the cumulative gain or loss at
that point remains in equity and is recognised in accordance with the above policy when the transaction occurs.
If the hedged transaction is no longer expected to take place, the cumulative gain or loss recognised in equity is
recognised in the income statement immediately.
5.7.2 Hedge of monetary assets and liabilities
Where a derivative financial instrument is used to hedge economically the foreign exchange exposure of a
recognised monetary asset or liability any gain or loss on the hedging instrument is recognised in the income
statement.
5.7.3 Hedge of net investment in foreign operation
The portion of the gain or loss on an instrument used to hedge a net investment in a foreign operation that is
determined to be an effective hedge is recognised directly in equity. The ineffective portion is recognised
immediately in income statement.
5.8 P r o p e r t y , p l a n t a n d e q u i p m e n t
5.8.1 Owned assets
Property, plant and equipment are stated at cost less accumulated depreciation and impairment losses (refer
accounting policy 5.14). The cost of self-constructed assets includes the cost of materials, direct labour and
an appropriate proportion of directly attributable overheads to these assets.
Property that is being constructed or developed for future use is classified as property, plant and equipment
under construction and stated at cost until construction or development is complete, at which time it is
reclassified as land and buildings or plant and equipment or vessels or other property, plant and equipment.
Where an item of property, plant and equipment comprises major components having different useful lifes,
these components are accounted for as separate items of property, plant and equipment.
73
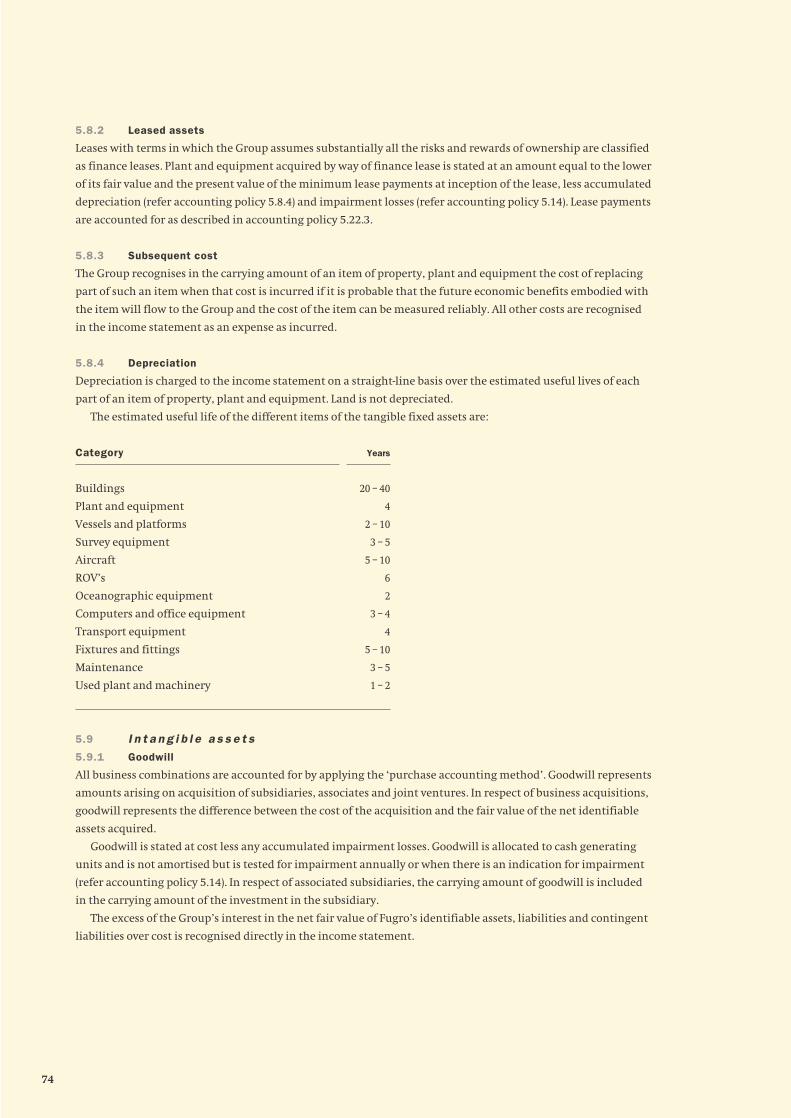
5.8.2 Leased assets
Leases with terms in which the Group assumes substantially all the risks and rewards of ownership are classified
as finance leases. Plant and equipment acquired by way of finance lease is stated at an amount equal to the lower
of its fair value and the present value of the minimum lease payments at inception of the lease, less accumulated
depreciation (refer accounting policy 5.8.4) and impairment losses (refer accounting policy 5.14). Lease payments
are accounted for as described in accounting policy 5.22.3.
5.8.3 Subsequent cost
The Group recognises in the carrying amount of an item of property, plant and equipment the cost of replacing
part of such an item when that cost is incurred if it is probable that the future economic benefits embodied with
the item will flow to the Group and the cost of the item can be measured reliably. All other costs are recognised
in the income statement as an expense as incurred.
5.8.4 Depreciation
Depreciation is charged to the income statement on a straight-line basis over the estimated useful lives of each
part of an item of property, plant and equipment. Land is not depreciated.
The estimated useful life of the different items of the tangible fixed assets are:
Category
Buildings
Plant and equipment
Vessels and platforms
Survey equipment
Aircraft
ROV’s
Oceanographic equipment
Computers and office equipment
Transport equipment
Fixtures and fittings
Maintenance
Used plant and machinery
5.9 I n t a n g i b l e a s s e t s
5.9.1 Goodwill
All business combinations are accounted for by applying the ‘purchase accounting method’. Goodwill represents
amounts arising on acquisition of subsidiaries, associates and joint ventures. In respect of business acquisitions,
goodwill represents the difference between the cost of the acquisition and the fair value of the net identifiable
assets acquired.
Goodwill is stated at cost less any accumulated impairment losses. Goodwill is allocated to cash generating
units and is not amortised but is tested for impairment annually or when there is an indication for impairment
(refer accounting policy 5.14). In respect of associated subsidiaries, the carrying amount of goodwill is included
in the carrying amount of the investment in the subsidiary.
The excess of the Group’s interest in the net fair value of Fugro’s identifiable assets, liabilities and contingent
liabilities over cost is recognised directly in the income statement.
74
Years
20 – 40
4
2 – 10
3 – 5
5 – 10
6
2
3 – 4
4
5 – 10
3 – 5
1 – 2

5.9.2 Research
Expenditure on research activities, undertaken with the prospect of gaining new scientific or technical
knowledge and understanding, is recognised in the income statement as an expense as incurred.
The group spends significant amounts on research. Since the majority of these activities take place within
contracts with third parties it is not feasible to properly determine the total costs on spending for these
technical developments. These expenditures are recognised in the income statement as an expense as incurred.
Expenditure on development activities, whereby research findings are applied to a plan or design for new or
improved software, is capitalised if the product is technically and commercially feasible and the Group has
sufficient resources to complete development. The capitalised expenditure includes the cost of materials, direct
labour and an attributable proportion of direct overheads. Capitalised software is stated at cost less accumulated
amortisation (refer below) and impairment losses (refer accounting policy 5.14). The estimated useful lifetime
for software is five years.
5.9.3 Other intangible assets
Other intangible assets that are acquired by the Group are stated at cost less accumulated amortisation (refer
below) and impairment losses (refer accounting policy 5.14).
Expenditure on internally generated goodwill is recognised in the income statement as an expense as
incurred.
5.9.4 Subsequent expenditure
Subsequent expenditure on capitalised intangible assets is capitalised only when it increases the future
economic benefits embodied in the specific asset to which it relates. All other expenditure is expensed as
incurred.
5.9.5 Amortisation
Amortisation is charged to the income statement on a straight-line basis over the estimated useful lives of
intangible assets unless such lives are indefinite. Goodwill and intangibles assets with an indefinite life are
systematically tested for impairment at each balance sheet date or when there is an indication for impairment.
Other intangible assets (software) are amortised from the date they are available for use.
5.10 I n v e s t m e n t s
5.10.1 Investments in associates
Investments in associates are valued using fair value, and if not available, the equity method, unless in the case
of a negative equity and there is a clear understanding that the Group is neither obliged nor willing to support
the investee to continue its operations when required, in which case the valuation does not fall below zero.
When these investments are derecognised, the cumulative translation difference previously recognised
directly in equity is recognised in profit or loss.
5.11 I n v e n t o r i e s
5.11.1 Seismic data libraries
The seismic data libraries consist of completed and in progress seismic data that can be sold non-exclusively to
one or more clients. These seismic data libraries are valued at the lower of cost or net realisable value. Cost
includes direct costs and an attributable portion of direct overheads, but excluding a profit element. The net
realisable value is reassessed at each reporting date.
75

5.11.2 Inventories
Other inventories are stated at the lower of cost and net realisable value. Net realisable value is the estimated
selling price in the ordinary course of business, less the estimated costs of completion and selling expenses.
The cost of other inventories is based on the first-in first-out principle and includes expenditure incurred in
acquiring the inventories and bringing them to their existing location and condition.
5.12 T r a d e a n d o t h e r r e c e i v a b l e s
5.12.1 Work in progress
Work in progress concerning services rendered on work not yet completed, is stated at cost plus profit
recognised to date (refer accounting policy 5.21.1) less a provision for foreseeable losses and less progress
billings. Costs include all expenditure related directly to specific projects and an allocation of fixed and directly
attributable overheads incurred in the Group’s contract activities based on normal operating capacity.
5.12.2 Trade and other receivables
Services rendered on contract work completed but not yet billed to customers are included in trade receivables
as unbilled revenues.
Trade and other receivables are stated at their cost less impairment losses (refer accounting policy 5.14).
5.13 C a s h a n d c a s h e q u i v a l e n t s
Cash and cash equivalents comprise cash balances and call deposits. Bank overdrafts that are repayable on
demand and form an integral part of the Group’s cash management are included as a component of cash and
cash equivalents for the purpose of the statement of cash flows.
5.14 I m p a i r m e n t
The carrying amounts of assets other than inventories and deferred tax assets (refer accounting policy 5.23),
are reviewed at each balance sheet date to determine whether there is any indication of impairment. If any
such indication exists, the asset’s recoverable amount is calculated.
For goodwill and intangible assets that are not available for use, the recoverable amount is determined at
each balance sheet date or when there is an indication for impairment.
An impairment loss is recognised whenever the carrying amount of an asset or its cash generating unit
exceeds its recoverable amount. Impairment losses are recognised in the income statement.
Impairment losses recognised in respect of cash-generating units are allocated first to reduce the carrying
amount of any goodwill allocated to the cash-generating units and then to reduce the carrying amount of the
other assets, in the unit on a pro rato basis.
5.14.1 Calculation of recoverable amount
The recoverable amount of the Group’s investments in held-to-maturity securities and receivables carried at
amortised cost is calculated at the present value of estimated future cash flows, discounted at the effective
interest rate computed at initial recognition of these assets. Receivables with a short duration are not
discounted.
The recoverable amount of assets is the higher of their net selling price and value in use. In assessing the
value in use, the estimated future cash flows are discounted to their present value using a pre-tax discount rate
that reflects current market assessments of the time value of money and the risks specific to the asset. For an
asset that does not generate largely independent cash inflows, the recoverable amount is determined for the
cash-generating unit to which the asset belongs.
5.14.2 Reversals of impairment
An impairment loss in respect of a held-to-maturity security or receivable is reversed if the subsequent increase
in recoverable amount can be related objectively to an event occurring after the impairment loss was
recognised.
76

An impairment loss in respect of goodwill is not reversed in a subsequent period.
In respect of other assets, an impairment loss is reversed if there is an indication that an impairment loss
recognised in prior periods may no longer exist or may have decreased.
An impairment loss is reversed only to the extent that the asset’s carrying amount does not exceed the
carrying amount that would have been determined, net of depreciation or amortisation, if no impairment loss
had been recognised.
5.15 S h a r e c a p i t a l
5.15.1 Share capital
Share capital is classified as equity. The Group has not issued preference shares.
5.15.2 Repurchase and sale of share capital
When share capital recognised as equity is repurchased or sold, the amount of the consideration paid or
received, including directly attributable costs, is recognised as a change in equity. Repurchased shares are
reported as reserve for own shares and presented as a deduction from total equity.
5.15.3 Dividends
Dividends are recognised as a liability in the period in which they are declared.
5.16 C o n v e r t i b l e n o t e s
Convertible notes that can be converted to share capital at the option of the holder, where the number of shares
issued does not vary with changes in their fair value, are accounted for as compound financial instruments, net
of attributable transaction costs. Transaction costs that relate to the issue of a compound financial instrument
are allocated to the liability components. The equity component of the convertible notes is calculated as the
excess of the issue proceeds over the present value of the future interest and principal payments, discounted at
the market interest rate applicable to similar liabilities that do not have a conversion option. The interest
expense recognised in the income statement is calculated using the effective interest rate method.
5.17 I n t e r e s t - b e a r i n g b o r r o w i n g s
Interest-bearing borrowings are recognised initially at fair value, less attributable transaction costs. Subsequent
to initial recognition, interest-bearing borrowings are stated at amortised cost.
5.18 E m p l o y e e b e n e f i t s
5.18.1 Defined contribution plans
Obligations for contributions to defined contribution pension plans and other long-term employee benefits are
recognised as an expense in the income statement as incurred.
5.18.2 Defined benefit plans
The Group’s net obligation in respect of defined benefit pension plans and other long-term employee benefits is
calculated separately for each plan by calculating the present value of future benefits that employees have
earned in return for their service in the current and prior periods; that benefit is discounted to determine the
present value, and the fair value of any plan assets is deducted. The discount rate is the yield at balance sheet
date on high quality corporate or government bonds that have maturity dates approximating the terms of the
Group’s obligations. The calculation is performed by qualified actuaries using the projected unit credit method.
When the benefits of a plan are improved, the portion of the increased benefit relating to past service by
employees is recognised as an expense in the income statement on a straight-line basis over the average period
until the benefits become vested. To the extent that the benefits vest immediately, the expense is recognised
immediately in the income statement.
77

The Group adopted the IAS 19 amendment from December 2004 which permits an entity to recognise all
actuarial gains and losses in the period in which they occur outside profit and loss in the statement of
recognised income and expense.
Where the calculation results in a benefit to the Group, the recognised asset is limited to the present value of
any future refunds from the plan or reductions in future contributions to the plan.
5.18.3 Long term service benefits
The Group’s net obligation in respect of long term service benefits, other than pension plans, is the amount of
future benefit that employees have earned in return for their service in the current and prior periods.
The obligation is calculated using the projected unit credit method and is discounted based on high quality
corporate or government bonds that have maturity dates approximating the terms of the Group’s obligations.
5.18.4 Share based payment transactions
The share option programme allows Group employees to acquire shares of the Company. The fair value of
options is recognised as an employee expense with a corresponding increase in equity. The fair value is
measured at grant date and spread over the period during which the employees become unconditionally
entitled to the options. The fair value of the options granted from 7 November 2002 onwards is measured
using a binominal model, taking into account the terms and conditions upon which the options were granted.
The amount recognised as an expense is adjusted annually to reflect the actual number of share options that vest.
5.19 P r o v i s i o n s
A provision is recognised in the balance sheet when the Group has a legal or constructive obligation as result of a
past event, and it is probable that an outflow of economic benefits will be required to settle the obligation. If the
effect is material, provisions are determined by discounting the expected future cash flows at a pre-tax rate that
reflects current market assessments of the time value of money and, where appropriate, the risks specific to the
liability.
5.19.1 Restructuring
A provision for restructuring is recognised when the Group has approved a detailed and formal restructuring
plan, and the restructuring has either commenced or has been announced publicly. Future operating costs are
not provided for.
5.19.2 Onerous contracts
A provision for onerous contracts is recognised when the expected benefits to be derived by the Group from a
contract are lower than the unavoidable cost of meeting its obligations under the contract.
5.20 T r a d e a n d o t h e r p a y a b l e s
Trade and other payables are stated at cost.
5.21 R e v e n u e
5.21.1 Services rendered
Revenue from services rendered to third parties is recognised in the income statement in proportion to the stage
of completion of the transaction at the balance sheet date. The stage of completion is assessed using the
proportion of contract cost incurred for work performed to balance sheet date compared to total contract cost as
this method is most appropriate for the majority of the services provided by the Group (which are mainly based
on daily rates for staff and equipment or rates per (square) mile for vessels and airplanes).
For fixed price contracts revenue is recognised when: (i) the total contract revenue can be measured reliably;
(ii) it is probable that future economic benefits will flow to the Group as a result of that contract; (iii) contract
costs to completion and the stage of completion at the balance sheet date can be measured reliably; and (iv)
contract costs can be identified clearly and measured reliably so that actual cost can be compared with prior
estimates.
78

In case of cost plus contracts (mainly daily rates or rates per (square) mile), revenue of the contract is recorded
when: (i) it is probable that future economic benefits will flow to the Group as a result of that contract; and (ii)
contract costs can be identified clearly and measured reliably.
No revenue is recognised if there are significant uncertainties regarding recovery of the consideration due,
associated costs or the possible return of goods.
5.21.2 Royalty, software licences and subscription income
Royalty, software licences and subscription income from (intangible) assets are recognised in the period during
which the underlying services (such as information or GNSS correction signals) have been provided.
5.21.3 Government grants
An unconditional government grant is recognised in the balance sheet when the grant becomes receivable.
Any other government grant is initially recognised in the balance sheet as deferred income when there is
reasonable assurance that it will be received and that the Group will comply with the conditions attaching to it.
Grants that compensate the Group (partly) for expenses incurred are recognised as revenue in the income
statement on a systematic basis in the same periods in which the expenses are incurred. Grants that compensate
the Group for the cost of an asset are recognised in the income statement as revenue on a systematic basis over
the useful life of the asset.
5.21.4 Other operating income
Other operating income concerns income not related to the key business activities of the Group, like income
from the sale of non-monetary assets and or liabilities, exceptional and/or non-recurring income.
5.22 E x p e n s e s
5.22.1 Third party costs
Third party costs are matched with related revenues on contracts and accounted for on a historical cost basis.
Net revenue own services is the sum of revenue realised from third parties less third party cost.
5.22.2 Operating lease payments
Payments made under operating leases are recognised in the income statement on a straight-line basis over the
term of the lease. Lease incentives received are recognised in the income statement as an integral part of the
total lease expense.
5.22.3 Financial lease payments
Minimum lease payments are apportioned between the finance charge and the reduction of the outstanding
liability. The finance charge is allocated to each period in such a way that this results in a constant periodical
interest rate for the remaining balance of the liability during the lease term.
5.22.4 Net financing costs
Net financing costs comprise interest payable on borrowings calculated using the effective interest rate method,
interest receivable on funds invested, dividend income, foreign exchange gains and losses, and gains and losses
on hedging instruments that are recognised in the income statement (refer accounting policy 5.7).
Interest income is recognised in the income statement as it accrues, taking into account the effective yield on
the asset. Dividend income is recognised in the income statement on the date the entity’s right to receive the
payments is established which in the case of quoted shares is usually the ex-dividend date.
The interest expenses component of finance lease payments is recognised in the income statement using the
effective interest rate method.
79
5.23 I n c o m e t a x
Income tax on the profit or loss for the year comprises current and deferred tax. Income tax is recognised in the
income statement except to the extent that it relates to items taken directly to equity, in which case it is
recognised in equity.
Current tax is the expected tax payable on the taxable income for the year, using tax rates enacted or
substantially enacted at the balance sheet date, and any adjustment to tax in respect of previous years.
Deferred tax is determined using the balance sheet liability method, providing for temporary differences
between the carrying amounts of assets and liabilities for financial reporting purposes and the amounts used
for taxation purposes. The following temporary differences are not provided for: goodwill not deductible for tax
purposes, the initial recognition of assets or liabilities that affect neither accounting nor taxable profit and
differences relating to investments in subsidiaries to the extent that they will probably not reverse in the
foreseeable future. The amount of deferred tax determined is based on the expected manner of realisation or
settlement of the carrying amount of assets and liabilities, using tax rates enacted or substantially enacted at
the balance sheet date.
A deferred tax asset is recognised only to the extent that it is probable that future taxable profits will be
available against which the asset can be utilised. Deferred tax assets are reduced to the extent that it is no longer
probable that the related tax benefit will be realised.
Additional income taxes that arise from the distribution of dividends are recognised at the same time as the
liability to pay the related dividend.
5.24 S t a t e m e n t o f c a s h f l o w
The statement of cash flow is prepared using the indirect method. The cash flow statement distinguishes
between operational, investing and financing activities. Cash flows in foreign currencies are converted at the
average rates during the reporting period. Currency exchange differences on cash held are separately shown.
Payments and receipts of corporate taxes are included as cash flow from operational activities and interest paid
is shown as cash flow from operating activities. Cash flows as a result from acquisition/divestment of financial
interest in subsidiaries and associates are included as cash flow from investment activities, taking into account
the available cash in these interests. Dividends paid are part of the cash flow from financing activities.
5.25 S e g m e n t r e p o r t i n g
Segment information is presented in respect of the Group’s business and geographical segments. The primary
format, business segments, is based on the Group’s management and internal reporting structure. Inter-
segment pricing is determined on an arm’s length basis. Segment results, assets and liabilities include items
directly attributable to a segment as well as those that can be allocated on a reasonable basis. Unallocated items
comprise mainly deferred tax, interest-bearing loans, borrowings and corporate assets and expenses. Segment
capital expenditure is the total amount incurred during the period to acquire segment assets that are expected
to be used for more than one period.
The Group defines a division as a segment in its reports.
5.25.1 Business segments
As an engineering firm with operations throughout the world, the Group delivers its services to clients located
all over the globe and collects and interprets data related to the earth’s surface and the soil and rock beneath.
On the basis of this data the Group provides advice, generally for purposes related to the oil and gas industry,
the mining industry and the construction industry. The Group recognises three groups of services as business
segments:
The Geotechnical division provides a group of related services. These concern investigations and advice
regarding the physical characteristics of the soil, foundation design and materials for construction.
The activities are mainly design related. The client base of the pre-design phase activities is focussed on advice
concerning the prime question of whether the foundation of a structure will be safe, both on- and offshore.
80

Laboratory testing supports the reporting service. In principle geotechnical services are rendered in a very early
stage of a development.
The Survey division provides a group of related services. This concerns positioning services, geological advice,
topographic, hydrographical and geological mapping and support services for construction projects and data
management. These activities are mainly provided in the installation, construction and maintenance phase.
In a large number of cases, Group companies supply information like weather forecasting, GNSS correction
signals for precise positioning (the signals are also used for rig moves). Moreover, special equipment is used to
assist clients with construction of offshore structures (ROV, AUV, etc). In general these activities do not include
soil sampling nor penetration of the earth’s surface. Survey services are rendered during a construction phase.
The Geoscience division provides a range of related services. This concerns gathering and interpreting
geophysical data, quantitative and qualitative estimates of oil, gas, mineral and water resources leading to
advising on the optimisation of their production. These are mainly exploration related activities (to determine
what resources are there). The clients get advice about the potential presence of oil/gas, minerals and water and
also about the quantitative and qualitative data regarding these natural resources. The division also has
techniques which help clients to assess how to extract the natural resources in the most optimal way.
The segments are managed on a worldwide basis, and operate in four principal geographical areas,
The Netherlands, Europe other/Africa, Near and Middle East/Asia/Australia and the Americas.
In presenting information on the basis of geographical segments, segment revenue is based on the geographical
location of operating companies. Segment assets are based on the geographical location of the assets.
Inter-segment pricing is determined on an arm’s length basis.
81

Business segments
(EUR x 1,000)
Revenue from
external customers
of which inter-segment revenue
Segment result
Profit from operations
Net financing costs
Income from associates
Income tax expense
Net profit for the year
Segment assets
Unallocated assets
Total assets
Segment liabilities
Unallocated liabilities
Total liabilities
Depreciation
Amortisation
Capital expenditure tangible
fixed assets
Capital expenditure
intangible assets
82
2004
1,008,008
–
104,236
104,236
(31,846)
139
(19,944)
52,585
910,458
72,892
983,350
688,402
294,948
983,350
66,139
7,078
68,730
5,771
2005
1,160,615
–
144,070
144,070
(16,235)
240
(26,745)
101,330
1,042,006
96,654
1,138,660
732,282
406,378
1,138,660
69,445
5,318
80,357
23,445
Consolidated
2004
–
(62,155)
(43,775)
–
–
11,502
–
2,410
–
2005
–
(46,954)
(42,977)
–
–
16,098
–
9,475
–
Unallocated/Eliminations
2004
265,459
6,183
37,514
407,565
340,444
15,377
4,457
13,103
5,771
2005
291,660
6,006
44,382
418,493
321,840
17,532
5,191
17,616
4,816
Geoscience
2004
470,026
27,637
70,634
355,298
279,793
28,980
2,621
32,037
–
2005
565,342
17,272
96,934
435,848
316,634
25,349
112
41,461
17,109
Survey
2004
272,523
28,335
39,863
147,595
68,165
10,280
–
21,180
–
2005
303,613
23,676
45,731
187,665
93,808
10,466
15
11,805
1,520
Geotechnical
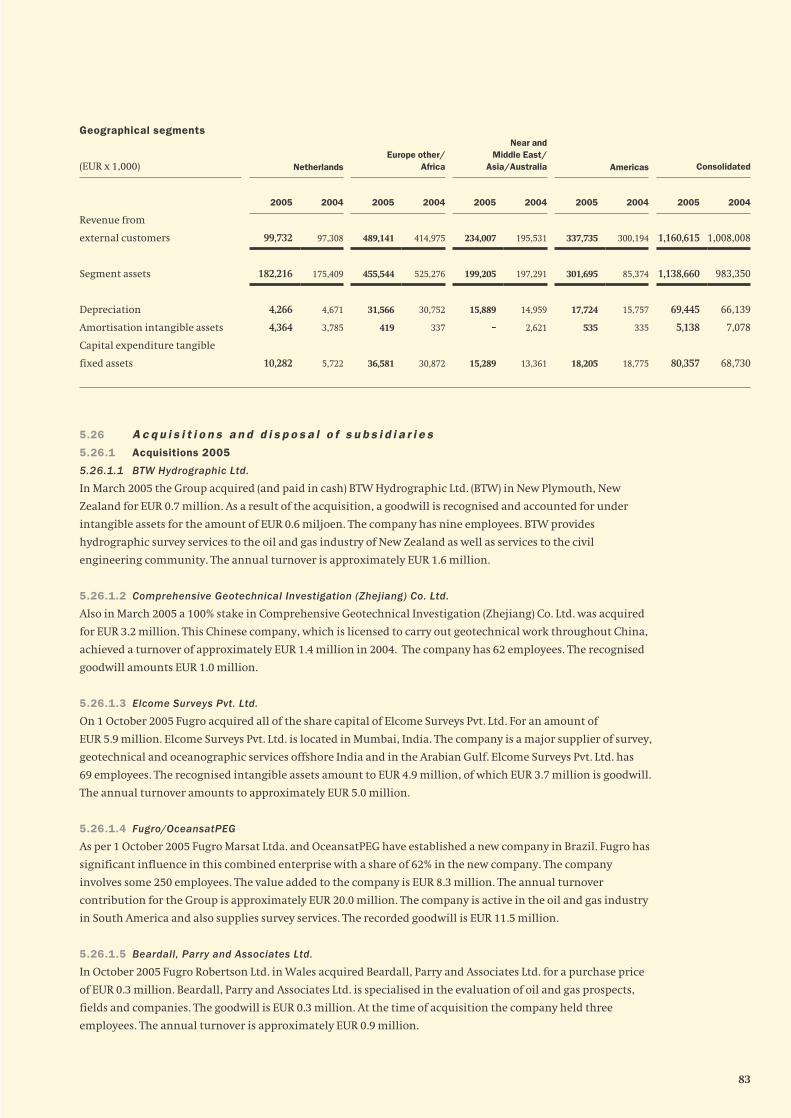
Geographical segments
(EUR x 1,000)
Revenue from
external customers
Segment assets
Depreciation
Amortisation intangible assets
Capital expenditure tangible
fixed assets
5.26 A c q u i s i t i o n s a n d d i s p o s a l o f s u b s i d i a r i e s
5.26.1 Acquisitions 2005
5.26.1.1 BTW Hydrographic Ltd.
In March 2005 the Group acquired (and paid in cash) BTW Hydrographic Ltd. (BTW) in New Plymouth, New
Zealand for EUR 0.7 million. As a result of the acquisition, a goodwill is recognised and accounted for under
intangible assets for the amount of EUR 0.6 miljoen. The company has nine employees. BTW provides
hydrographic survey services to the oil and gas industry of New Zealand as well as services to the civil
engineering community. The annual turnover is approximately EUR 1.6 million.
5.26.1.2 Comprehensive Geotechnical Investigation (Zhejiang) Co. Ltd.
Also in March 2005 a 100% stake in Comprehensive Geotechnical Investigation (Zhejiang) Co. Ltd. was acquired
for EUR 3.2 million. This Chinese company, which is licensed to carry out geotechnical work throughout China,
achieved a turnover of approximately EUR 1.4 million in 2004. The company has 62 employees. The recognised
goodwill amounts EUR 1.0 million.
5.26.1.3 Elcome Surveys Pvt. Ltd.
On 1 October 2005 Fugro acquired all of the share capital of Elcome Surveys Pvt. Ltd. For an amount of
EUR 5.9 million. Elcome Surveys Pvt. Ltd. is located in Mumbai, India. The company is a major supplier of survey,
geotechnical and oceanographic services offshore India and in the Arabian Gulf. Elcome Surveys Pvt. Ltd. has
69 employees. The recognised intangible assets amount to EUR 4.9 million, of which EUR 3.7 million is goodwill.
The annual turnover amounts to approximately EUR 5.0 million.
5.26.1.4 Fugro/OceansatPEG
As per 1 October 2005 Fugro Marsat Ltda. and OceansatPEG have established a new company in Brazil. Fugro has
significant influence in this combined enterprise with a share of 62% in the new company. The company
involves some 250 employees. The value added to the company is EUR 8.3 million. The annual turnover
contribution for the Group is approximately EUR 20.0 million. The company is active in the oil and gas industry
in South America and also supplies survey services. The recorded goodwill is EUR 11.5 million.
5.26.1.5 Beardall, Parry and Associates Ltd.
In October 2005 Fugro Robertson Ltd. in Wales acquired Beardall, Parry and Associates Ltd. for a purchase price
of EUR 0.3 million. Beardall, Parry and Associates Ltd. is specialised in the evaluation of oil and gas prospects,
fields and companies. The goodwill is EUR 0.3 million. At the time of acquisition the company held three
employees. The annual turnover is approximately EUR 0.9 million.
83
2004
1,008,008
983,350
66,139
7,078
68,730
2005
1,160,615
1,138,660
69,445
5,138
80,357
Consolidated
2004
300,194
85,374
15,757
335
18,775
2005
337,735
301,695
17,724
535
18,205
Americas
2004
195,531
197,291
14,959
2,621
13,361
2005
234,007
199,205
15,889
–
15,289
Near and Middle East/
Asia/Australia
2004
414,975
525,276
30,752
337
30,872
2005
489,141
455,544
31,566
419
36,581
Europe other/Africa
2004
97,308
175,409
4,671
3,785
5,722
2005
99,732
182,216
4,266
4,364
10,282
Netherlands

5.26.1.6 España Geotechnical Consulting Inc.
As per 1 December 2005 Fugro acquired España Geotechnical Consulting Inc. in Roseville for EUR 1.1 million.
There are twenty employees working for the company. España is specialised in geotechnical, geological and
earthquake engineering and construction material testing. The annual turnover is around EUR 2.4 million and
as a result of the acquisition, an amount of EUR 0.4 million is accounted for under other intangible assets.
5.26.1.7 Thales GeoSolutions
During 2005, Fugro and Thales reached a final settlement on the purchase price of Thales GeoSolutions.
The agreement resulted in a decrease of the goodwill amount of EUR 4.1 million.
5.26.2 Disposals
5.26.2.1 Sale diving activity Mexico
Fugro sold the diving activity in Mexico in 2005. The sales revenue of EUR 0.6 million is part of the above
mentioned goodwill adjustment for Thales GeoSolutions. The annual turnover for 2004 was around
EUR 9.0 million.
5.26.2.2 Sale of laboratories Wales
During the financial year, two laboratories in Wales have been sold for a net amount of EUR 6.3 million.
Approximately EUR 4.2 million has been deducted from the goodwill amount of Fugro Robertson Ltd.
The remainder has been accounted for in the profit and loss account of 2005. The annual turnover of the activity
amounts to EUR 5.0 million.
84

5.26.4 Effect of acquisitions and disposal
The acquisitions and disposals had the following effect on the Group’s assets and liabilities.
(EUR x 1,000)
Property, plant and equipment
Intangible assets
Other fixed assets
Inventories
Trade and other receivables
Current tax receivables
Deferred taxes
Cash and cash equivalents
Interest-bearing loans and borrowings
Current tax liabilities
Trade payables
Net identifiable assets and liabilities
Goodwill/(negative goodwill) on acquisition
Consideration paid/(received), in cash
Cash (acquired)/disposed of
Net cash outflow/(inflow)
5.27 G o v e r n m e n t g r a n t s
The company has not been awarded any significant government grants.
5.28 T h i r d p a r t y c o s t s
Refers to direct operating expenses from third parties that are project related (thus the third party cost of sales).
5.29 O t h e r o p e r a t i n g i n c o m e
(EUR x 1,000)
Release of unused provisions
Government grants
Negative goodwill
Gain on disposal of property, plant and equipment
Sundry income
85
(9,935)
1,335
–
(3,782)
(5,286)
–
1,061
–
–
(97)
(1,535)
(18,239)
22,877
4,638
–
4,638
Balance of acquistionsand divest-
ments 2004Acquisition
2005Divestment
2005
(4,701)
–
187
314
2,570
–
–
7,702
–
–
(4,877)
1,195
(8,723)
(7,528)
(9,930)
(17,458)
12,142
1,677
102
25
9,724
1,117
–
(5,017)
(4,592)
(765)
(10,587)
3,826
17,018
20,844
5,017
25,861
2004
2,700
249
2,220
1,023
10,348
16,540
2005
582
386
–
1,745
6,948
9,661

5.30 P e r s o n n e l e x p e n s e s
(EUR x 1,000)
Wages and salaries
Compulsory social security contributions
Costs option plan employees
Contributions to defined contribution plans
Expense relating to defined benefit plans
Increase in liability for long service leave
5.30.1 Share based payments
In 1989 the Group established a share option programme for employees.
Option rights are granted dependent on the contribution of the employee to the development of the long-
term strategy.
In accordance with the programme, the options are exercisable at the closing price of the share on the last
trading day of the year, EUR 27.13 per share as at 31 December 2005.
For Dutch residents the granting is considered as unconditional, the options can be exercised immediately
upon grant date although a fine (of 90%) would have to be paid. The costs relating to the Dutch residents are
therefore accounted for during the service period only (i.e. the 12 months period prior to grant date, being the
current financial year).
Foreign residents however are not entitled unconditionally to the option rights at the grant date, the Group
presumes that in addition to the service period during the 12 months prior to granting, services will be received
in the future. In the Fugro option plan, foreign residents can exercise their options only after three years (the
‘vesting period’) after the grant date if they are still employed by Fugro at that date. These options therefore have
a service period of one year and vest over a three year period starting at the first of January of the year following
the grant date. The costs of options for foreign residents therefore will be accounted for over a four year period.
86
2004
287,083
28,297
3,531
5,999
6,724
(11)
331,623
2005
309,220
30,583
5,873
10,373
4,650
303
361,002
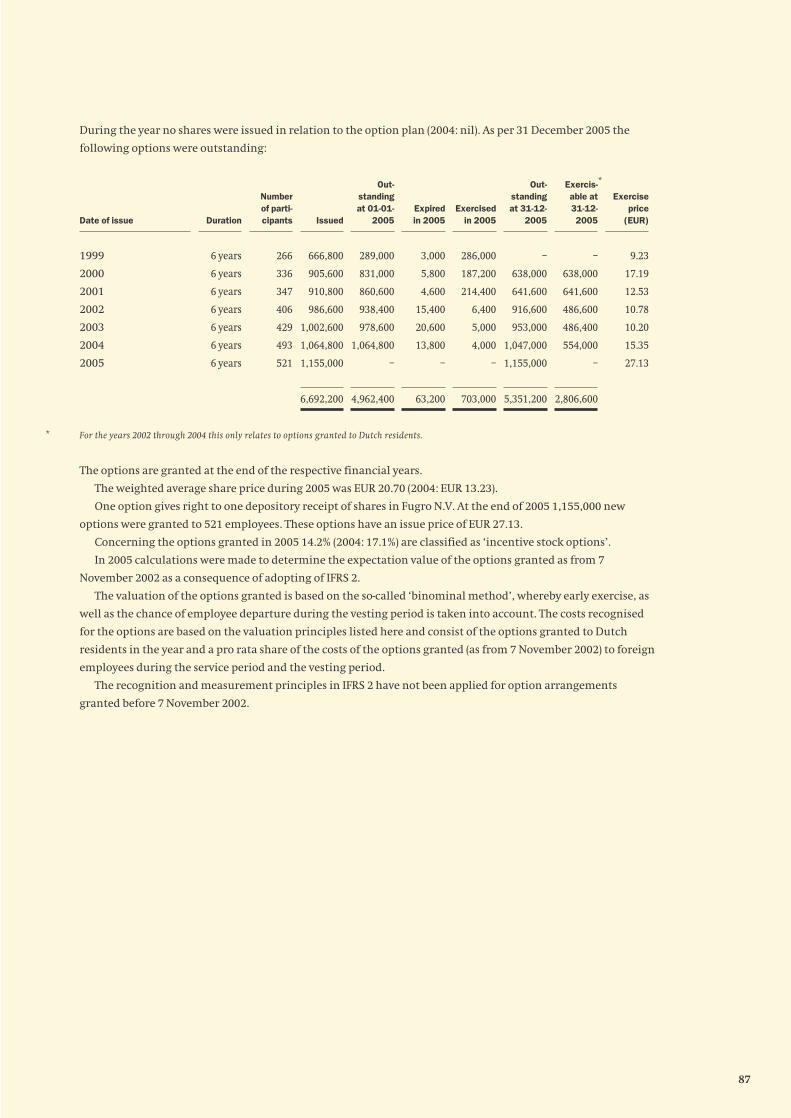
During the year no shares were issued in relation to the option plan (2004: nil). As per 31 December 2005 the
following options were outstanding:
1999
2000
2001
2002
2003
2004
2005
* For the years 2002 through 2004 this only relates to options granted to Dutch residents.
The options are granted at the end of the respective financial years.
The weighted average share price during 2005 was EUR 20.70 (2004: EUR 13.23).
One option gives right to one depository receipt of shares in Fugro N.V. At the end of 2005 1,155,000 new
options were granted to 521 employees. These options have an issue price of EUR 27.13.
Concerning the options granted in 2005 14.2% (2004: 17.1%) are classified as ‘incentive stock options’.
In 2005 calculations were made to determine the expectation value of the options granted as from 7
November 2002 as a consequence of adopting of IFRS 2.
The valuation of the options granted is based on the so-called ‘binominal method’, whereby early exercise, as
well as the chance of employee departure during the vesting period is taken into account. The costs recognised
for the options are based on the valuation principles listed here and consist of the options granted to Dutch
residents in the year and a pro rata share of the costs of the options granted (as from 7 November 2002) to foreign
employees during the service period and the vesting period.
The recognition and measurement principles in IFRS 2 have not been applied for option arrangements
granted before 7 November 2002.
87
Exerciseprice
(EUR)
9.23
17.19
12.53
10.78
10.20
15.35
27.13
Exercis-able at 31-12-2005
–
638,000
641,600
486,600
486,400
554,000
–
2,806,600
Out-standing at 31-12-
2005
–
638,000
641,600
916,600
953,000
1,047,000
1,155,000
5,351,200
Exercised in 2005
286,000
187,200
214,400
6,400
5,000
4,000
–
703,000
Expired in 2005
3,000
5,800
4,600
15,400
20,600
13,800
–
63,200
Out-standing at 01-01-
2005
289,000
831,000
860,600
938,400
978,600
1,064,800
–
4,962,400
Issued
666,800
905,600
910,800
986,600
1,002,600
1,064,800
1,155,000
6,692,200
Number of parti-cipants
266
336
347
406
429
493
521
Duration
6 years
6 years
6 years
6 years
6 years
6 years
6 years
Date of issue
*

Options outstanding at 1 January
Forfeited during the period
Options granted during the period
Options exercised during the period
Options outstanding at 31 December
Exercisable at the end of the period
The Group has sold 703,000 shares held by Fugro for options exercised in 2005. The average puchase price of
these shares was EUR 11.95 per share. The related options were exercised throughout the year.
The options outstanding at 31 December 2005 have an exercise price in the range of EUR 10.20 to EUR 27.13
and a weighted average contractual life of 4 years (2004: 4 years).
The valuation principles used for determining the expectation value are as follows:
The date of valuation is equal to the date of granting (year end). The duration of the options is six years.
The volatility is based on the historical analysis of the daily share price fluctuations over the period 1993
through the reporting date. The expected return on dividend is based on a historical analysis of the dividends
paid out during the period 1994 through reporting date. Concerning early departure, different percentages for
different categories of staff are used: Directors 1%, Executive Committee members 2%, managers of operating
companies 7%. The expected behaviour for exercising the options by the Directors is estimated till the end
of the vesting period and for the other two groups with a multiple of three.
Average share price
Excercise price
Granting
Volatility
Dividend
Risk free interest
Costs of granted option rights at the end of 2002 in EUR
Costs of granted option rights at the end of 2003 in EUR
Costs of granted option rights at the end of 2004 in EUR
Costs of granted option rights at the end of 2005 in EUR
88
Number ofoptions
4,785,800
(113,480)
1,064,800
(774,720)
4,962,400
2,567,200
Weighted averageexercise
price
11.46
11.63
15.35
7.35
11.46
Number ofoptions
4,962,400
(63,200)
1,155,000
(703,000)
5,351,200
2,806,600
Weighted averageexercise
price
11.46
12.23
27.13
12.41
16.07
2005 2004
Dutch residents
13.23
15.35
2004
33%
3.20%
3.30%
–
–
2,497,898
–
Foreign residents
10.01
10.20
2003
37%
3.20%
3.80%
501,844
531,657
–
–
Dutch residents
20.70
27.13
2005
31%
3.60%
3.30%
–
–
–
3,555,771
Foreign residents
20.70
27.13
2005
31%
3.60%
3.30%
501,844
531,657
568,812
715,040
2005 2004

5.30.2 Number of employees as at 31 December
Technical staff
Management and administrative staff
Temporary and contract staff
Average number of employees during the year
5.31 O t h e r o p e r a t i n g e x p e n s e s
(EUR x 1,000)
Maintenance and operational supplies
Indirect operating expenses
Occupancy costs
Communication and office equipment
Restructuring costs
Research expensed as incurred
Loss on disposal of property, plant and equipment
Other indirect operating expenses
The most important task of the external auditor is the audit of the annual accounts of Fugro N.V. Furthermore,
the auditor assists with due diligence processes and annual accounts related work. Tax advice is in principle
given by specialist firms or specialised departments of local audit firms, which hardly ever are involved in the
audit of the annual accounts of the relevant subsidiary. Other than these advisory services, Fugro makes only
limited use of external advisors. In the case that such services are required, specialists are engaged that are not
associated with the external auditor.
The fees paid for the above mentioned services, which are included in Other indirect operating expenses are
evaluated on a regular basis and in line with the market.
89
Total
5,682
1,460
473
7,615
7,864
Foreign
4,991
1,335
399
6,725
6,945
Nether-lands
691
125
74
890
919
Total
6,306
1,663
565
8,534
8,121
Foreign
5,680
1,552
463
7,695
7,276
Nether-lands
626
111
102
839
845
20042005
2004
36,715
32,003
25,126
21,058
4,340
–
300
31,286
150,828
2005
38,050
35,882
27,226
23,342
1,928
166
231
57,915
184,740

5.32 N e t f i n a n c i n g c o s t s
(EUR x 1,000)
Interest expenses
Interest income
Dividend income
Net foreign exchange variance
Exchange results on USD long term loans
Results on financial hedging instruments
5.33 I n c o m e t a x e x p e n s e
Recognised in the income statement
(EUR x 1,000)
Current tax expense
Current year
Under/(over) provided in prior years
Deferred tax expense
Origination from and reversal of timing differences
Decrease tax percentage
Utilisation of tax losses recognised
Effect of write down of deferred tax asset
Total income tax expense in the income statement
Reconciliation of effective tax rate
(EUR x 1,000)
Profit before tax
Income tax using the domestic corporation tax rate
Effect of tax rates in foreign jurisdictions (lower rates)
Non-deductible expenses
Tax exempt income
Tax charge on non local activities
Effect of tax losses utilised and temporary differences
Effect of non-recognised tax losses
Under/(over) provided in prior years
Non-compensable losses
90
2004
28,733
(2,114)
(277)
5,504
(7,271)
7,271
31,846
2005
20,990
(479)
(239)
(4,037)
12,289
(12,289)
16,235
2004
19,060
(612)
18,448
(808)
20
2,284
–
1,496
19,944
2005
25,604
1,378
26,982
(5,188)
238
4,116
597
(237)
26,745
2004
72,529
25,022
(12,800)
350
(408)
1,139
2,284
(202)
(612)
5,171
19,944
2004%
34.5
(17.6)
0.5
(0.6)
1.6
3.1
(0.3)
(0.8)
7.1
27.5
2005
128,075
40,344
(12,747)
315
(1,716)
4,540
(237)
(5,132)
1,378
–
26,745
2005%
31.5
(9.9)
0.2
(1.3)
3.5
(0.2)
(4.0)
1.1
–
20.9

Deferred tax credit recognised directly in equity
(EUR x 1,000)
Relating to actuarial gains and losses on pensions
Relating to hedge results
Relating to share option rights
Exchange rate differences
Unrecognised tax losses changed over the period as follows:
Unrecognised tax losses
(EUR x 1,000)
As of 1 January
Movements during the period:
Additional losses
Utilised
Exchange rate differences
Change from reassessment
Resulting from acquisitions
As of 31 December
Reference is also made to note 5.40.
5.34 C u r r e n t t a x a s s e t s a n d l i a b i l i t i e s
The current tax liability of EUR 11,064 (2004: EUR 3,330) represents the balance of income tax payable and
receivable in respect of current and prior periods less advance tax payments.
91
2004
1,019
2,582
(1,201)
20
2,420
2005
(1,310)
462
(1,850)
122
(2,576)
2004
30,071
5,171
(202)
(759)
405
–
34,686
2005
34,686
1,414
(5,132)
1,627
689
111
33,395
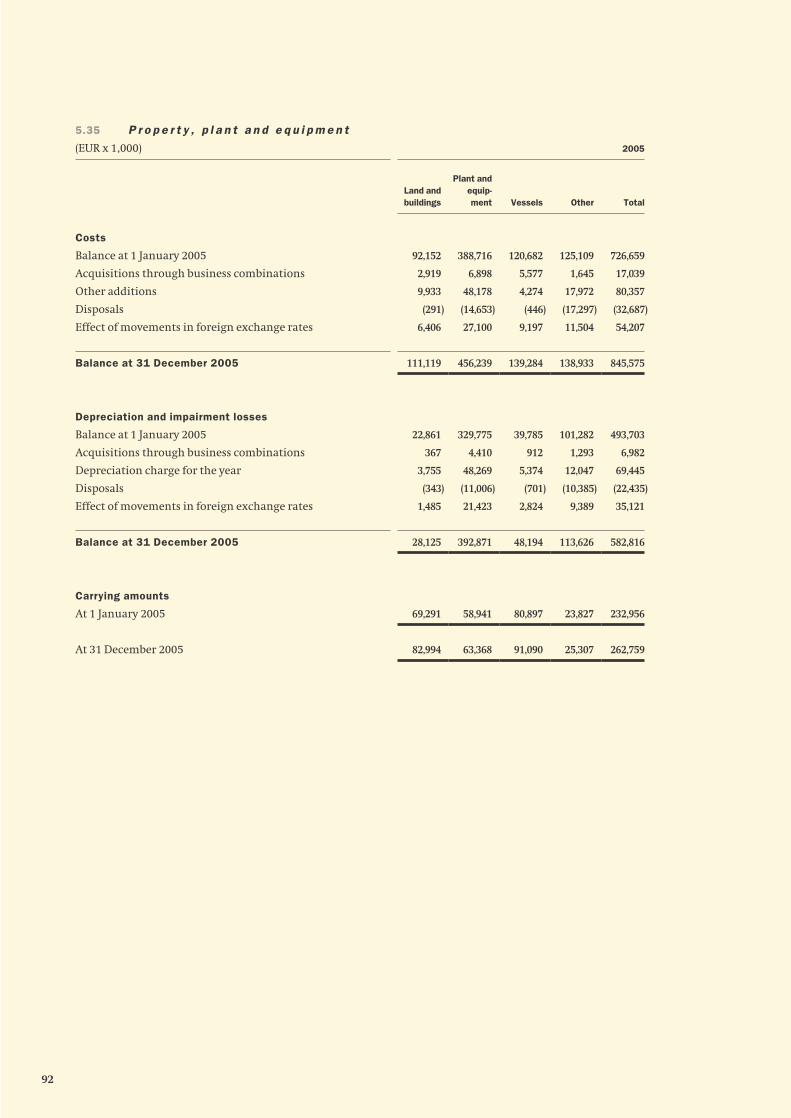
5.35 P r o p e r t y , p l a n t a n d e q u i p m e n t
(EUR x 1,000)
Costs
Balance at 1 January 2005
Acquisitions through business combinations
Other additions
Disposals
Effect of movements in foreign exchange rates
Balance at 31 December 2005
Depreciation and impairment losses
Balance at 1 January 2005
Acquisitions through business combinations
Depreciation charge for the year
Disposals
Effect of movements in foreign exchange rates
Balance at 31 December 2005
Carrying amounts
At 1 January 2005
At 31 December 2005
92
2005
Total
726,659
17,039
80,357
(32,687)
54,207
845,575
493,703
6,982
69,445
(22,435)
35,121
582,816
232,956
262,759
Other
125,109
1,645
17,972
(17,297)
11,504
138,933
101,282
1,293
12,047
(10,385)
9,389
113,626
23,827
25,307
Vessels
120,682
5,577
4,274
(446)
9,197
139,284
39,785
912
5,374
(701)
2,824
48,194
80,897
91,090
Plant andequip-ment
388,716
6,898
48,178
(14,653)
27,100
456,239
329,775
4,410
48,269
(11,006)
21,423
392,871
58,941
63,368
Land and buildings
92,152
2,919
9,933
(291)
6,406
111,119
22,861
367
3,755
(343)
1,485
28,125
69,291
82,994

(EUR x 1,000)
Costs
Balance at 1 January 2004
Acquisitions through business combinations
Reclassification ROVs
Other additions
Disposals
Effect of movements in foreign exchange rates
Balance at 31 December 2004
Depreciation and impairment losses
Balance at 1 January 2004
Acquisitions through business combinations
Reclassification ROVs
Depreciation charge for the year
Disposals
Effect of movements in foreign exchange rates
Balance at 31 December 2004
Carrying amounts
At 1 January 2004
At 31 December 2004
5.35.1 Impairment loss and subsequent reversal
The company has not incurred nor reversed any impairment losses.
5.35.2 Tangible assets per segment
The category vessels include vessels and survey equipment. The carrying value of tangible fixed assets is
distributed as follows:
– Geotechnical division EUR 76 million (2004: EUR 61 million);
– Survey division EUR 107 million (2004: EUR 83 million);
– Geoscience division EUR 80 million (2004: EUR 89 million).
5.35.3 Assets under construction
Assets under construction included in other amount to EUR 3.4 million (2004 EUR 3.2 million).
93
Total
777,389
2,296
–
68,732
(97,450)
(24,308)
726,659
508,588
–
–
66,139
(65,412)
(15,612)
493,703
268,801
232,956
Other
209,347
1,345
(63,600)
14,311
(32,110)
(4,184)
125,109
144,569
–
(29,300)
14,086
(24,599)
(3,474)
101,282
64,778
23,827
Vessels
137,488
–
–
4,328
(16,476)
(4,658)
120,682
49,967
–
–
7,042
(15,816)
(1,408)
39,785
87,521
80,897
Plant andequip-ment
351,637
–
63,600
32,222
(46,386)
(12,357)
388,716
292,103
–
29,300
42,387
(23,995)
(10,020)
329,775
59,534
58,941
Land and buildings
78,917
951
–
17,871
(2,478)
(3,109)
92,152
21,949
–
–
2,624
(1,002)
(710)
22,861
56,968
69,291
2004

5.35.4 Leased vessels and equipment
The Group has no leased vessels and equipment that have to be included in property, plant and equipment.
5.35.5 Security
Land and Buildings includes EUR 23 million (2004: EUR 19 million) in the Netherlands, that serves as security for
mortgage loans (refer note 5.46).
5.36 I n t a n g i b l e a s s e t s
(EUR x 1,000)
Cost
Balance at 1 January 2005
Acquisitions through business combinations
Adjustments prior period
Internally developed intangible assets
Effect of movements in foreign exchange rates
Balance at 31 December 2005
Amortisation and impairment losses
Balance at 1 January 2005
Amortisation charge for the year
Effect of movements in foreign exchange rates
Balance at 31 December 2005
Carrying amount
At 1 January 2005
At 31 December 2005
94
Total
329,308
18,695
(8,723)
4,750
7,949
351,979
35,317
5,318
1,074
41,709
293,991
310,270
Other
3,165
1,677
–
73
579
5,494
835
584
197
1,616
2,330
3,878
Software
51,711
–
–
4,677
863
57,251
34,482
4,734
877
40,093
17,229
17,158
Goodwill
274,432
17,018
(8,723)
–
6,507
289,234
–
–
–
–
274,432
289,234
2005

(EUR x 1,000)
Cost
Balance at 1 January 2004
Acquisitions through business combinations
Adjustments prior period
Internally developed intangible assets
Effect of movements in foreign exchange rates
Balance at 31 December 2004
Amortisation and impairment losses
Balance at 1 January 2004
Amortisation charge for the year
Effect of movements in foreign exchange rates
Balance at 31 December 2004
Carrying amount
At 1 January 2004
At 31 December 2004
In 2005 significant amounts were spent on research which have been recognised in the profit and loss account,
the same accounts for 2004.
5.36.1 Amortisation charge
The amortisation charge is separately recognised in the income statement.
5.37 I m p a i r m e n t t e s t s f o r c a s h g e n e r a t i n g u n i t s c o n t a i n i n g g o o d w i l l
The following units have significant carrying amounts of goodwill:
(EUR x 1,000)
Airborne
Survey
Jason group
Robertson group
Other
Total
95
Total
302,701
1,335
22,877
4,436
(2,041)
329,308
28,750
7,078
(511)
35,317
273,951
293,991
Other
1,860
1,335
–
–
(30)
3,165
527
334
(26)
835
1,333
2,330
Software
47,782
–
–
4,436
(507)
51,711
28,223
6,744
(485)
34,482
19,559
17,229
Goodwill
253,059
–
22,877
–
(1,504)
274,432
–
–
–
–
253,059
274,432
2004
2004
18,475
92,126
77,466
78,587
7,778
274,432
2005
20,786
103,731
78,013
77,011
9,693
289,234

Annually or when there is an indication for impairment the Group carries out impairment tests on these
balances for the relevant cash-generating unit. The system and calculation method are already described in
separate notes. The period for the discounted cash flow calculations is in principle indefinite. However the
Group has set the period at 50 years, subject to periodic evaluation, for the following reasons.
About 70% of the Group’s activities relate to the oil and gas industry. The services are in principle of such a
nature that our clients use us to help them to explore and extract hydrocarbon and mineral resources.
Experts are without doubt that these resources will continue to be available to mankind for many decades
and their reports indicate periods between 50 and 100 years.
Easily accessible places may ‘dry-up’ but with new techniques and means more hostile areas can also be
exploited. The Group has with its high market shares and specialised techniques a solid position to continue
to serve its customers.
The Group recognises that harnessing alternative means of energy, like wind, nuclear and hydro electric
energy will continue. These sources however have limited output and will be difficult to transport.
The recoverable amounts of the various cash generating units that carry goodwill are determined on
calculations of value in use. Those calculations use cash flow projections based on actual operating results and a
five year forecast. Cash flows for further future periods are extrapolated using growth rate percentages varying
from 0 to 7% which are deemed appropriate because of the long term nature of the business. These growth rates
are also consistent with the long term averages in the industry based on value in use. A pre-tax discount rate of
9.5% has been used for discounting the projected cash flows.
The key assumptions and the approach to determine their value are the growth rates that are based on
analysis of the long-term market price trends in the oil and gas industry adjusted for actual experience.
The carrying amounts of the units remain below the recoverable amounts and as such no impairment losses
are accounted for. Future adverse changes in the assumptions could however reduce the recoverable amounts
below the carrying amount.
5.38 F i n a n c i a l f i x e d a s s e t s
The Group holds the following associated subsidiaries, associates and other investments:
(EUR x 1,000)
Associated subsidiaries
Other investments at cost
Long term loans
Other long term receivables
The Group’s share in realised profit in the above mentioned associated subsidiaries amounted to
EUR 240 thousand in 2005 (2004: EUR 139 thousand).
In 2005 the 40% share in Chartco, in the UK was divested. The selling price amounted to EUR 0.7 million.
96
2004
2,562
1,609
3,907
1,209
9,287
2005
1,780
1,413
250
1,569
5,012
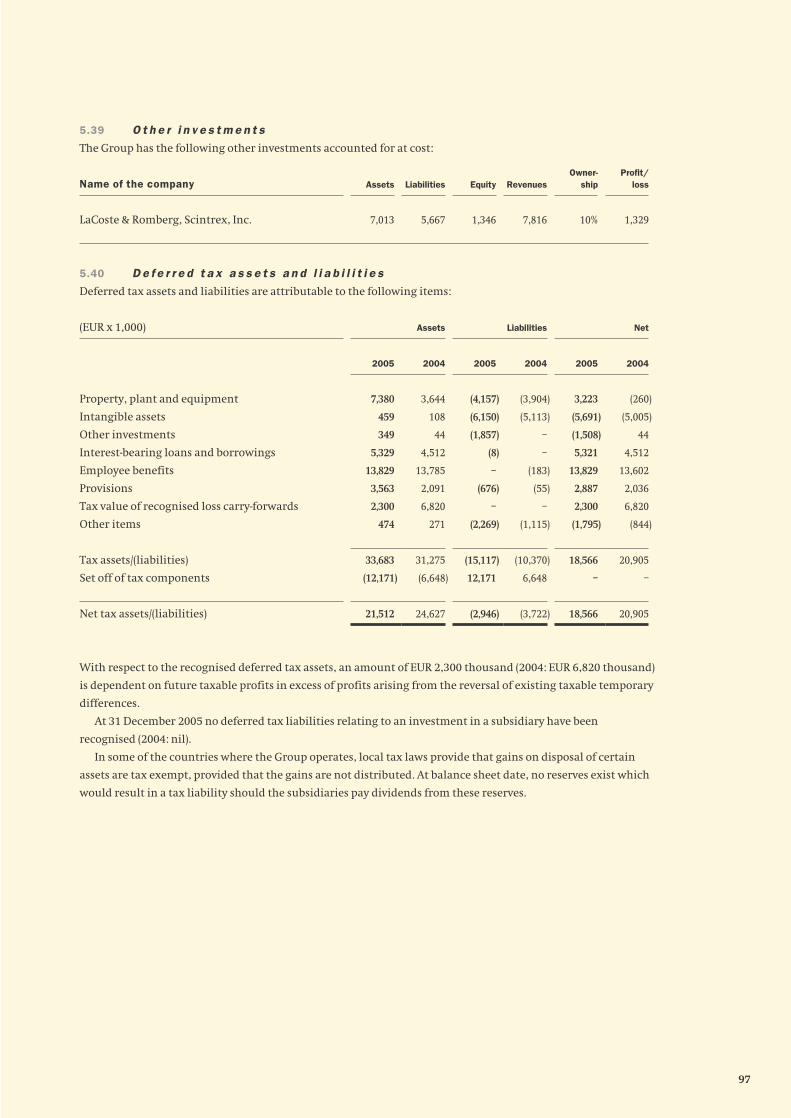
5.39 O t h e r i n v e s t m e n t s
The Group has the following other investments accounted for at cost:
Name of the company
LaCoste & Romberg, Scintrex, Inc.
5.40 D e f e r r e d t a x a s s e t s a n d l i a b i l i t i e s
Deferred tax assets and liabilities are attributable to the following items:
(EUR x 1,000)
Property, plant and equipment
Intangible assets
Other investments
Interest-bearing loans and borrowings
Employee benefits
Provisions
Tax value of recognised loss carry-forwards
Other items
Tax assets/(liabilities)
Set off of tax components
Net tax assets/(liabilities)
With respect to the recognised deferred tax assets, an amount of EUR 2,300 thousand (2004: EUR 6,820 thousand)
is dependent on future taxable profits in excess of profits arising from the reversal of existing taxable temporary
differences.
At 31 December 2005 no deferred tax liabilities relating to an investment in a subsidiary have been
recognised (2004: nil).
In some of the countries where the Group operates, local tax laws provide that gains on disposal of certain
assets are tax exempt, provided that the gains are not distributed. At balance sheet date, no reserves exist which
would result in a tax liability should the subsidiaries pay dividends from these reserves.
97
Profit/loss
1,329
Owner-ship
10%
Revenues
7,816
Equity
1,346
Liabilities
5,667
Assets
7,013
2004
(260)
(5,005)
44
4,512
13,602
2,036
6,820
(844)
20,905
–
20,905
2005
3,223
(5,691)
(1,508)
5,321
13,829
2,887
2,300
(1,795)
18,566
–
18,566
2004
(3,904)
(5,113)
–
–
(183)
(55)
–
(1,115)
(10,370)
6,648
(3,722)
2005
(4,157)
(6,150)
(1,857)
(8)
–
(676)
–
(2,269)
(15,117)
12,171
(2,946)
2004
3,644
108
44
4,512
13,785
2,091
6,820
271
31,275
(6,648)
24,627
2005
7,380
459
349
5,329
13,829
3,563
2,300
474
33,683
(12,171)
21,512
NetLiabilitiesAssets

Movement in temporary differences during the year
(EUR x 1,000)
Property, plant and equipment
Intangible assets
Other investments
Interest-bearing loans and borrowings
Employee benefits
Share based payments
Provisions
Tax value of recognised loss carry-forward
Exchange differences
Other items
(EUR x 1,000)
Property, plant and equipment
Intangible assets
Other investments
Interest-bearing loans and borrowings
Employee benefits
Share based payments
Provisions
Tax value of recognised loss carry-forward
Exchange differences
Other items
Deferred tax assets have not been recognised in respect of the following items:
Unrecognised deferred tax assets
(EUR x 1,000)
Deductible temporary differences
Tax losses
Capital allowances
Total
98
2004
4,516
20,269
9,901
34,686
2005
4,177
18,777
10,441
33,395
Balance31-12-2005
3,223
(5,691)
(1,508)
5,321
13,835
–
2,887
2,300
–
(1,801)
18,566
Recog-nised in
equity
–
–
–
462
(1,310)
(1,850)
–
(92)
220
(6)
(2,576)
Recog-nised inincome
3,483
(686)
(1,552)
347
1,543
1,850
851
(4,428)
(220)
(951)
237
Acqui-sitions
–
–
–
–
–
–
–
–
–
–
–
Balance01-01-2005
(260)
(5,005)
44
4,512
13,602
–
2,036
6,820
–
(844)
20,905
2005
Balance31-12-2004
(260)
(5,005)
44
4,512
13,602
–
2,036
6,820
–
(844)
20,905
Recog-nised in
equity
–
–
–
2,582
1,019
(1,201)
–
–
20
–
2,420
Recog-nised inincome
(331)
(217)
(1,378)
889
(647)
1,201
905
(2,284)
(20)
386
(1,496)
Acqui-sitions
271
–
–
–
–
–
–
790
–
–
1,061
Balance01-01-2004
(200)
(4,788)
1,422
1,041
13,230
–
1,131
8,314
–
(1,230)
18,920
2004

Of the total recognised and unrecognised deferred tax assets in respect of tax losses carried forward an amount
of EUR 644 thousand expires in periods varying from two to five years. An amount of EUR 2,558 thousand expires
between five and ten years and an amount of EUR 17,875 thousand can be offset indefinitely. The deductible
temporary differences and capital allowances do not expire under current tax legislation. Deferred tax assets
have not been recognised in respect of these items because it is not probable that future taxable profit will be
available against which the Group can utilise these benefits.
5.41 I n v e n t o r i e s
(EUR x 1,000)
Work in progress
Inventories
Seismic libraries
(EUR x 1,000)
Work in progress
Costs less provision for losses
Addition for profit element
Less: contractual advances received
Inventories
During 2005 EUR 8,858 thousand (2004: EUR 3,515 thousand) of inventories were recognised as an expense and
EUR 117 thousand (2004: EUR 415 thousand) was written down in the profit and loss account.
(EUR x 1,000)
Seismic data
Net realisable value
5.42 T r a d e a n d o t h e r r e c e i v a b l e s
(EUR x 1,000)
Unbilled revenue on completed projects
Trade receivables
Non-trade receivables
Fair value derivatives
Trade receivables due from associated subsidiaries
99
2004
7,295
4,847
39,660
51,802
2004
14,120
2,619
(9,444)
7,295
2005
7,615
5,569
48,765
61,949
2005
7,334
686
(405)
7,615
2004
39,660
2005
48,765
2004
62,496
228,872
44,192
417
147
336,124
2005
82,583
261,804
55,631
–
336
400,354

At 31 December 2005 trade receivables include retentions of EUR 2.3 million (2004: EUR 4.8 million) relating to
work in progress.
Trade receivables are shown net of impairment losses amounting to EUR 23.4 million (2004: EUR 17.2 million)
arising from identified doubtful receivables from customers.
5.43 C a s h a n d c a s h e q u i v a l e n t s
(EUR x 1,000)
Bank balances, cash, and cash equivalents
Bank overdrafts
Cash and cash equivalents in the statement of cash flows
5.44 C a p i t a l a n d r e s e r v e s
Reconciliation of movement in capital and reserves
(EUR x 1,000)
Balance at 1 January 2005
Total recognised gains and losses
Share options exercised
by employees
Addition to reserves
Issued shares/stockdividend
Dividends to shareholders
Balance at 31 December 2005
(EUR x 1,000)
Balance at 1 January 2004
Total recognised gains and losses
Share options exercised
by employees
Addition to reserves
Own shares acquired
Stockdividend
Dividends to shareholders
Balance at 31 December 2004
100
2004
26,330
(41,018)
(14,688)
2005
74,892
(35,430)
39,462
Total equity
213,664
19,077
5,686
–
(761)
–
(9,426)
228,240
Minorityinterest
2,468
1,859
–
–
–
–
–
4,327
Total
211,196
17,218
5,686
–
(761)
–
(9,426)
223,913
Unappro-priatedresult
18,872
49,317
–
(9,369)
–
(77)
(9,426)
49,317
Reserve for ownshares
(23,808)
–
5,686
–
(761)
–
–
(18,883)
Other reserves
53,757
(1,990)
–
9,369
–
–
–
61,136
Hedgingreserve
(4,146)
(6,339)
–
–
–
–
–
(10,485)
Translationreserve
(43,671)
(23,770)
–
–
–
–
–
(67,441)
Share premium
207,159
–
–
–
–
–
–
207,159
Share capital
3,033
–
–
–
–
77
–
3,110
2004
Total equity
228,240
152,609
9,351
–
94,674
(14,088)
470,786
Minorityinterest
4,327
999
–
–
–
–
5,326
Total
223,913
151,610
9,351
–
94,674
(14,088)
465,460
Unappro-priatedresult
49,317
99,412
–
(35,192)
(37)
(14,088)
99,412
Reserve for ownshares
(18,883)
–
9,351
–
–
–
(9,532)
Other reserves
61,136
16,457
–
35,192
–
–
112,785
Hedgingreserve
(10,485)
(2,062)
–
–
–
–
(12,324)
Translationreserve
(67,441)
37,803
–
–
–
–
(29,638)
Share premium
207,159
–
–
–
94,380
–
301,539
Share capital
3,110
–
–
–
331
–
3,441
2005

5.44.1 Share capital and share premium
(In thousands of shares)
On issue and fully paid at 1 January
Convertible converted into ordinary shares
Stock dividend 2004 respectively 2003
Repurchased for option plan at year end
On issue at 31 December – fully paid
At 31 December 2005 the authorised share capital comprised 320,000,000 ordinary shares (2004: 320,000,000).
No preference shares have been issued. The shares have a par value of EUR 0.05 (refer note 5.15).
The holders of ordinary shares are entitled to receive dividends as approved by the Annual General Meeting
from time to time and are entitled to one vote per share at meetings of the Company. As per 31 December 2005
the Directors propose a dividend to be paid out in the form of a cash dividend of EUR 0.60 (2004: EUR 0.48) per
depository receipt of a share with a nominal value of EUR 0.05 or in the form of (depository receipts of) ordinary
shares with a nominal value of EUR 0.05 charged to the reserves. This dividend proposal is currently part of
unappropriated result.
5.44.2 Share premium
The share premium can be considered as paid in capital.
5.44.3 Translation reserve
The translation reserve comprises all foreign exchange differences, as from 1 January 2003, arising from the
translation of the financial statements of foreign operations that are not integral to the operations of the
Company, as well as from the translation of liabilities that hedge the Company’s net investment in a foreign
subsidiary.
5.44.4 Hedging reserve
The hedging reserve comprises the effective portion of the cumulative net change in the fair value of cash flow
hedging instruments where the hedged transactions have not yet occurred.
5.44.5 Reserve for own shares
The Company has, in view of its option plan repurchased 92 (certificates of) own shares during the year under
review with an average price of EUR 17.31 (2004: 60,876 certificates with an average price of EUR 12.50). Further
703,000 certificates were sold with an average price of EUR 20.96 following the exercise by the option holders
(2004: 774,720 certificates at EUR 14.57). As per the end of the year under review the Company holds 938,696 own
shares (2004: 1,641,604). The number of treasury shares held by the Company at the end of the year under review
amounts to 1,4% of the issued and paid up capital (2004: 2.6%).
101
2004
60,664
–
1,528
(1,644)
60,548
2005
62,191
5,898
736
(939)
67,886
Ordinary shares

5.44.6 Unappropriated result
After the balance sheet date the following dividends were proposed by the Board of Management. There are no
income tax consequences related to this proposal.
(EUR x 1,000)
EUR 0.60 per qualifying ordinary share (2004: EUR 0.48)
5.45 E a r n i n g s p e r s h a r e
The average basic earnings per share for the period amounts to EUR 1.51 (2004: EUR 0.83); the diluted earnings
per share amount to EUR 1.40 (2004: EUR 0.82).
The calculation of basic earnings per share at 31 December 2005 was based on the net profit attributable to
ordinary shareholders of EUR 99,412 thousand (2004: EUR 49,317 thousand) and a weighted average number
of ordinary shares outstanding during the year ended 31 December 2005 of 65,976 thousand (2004:
59,360 thousand), calculated as follows:
5.45.1 Basic earnings per share
Net profit attributable to ordinary shareholders
(EUR x 1,000)
Net profit for the year
Net profit attributable to ordinary shareholders
Weighted average number of ordinary shares
(In thousands of shares)
Issued ordinary shares at 1 January
Effect of own shares purchased
Effect of shares issued due to exercised option rights
Effect of shares issued due to optional dividend
Effect of conversion convertible loan
Weighted average number of ordinary shares at 31 December
102
2004
28,760
28,760
2005
40,732
40,732
2004
49,317
49,317
2005
99,412
99,412
2004
58,308
(44)
256
840
–
59,360
2005
60,550
–
450
397
4,579
65,976
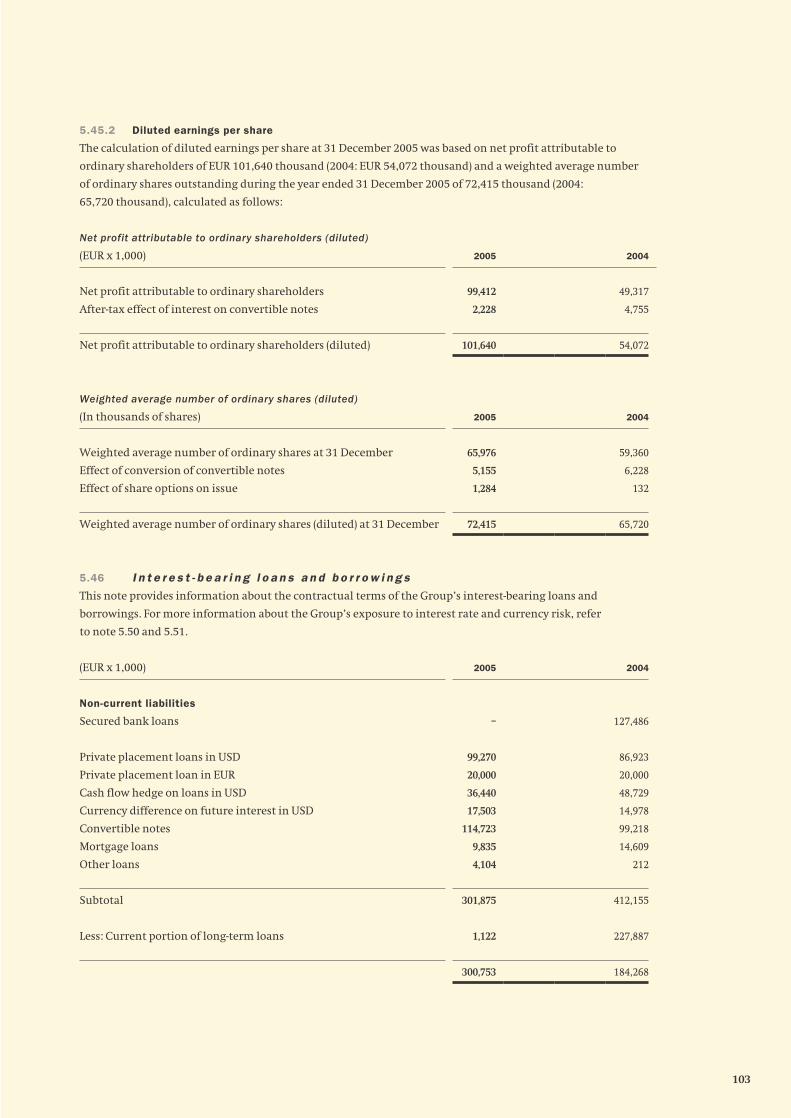
5.45.2 Diluted earnings per share
The calculation of diluted earnings per share at 31 December 2005 was based on net profit attributable to
ordinary shareholders of EUR 101,640 thousand (2004: EUR 54,072 thousand) and a weighted average number
of ordinary shares outstanding during the year ended 31 December 2005 of 72,415 thousand (2004:
65,720 thousand), calculated as follows:
Net profit attributable to ordinary shareholders (diluted)
(EUR x 1,000)
Net profit attributable to ordinary shareholders
After-tax effect of interest on convertible notes
Net profit attributable to ordinary shareholders (diluted)
Weighted average number of ordinary shares (diluted)
(In thousands of shares)
Weighted average number of ordinary shares at 31 December
Effect of conversion of convertible notes
Effect of share options on issue
Weighted average number of ordinary shares (diluted) at 31 December
5.46 I n t e r e s t - b e a r i n g l o a n s a n d b o r r o w i n g s
This note provides information about the contractual terms of the Group’s interest-bearing loans and
borrowings. For more information about the Group’s exposure to interest rate and currency risk, refer
to note 5.50 and 5.51.
(EUR x 1,000)
Non-current liabilities
Secured bank loans
Private placement loans in USD
Private placement loan in EUR
Cash flow hedge on loans in USD
Currency difference on future interest in USD
Convertible notes
Mortgage loans
Other loans
Subtotal
Less: Current portion of long-term loans
103
2004
59,360
6,228
132
65,720
2005
65,976
5,155
1,284
72,415
2004
49,317
4,755
54,072
2005
99,412
2,228
101,640
2004
127,486
86,923
20,000
48,729
14,978
99,218
14,609
212
412,155
227,887
184,268
2005
–
99,270
20,000
36,440
17,503
114,723
9,835
4,104
301,875
1,122
300,753

Terms and debt repayment schedule
(EUR x 1,000)
Private Placement loans:
44 million USD bonds 2012 at 6.45%
39 million USD bonds 2014 at 6.49%
37 million USD bonds 2017 at 6.58%
20 million Eurobonds 2012, fixed at 6.45%
Convertible notes:
EUR – fixed at 4.75%
Other loans
The bank loans are secured by land and buildings with a carrying amount of EUR 23.0 million
(2004: EUR 19.0 million).
5.46.1 Credit facilities
In 2005 a revolving credit facility was agreed with ABN-AMRO Bank N.V. and Rabobank of EUR 100 million for a
five years term. The interest rate is fixed at EURIBOR plus 35 basis points.
5.46.2 Private Placement USD loans
In May 2002 long term loans were concluded with twenty American and two British institutional investors.
The conditions for the loans are based on annual accounts prepared under the previous accounting principles
(Dutch GAAP):
– Equity > EUR 200 million
– EBITA/Interest > 2.5
– Debt/EBITA < 3.0
– Debt (excluding private placement and convertible notes) < 15% of the consolidated balance sheet total.
At the 12 month rolling forward measurement dates in 2004 and 2005, the company complied with the above
conditions.
The currency exchange risk on the loans in USD and also the (future) interest payable on these loans are
hedged for the entire term of the loans by means of ‘cross currency swaps’. Since the hedges are effective, hedge
accounting is applied. Initial recognition has taken place at the exchange rate of the transaction. At reporting
date the loans are valued at the closing rate. The currency exchange difference on the loans between the initial
exchange rate or the exchange rate at the last balance sheet date is accounted for in the profit and loss account.
Further the related ‘cross currency swaps’ are converted at market value at the reporting date. Differences
between the initial market value or the last revision and the market value per reporting date are also included in
the profit and loss account.
For the year under review the currency exchange differences on loans in USD amount to EUR 12,289 thousand
positive (2004: EUR 7,271 thousand negative), while the movement due to the change in the fair value of the
related currency hedge financial instruments amounts to EUR 14,814 thousand positive (2004: EUR 15,967
thousand negative). The latter amount is debited to equity, less the part that is attributable to the loans as hedge
result being EUR 12,289 thousand (2004: EUR 7,271 thousand) which amount is charged to the profit and loss
account.
Every five years, for the first time in 2007, based on the currency exchange USD – EUR the conversion rate of
the loans, deviations that lead to a higher loan amount in EUR than originally recognised or at the last reset date
result in an inflow of cash for the group amounting to the difference. Deviations that lead to a lower loan
amount in EUR than originally recognised or at the last reset date result in an outflow (inflow) of cash for the
group amounting to the difference to the issuer of the hedge instrument.
104
More than5 years
56,178
49,794
47,241
20,000
114,723
7,157
295,093
2 – 5years
–
–
–
–
–
2,199
2,199
1 – 2years
–
–
–
–
–
888
888
1 year or less
–
–
–
–
–
2,573
2,573
Total
56,178
49,794
47,241
20,000
114,723
12,817
300,753

With respect to the hedge contracts relating to the future interest payments on the USD loans during the year
under review an amount of EUR 2,062 thousand (2004: EUR 6,339 thousand negative) net after taxes has been
added to equity as a result of the increase in the currency exchange rate of the USD against the EUR. The in the
equity recorded cumulative currency exchange difference on these hedge contracts concerning the future
interest payments amounts to EUR 17,503 thousand (2004: EUR 14,978 thousand).
5.46.3 Convertible notes
(EUR x 1,000)
Proceeds from issue of convertible notes
Redemption of convertible loan
Converted into ordinary shares
Transaction costs
Net proceeds
Amount classified as equity
Transaction costs amortised
Carrying amount of liability at 31 December
The recognised amount of the convertible notes classified as equity of EUR 7,555 is net of attributable
transaction costs.
From 12 May 2000 till March 2005 the holders of the EUR 100 million subordinated convertible loan had the
option to convert notes held for share certificates at a conversion price of EUR 16.05 per treasury share of
nominal EUR 0.05 each. During the six months ended 30 June 2005 the holders converted EUR 94.7 million of
notes into 5,897,804 share certificates.
From 6 June 2005 up to and including 20 April 2010 holders of the EUR 125 million convertible loan have the
option to convert notes held for share certificates at a conversion price of EUR 24.25 per depository receipt of
share of nominal EUR 0.05 each. The Group has the right to redeem the convertible notes if, as from 11 May
2008, the closing price of depository receipts of shares shall on 20 out of 30 consecutive trading days at least
equal 130% (EUR 31.53) of the conversion price. Notes that are not converted to ordinary shares will be redeemed
at face value on 27 April 2010.
5.46.4 Mortgage and other loans
The average interest rate on mortgage loans and other loans over one year amounts to 9.4% (2004: 5.6%).
105
2004
100,000
–
–
(2,500)
97,500
(657)
2,375
99,218
2005
225,000
(5,326)
(94,674)
(3,202)
121,798
(7,555)
480
114,723

5.47 E m p l o y e e b e n e f i t s
(EUR x 1,000)
Present value of funded obligations
Fair value of plan assets
Present value of net obligations
Recognised actuarial gains (losses)
Recognised liability for defined benefit obligations
Liability for long service leave
Total employee benefits
Liability for defined benefit obligations
The Group makes contributions to a number of defined benefit plans that provide pension benefits for
employees upon retirement in a number of countries being: the Netherlands, United Kingdom, and Norway.
In all other countries the pension plans qualify as Defined Contribution plans and/or similar arrangements for
employees, if customary, are maintained, taking local circumstances into account. As in the USA a 401 K plan
exists the contribution to which is based on an agreed scheme in conformity with IRS regulations.
As of 1 January 2005 the existing final pay pension scheme in the Netherlands has been replaced by
a average pay pension scheme. This scheme qualifies as a ‘defined benefit plan’ under IFRS.
In the Netherlands the ‘defined benefit’ pension plans are fully re-insured. In determining the annual costs
the nature of the plan is recognised which includes (conditional) indexation of pension benefits insofar as the
return on the separated investments surpasses the actuarial required interest. The required reserves of these
obligations are, net of plan assets, recognised in the balance sheet.
In the UK Fugro operates a number of pension schemes. The only pension schemes open for new staff are
defined contribution schemes. There is one defined benefits scheme which remains open for long serving staff
and there are other defined benefit schemes which have been closed but have ongoing liabilities to their
members. Measures have been taken that the reserves needed to honour current and past defined benefit
scheme arrangements are available when required.
In Norway a ‘defined benefit’ pension plan exists that, combined with the available State pension plan, leads
to a pension on the age of 67 years based on a defined maximum. The contribution of the employer consists of
a premium based on an expected return on plan assets and the (positive or negative) investment risk.
Movements in the net liability recognised in the balance sheet
(EUR x 1,000)
Net liability at 1 January
Contributions made
Expense recognised in the income statement
Actuarial differences
Exchange rate differences
Net liability at 31 December
106
2004
174,588
130,277
44,311
2,075
46,386
1,822
48,208
2005
187,000
142,686
44,314
(1,817)
42,497
4,658
47,155
2004
43,017
(7,894)
7,950
3,313
–
46,386
2005
46,386
(6,586)
6,029
(3,892)
560
42,497

Expenses recognised in the income statement
(EUR x 1,000)
Current service costs
Interest on obligation
Expected return on plan assets
Past service costs
Results on change of pension plans
The expenses are recognised in the following line items in the income statement:
(EUR x 1,000)
Personnel expenses
Interest
Actual return on plan assets
Liability for defined benefit obligations
Principal actuarial assumptions at the balance sheet date (expressed as weighted averages):
Discount rate at 31 December
Expected return on plan assets at 31 December
Future salary increases
Medical cost trend rate
Future pension increases
107
2004
6,023
8,827
(7,601)
234
467
7,950
2005
4,038
9,587
(8,208)
1,087
(475)
6,029
2004
6,724
1,226
7,950
7,601
2005
4,650
1,379
6,029
8,208
2004
5 – 6%
4 – 8%
3%
n/a
1 – 3%
2005
4 – 5%
4 – 8%
2 – 3%
n/a
1 – 3%

5.48 P r o v i s i o n s
(EUR x 1,000)
Balance at 1 January
Provisions made during
the year
Provisions used during the year
Provisions reversed during
the year
Exchange rate differences
Balance at 31 December
Non-current
Current
5.49 T r a d e a n d o t h e r p a y a b l e s
(EUR x 1,000)
Trade payables
Advance instalments to construction work in progress
Fair value derivatives
Non-trade payables and accrued expenses
5.50 T r a n s l a t i o n r i s k a n d c u r r e n c y r i s k
The global nature of the business expose the operations and reported financial results and cash flows to the risks
arising from fluctuations in exchange rates. The Group’s business is exposed to currency risk whenever it
has revenues in a currency that is different from the currency in which it incurs the costs of generating those
revenues. Once the revenues are offset against the incurred costs in the same currency, the remainder may be
affected if the value of the currency in which the revenues are generated declines relative to the Group’s
reporting currency. This risk exposure primarily affects those operations of the Group that generates a
significant portion of their revenues in foreign currencies and incurs their costs primarily in Euros.
Cash inflows and outflows of the business segments are offset if they are denominated in the same currency.
This means that revenues generated in a particular currency balance out costs in the same currency, even if the
revenues arise from a different transaction than that in which the costs are incurred. As a result, only the
unmatched amounts are subject to currency risk.
To mitigate the impact of currency exchange rate fluctuations, the Group continually assesses the exposure
to currency risks and a portion of those risks is hedged by using derivative financial instruments. The principal
derivative financial instruments used to cover foreign currency exposure are forward foreign currency exchange
contracts.
The principal amounts of the Group’s USD loans and the future interest payments (see note 5.46) have been
fully hedged by means of ‘cross currency swap’ transactions using the same dates as the loans and the interest
thereon are due for (re)payment.
108
2004
66,554
14,467
–
138,573
219,594
2005
77,631
22,670
499
147,296
248,096
Total
23,032
5,915
(26,888)
(10)
(11)
2,038
1,075
963
2,038
Other
1,507
–
(1,447)
(60)
–
–
–
–
–
Onerouscontracts
–
745
(439)
50
(8)
348
–
348
348
Restruc-turing
21,525
5,170
(25,002)
–
(3)
1,690
1,075
615
1,690
Total
2,038
2,037
(2,630)
–
–
1,445
398
1,047
1,445
Other
–
–
–
–
–
–
–
–
–
Onerouscontracts
348
381
(182)
–
–
547
–
547
547
Restruc-turing
1,690
1,656
(2,448)
–
–
898
398
500
898
2005 2004

Forecasted transactions
The Group classifies its firm commitments from forward exchange contracts hedging and forecasted
transactions as cash flow hedges and states them at fair value. The net fair value of forward exchange contracts
used as hedges of firm commitments and forecasted transactions at 31 December 2005 was EUR 499 thousand
(2004: EUR 417 thousand), comprising assets of EUR – (2004: EUR 417 thousand) and liabilities EUR 499 thousand
(2004: –) that were recognised in fair value derivatives.
5.50.1 Effect of currency translation
Many of the Group’s subsidiaries are located outside the euro zone. Since the financial reporting currency of the
Group is the euro, income statements of these subsidiaries are translated into euros in order to include their
financial result in the consolidated financial statements. Period-to-period changes in the average exchange rate
for a particular country’s currency can significantly affect the translation of both revenues and operating
income denominated in that currency into euros. Unlike the effect of exchange rate fluctuations on transaction
exposure, the exchange rate translation risk does not affect local currency cash flows.
The Group has assets and liabilities outside the euro zone. These assets and liabilities are denominated in
local currencies and reside primarily in the United States, United Kingdom and Far East holding subsidiaries.
When the net assets are converted into euros, currency fluctuations result in period-to period changes in those
net asset values. The equity position of the holding company reflects these changes in net asset values and the
long term currency risk inherent in these investments are periodically evaluated. In general the Group does not
hedge against this type of risk, except in specific circumstances.
5.51 I n t e r e s t r a t e r i s k
The Group holds a variety of interest rate sensitive assets and liabilities to manage the liquidity and cash needs
of the day-to-day operations. The long term external financing of the Group is primarily based on liabilities
bearing long term fixed interest rates.
5.52 C r e d i t r i s k
Management has a credit policy in place and the exposure to credit risk is monitored on an ongoing basis. Credit
evaluations are performed on all customers requiring credit over a certain amount. The Group does not require
collateral in respect of financial assets.
Investments are allowed only in liquid securities and only with counterparties that have a credit rating equal
to or better than the Group. Transactions involving derivative financial instruments are with counterparties,
that have high credit ratings and with whom the Group has a signed netting agreement. Given their high credit
ratings, management does not expect any counterparty to fail to meet its obligations.
At balance sheet date there were no significant concentrations of credit risk. The maximum exposure to
credit risk is represented by the carrying amount of each financial asset, including derivative financial
instruments, in the balance sheet.
5.53 H e d g i n g
The Group adopts a policy of reducing its exposure to changes in interest rates on bank loans by entering into
agreements with a fixed rate. Further the currency risks on long term financial liabilities in foreign currencies
are fully hedged. Cross currency swaps, denominated in EUR, have been entered into to achieve this purpose.
The swaps mature over the next 15 years following the maturity of the related loans (refer following table)
and have interest rates ranging from 6.45% to 6.58%. At 31 December 2005 the Group had cross currency swap
contracts with a notional contract amount of USD 120 million (2004: USD 120 million).
The Group classifies interest rate cross currency swaps as cash flow hedges and states them at fair value.
The net fair value of swaps at 31 December 2005 was EUR 17,503 thousand (2004: EUR 14,978 thousand)
comprising assets of EUR 36,440 thousand (2004: EUR 48,729 thousand) and liabilities of EUR 53,943 thousand
(2004: EUR 63,707 thousand). These amounts were recognised as fair value derivatives.
109

5.54 E f f e c t i v e i n t e r e s t r a t e s a n d r e p r i c i n g a n a l y s i s
In respect of income-earning financial assets and interest-bearing financial liabilities, the following table
indicates their effective interest rates at the balance sheet date and the periods in which they reprice.
(EUR x 1,000)
Cash and cash equivalents
USD fixed rate loan
EUR fixed rate loan
Convertible notes*
Effect of cross currency swaps
Effect of interest rate swaps
Mortgage and other loans*
Bank overdrafts
(EUR x 1,000)
Cash and cash equivalents
Secured bank loans
USD fixed rate loan
EUR fixed rate loan
Convertible notes*
Effect of cross currency swaps
Effect of interest rate swaps
Mortgage and other loans*
Bank overdrafts
* These assets/liabilities bear interest at a fixed rate.
110
2005
More than5 years
–
(99,270)
(20,000)
–
(36,440)
(17,503)
(7,157)
–
(180,370)
2 – 5years
–
–
–
(114,723)
–
–
(2,199)
–
(116,922)
1 – 2years
–
–
–
–
–
–
(888)
–
(888)
6 – 12months
–
–
–
–
–
–
( 2,573)
–
(2,573)
6 monthsor less
74,892
–
–
–
–
–
–
(35,430)
39,462
Total
74,892
(99,270)
(20,000)
(114,723)
(36,440)
(17,503)
(12,817)
(35,430)
(261,291)
Effectiveinterest
rate
0.00
6.45
6.45
3.83
6.45
6.45
9.39
3.75
2004
More than5 years
–
–
(86,923)
(20,000)
–
(48,729)
(14,978)
(5,809)
–
(176,439)
2 – 5years
–
–
–
–
–
–
–
(2,206)
–
(2,206)
1 – 2years
–
–
–
–
–
–
–
(5,623)
–
(5,623)
6 – 12months
–
(127,486)
–
–
–
–
–
(1,183)
–
(128,669)
6 monthsor less
26,330
–
–
–
(99,218)
–
–
–
(41,018)
(113,906)
Total
26,330
(127,486)
(86,923)
(20,000)
(99,218)
(48,729)
(14,978)
(14,821)
(41,018)
(426,843)
Effectiveinterest
rate
0.00
2.83
6.45
6.45
7.81
6.45
6.45
5.58
3.75

5.55 R e c o g n i s e d a s s e t s a n d l i a b i l i t i e s
Changes in the fair value of forward exchange contracts that economically hedge monetary assets and liabilities
in foreign currencies and for which no hedge accounting is applied are recognised in the income statement.
Both the changes in fair value of the forward contracts and the foreign exchange gains and losses relating to
the monetary items are recognised as part of ‘net financing costs’ (refer note 5.22.4). The fair value of forward
exchange contracts used as economic hedges of monetary assets and liabilities in foreign currencies at
31 December 2005 was EUR 499 thousand (2004: EUR –), comprising of assets EUR – (2004: 417 thousand) and
liabilities EUR 499 thousand (2004: EUR –) recognised in fair value derivatives.
5.56 S e n s i t i v i t y a n a l y s i s
In managing interest rate and currency risks the Group aims to reduce the impact of short term fluctuations on
the Group’s earnings. Over the longer term, however, permanent changes in foreign exchange and interest rates
would have an impact on consolidated earnings.
At 31 December 2005 it is estimated that a general increase of one percentage point in interest rates would
decrease the Group’s profit before tax by approximately EUR 0.4 million negative (2004: EUR 2.5 million
negative). Interest rate swaps have been included in this calculation.
It is estimated that a general increase of one percentage point in the value of the EUR against other foreign
currencies would have decreased the Group’s profit before tax by approximately EUR 0.1 million positive for the
year ended 31 December 2005 (2004: EUR 0.4 million negative). The forward exchange contracts have been
included in this calculation.
5.57 F a i r v a l u e s
The fair values of the following financial instruments differ from their carrying amounts shown in the
balance sheet:
(EUR x 1,000)
Trade and other receivables (excl WIP)
Cash and cash equivalents
Forward exchange contracts – Assets
Forward exchange contracts – Liabilities
Secured bank loans
Convertible notes
Mortgage loans
USD fixed rate loans
EUR fixed rate loan
Cash flow hedge on USD loans
Cross currency interest swap
Bank overdraft
Trade and other payables
Total
Unrecognised gains/(losses)
111
Fairvalue
273,628
26,330
417
–
(127,486)
(102,260)
(14,609)
(86,923)
(24,034)
(48,729)
(14,978)
(41,018)
(219,594)
(379,256)
(7,076)
Carryingamount
273,628
26,330
417
–
(127,486)
(99,218)
(14,609)
(86,923)
(20,000)
(48,729)
(14,978)
(41,018)
(219,594)
(372,180)
–
Fairvalue
317,771
74,892
–
(499)
–
(157,500)
(9,835)
(99,270)
(24,034)
(36,440)
(17,503)
(35,430)
(248,096)
(235,944)
(46,811)
Carryingamount
317,771
74,892
–
(499)
–
(114,723)
(9,835)
(99,270)
(20,000)
(36,440)
(17,503)
(35,430)
(248,096)
(189,133)
–
2005 2004

Estimation of fair values
The following summarises the major methods and assumptions used in estimating the fair values of the
financial instruments reflected in the table.
Derivatives
Forward exchange contracts are marked to market using listed market prices.
Interest bearing borrowings
Fair value is calculated based on discounted expected future principal and interest cash flows.
Convertible notes
The fair value is based on the quoted market price as per 31 December 2005.
Fair value lease liabilities
The fair value is estimated as the present value of future cash flows, discounted at market interest for
homogeneous lease arrangements.
Trade and other receivable/payables
For receivables/payables with a remaining life of less than one year, the notional amount is deemed to reflect
the fair value. All other receivables/payables are discounted to determine the fair value.
Interest rates used for determining fair value
The group uses the government yield curve as of 31 December 2004 plus an adequate constant credit spread to
discount financial instruments. The interest rates used are as follows:
Derivatives
Loans and borrowings
Leases
Receivables
Fair value has been determined either by reference to the market value at the balance sheet date or by
discounting the relevant cash flows using current interest rates for similar instruments.
5.58 C o m m i t m e n t s n o t i n c l u d e d i n t h e b a l a n c e s h e e t
5.58.1 Operational leases as lessee
Non-cancellable operating lease rentals are payable as follows:
(EUR x 1,000)
Less than one year
Between one and five years
More than five years
The Group leases a number of offices and warehouse/laboratory facilities and vessels under operating leases.
The leases typically run for an initial period of between three and ten years, with in most cases an option to
renew the lease after that date. Lease payments are increased annually to reflect market rentals. None of the
leases include contingent rentals.
The Group does, in principle, not act as a lessor.
112
4.75% – 6.5%
n/a
n/a
2005
2004
12,677
11,017
5,946
29,640
2004
2005
29,563
109,483
56,000
195,046
3.83 – 6.5%
n/a
n/a

5.58.2 Capital commitments
During the year ended 31 December 2005 the Group entered into a contract to purchase property, plant and
equipment for EUR 840 thousand (2004: EUR 888 thousand).
5.58.3 Contingencies
The Group has contingent liabilities arising from contracts with a duration of more than one year such as
guarantees and lease obligations.
Some Group companies are, as a result of their normal business activities, involved either as plaintiffs or
defendants in claims. Based on information presently available the financial position of the Group is not likely
to be significantly influenced by any of these matters.
The holding company and the majority of the Dutch operating companies form a fiscal unit for corporate tax.
Each of the operating companies is severally liable for tax to be paid by all companies that belong to the fiscal unit.
5.59 S u b s e q u e n t e v e n t s
In January Fugro’s Supervisory Board decided to propose to the Annual General Meeting of Shareholders on
10 May 2006 that Messrs. P. van Riel and A. Steenbakker be appointed to the Board of Management as of that date
(see also the report of the Supervisory Board on page 17).
In January the Board of Management announced that Mr. F.E. Toolan, member of the Executive Committee and
COO of offshore Geotechnical Services and Airborne Survey, would retire per 1 July 2006. As of the same date Mr.
W.S. Rainey will be appointed COO of Geotechnical Services and Mr. S.J. Thomson will be appointed COO of
Airborne Survey. Both Mr. Rainey and Mr. Thomson have been working a long time for Fugro.
In January Fugro signed a three-year charter contract with the Norwegian shipyard Uksnoy & CO A/S for the
seismic vessel ‘Geo Barents’. The vessel will be ready for launching in November 2006 and Fugro will obtain
ownership in November 2009.
On 27 January 2006 Fugro Holdings Ltd. in the UK acquired a 100% interest in Surrey Geotechnical Consultants
Ltd. for an amount of EUR 0.6 million.
5.60 R e l a t e d p a r t i e s
5.60.1 Identity of related parties
The Group also has a related party relationship with its subsidiaries, its associates (refer note 14), and with its
statutory Directors.
5.60.2 Transactions with statutory Directors and executive officers
Directors of the Company and management control 6.7% of the voting shares of the Company.
Executive officers also participate in the Group’s share option programme (refer note 5.30.1).
The remuneration of the statutory Directors for 2005 and 2004 is as follows:
(in EUR)
Fixed salary
Bonus with respect to the previous year
Pension costs
Valuation of options granted
Total
* Mr. A. Jonkman became a statutory Director as from 19 May 2004.
113
K.S.Wester
2004
298,987
88,500
411,211
463,050
1,261,748
2005
397,240
149,000
364,540
766,140
1,676,920
G-J. Kramer
2004
492,000
147,333
779,900
555,660
1,974,893
2005
542,000
246,000
435,000
878,688
2,101,688
A. Jonkman
2004
135,938
–
143,239
343,000
622,177
2005
260,000
112,500
259,319
576,300
1,208,119
*

The statutory Directors have the availability of a company car and a mobile telephone. They also receive a
limited monthly allowance to cover expenses.
The remuneration of the statutory Directors is determined by the Remuneration Committee. In 2004 an
independent investigation took place to review the level and composition of the remuneration of the statutory
Directors. The conclusion from this investigation was that the remuneration with regard to the fixed salary
component were out of step with the remuneration of statutory Directors in similar positions elsewhere.
It was decided to eliminate this backlog. As a consequence the back service obligation for Mr G-J Kramer
would be significant. The pension agreement structure is based on an available premium system. In connection
with the retirement of Mr. Kramer in 2005, a sum of EUR 875 thousand was paid in 2004 (EUR 440 thousand is
reported in the income statement over 2004 and EUR 435 thousand is reported in the income statement of 2005)
in order to meet the pension obligations Fugro agreed with Mr. Kramer at the time. The relevant period is 2005 to
2007. The remunerations are adjusted as from 2003 based on the conclusions of the independent investigation.
Upon determining the level of bonuses the realisation of company and personal targets are taken into account.
There are no guarantees or obligations towards or on behalf of the statutory Directors. Hereunder the
information of the options granted to members of the statutory Directors is given on an individual basis.
Statutory Directors3)
G-J. Kramer
Total
K.S. Wester
Total
A. Jonkman
Total
Total
114
Bonus1)
7
7
7
4
6
7
5
7
7
7
4
6
7
6
7
Expiring date
31-12-2006
31-12-2007
31-12-2008
31-12-2009
31-12-2010
31-12-2011
31-12-2005
31-12-2006
31-12-2007
31-12-2008
31-12-2009
31-12-2010
31-12-2011
31-12-2009
31-12-2010
31-12-2011
Share price at
exerciseday
20.822)
Exerciseprice
17.19
12.53
10.78
10.20
15.35
27.13
9.23
17.19
12.53
10.78
10.20
15.35
27.13
11.462)
15.35
27.13
Number at 31-12-
2005
129,600
129,600
129,600
129,600
129,600
129,600
777,600
–
108,000
108,000
108,000
108,000
108,000
113,000
653,000
150,400
80,000
85,000
315,400
1,746,000
Forfeitedin 2005
–
–
–
–
Exercisedin 2005
–
54,000
54,000
–
54,000
Grantedin 2005
129,600
129,600
113,000
113,000
85,000
85,000
327,600
Number at 01-01-
2005
129,600
129,600
129,600
129,600
129,600
648,000
54,000
108,000
108,000
108,000
108,000
108,000
594,000
150,400
80,000
230,400
1,472,400
Year
2000
2001
2002
2003
2004
2005
1999
2000
2001
2002
2003
2004
2005
2000 – 2003
2004
2005
Number ofmonthsIn EURNumber of option rights
1) Bonus in the book year; paid in the next year.
2) Weighted average.
3) Adjusted for split of shares (4:1).

The remuneration of the Supervisory Board is as follows:
(in EUR)
F.H. Schreve, Chairman
J.A. Colligan
P.J. Crawford
F.J.G.M. Cremers
M.W. Dekker
Th. Smith
P. Winsemius
There are no options granted and no assets available to the members of the Supervisory Board. There are no loans
outstanding to the members of the Supervisory Board and no guarantees given on behalf of members of the
Supervisory Board.
5.60.3 Other related party transactions
5.60.3.1 Joint venture
The Group has not entered into any joint ventures.
5.61 G r o u p e n t i t i e s
5.61.1 Significant subsidiaries
For an overview of (significant) subsidiaries we refer to chapter 6.
5.62 E s t i m a t e s a n d m a n a g e m e n t j u d g e m e n t s
Management discussed with the Audit Committee the development and choice of, and supply of information on
the critical accounting principles and estimates and also practice of these principles.
Key sources of estimation uncertainty
Note 5.37 contains information about the assumptions and their risk factors relating to goodwill impairment.
In Note 5.50 a detailed analysis is given on the foreign currency exposure of the Group and risks in relation to
foreign exchange movements.
Critical accounting judgements in applying the Group’s accounting policies
Except as already described in the notes to the financial statements no other critical accounting judgements in
applying the Group’s accounting policies exist that require further explanation.
115
2004
43,000
31,000
31,000
–
36,000
38,000
31,000
210,000
2005
43,000
31,000
31,000
20,523
15,000
41,000
31,000
212,523

Company % Office, Country Company % Office, Country
Fugro Mauritius Ltd. (Sucursal EM Angola) Luanda, Angola
Fugro Airborne Surveys Pty Ltd. Perth, Australia
Fugro Ground Geophysics Pty Ltd. Perth, Australia
Fugro-Jason Australia Perth, Australia
Fugro Multi Client Services Pty Ltd. Perth, Australia
Fugro Seismic Imaging Pty Perth, Australia
Fugro Spatial Solutions Pty Ltd. Perth, Australia
Fugro Survey Pty Ltd. Perth, Australia
OmniSTAR Pty Ltd. Perth, Australia
Azeri-Fugro # 40% Baku City, Azerbaijan
Fugro Caspian B.V. Baku City, Azerbaijan
Fugro Survey Caspian Ltd. Baku City, Azerbaijan
Fugro België N.V. Mechelen, Belgium
Fugro Engineers S.A. Brussels, Belgium
Fugro Airborne Surveys Ltd. Gaborone West, Botswana
Acquamarine Engenharia e assistenze Técnica Ltda Rio de Janeiro, Brazil
Fugro do Brasil Ltda Rio de Janeiro, Brazil
Fugro OceansatPEG SA 62% Rio de Janeiro, Brazil
Fugro Geosolutions Brazil Serve de Levantemento Rio de Janeiro, Brazil
Fugro Marsat Servicide Submarinos Ltda Rio de Janeiro, Brazil
Geomag S/A Prospeccoes Aerogeofisicas 20% Rio de Janeiro, Brazil
LASA Engenhariae Prospeccoes S.A. 20% Rio de Janeiro, Brazil
Fugro Sdn Bhd (Brunei) Bandar Seri Begawan, Brunei Darussalam
Fugro Survey (Brunei) Sdn Bhd Kuala Belait, Brunei Darussalam
Geodetic Surveys (B) Sdn Bhd 70% Kuala Belait, Brunei Darussalam
Fugro (Canada) Inc. New Brunswick, Canada
Fugro Airborne Surveys Corp. Ottawa, Ontario, Canada
Fugro Airborne Surveys Corp. Mississauga, Toronto, Canada
Fugro Jacques GeoSurveys Inc. 70% St. John’s, Newfoundland, Canada
Fugro/SESL Geomatics Ltd. Calgary, Alberta, Canada
Fugro Geoscience (Beijing) Ltd. Beijing, China
Fugro Technical Services (Guangzhou) Ltd. Guangzhou, China
Shanghai Fugro Geotechnique Co. Ltd. 60% Shanghai, China
China Offshore Fugro GeoSolutions
(Shenzhen) Co, Ltd. 50% Shekou, Shenzhen, China
Fugro Offshore Survey (Shenzhen) Company Ltd. Shekou, Shenzhen, China
Fugro Comprehensive Geotechnical
Investigation (Zhejiang) Co, Ltd. Zhejiang, China
Fugro Denmark AS Esbjerg, Denmark
Fugro Egypt Ltd Cairo, Egypt
Fugro M.I.S.R. 75% Cairo, Egypt
Fugro S.A.E. Cairo, Egypt
Racal Survey Equatorial Guinea Ltd Malabo, Equatorial Guinea
Fugro Geoid S.A.S. Clapiers, France
Fugro France S.A. Nanterre, France
Fugro Geotechnique S.A. Nanterre, France
Fugro Topnav S.A.S. Paris (Massy), France
Fugro Topnav S.A.S. Port Gentil, Gabon
Fugro Consult GmbH Berlin, Germany
IGF GmbH Könz, Germany
Fugro Airborne Surveys (Pty) Ltd Accra, Ghana
Fugro (Hong Kong) Ltd. Wanchai, Hong Kong
Fugro Data Services Ltd. Wanchai, Hong Kong
Fugro FLI-MAP International Ltd. Wanchai, Hong Kong
Fugro Geosciences International Ltd. Wanchai, Hong Kong
Fugro Holdings (Hong Kong) Ltd. Wanchai, Hong Kong
Fugro International (Hong Kong) Ltd. Wanchai, Hong Kong
Fugro Investment (Hong Kong) Ltd. Wanchai, Hong Kong
Fugro Marine Survey International Ltd. Wanchai, Hong Kong
Fugro SEA Ltd. Wanchai, Hong Kong
Fugro Survey (Middle East) Ltd. Wanchai, Hong Kong
Fugro Survey International Ltd. Wanchai, Hong Kong
Fugro Survey Ltd. Wanchai, Hong Kong
Fugro Survey Management Ltd. Wanchai, Hong Kong
Fugro Certification Services Ltd. Fo Tan, Shatin, N.T., Hong Kong
Fugro Technical Services Ltd. Fo Tan, Shatin, N.T., Hong Kong
116
6 S u b s i d i a r i e s a n d A s s o c i a t e s o f F u g r o N . V .(Including statutory seat and interest)
Unless mentioned differently the interest of Fugro N.V., direct or indirect amounts to 100%.
Insignificant subsidiary companies in terms of third party revenue and balance sheet total have been deleted.
These subsidiary companies are fully incorporated into the consolidated annual accounts of Fugro N.V.,
unless indicated differently. Companies in which the Group participates and which are not included in
the consolidated Annual Accounts are marked by an #.
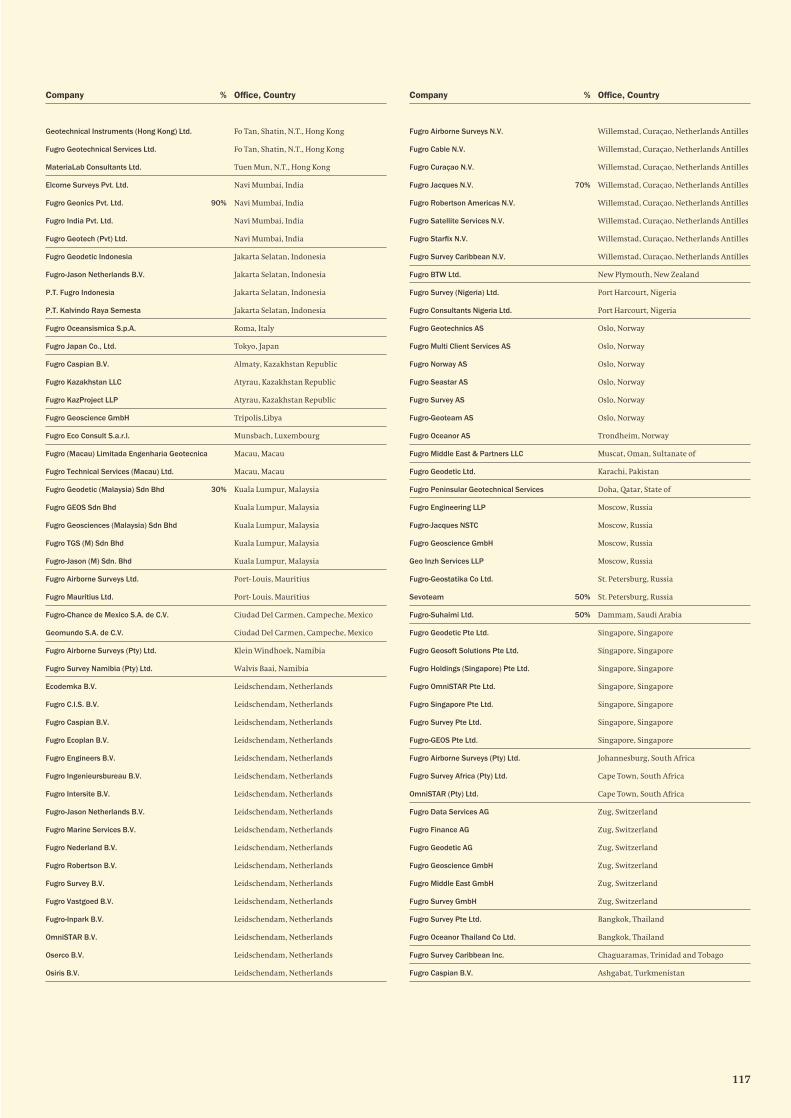
117
Company % Office, Country Company % Office, Country
Geotechnical Instruments (Hong Kong) Ltd. Fo Tan, Shatin, N.T., Hong Kong
Fugro Geotechnical Services Ltd. Fo Tan, Shatin, N.T., Hong Kong
MateriaLab Consultants Ltd. Tuen Mun, N.T., Hong Kong
Elcome Surveys Pvt. Ltd. Navi Mumbai, India
Fugro Geonics Pvt. Ltd. 90% Navi Mumbai, India
Fugro India Pvt. Ltd. Navi Mumbai, India
Fugro Geotech (Pvt) Ltd. Navi Mumbai, India
Fugro Geodetic Indonesia Jakarta Selatan, Indonesia
Fugro-Jason Netherlands B.V. Jakarta Selatan, Indonesia
P.T. Fugro Indonesia Jakarta Selatan, Indonesia
P.T. Kalvindo Raya Semesta Jakarta Selatan, Indonesia
Fugro Oceansismica S.p.A. Roma, Italy
Fugro Japan Co., Ltd. Tokyo, Japan
Fugro Caspian B.V. Almaty, Kazakhstan Republic
Fugro Kazakhstan LLC Atyrau, Kazakhstan Republic
Fugro KazProject LLP Atyrau, Kazakhstan Republic
Fugro Geoscience GmbH Tripolis,Libya
Fugro Eco Consult S.a.r.l. Munsbach, Luxembourg
Fugro (Macau) Limitada Engenharia Geotecnica Macau, Macau
Fugro Technical Services (Macau) Ltd. Macau, Macau
Fugro Geodetic (Malaysia) Sdn Bhd 30% Kuala Lumpur, Malaysia
Fugro GEOS Sdn Bhd Kuala Lumpur, Malaysia
Fugro Geosciences (Malaysia) Sdn Bhd Kuala Lumpur, Malaysia
Fugro TGS (M) Sdn Bhd Kuala Lumpur, Malaysia
Fugro-Jason (M) Sdn. Bhd Kuala Lumpur, Malaysia
Fugro Airborne Surveys Ltd. Port- Louis, Mauritius
Fugro Mauritius Ltd. Port- Louis, Mauritius
Fugro-Chance de Mexico S.A. de C.V. Ciudad Del Carmen, Campeche, Mexico
Geomundo S.A. de C.V. Ciudad Del Carmen, Campeche, Mexico
Fugro Airborne Surveys (Pty) Ltd. Klein Windhoek, Namibia
Fugro Survey Namibia (Pty) Ltd. Walvis Baai, Namibia
Ecodemka B.V. Leidschendam, Netherlands
Fugro C.I.S. B.V. Leidschendam, Netherlands
Fugro Caspian B.V. Leidschendam, Netherlands
Fugro Ecoplan B.V. Leidschendam, Netherlands
Fugro Engineers B.V. Leidschendam, Netherlands
Fugro Ingenieursbureau B.V. Leidschendam, Netherlands
Fugro Intersite B.V. Leidschendam, Netherlands
Fugro-Jason Netherlands B.V. Leidschendam, Netherlands
Fugro Marine Services B.V. Leidschendam, Netherlands
Fugro Nederland B.V. Leidschendam, Netherlands
Fugro Robertson B.V. Leidschendam, Netherlands
Fugro Survey B.V. Leidschendam, Netherlands
Fugro Vastgoed B.V. Leidschendam, Netherlands
Fugro-Inpark B.V. Leidschendam, Netherlands
OmniSTAR B.V. Leidschendam, Netherlands
Oserco B.V. Leidschendam, Netherlands
Osiris B.V. Leidschendam, Netherlands
Fugro Airborne Surveys N.V. Willemstad, Curaçao, Netherlands Antilles
Fugro Cable N.V. Willemstad, Curaçao, Netherlands Antilles
Fugro Curaçao N.V. Willemstad, Curaçao, Netherlands Antilles
Fugro Jacques N.V. 70% Willemstad, Curaçao, Netherlands Antilles
Fugro Robertson Americas N.V. Willemstad, Curaçao, Netherlands Antilles
Fugro Satellite Services N.V. Willemstad, Curaçao, Netherlands Antilles
Fugro Starfix N.V. Willemstad, Curaçao, Netherlands Antilles
Fugro Survey Caribbean N.V. Willemstad, Curaçao, Netherlands Antilles
Fugro BTW Ltd. New Plymouth, New Zealand
Fugro Survey (Nigeria) Ltd. Port Harcourt, Nigeria
Fugro Consultants Nigeria Ltd. Port Harcourt, Nigeria
Fugro Geotechnics AS Oslo, Norway
Fugro Multi Client Services AS Oslo, Norway
Fugro Norway AS Oslo, Norway
Fugro Seastar AS Oslo, Norway
Fugro Survey AS Oslo, Norway
Fugro-Geoteam AS Oslo, Norway
Fugro Oceanor AS Trondheim, Norway
Fugro Middle East & Partners LLC Muscat, Oman, Sultanate of
Fugro Geodetic Ltd. Karachi, Pakistan
Fugro Peninsular Geotechnical Services Doha, Qatar, State of
Fugro Engineering LLP Moscow, Russia
Fugro-Jacques NSTC Moscow, Russia
Fugro Geoscience GmbH Moscow, Russia
Geo Inzh Services LLP Moscow, Russia
Fugro-Geostatika Co Ltd. St. Petersburg, Russia
Sevoteam 50% St. Petersburg, Russia
Fugro-Suhaimi Ltd. 50% Dammam, Saudi Arabia
Fugro Geodetic Pte Ltd. Singapore, Singapore
Fugro Geosoft Solutions Pte Ltd. Singapore, Singapore
Fugro Holdings (Singapore) Pte Ltd. Singapore, Singapore
Fugro OmniSTAR Pte Ltd. Singapore, Singapore
Fugro Singapore Pte Ltd. Singapore, Singapore
Fugro Survey Pte Ltd. Singapore, Singapore
Fugro-GEOS Pte Ltd. Singapore, Singapore
Fugro Airborne Surveys (Pty) Ltd. Johannesburg, South Africa
Fugro Survey Africa (Pty) Ltd. Cape Town, South Africa
OmniSTAR (Pty) Ltd. Cape Town, South Africa
Fugro Data Services AG Zug, Switzerland
Fugro Finance AG Zug, Switzerland
Fugro Geodetic AG Zug, Switzerland
Fugro Geoscience GmbH Zug, Switzerland
Fugro Middle East GmbH Zug, Switzerland
Fugro Survey GmbH Zug, Switzerland
Fugro Survey Pte Ltd. Bangkok, Thailand
Fugro Oceanor Thailand Co Ltd. Bangkok, Thailand
Fugro Survey Caribbean Inc. Chaguaramas, Trinidad and Tobago
Fugro Caspian B.V. Ashgabat, Turkmenistan

118
Company % Office, Country
Fugro Middle East B.V. Dubai, United Arab Emirates
Fugro-Jason Middle East Dubai, United Arab Emirates
Fugro Survey (Middle East) Ltd. Abu Dhabi, United Arab Emirates
Fugro-GEOS UAE Abu Dhabi, United Arab Emirates
Fugro Survey Limited Aberdeen, United Kingdom
Alluvial Mining Ltd. Great Yarmouth, United Kingdom
Fugro-Robertson Ltd. Llandudno, United Kingdom
Fugro Seismic Imaging Ltd. Swanley, United Kingdom
Fugro Ltd. Wallingford, United Kingdom
Fugro Airborne Surveys Ltd. Wallingford, United Kingdom
Fugro Engineering Services Ltd. Wallingford, United Kingdom
Fugro-GEOS Ltd. Wallingford, United Kingdom
Fugro-Jason (UK) Ltd. Wallingford, Surrey, United Kingdom
Fugro (USA), Inc. Houston, United States
Fugro Airborne Surveys Inc. Houston, United States
Fugro Geosciences, Inc. Houston, United States
Fugro GeoServices, Inc. Houston, United States
Fugro Gulf, Inc. Houston, United States
Fugro Multi Client Services, Inc. Houston, United States
Fugro Consultants LP Houston, United States
Fugro, Inc. Houston, United States
Fugro-GEOS, Inc. Houston, United States
Fugro-Jason Inc. Houston, United States
Fugro-McClelland Marine Geosciences, Inc. Houston, United States
Fugro-Robertson, Inc. Houston, United States
Fugro Seismic Imaging, Inc. Houston, United States
OmniSTAR LP Houston, United States
John Chance Land Surveys Inc. Lafayette, United States
Fugro Chance Inc. Lafayette, United States
Fugro Pelagos, Inc. San Diego, United States
Fugro Seafloor Surveys, Inc. Seattle, United States
Petcom Inc Richardson, United States
España Geotechnical Consulting Inc. Roseville, United States
Fugro West, Inc. Ventura, United States
Fugro-McClelland Marine Geosciences, Inc. Caracas, Venezuela

119

120
(EUR x 1,000)
A s s e t s
(9.1) Property, plant and equipment
(9.2) Intangible assets
(9.3) Financial fixed assets
Deffered tax assets
Total non-current assets
(9.4) Trade and other receivables
Income tax receivable
(9.6) Cash and cash equivalents
Totaal current assets
Total assets
(9.5) E q u i t y
Issued and paid-in capital
Share premium
Reserves
Unappropriated result
Total equity
L i a b i l i t i e s
(9.7) Interest-bearing loans and borrowings
Total non-current liabilities
Bank overdraft
Interest-bearing loans and borrowings
Trade and other payables
Other taxes and social security charges
(9.8) Total current liabilities
Total liabilities
Total equity and liabilities
7 C o m p a n y b a l a n c e s h e e tBefore appropriation of result, as at 31 December
2005
381
72,495
681,920
6,007
760,803
15,781
5,321
–
21,102
781,905
3,441
301,539
61,068
99,412
465,460
287,936
287,936
14,998
–
13,212
299
28,509
316,445
781,905
2004
548
72,495
412,772
7,647
493,462
8,237
5,467
4,381
18,085
511,547
3,110
207,159
(35,673)
49,317
223,913
170,630
170,630
–
99,218
17,627
159
117,004
287,634
511,547

121
(EUR x 1,000)
Net result subsidiaries
Other results
Net result for the year
Added to unappropriated result
Other results concern the costs of the Company less reimbursements from subsidiaries.
8 C o m p a n y i n c o m e s t a t e m e n t
2004
59,343
(10,026)
49,317
49,317
2005
110,109
(10,697)
99,412
99,412

G e n e r a l
The company financial statements are part of the 2005 financial statements of Fugro N.V. With reference to the
company profit and loss account of Fugro N.V., use has been made of the exemption pursuant to Section 402 of
Book 2 of the Netherlands Civil Code.
P r i n c i p l e s f o r t h e m e a s u r e m e n t o f a s s e t s a n d l i a b i l i t i e s a n d t h e d e t e r m i n a t i o n
o f t h e r e s u l t
For setting the principles for the recognition and measurement of assets and liabilities and determination of the
result for its company financial statements, Fugro N.V. makes use of the option provided in section 2:362 (8) of
the Netherlands Civil Code. This means that the principles for the recognition and measurement of assets and
liabilities and determination of the result (hereinafter referred to as principles for recognition and
measurement) of the company financial statements of Fugro N.V. are the same as those applied for the
consolidated EU-IFRS financial statements. Participating interests, over which significant influence is exercised,
are stated on the basis of the equity method. These consolidated EU – IFRS financial statements are prepared
according to the standards laid down by the International Accounting Standards Board and adopted by the
European Union (hereinafter referred to as EU-IFRS). Please see pages 71 to 82 for a description of these
principles.
The share in the result of participating interests consists of the share of Fugro N.V. in the result of these
participating interests. Results on transactions, where the transfer of assets and liabilities between Fugro N.V.
and its participating interests and mutually between participating interests themselves, are not incorporated
insofar as they can be deemed to be unrealised.
C h a n g e i n a c c o u n t i n g p o l i c i e s
As a result of the application of the accounting principles used in the consolidated financial statements to the
company financial statements, Fugro N.V. has implemented a change in accounting policies. This change in
accounting policies is the result of using the option in section 2:362 (8) of the Netherlands Civil Code. By making
use of this option reconciliation is maintained between the consolidated and the company shareholders’ equity.
The company financial statements were previously prepared in compliance with the principles for
recognition and measurement of assets and liabilities and determination of the result referred to in Part 9,
Book 2 of the Netherlands Civil Code (BW2). The change in accounting policies, which is treated retrospectively,
has had an effect on the shareholders’ equity and the result. The impact on the shareholders’ equity as at
31 December 2004 amounts to EUR 36 million. The impact on the result for 2004 amounts to EUR 139 thousand
negative.
For the purposes of comparison, the comparative figures have been adjusted on the basis of the changed
accounting principles.
The reconciliation summaries for the company balance sheet and profit and loss account, in which the effects
of the change in accounting policies are stated for each item of the financial statements, are included under
sections 9.11 and 9.12. Furthermore, the classification of financial instruments for the calculation of the
company’s shareholders’ equity, the principle of economic reality must be used because this principle is used in
the consolidated EU-IFRS financial statements. Previously, the classification of components of the shareholders’
equity was based on the legal format of the financial instrument. The change in presentation related to this
is stated in the shareholders’ equity and is also presented separately in the reconciliation summary under
section 9.13.
9 N o t e s t o t h e C o m p a n y f i n a n c i a l s t a t e m e n t s
122

123
9.1 P r o p e r t y , p l a n t a n d e q u i p m e n t
(EUR x 1,000)
Cost
Balance at 1 January
Other acquisitions
Disposals
Balance at 31 December
Depreciation
Balance at 1 January
Depreciation charge for the year
Disposals
Balance at 31 December
Carrying amount
At 1 January
At 31 December
9.2 I n t a n g i b l e a s s e t s
(EUR x 1,000)
Cost
Balance at 1 January
Balance at 31 December
Carrying amount
At 1 January
At 31 December
The capitalised goodwill is not amortised. Goodwill is systematically tested for impairment on each balance
sheet date, or when there is an indication for impairment. Goodwill represents amounts arising on acquisition
of subsidiaries. No impairment has been recognised.
2004 Other
1,676
225
110
2,011
1,025
327
111
1,463
651
548
2005 Other
2,011
297
(135)
2,173
1,463
401
(72)
1,792
548
381
2004 Goodwill
72,495
72,495
72,495
72,495
2005 Goodwill
72,495
72,495
72,495
72,495

9.3 F i n a n c i a l f i x e d a s s e t s
The list of siginificant group companies is included in the pages 116 through 118.
(EUR x 1,000)
Balance at 1 January
Net result of group companies
Capital increase subsidiaries
Loans subsidiaries
Currency exchange differences
Other
Closing balance 31 December
* Included in loans subsidiaries is a loan bearing interest to a group company of 3,83% (2004: 5%). In principle the loan will be repaid
within two years.
9.4 T r a d e a n d o t h e r r e c e i v a b l e s
(EUR x 1,000)
Receivables from group companies
Social security premiums
Other receivables
Closing balance 31 December
9.5 E q u i t y
For the notes to the equity reference is made to note 5.44 of the consolidated statements.
9.6 C a s h a n d c a s h e q u i v a l e n t s
(EUR x 1,000)
Bank balances, cash, and cash equivalents
Cash and cash equivalents
9.7 I n t e r e s t - b e a r i n g l o a n s a n d b o r r o w i n g s
(EUR x 1,000)
Convertible loan
Private Placement loan
Closing balance 31 December
For the notes on the convertible loan and the Private Placement loans reference is made to note 5.46.3 of
the consolidated statements. The average interest in long-term debt amounts to 5,4% per annum (2004: 6,5%)
124
2004
4,381
4,381
2005
–
–
2004
5,174
410
2,653
8,237
2005
13,479
830
1,472
15,781
Total 2004
435,650
59,343
8,520
(65,872)
(23,922)
(947)
412,772
Total 2005
412,772
110,109
77,250
46,845
35,911
(967)
681,920
14,108
–
–
46,845
168
–
61,121
398,664
110,109
77,250
–
35,743
(967)
620,799
*Loans to/receivablesfrom groupcompanies
Partici-pation
in groupcompanies
2004
–
170,630
170,630
2005
114,723
173,213
287,936

9.8 C u r r e n t l i a b i l i t i e s
(EUR x 1,000)
Bank overdraft
Trade creditors
Interest convertible loan
Interest Private Placement
Convertible loan
Group companies
Other taxes and social security charges
Other liabilities
Closing balance 31 December
9.9 C o m m i t m e n t s n o t i n c l u d e d i n t h e b a l a n c e s h e e t
Tax unit
The holding company and the majority of the Dutch operating companies form a fiscal unit for corporate tax.
Each of the operating companies is severally liable for tax to be paid by all companies that belong to the fiscal
unit.
9.10 G u a r a n t e e s
In principle the company does not provide parent company guarantees in favour of its subsidiaries, unless
significant commercial reasons exist. The company has deposited declarations of joint and several liabilities for
a number of Dutch subsidiaries at the relevant Chamber of Commerce. The company has deposited a list with
the Chamber of Commerce, which includes all financial interests of the Group in subsidiaries as well as a
reference to each subsidiary for which such a declaration of liability has been deposited.
9.11 E f f e c t s o f c h a n g e i n a c c o u n t i n g p r i n c i p l e s o n t h e c o m p a n y i n c o m e
s t a t e m e n t
(EUR x 1,000)
Net result subsidiaries
Other results
Amortisation of goodwill
Net result for the year
Added to unappropriated result
The 2004 net result subsidiaries under IFRS is EUR 936 thousand less than under Dutch GAAP due to the net
impact of the various differences between IFRS and Dutch GAAP. For a detailed overview of these differences,
reference is made to the 2004 annual report (pages 54 through 55 and pages 122 through 132).
Other results are EUR 3,854 thousand less under IFRS compared to Dutch GAAP. This decrease is the net (after
tax) impact of the different accounting treatment of share-based payments and of compound financial
instruments (under IFRS the liability and equity component of the convertible loan are split).
Under IFRS (IFRS 3) goodwill is measured at cost less any impairment losses. Under Dutch GAAP, goodwill was
amortised over its useful life. Consequently, amortisation cost decreased by EUR 4,651 thousand for the year
ended 31 December 2004.
125
2004
–
1,651
3,562
1,502
99,218
719
159
10,193
117,004
2005
14,998
1,354
2,025
1,502
–
–
299
8,331
28,509
IFRS2004
59,343
(10,026)
–
49,317
49,317
Effect2004
(936)
(3,854)
4,651
(139)
(139)
DutchGAAP2004
60,279
(6,172)
(4,651)
49,456
49,456

126
9.12 E f f e c t s o f c h a n g e i n a c c o u n t i n g p r i n c i p l e s o n t h e c o m p a n y
b a l a n c e s h e e t
As at 1 January 2004, respectively 31 December 2004
(EUR x 1,000)
A s s e t s
Property, plant and equipment
Intangible assets
Financial fixed assets
Deffered tax assets
Total non-current assets
Trade and other receivables
Income tax receivable
Cash and cash equivalents
Total current assets
Total assets
E q u i t y
Issued and paid-in capital
Share premium
Reserves
Unappropriated result
Total equity
L i a b i l i t i e s
Interest-bearing loans and borrowings
Employee benefits
Provisions
Deferred tax liabilities
Total non-current liabilities
Bank overdraft
Interest-bearing loans and borrowings
Trade and other payables
Other taxes and social security charges
Total current liabilities
Total liabilities
Total equity and liabilities
DutchGAAP
31-12-04
548
77,907
435,810
–
514,265
10,169
5,467
4,381
20,017
534,282
3,110
207,159
407
49,456
260,132
256,364
185
–
–
256,549
–
–
17,442
159
17,601
274,150
534,282
Effect 31-12-04
–
(5,412)
(23,038)
7,647
(20,803)
(1,932)
–
–
(1,932)
(22,735)
–
–
(36,080)
(139)
(36,219)
(85,734)
(185)
–
–
(85,919)
–
99,218
185
–
99,403
13,484
(22,735)
IFRS 31-12-04
548
72,495
412,772
7,647
493,462
8,237
5,467
4,381
18,085
511,547
3,110
207,159
(35,673)
49,317
223,913
170,630
–
–
–
170,630
–
99,218
17,627
159
117,004
287,634
511,547
DutchGAAP
01-01-04
651
82,558
448,859
–
532,068
10,519
6,054
–
16,573
548,641
3,033
207,159
(1,829)
32,420
240,783
256,364
185
139
–
256,688
35,561
–
15,269
340
51,170
307,858
548,641
Effect 01-01-04
–
(10,063)
(13,209)
3,715
(19,557)
(217)
–
–
(217)
(19,774)
–
–
(16,039)
(13,548)
(29,587)
1,665
–
(139)
5,179
6,705
–
–
3,108
–
3,108
9,813
(19,774)
IFRS 01-01-04
651
72,495
435,650
3,715
512,511
10,302
6,054
–
16,356
528,867
3,033
207,159
(17,868)
18,872
211,196
258,029
185
–
5,179
263,393
35,561
–
18,377
340
54,278
317,671
528,867

Under IFRS (IFRS 3) goodwill is measured at cost less any impairment losses. Under Dutch GAAP, goodwill was
amortised over its useful life. Furthermore under IFRS 1 Fugro evaluated the business combinations for
intangibles subsumed in goodwill. As a result Fugro identified certain intangibles (mainly software) that meet
the recognition criteria of IAS 38. Consequently, intangibles decreased by EUR 5,412 thousand for the year ended
31 December 2004 since the intangibles were accounted for at subsidiary level.
Financial fixed assets under IFRS decrease with EUR 23,038 thousand as at 31 December 2004 and
EUR 13,209 thousand as at 1 January 2004 due to the net impact of the various differences between IFRS and
Dutch GAAP. For a detailed overview of these differences, reference is made to the 2004 annual report (pages 54
through 55 and pages 122 through 132).
Under Dutch GAAP, unused tax losses carried forward were recorded if there was a high degree of probability
that these tax losses carried forward would be realised. Under IFRS (IAS 12) deferred tax assets are recognised for
unused tax losses carried forward to the extent that it is probable that future taxable profit will be available
against which the unused tax losses can be utilised. Consequently, deferred tax assets increased with
EUR 3,715 thousand as at 1 January 2004 and with EUR 7,647 thousand as at 31 December 2004.
Under Dutch GAAP financial instruments were not recognised in the balance sheet. Under IFRS (IAS 32 and
IAS 39) financial instruments are included at the fair value or amortised cost depending on the nature of the
financial instruments. Furthermore, IFRS requires to split compound financial instruments (under IFRS the
liability and equity component of the convertible loan are split). Finally, the convertible loan was presented as
non-current under Dutch GAAP (which takes into account the expected renewal in 2005) and as current under
IFRS at 31 December 2004. The net impact of the above is an increase of the non-current portion of interest-
bearing loans and borrowings as at 1 January 2004 and a decrease of EUR 85,754 thousand as at 31 December
2004 under IFRS. The current portion of interest-bearing loans and borrowings increases under IFRS with
EUR 99,218 thousand as at 31 December 2004 (1 January 2004: nil).
For a detailed overview of these differences, reference is made to the 2004 annual report (pages 54 through 55
and pages 122 through 132).
9.13 R e c o n c i l i a t i o n o f r e t a i n e d e a r n i n g s
The reconciliation is taken up in the annual report 2004, page 132.
Leidschendam, 9 March 2006
127
Executive Directors
K.S. Wester, President and Chief Executive Officer
A. Jonkman, Chief Financial Officer
Supervisory Board
F.H. Schreve, Chairman
J.A. Colligan
P. J. Crawford
F.J.G.M. Cremers
Th. Smith
P. Winsemius

128
Opinion with respect to the company Financial
Statements
In our opinion, the company Financial Statements give a
true and fair view of the financial position of the
company as at 31 December 2005 and of the result for the
year then ended in accordance with accounting principles
generally accepted in the Netherlands and also comply
with the financial reporting requirements included in
Part 9 of Book 2 of the Netherlands Civil Code.
Furthermore we have established to the extent of our
competence that the annual report is consistent with the
company Financial Statements.
The Hague, 9 March 2006
KPMG Accountants N.V.
L.H. Barg RA
10.2 P o s t b a l a n c e s h e e t d a t e e v e n t s
Reference is made to note 5.59.
1 0 O t h e r i n f o r m a t i o n
10.1 A u d i t o r s ’ R e p o r t 2 0 0 5
Introduction
We have audited the Financial Statements of Fugro N.V.,
Leidschendam, for the year 2005 as set out on pages 65 to
127. These Financial Statements consist of the
consolidated Financial Statements and the company
Financial Statements. These Financial Statements are
the responsibility of the company's management.
Our responsibility is to express an opinion on these
Financial Statements based on our audit.
Scope
We conducted our audit in accordance with auditing
standards generally accepted in the Netherlands. Those
standards require that we plan and perform the audit to
obtain reasonable assurance about whether the Financial
Statements are free of material misstatement. An audit
includes examining, on a test basis, evidence supporting
the amounts and disclosures in the Financial Statements.
An audit also includes assessing the accounting principles
used and significant estimates made by management, as
well as evaluating the overall presentation of the
Financial Statements. We believe that our audit provides
a reasonable basis for our opinion.
Opinion with respect to the consolidated Financial
Statements
In our opinion, the consolidated Financial Statements
give a true and fair view of the financial position of the
company as at 31 December 2005 and of the result and the
cash flows for the year then ended in accordance with
International Financial Reporting Standards as adopted
by the EU and also comply with the financial reporting
requirements included in Part 9 of Book 2 of the
Netherlands Civil Code as far as applicable.
Furthermore we have established to the extent of our
competence that the annual report is consistent with the
consolidated Financial Statements.

10.4 P r o f i t a p p r o p r i a t i o n
Article 36 of the Articles of Association (as far as relevant):
36.2 a. The profit shall, if sufficient, be applied first in
payment to the holders of white-knight
preference shares of a percentage as specified
below of the compulsory amount paid on these
shares as at the commencement of the financial
year for which the distribution is made.
b. The percentage referred to above in
subparagraph a. shall be equal to the average of
the Euribor interest charged for loans with a
term of one year – weighted by the number of
days for which this interest was applicable –
during the financial year for which the
distribution is made, increased by at most four
percentage points; this increase shall each time
be fixed by the Board of Management for a
period of five years, after approval by the
Supervisory Board.
36.3 a. Next, if possible, a dividend shall be paid on the
financing preference shares of each series and
on the convertible financing preference shares
of each series, equal to a percentage calculated
on the amount effectively paid on the financing
preference shares of the respective series and
the convertible financing preference shares of
the respective series, including a share
premium, if any, upon the first issue of the
series in question, and which percentage shall
be related to the average effective return on
‘state loans general with a term of 7 – 8 years’,
calculated and determined in the manner as
described hereinafter.
b. The percentage of the dividend for the
financing preference shares of each or for the
convertible financing preference shares of each
series, as the case may be, shall be calculated by
taking the arithmetic mean of the average
effective return on the aforesaid loans, as
prepared by the Central Bureau of Statistics
(Centraal Bureau voor de Statistiek) and
published in the Official List of Euronext
Amsterdam N.V. for the last five stock market
trading days preceding the day of the first issue
of financing preference shares of the respective
series or the convertible financing preference
shares of the respective series, as the case may
be, or preceding the day on which the dividend
percentage is adjusted, increased or decreased,
if applicable, by a mark-up or mark-down set by
10.3 F o u n d a t i o n B o a r d s
Stichting Administratiekantoor Fugro
The Board of the Stichting Administratiekantoor Fugro
comprises Messrs.:
name function term
R. van der Vlist, Chairman Board member 2008
J.V.M. Commandeur Board member 2005
(resigned as of 1 July)
J.F. van Duyne Board member 2007
W. Schatborn Board member 2006
L.P.E.M. van den Boom Board member 2009
(appointed 1 July)
Stichting Beschermingspreferente Aandelen Fugro
The Board of the Stichting Beschermingspreferente
Aandelen Fugro comprises Messrs.:
name function term
S.C.J.J. Kortmann, Chairman Board member B 2006
J.V.M. Commandeur Board member B 2008
J.C. de Mos Board member B 2009
P.H. Vogtländer Board member B 2007
F.H. Schreve Board member A 2006
Apart from Mr. Schreve no Board member has any links
with Fugro.
Stichting Continuïteit Fugro
The Board of the Stichting Continuïteit Fugro in the
Dutch Antilles is composed as follows:
name function term
F.D. Leo, Chairman Board member B 2006
A.C.M. Goede Board member B 2009
R. de Paus Board member B 2007
M.A. Pourier Board member B 2008
F.H. Schreve Board member A Perma-
nent
Apart from Mr. Schreve no Board member has any links
with Fugro.
129

10.5 P r o p o s e d p r o f i t a p p r o p r i a t i o n
In accordance with Article 36 of the Articles of
Association, we propose a dividend of EUR 40.7 million
be paid out in the form of a cash payment of EUR 0.60 per
(depositary receipt of) share with a nominal value of
EUR 0.05 or in the form of (depository receipts of) ordinary
shares with a nominal value of EUR 0.05 charged to the
reserves.
the Board of Management upon issue and
approved by the Supervisory Board of at two
percentage points, depending on the market
conditions then obtaining, which mark-up or
mark-down may differ for each series.
36.4 In the event that in any financial year the profit
is insufficient to make the distributions
referred to in Paragraph 3 of this article, the
provisions contained in Paragraph 3 shall only
be applied in subsequent financial years after
the deficit has been made good and after the
provisions contained in Paragraph 3 have been
applied. The Board of Management shall be
authorised, subject to the approval of the
Supervisory Board, to resolve to distribute an
amount equal to the deficit referred to in the
previous sentence from the reserves, with the
exception of the reserves formed by way of a
share premium on the issue of financing
preference shares, respectively convertible
financing preference shares.
36.5 In the event that the first issue of financing
preference shares, respectively convertible
financing preference shares of a series, takes
place during the course of a financial year, the
dividend on the relevant series of financing
preference shares, respectively the convertible
financing preference shares, will be
proportionately decreased to the first day of
issue.
36.6 After application of the provisions contained in
Paragraphs 2 to 5 inclusive, no further dividend
distributions shall be made on the protective
preference shares or the financing preference
shares, respectively the convertible financing
preference shares.
36.7 From the profit remaining after application of
the provisions contained in Paragraphs 2 to 5
inclusive, the Board of Management – subject
to the approval of the Supervisory Board – shall
make such reservations as the Board of
Management deems necessary. To the extent
that the profit is not reserved by application of
the previous sentence, it shall be at the disposal
of the General Meeting either to be wholly or
partially reserved or to be wholly or partially
distributed to holders of ordinary shares in
proportion to the number of ordinary shares
they hold.
130

131

R e s u l t (x EUR 1,000)
Turnover
Third party costs
Net revenue
Operating result 3)
Cash flow
Net result 3)
of which non-recurring items
B a l a n c e s h e e t (x EUR 1,000)
Tangible fixed assets
Investments
of which in acquisitions
Depreciation of tangible fixed assets
Net current assets 2)
Total assets
Provisions
Long-term liabilities
Capital and reserves 2)
K e y r a t i o s (in %) 3)
Operating result/turnover
Net result/turnover
Net result/net revenue
Net result/capital and reserves 2)
Group’s equity/total assets 2)
Interest cover
D a t a p e r s h a r e (x EUR 1.–) 3) 5)
Capital and reserves 2)
Operating result 4)
Cash flow 4)
Net result 4)
Dividend
S h a r e p r i c e (x EUR 1.–) 5)
Year-end share price
Highest share price
Lowest share price
N u m b e r o f e m p l o y e e s
At year-end
S h a r e s i n i s s u e (x 1,000) 5)
Of nominal EUR 0.20 at year-end
132
H i s t o r i c r e v i e w 3)
DutchGAAP 1998
578,207
197,258
380,948
61,669
74,057
37,800
–
108,181
61,487
6,081
36,257
7,170
338,021
8,894
24,368
90,575
10.7
6.5
9.9
45.0
27.9
12.1
1.91
1.30
1.56
0.80
0.28
4.99
10.99
4.06
5,136
48,682
DutchGAAP 1999
546,760
176,067
370,648
61,805
77,233
40,704
–
114,035
37,301
9,257
36,529
15,066
380,495
10,573
23,234
107,909
11.3
7.4
11.0
41.0
29.3
13.1
2.29
1.27
1.59
0.84
0.31
9.23
9.98
4.10
5,114
50,449
DutchGAAP 2000
712,934
250,132
462,765
73,697
85,596
46,024
–
120,526
49,008
3,686
39,572
92,269
474,741
6,746
120,713
101,453
10.3
6.5
9.9
45.4
22.1
8.1
2.10
1.48
1.72
0.92
0.34
17.19
17.81
9.31
5,756
51,048
DutchGAAP 2001
909,817
331,685
578,132
98,470
105,301
61,732
–
163,298
89,352
11,196
43,569
(50,514)
814,772
8,056
121,450
244,660
10.8
6.8
10.7
35.7
30.4
7.8
4.17
1.86
1.98
1.16
0.40
12.53
18.91
10.75
6,953
58,679
DutchGAAP 2002
945,899
328,401
617,498
111,873
119,161
72,220
–
192,293
100,036
24,852
46,941
129,071
793,245
12,706
273,520
271,698
11.8
7.6
11.7
27.4
34.6
6.1
4.57
1.95
2.08
1.26
0.46
10.78
16.50
9.88
6,923
59,449
IFRS2003
822,372
273,372
549,000
63,272
80,480
18,872
–
268,801
123,983
70,888
54,004
114,852
1,056,003
584
431,895
211,196
9.2
2.3
8.3
17.6
20.2
2.2
3.48
1.09
1.39
0.33
0.46
10.20
12.86
6.13
8,472
60,664
IFRS2004
1,008,008
364,644
643,364
104,236
125,802
49,317
–
232,956
71,028
2,296
66,139
(95,348)
983,350
1,075
184,268
223,913
11.0
4.9
7.7
22.7
23.2
3.7
3.60
1.76
2.12
0.83
0.48
15.35
16.41
10.05
7,615
62,192
IFRS 2005
1,160,615
405,701
754,914
144,070
176,093
99,412
–
262,759
90,414
10,057
69,445
222,485
1,138,660
398
300,753
465,460
12.9
8.6
13.2
28.8
41.3
7.3
6.76
2.18
2.67
1.51
0.48
27.13
27.40
15.14
8,534
68,825
1) Based on IFRS as from 2003.
2) In 2003 and 2002 no accrued dividend has been incorporated.
3) For 2002 and earlier years, before amortisation of goodwill.
4) Unlike preceeding years the figures as from the year 1999 have been calculated based upon the wweeiigghhtteedd average number of outstanding shares.
5) As a result of the share split in 2005, the historical figures have been restated.

DutchGAAP 1984 4)
49,644
22,507
27,136
2,314
3,766
1,588
–
5,627
2,768
–
2,178
2,904
27,862
1,316
2,314
4,810
4.7
3.2
5.9
39.6
17.3
–
0.82
0.39
0.64
0.27
–
–
–
–
553
5,882
DutchGAAP 1985 4)
45,786
16,518
29,269
1,225
5,082
2,087
–
8,486
6,171
–
2,995
3,313
28,089
1,225
2,904
7,714
2.7
4.5
7.1
33.1
24.4
–
1.31
0.21
0.86
0.36
–
–
–
–
587
5,882
DutchGAAP 1986 4)
35,440
12,207
23,234
(2,950)
(45)
(2,995)
–
10,664
5,128
–
2,950
(681)
22,916
1,860
3,585
4,629
(8.3)
(8.4)
(12.9)
(48.3)
20.2
–
0.62
(0.39)
(0.01)
(0.40)
–
–
–
–
524
7,517
DutchGAAP 1987
65,798
20,057
45,741
1,588
4,220
272
–
10,482
1,860
–
3,948
4,129
35,168
1,180
3,358
9,711
2.4
0.4
0.6
3.8
30.2
–
0.61
0.10
0.26
0.02
–
–
–
–
941
16,011
DutchGAAP 1988
77,007
28,997
48,010
3,630
5,445
2,087
–
14,929
6,262
–
3,358
3,948
43,336
953
6,489
10,936
4.7
2.7
4.3
20.2
27.9
–
0.70
0.02
0.35
0.13
0.05
–
–
–
969
15,606
DutchGAAP 1989
80,591
27,091
53,501
6,625
8,077
4,629
–
15,202
4,765
–
3,449
4,810
45,287
817
5,400
13,432
8.2
5.7
8.7
38.0
31.3
–
0.78
0.39
0.47
0.27
0.09
–
–
–
1,105
17,100
DutchGAAP 1990
107,637
42,338
65,299
7,941
10,165
5,491
–
21,010
10,664
4,084
4,674
1,543
55,996
771
5,218
15,973
7.4
5.1
8.4
37.3
30.0
–
0.91
0.45
0.58
0.31
0.11
–
–
–
1,275
17,641
DutchGAAP 1991
140,808
41,249
99,559
15,746
19,467
11,526
–
48,237
36,212
24,913
7,941
20,783
104,143
635
33,217
35,803
11.2
8.2
11.6
44.5
34.7
–
1.74
0.77
0.95
0.56
0.17
–
–
–
2,029
26,648
DutchGAAP 1992
178,926
52,412
126,514
13,568
20,465
8,849
–
48,055
14,294
5,854
11,617
19,694
121,522
4,629
6,671
56,586
7.6
4.9
7.0
19.1
47.0
–
1.64
0.39
0.59
0.26
0.15
2.94
4.48
2.44
2,664
36,346
DutchGAAP 1993
221,490
65,344
156,146
18,015
26,728
12,388
–
55,497
25,639
4,901
14,339
17,334
141,579
3,403
7,260
62,168
8.1
5.6
7.9
20.9
44.7
–
1.71
0.50
0.74
0.34
0.17
4.17
4.46
2.64
2,824
36,370
DutchGAAP 1994
300,130
100,104
200,026
21,146
33,625
13,931
–
65,254
39,434
11,662
19,694
23,733
176,702
2,450
30,449
58,402
7.0
4.6
7.0
23.1
33.8
–
1.39
0.50
0.80
0.33
0.17
3.88
4.75
3.69
3,557
46,040
DutchGAAP 1995
296,636
99,378
197,258
12,434
26,773
7,170
(4,538)
64,800
24,776
3,222
19,603
9,121
170,122
2,723
23,823
51,050
4.2
2.4
3.6
13.1
30.4
–
1.11
0.27
0.58
0.16
0.08
1.96
4.14
1.45
3,968
46,044
DutchGAAP 1996
375,276
123,337
251,939
25,911
39,479
16,018
–
68,521
27,000
1,724
23,460
11,571
216,272
4,447
18,741
61,260
6.9
4.3
6.4
28.5
28.9
–
1.36
0.58
0.88
0.36
0.17
3.48
3.71
1.93
4,222
46,053
DutchGAAP 1997
482,096
172,346
309,750
46,195
60,670
31,084
3,630
93,479
58,220
5,763
29,586
6,308
289,512
7,805
17,153
77,370
9.6
6.4
10.0
44.8
27.7
10.4
1.65
0.98
1.29
0.66
0.25
7.01
8.28
3.44
4,429
47,673
133

Stichting. In accordance with the Corporate Gouvernance
Code, he was not candidate for reappointment. In the
Report of the Stichting it was reported that, in accordance
with Art. 4.3 of the Articles of Association, the Board
offered holders of depository receipts of shares with a
holding of 15% of the issued depository receipts of shares
the opportunity to request, before 22 April 2005 , that the
Board convene a Meeting of holders of depository receipts
of shares in order to nominate a candidate for
membership of the Stichting Board. As no request for
such a meeting was submitted the Board appointed
Mr L.P.E.M. van den Boom as a member of the Board as of
1 July 2005.
In accordance with the roster, Mr Schatborn will step
down from the Board of the Stichting on 30 June 2006.
The Board of the Stichting intends to reappoint
Mr Schatborn as a Board member for a period of four
years. The Board of the Stichting offers holders of
depository receipts of shares with a holding of 15% of the
issued depository receipts of shares the opportunity to
request, before 10 April 2006, that the Board convene a
meeting of holders of depository receipts of shares in
order to nominate a candidate for membership of the
Board of the Stichting. The request needs to be submitted
in writing and needs to mention name and address of the
proposed person.
The Board of the Stichting comprises Messrs.:
R. van der Vlist, Chairman
J.F. van Duyne
W. Schatborn
L.P.E.M. van den Boom
Mr. Van der Vlist was General Secretary of
N.V. Koninklijke Nederlandsche Petroleum Maatschappij.
Mr. Van Duyne was Chairman of the Board of
Management of Koninklijke Hoogovens N.V. and later
CEO of Corus. Mr. Schatborn was a member of the Board
of Management of Stork. Mr. Van den Boom was Member
of the Board of NIB Capital Bank N.V. and is currently
senior partner with Catalyst Advisors B.V.
In 2005 the remuneration of the Board amounted to
EUR 19,450 and the total costs of the Stichting amounted
to EUR 78,349.
On 31 December 2005, 60,062,761 ordinary shares with
a nominal value of EUR 0.05 were in administration,
against which 60,062,761 registered depository receipts of
shares with a nominal value of EUR 0.05 had been issued.
During the financial year 45,852 certificates were
converted into ordinary shares and 6,640,373 ordinary
shares were converted into certificates. 599,012
depository receipts of shares were issued as a result of the
R e p o r t o f S t i c h t i n gA d m i n i s t r a t i e k a n t o o r F u g r o
In accordance with Article 19 of the Administration
Conditions for the ordinary shares in the name of
Fugro N.V., the undersigned issue the following report to
holders of depository receipts of shares (certificates).
During 2005 all the Stichting’s activities were related
to the administration of ordinary shares against which
depository receipts of shares have been issued.
The Board met twice during 2005; the meeting of
22 April 2005 was dedicated to preparations for the
Annual General Meeting of Shareholders in Fugro N.V.
and on 29 September 2005 the Meeting, held after the
publication of the half-yearly results of Fugro N.V., was
dedicated to the general business. Another topic
discussed was Corporate Governance within the Company
and the Stichting.
On 10 June 2005 the Articles of Association and the
Stichting Administrative Conditions were amended in
view of the dematerialisation of the depository receipts of
shares (certificates) in Fugro N.V.
As of 20 June 2005 each share in the capital of
Fugro N.V. with a nominal value of EUR 0.20 has been split
in four shares with a nominal value of EUR 0.05. As of the
same date the depository receipts with a nominal value of
EUR 0.20 has been split in four depository receipts with a
nominal value of EUR 0.05.
The Stichting has taken advice regarding the
aforementioned amendments to the Articles of
Association and the Administrative Conditions.
All the members of the Stichting Board are
independent of the Company. The Board may offer
holders of depository receipts of shares the opportunity to
recommend candidates for appointment to the Board.
Further regulations related to the holding of a meeting of
holders of depository receipts of shares have been drawn-
up. The Stichting is authorised to accept voting
instructions from holders of depository receipts of shares
and to cast these votes during a General Meeting of
Shareholders.
The Board attended the Annual General Meeting of
Shareholders in Fugro N.V. on 19 May 2005 and
represented 63% of the votes cast. The Stichting voted in
favour of all the topics put to the vote during the meeting.
In accordance with the Administrative Conditions,
holders of depository receipts of shares were offered the
possibility of voting, in accordance with their own
opinion, as authorised representatives of the Stichting.
This opportunity was taken by 145 holders of depository
receipts of shares with 4,007,242 certificates.
In accordance with the roster, in June 2005
Mr. Commandeur resigned from the Board of the
134
2.375% in depository receipts of ordinary shares convertible
subordinated debenture bond 2005 per 2010 of EUR 125,000,000.–
at the cost of Fugro N.V.
To comply with the stipulations of Article 32 Clause 2
of the deed of trust executed by notary F.K. Buijn on
27 April 2005, we issue the following report.
The bonds at EUR 1,000.– have been issued in the form
of a collective bond amounting to EUR 125,000,000.–.
As a result of a share split the nominal value of each
share has been changed from EUR 0.20 to EUR 0.05.
In connection with this share split the conversion price
has been divided into four and changed from EUR 97.00 to
EUR 24.25 per ordinary share with a nominal value of
EUR 0.05.
Unless already purchased, settled or converted in
conformance with the trust deed, the bonds will be
settled at par on 27 April 2010. Between 6 June 2005 and
20 April 2010 inclusive the bonds may be converted into
depository receipts of ordinary shares in Fugro N.V. with a
nominal value of EUR 0.05 at a conversion price of
EUR 24.25.
During the year under review no bonds were
purchased or offered for conversion so that on
31 December 2005 the outstanding amount of the bond
was EUR 125,000,000.–-.
Fugro N.V. is authorised to repay the loan early (from
11 May 2008 onwards) on condition that Euronext
Amsterdam's Official Price List shows that the closing
price of the certificates of ordinary shares in Fugro N.V. on
Euronext Amsterdam N.V., Amsterdam, has been at least
130% of the then prevailing conversion price on at least
twenty days out of thirty consecutive trading days.
In the case of a ‘Change of Control’ as referred to in
Article 5 of the trust deed, the holders of bonds will be
permitted to offer their bonds for early settlement on the
date specified by Fugro N.V. without prejudice to the
other Articles of the trust deed.
We have not found any cause for comment or action.
Amsterdam, 6 February 2006
N.V. Algemeen Nederlands Trustkantoor ANT
L.J.J.M. Lutz
stock dividend and 5,897,896 depository receipts were
issued in connection with the conversion of a convertible
bond.
The activities related to the administration of the shares
are carried out by the administrator of the Stichting:
Administratiekantoor van het Algemeen Administratie
en Trustkantoor B.V. in Amsterdam.
The address of the Stichting is Veurse Achterweg 10,
2264 SG Leidschendam, the Netherlands.
Leidschendam, 23 February 2006
The Board
D e c l a r a t i o n o f i n d e p e n d e n c e
The Board of Management of Fugro N.V. and the Board of
the Stichting Administratiekantoor Fugro hereby declare
that, in their joint opinion, with regard to the
independence of the management of the Stichting
Administratiekantoor Fugro, they are in compliance with
the conditions as stipulated in Enclosure X of the
Fondsenreglement (fund regulations) of Euronext
Amsterdam N.V. in Amsterdam.
Leidschendam, 23 February 2006
Fugro N.V.
The Board of Management
Stichting Administratiekantoor Fugro
The Board
R e p o r t N . V . A l g e m e e n N e d e r l a n d s T r u s t k a n t o o r o v e r t h e y e a r 2 0 0 5
Regarding 4.75% in depository receipts of ordinary shares
convertible subordinated debenture bond 2000 per 2005
originally of EUR 100,000,00.-- at the cost of Fugro N.V.
In accordance with Article 10 clause 2 of the deed of
trust dated 29 March 2000 as executed by notary
F.K. Buijn, we issue the following report.
During the year under review, up to and including the
seventh day of trading on the stock exchange before the
settlement date, bonds with a nominal value of
EUR 94,676,000 were offered for conversion.
On 3 April 2005 the outstanding amount of the bond,
which was EUR 5,324,000 could be settled.
All the bonds that could be settled were offered for
conversion into cash and the monies used to redeem the
loan in full.
135
ROV Remotely Operated Vehicle: Unmanned submersible launched from a vessel
and equipped with measuring and manipulation equipment. A cable to the mother-
vessel provides power, video and data communication.
Seastar-dp: DGPS positioning system, specifically for use on board DP vessels.
Seismic: Acoustic measurement of seabed characteristics and stratification with the
objective of detecting oil and gas. These measurements are conducted using specialised
vessels equipped with powerful acoustic energy sources and long receiving streamers
(hydrophones) to measure (sub) seabed acoustic echoes.
Skyfix: DGPS positioning system, see Starfix, but uses different underlying technology
to achieve the high degree of accuracy.
Starfix: DGPS positioning system, specifically for use offshore. This system is intended
for the professional user and, in addition to a high degree of accuracy, is equipped with
a wide range of data analysis and quality control possibilities.
Survey Services: Services related to the measurement, management and mapping of
locations, objects and operations, most of which involve a substantial navigation and
positioning component.
UAV (Unmanned Airborne Vehicle): Unmanned autonomous mini-aircraft
equipped with magnetic measuring equipment.
F i n a n c i a l t e r m s
Debt (on ‘Private Placement’ covenants): Long-term loans including obligations
arising from leasing agreements.
Dividend yield: Dividend as a percentage of the (average) share price.
Interest cover: Operating result after goodwill (EBIT) compared with the net interest
charges.
Invested capital: The capital made available to the Company, i.e. Group equity plus
the available loans and the balance of current account deposits/withdrawals.
Net profit margin: profit as a percentage of turnover.
Net revenue from own services (NROS): Turnover minus work contracted-out and
other external costs.
Private placement: Long-term financing (10 – 15 years), entered into in May 2002 via
a private placement with twenty American and two British institutional investors.
Return on invested capital: The profit (before profit appropriation) including third
party interests and interest charges as a percentage of the average invested capital.
Solvency: Shareholders’ equity as a percentage of the balance sheet total, whereby the
subordinated convertible debenture bond is considered as equity.
G l o s s a r y
T e c h n i c a l t e r m s
2D Seismic: Acoustic measuring technology which uses single vessel-towed hydrophone
streamers. This technique generates a 2D cross-section of the deep seabed and is used
primarily when initially reconnoitring for the presence of oil or gas reservoirs.
3D Seismic: Acoustic measuring technology which uses multiple vessel-towed long
hydrophone streamers. This technique generates a 3D model of the deep seabed and is
used to locate and analyse oil and gas reservoirs.
3 DiQ (3D Integrated Quantitative): Technology for the development of integrated
(geology, geophysics, reservoir engineering) quantitative oil and gas reservoir models;
these models are used to optimise the risks, costs and efficiency of oil and gas field
development and production.
AM (asset management): A management system that ensures the efficient use of
business equipment such as vessels, measuring equipment, etc.
Asset monitoring: Tracking the location and usage of business equipment such as
vessels, measuring equipment, etc.
AUV (Autonomous Underwater Vehicle): An unmanned submersible launched
from a ‘mother-vessel’ but not connected to it via a cable. Propulsion and control are
autonomous and use pre-defined mission protocols.
Construction Support: Offshore services related to the installation and construction
of structures such as pipelines, drilling platforms and other oil and gas related
infrastructure, usually involving the use of ROVs.
D&P: Development & Production (of oil and gas fields).
DGPS (Differential Global Positioning System): A GPS based positioning system
using territorial reference points to enhance accuracy.
DP (dynamic positioning): An automatic pilot which controls a vessel’s engines and
rudder, generally to ensure the vessel maintains station. Such systems require input
from an accurate positioning system as a reference.
EM: Electromagnetic.
FLI-MAP: A system that, with the help of a laser fan beam in a helicopter, generates
accurate relief maps.
Geophysics: The mapping of subterranean soil characteristics using non-invasive
techniques such as sound.
Geoscience: A range of scientific disciplines (geology, geophysics, petroleum
engineering, bio stratification, geochemistry, etc.) related to the study of rocks, fossils
and fluids.
Geotechnics: The determination of subterranean soil characteristics using invasive
techniques such as probing, drilling and sampling.
GIS: Geographic Information System.
GNSS Global Navigation Satellite System: A collective term for GPS, the Russian
GLONASS system and the future European Gallileo System.
GPS: Global Positioning System.
Gravity: Precision gravity measurements to detect geological and other anomalies.
HP (high-performance): Decimetre positioning accuracy.
LiDAR: a measuring system based on laser technology that can make extremely
accurate recordings from an aircraft.
Omnistar: DGPS positioning system specifically for use onshore. This system
differentiates itself through its accuracy, global coverage and ease of use.
Reservoir engineering: Techniques for predicting the production behaviour of oil
and gas reservoirs and the optimisation of the eventual exploitation on the basis of a
reservoir model, rock and fluid characteristics and flow models.
136

Fugro N.V.
Veurse Achterweg 10
P.O. Box 41
2260 AA Leidschendam
The Netherlands
Telephone: +31 (0)70 3111422
Fax: +31 (0)70 3202703
E-mail: [email protected]
www.fugro.com
Chamber of Commerce Haaglanden
number 27120091
C o l o p h o n
Fugro N.V.
Veurse Achterweg 10
2264 SG Leidschendam
The Netherlands
Telephone: +31 (0)70 3111422
Fax: +31 (0)70 3202703
Concept and realisation:
C&F Report Amsterdam B.V.
Photography:
Fugro N.V.,
Picture Report, Amsterdam,
Peter Boer, and others.
Fugro has endeavored to
fulfil all legal requirements
related to copyright. Anyone
who, despite this, is of the
opinion that other copyright
regulations could be applicable
should contact Fugro.
Text:
Boogaard Communications
Consultancy (BCC) v.o.f.
This annual report is a
translation of the official
report published in the Dutch
language.
The annual report is also
available on our website
www.fugro.com.
For complete information, see www.fugro.com
Cautionary Statement regarding Forward-Looking Statements
This annual report may contain forward-looking statements. Forward-looking statements are statements that are not historical facts, including
(but not limited to) statements expressing or implying Fugro N.V.’s beliefs, expectations, intentions, forecasts, estimates or predictions (and the
assumptions underlying them). Forward-looking statements necessarily involve risks and uncertainties. The actual future results and situations
may therefore differ materially from those expressed or implied in any forward-looking statements. Such differences may be caused by various
factors (including, but not limited to, developments in the oil and gas industry and related markets, currency risks and unexpected operational
setbacks). Any forward-looking statements contained in this announcement are based on information currently available to Fugro N.V.’s manage-
ment. Fugro N.V. assumes no obligation to in each case make a public announcement if there are changes in that information or if there are
otherwise changes or developments in respect of the forward-looking statements in this annual report.

AN
NU
AL
RE
PO
RT
20
05
FU
GR
O N
.V.
A n n u a l R e p o r t 2 0 0 5F U G R O N . V.
GEOTECHNIEK
MILIEU ONDERZOEK
MARINER