fueling the race to postsecondary success:
TRANSCRIPT

A 48-Institution Study of Prior Learning Assessment and Adult Student Outcomes
Fueling the Race to Postsecondary Success:
March 2010

2
AcknowledgementsThis research study was made possible due to funding from Lumina Foundation for Education. CAEL is grateful to the Foundation for this support and applauds its commitment to helping more adult learners achieve postsecondary success.
CAEL would like to thank the 48 institutions who participated in this study:
The primary investigator and author of this report was Rebecca Klein-Collins, Director of Research at CAEL. Advising her throughout the project were CAEL’s Pamela Tate, Judith Wertheim, Diana Bamford-Rees and Karen Steinberg. Additional guidance was provided by Donald Hossler and Mary Ziskin of the Project on Academic Success at Indiana University Bloomington. This report benefited from the review of those listed above as well as: Alan Mandelll, SUNY Empire State College; and Amy Sherman, Laura Winters and Cathy Brigham, CAEL. A special thanks goes to Sara Thompson for her design and layout expertise; to Dana Lunberry and Cathy Swigon for editorial assistance; to Elizabeth Peterson for administrative support; to Patrick Hain for survey support; and to Ruth Chapman for her guidance during the research design process.
CAEL is further indebted to this project’s external advisory group: MaryBeth Lakin, American Council on Education; Peter Ewell, National Center on Higher Education Management Systems; Ariel Foster, The College Board; Cheryl Blanco, Southern Regional Education Board; Morris Fiddler, DePaul University School for New Learning; Alan Mandell, SUNY-Empire State College; Henry Van Zyl, Thomas Edison State College; Barry Sheckley, University of Connecticut; Tim Donovan, Community College of Vermont; and Elizabeth Tice, Ashford University.
The views expressed in this publication are those of the author and do not necessarily represent those of Lumina Foundation for Education, its officers or employees.
Athabasca University (Canada)Azusa Pacific UniversityBarry UniversityBucks County Community CollegeCalifornia Lutheran UniversityCalumet College of St. JosephCapella UniversityCentenary CollegeCharter Oak State CollegeCUNY Baccalaureate for Unique and
Interdisciplinary StudiesCUNY - Medgar Evers College of the City University
of New YorkDePaul UniversityEastern Connecticut State UniversityEastern Illinois UniversityEastern Kentucky UniversityEmpire State CollegeExcelsior CollegeGolden Gate UniversityHoughton CollegeIndiana University School of Continuing StudiesInver Hills Community CollegeLakeshore Technical CollegeManhattan Christian CollegeMaryville University
Miami Dade College Mid-America Christian UniversityNational-Louis UniversityNew York University—SCPS—Paul McGhee DivisionNorthern Kentucky UniversityNorthern Oklahoma CollegeNorthwood UniversityOttawa UniversityPalm Beach Atlantic UniversityPennsylvania State UniversitySaint Mary-of-the-Woods CollegeSimpson CollegeSt. Edward’s UniversitySuffolk County Community CollegeThe College of New RochelleThomas Edison State CollegeUniversity of Arkansas - Fort SmithUniversity of Louisville, College of Education and Human
DevelopmentUniversity of PhoenixUniversity of St. FrancisUniversity of the Fraser Valley (Canada)University of the Incarnate WordVermont State Colleges/Community College of VermontWebster University

3
Table of Contents
Tables and Figures 4
Introduction 6
Summary of Findings 7
Research Questions for This Study 9
Previous Research on PLA 10
Participating Institutions 11
PLA Programs Offered by Participating Institutions 18
Students at the Participating Institutions 24
PLA and Graduation Rates 34
PLA and Persistence 40
PLA and Time to Degree 43
PLA and Academic Outcomes: Student Demographics 48
PLA, Academic Outcomes and Institutional Policies 54
Summary and Discussion 57
Conclusion 60
References 61
Appendices Appendix A: Participating Institutions 63 Appendix B: Interview Subjects 64 Appendix C: Methodology 65

4
Tables and FiguresFigure 1. Size of Institutions Participating in the Study 12
Figure 2. Level of Institutions Participating in the Study 12
Figure 3. Degrees Offered by Participating Institutions 12
Figure 4. Control of Institutions Participating in the Study 13
Figure 5. Geographic Region of Institutions Participating in the Study 13
Figure 6. Degree of Urbanization of Institutions Participating in the Study 13
Figure 7. Women as Percentage of All Undergraduates at Institutions Participating in This Study, 2002 14
Figure 8. White, non-Hispanics as Percentage of All Undergraduates at Institutions Participating in This Study, 2002 14
Figure 9. Black, non-Hispanics as Percentage of All Undergraduates at Institutions Participating in This Study, 2002 14
Figure 10. Hispanics as Percentage of All Undergraduates at Institutions Participating in This Study, 2002 15
Figure 11. Students Age 25 or Older as Percentage of All Undergraduates at Institutions Participating in This Study, 2002 16
Table 1. Adult Focused Services Offered 17
Figure 12. Year in Which PLA First Offered at the Institution 18
Table 2. PLA Methods Offered by Participating Institutions, Compared to 2006 Survey Data 19
Table 3. Number of PLA Methods Offered by Participating Institutions 19
Table 4. PLA Method by Size of Institution 20
Table 5. Ways in Which PLA Credits Can Be Used 20
Table 6. Institutional Reasons for Offering PLA 22
Figure 13. PLA Students as a Percentage of All Students by Size of Institution 24
Figure 14. PLA Students as a Percentage of All Students by Level of Institution 25
Figure 15. PLA Students as a Percentage of All Students by Control of Institution 25
Figure 16. Gender of Students in Sample 25
Figure 17. PLA Students as a Percentage of All Students by Gender 25
Table 7. Size of Each Institutional Sample and Percentage of PLA students, 48 Institutions 26
Figure 18. Race/Ethnicity of Students in Sample, Where Known 27
Figure 19. PLA Students as a Percentage of All Students by Race/Ethnicity 27
Figure 20. Age of Students in Sample 28
Figure 21. PLA Students as a Percentage of All Students by Age 28
Figure 22. Transfer Students in Sample 29
Figure 23. PLA Credit-Earning and Transfer Credit-Earning 29
Figure 24. Financial Aid Recipients in Sample 30
Figure 25. PLA Students as a Percentage of All Students by Financial Aid Status 30
Figure 26. Military Status of Students in Sample 31
Figure 27. PLA Students as a Percentage of All Students by Military Status 31
Figure 28. Students Taking Remedial Courses 32
Figure 29. PLA Students as a Percentage of All Students, by Remedial Coursework 32

5
Figure 30. Students Taking ESL Courses 33
Figure 31. PLA Students as a Percentage of All Students, by ESL Coursework 33
Figure 32. Degree Completion by PLA Credit-Earning for All Students 34
Figure 33. Degree Completion by PLA Credit-Earning for Students Indicating Initial Goal of Associate’s Degree 35
Figure 34. Degree Completion by PLA Credit-Earning for Students Indicating Initial Goal of Bachelor’s Degree 35
Figure 35. PLA Students, Degree Completion, and Remedial Coursework 36
Figure 36. PLA and Cumulative GPA 37
Figure 37. PLA, Graduation Rates, and Cumulative GPA 37
Figure 38. Degree-Earning and PLA Earning by Institution Level 38
Figure 39. Degree-Earning and PLA Earning by Institution Control 38
Figure 40. Degree-Earning and PLA Earning by Institution Size, under 10,000 Students 39
Figure 41. Degree-Earning and PLA Earning by Institution Size, 10,000 Students or More 39
Figure 42. PLA and Persistence by Total Credit Accumulation, No Degree Earners 40
Figure 43. PLA and Persistence by Years of Credit-Earning, No Degree Earners 41
Figure 44. PLA and Persistence by Consecutive Years of Credit-Earning, No Degree Earners 42
Figure 45. Average Months to Degree by Number of PLA Credits, Bachelor’s Degree Earners 43
Table 8. PLA Credit-Earning and Distance From the Mean Months to Degree, Bachelor’s Degree Earners 45
Figure 46. Months to Degree by Number of PLA Credits, Associate’s Degree Earners 45
Table 9. PLA Credit-Earning and Distance From the Mean Months to Degree, Associate’s Degree Earners 46
Figure 47. Bachelor’s Time to Degree by Institution Control 47
Figure 48. Bachelor’s Time to Degree and Institution Size 47
Figure 49. Gender, PLA and Graduation Rates 48
Figure 50. Gender, PLA and Time to Bachelor’s Degree 48
Figure 51. Gender, PLA and Time to Associate’s Degree 49
Figure 52. Age, PLA and Graduation Rates 49
Figure 53. Age, PLA and Bachelor’s Time to Degree 50
Figure 54. Race/Ethnicity, PLA and Graduation Rates: Black, Hispanic and White 50
Figure 55. Race/Ethnicity, PLA and Graduation Rates: Native American, Asian, and Other 51
Figure 56. Race/Ethnicity, PLA and Bachelor’s Time to Degree: Black, Hispanic and White 51
Figure 57. Financial Aid, PLA and Graduation Rates 52
Figure 58. Financial Aid, PLA and Time to Bachelor’s Degree 52
Figure 59. Military Status, PLA and Graduation Rates 53
Figure 60. Military Status, PLA and Bachelor’s Time to Degree 53
Figure 61. Graduation Rates and PLA by Institutional Policies: Using PLA to Obtain Advanced Standing, Using PLA to Waive Course Prerequisites 54
Figure 62. Graduation Rates and PLA by Institution Policies: Using PLA for General Education Requirements, Using PLA for Major Requirements 55
Figure 63. Graduation Rates and PLA, by Number of Target Policies Institution Has in Place 55
Figure 64. Time to Degree and PLA, by Number of Target Policies Institution Has in Place 56

Fueling the Race to Postsecondary Success: A 48-Institution Study of Prior Learning Assessment and Adult Student Outcomes
IntroductionThroughout 2009, the federal government introduced a series of initiatives and challenges to refocus the nation on improving the education of children and adults. These included the President’s challenge for every American to have at least one year of college education, the proposed American Graduation Initiative, which would dedicate serious attention and funding to improving the persistence of students towards degrees, and Race to the Top incentive funding for states to implement dramatic reforms in K-12 education. These and other less-publicized efforts all recognize that in order for the nation to maintain its competitive edge and economic success, we must educate greater numbers of our citizens to higher levels than we have in the past.
But what can be done to fuel our educational “race to the top” among adults who are already in the labor market and out of reach of K-12 improvements? Efforts to improve affordability of and access to postsecondary education help get adults into the classroom or into online learning opportunities. However, this is only the first hurdle. Many students, particularly adults, face significant obstacles to staying in school and earning their hoped-for postsecondary degrees. To succeed, they need additional help even after they have made the choice to pursue education. Innovative academic programming, increased and creative financial aid opportunities and incentives, and various support services are among the strategies that have been found to help individual learners reach their goals.
Prior Learning Assessment, or PLA, is another important and often overlooked strategy for helping adults progress towards a degree. PLA is the process by which many colleges evaluate for academic credit the college-level knowledge and skills an individual has gained outside of the classroom (or from non-college instructional programs), including employment, military training/service, travel, hobbies, civic activities and volunteer service. PLA recognizes and legitimizes the often significant learning in which adults have engaged in many parts of their lives.
Institutions may use several different PLA methods in order to award credit for prior learning (see box on page 7 for the range of PLA methods) and, in the process, may make education more affordable and take less time. Some PLA methods cost a student more than others, but in general, any PLA credit-earning method will typically cost less than tuition the student would have to pay to enroll in the equivalent course. In addition, when PLA credit is earned, it may allow the student to enroll in, or advance to, another class instead.
PLA advocates have long argued that by helping students earn credits faster and at a lower cost, PLA can significantly contribute to students’ ongoing progress – or persistence – towards a degree. Yet, to date, there has not been a large, multi-institutional study on this topic.
With support from Lumina Foundation for Education, which works to ensure that 60 percent of Americans are college-educated by 2025, CAEL recently conducted a multi-institutional study on PLA and adult student outcomes. The study examined the records of 62,475 students at 48 colleges and universities, primarily in the United States but also in two Canadian institutions. Subjects were from the cohort of adult students (defined as all students aged 25 or above) who matriculated at these institutions in 2001-2002. The study followed their academic progress over the course of seven years. This report presents our findings.

Summary of FindingsThe data from 62,475 students at the 48 postsecondary institutions in our study show that PLA students had better academic outcomes, particularly in terms of graduation rates and persistence, than other adult students. Many PLA students also shortened the time required to earn a degree, depending on the number of PLA credits earned.
PLA and Graduation Rates PLA students in this study had much higher degree-earning rates than non-PLA students. More than half (56%) of PLA students earned a postsecondary degree within seven years, while only 21 percent of non-PLA students did so. In terms of the specific degrees earned:
f 43 percent of PLA students earned a bachelor’s degree, compared to only 15 percent of non-PLA students
f 13 percent of PLA students earned an associate’s degree, compared to 6 percent of non-PLA students
Prior Learning Assessment is not just one method or tool. It includes methods such as:
f Individualized student portfolios or Portfolio Assessments.
f Evaluation of corporate and military training by the American Council on Education (ACE). ACE publishes credit recommendations for formal instructional programs offered by non-collegiate agencies, or the ACE Guides.
f Program evaluations done by individual colleges of non-collegiate instructional programs that award credit for those who achieve recognized proficiencies, or the Evaluation of Local Training.
f Customized exams offered by some colleges to verify learning achievement; these may be current course final exams or may be other tests developed at the department level for assessing general disciplinary knowledge and skill, or Challenge Exams.
f Standardized exams such as:
f Advanced Placement Examination Program, or AP Exams, offered by the College Board
f College Level Examination Program, or CLEP Exams, also offered by the College Board
f Excelsior College Exams (formerly, Regents College Exams or ACT/PEP Exams)
f The DANTES Subject Standardized Tests, or DSST Exams, conducted by the Chauncey Group International, a division of Thomson Prometric
Defining PLAPLA students in this study had better graduation rates than non-PLA students:
f regardless of institutional size, level (two-year or four-year) or control (private for-profit, non-profit, or public)
f regardless of the individual student’s academic ability or grade point average
f regardless of the individual student’s age, gender, or race/ethnicity
f regardless of whether or not the individual student received financial aid
PLA and PersistenceThis study also examined what happened to the students who did not earn a postsecondary credential within seven years. One possibility is that some of these students might have come quite close to their goal, but need just a little more time to complete the degree. We explored the topic of persistence by comparing the credit accumulation and annual credit-earning of the PLA students and non-PLA students who did not earn degrees.

8
PLA students in this study who did not earn degrees were more persistent in terms of credit accumulation than the non-PLA students. More than half of all PLA students who had not yet earned a degree by the end of 2008 (56%) had accumulated 80 percent or more of the credits towards a degree between 2001-2002 and the end of 2008; only 22 percent of non-PLA students with no degree had made similar progress towards their degrees.
PLA students in our sample earned more institutional course credits, on average, than non-PLA students. PLA students (both degree-earners and non-degree earners) earned an average of 53.7 credits in institutional coursework (as opposed to credit accumulation from PLA credits or transfer credits), compared to an average of 43.8 credits by non-PLA students.
PLA students in this study who did not earn degrees had stronger patterns of annual enrollment and credit-earning than non-PLA students who did not earn degrees. Sixty percent (60%) of non-PLA students without degrees did not earn credit beyond one year of study, while higher percentages of PLA students without degrees re-enrolled and earned credits in the second, third, fourth, fifth and sixth years.
PLA and Time to DegreePLA students earning bachelor’s degrees saved an average of between 2.5 and 10.1 months of time in earning their degrees, compared to non-PLA students earning degrees. PLA students earning 13-24 PLA credits saved an average of 6.6 months, and those earning 49 or more PLA credits saved an average of 10.1 months.
PLA earners with associate’s degrees saved an average of between 1.5 and 4.5 months of time in earning their degrees, compared to non-PLA students earning associate’s degrees.
The variance from the average months to degree is much lower for PLA earners than for non-PLA earners, both at the associate’s and bachelor’s level. In other words, the PLA students’ months to degree are grouped more closely around the mean than the non-PLA students. This suggests that the average time to degree calculated for PLA students may be a more reliable estimate than the calculated time to degree for non-PLA students.
Institutional Policies and Student OutcomesSeparately, we examined the outcomes of students in the context of four institutional PLA policies that we would expect to have the greatest impact on a student’s progress towards degree completion:
f PLA credit can be used to obtain advanced standing at the institution
f PLA credit can be used to waive course prerequisites
f PLA credit can be used to meet general education requirements
f PLA credit can be used to meet program/major requirements
We found that, on average, the best student outcomes in terms of both degree-earning and reduced time to degree occur when all four options for applying PLA credit are available to students. In other words, the greater the flexibility the student has for using the PLA credit, the better the academic outcomes.

9
Research Questions for This StudyThe goal for this project was to explore whether student record data from multiple postsecondary institutions support the oft-made claim that earning PLA credit provides an advantage to adult students by helping them graduate, and by helping them earn their degrees faster than similar students who do not earn PLA credit.
Working with 48 postsecondary institutions (46 in the U.S. and 2 in Canada), CAEL examined student record data for a cohort of adult students who matriculated in the 2001-2002 school year and followed the cohort through 2008. Looking at these data, along with institutional characteristics and PLA policies and practices at those institutions, we attempted to answer the following research questions:
fDo adults who earn PLA credit have better graduation rates, compared with those who do not earn PLA credit?
fDo they have better persistence?
fDo they earn their degrees in a shorter period of time?
In addition to answering the above questions, the research study also examined the range of approaches that the different institutions participating in the study take towards PLA. CAEL also interviewed administrators from nine of the participating institutions to learn more about their perspectives on the value of PLA to students and institutions.
Questions This Study Will Not AnswerWe acknowledge that there are limitations on what this study could cover and that many questions remain about PLA and its value to and impact on adult learners. For example:
f This study could not show whether PLA credit is a predictor of positive student outcomes. Too many other factors upon which degree completion depends cannot be measured or are difficult to collect across multiple institutions. Studies have shown, for example, that the following individual factors have an impact on student success: personal characteristics, academic background, integration of the adult learner into the academic and social life of the campus, social influences (especially those of parents, peers, and teachers), GPA, institutional commitment, encouragement from friends and family, goal commitment, attitudes, financial status and assistance, and off-campus employment (Wolgemuth et al. 2007). This study could not control for most of these factors.
f This study does not evaluate the quality of the PLA programs at the participating institutions. However, all participating institutions are formally accredited.
f This study does not evaluate other potential benefits of PLA, such as the learning outcomes that portfolio-based assessments purportedly produce for the individual student (e.g., engagement in and understanding of the learning process, academic benefits of connecting past and new learning, and practice in self-regulation and self-direction).
f This study does not examine whether better educational outcomes are associated with one PLA method compared with another. For example, many advocates of portfolio-based assessments believe that the portfolio process itself is instructional and helps students engage more strongly with the institution and their educational journeys (and thus, as noted above, may have direct transferability to their success in their overall postsecondary studies). In effect, this research project treats all PLA credit equally.
Additional details of our methodology and approach to the data is provided in Appendix C.

10
Previous Research on PLA Systematic research conducted on PLA and student outcomes has been limited to date, although there are several studies that have relevance to the research questions this study is attempting to answer.
Freers (1994) conducted a study of graduation rates of PLA students and non-PLA students (specifically students who participated in portfolio assessment) at a community college and found that those who completed PLA went on to finish a bachelor’s degree or higher at a higher rate than those who had not completed the portfolio. Billingham and Travaglini (1981) examined the question of student retention and completion at Central Michigan University’s individualized baccalaureate degree program and isolated five factors that are “predictive of success” in terms of progress towards graduation. They found that the most important factor in predicting success is the number of credit hours transferred in or granted through PLA.
Looking at students at a community college, Snyder (1990) examined the relationship between receiving credit for prior learning and persistence by conducting a regression analysis of eight student characteristics. He found that three variables – grade point average, age, and receiving credit for prior learning after at least one year of college attendance – are significant in predicting persistence.
Sargent (1999) conducted a study of students at the Vermont State Colleges and found that students earning PLA credit at the college’s PLA center participated in higher education degree programs at a very high rate, PLA students persisted at a high rate, PLA shortened the time to degree attainment for non-traditional students, and many of the responding PLA students believed that PLA was instrumental in helping them complete their degrees. Pearson (2000) compared the persistence of PLA students with non-PLA students, controlling for background factors such as gender, age, high school performance, and number of prior college credits. He found that PLA was a very strong predictor of persistence, even when controlling for those background factors. Hoffman, LeMaster and Flickinger (1996) compared academic outcomes of PLA students with non-PLA students over a four-year period at the University of Maryland University College. They found that the PLA students had higher graduation rates, graduated faster, achieved a higher grade point average, and earned more credits when compared to the general population.
Although the above research suggests positive outcomes for PLA participants, these studies and others have examined PLA data only from single institutions, making it difficult to understand student experiences across a variety of institutional contexts.
There have been, however, studies of Canadian PLA (PLAR) students that examined data from multiple institutions. For example, Aarts et al. (1999) examined PLA data from seven Canadian higher education institutions. The study found that PLA students had higher grade-point averages and successful course completions (passing grades), took more courses, and had better graduation rates than non-PLA students. Fitzgibbon (2002) examined student record data from five institutions in British Columbia and found that PLA students did not differ appreciably from non-PLA students; however, the data submissions from the participating institutions had several inconsistencies which made comparisons difficult.
There has been some noteworthy research on the ways in which PLA – especially portfolio assessment – has an impact on the students themselves. Several studies have found that students who complete a portfolio assessment benefit from the assessment process in terms of increased satisfaction, pride, and feelings of accomplishment (as cited in Pearson 2000: Boornazian 1994, Dagavrian and Walters 1993, Fisher 1991, Freers 1994). Burris (1997) meanwhile found that students gain academic and organizational skills from the process of producing a portfolio. Similar findings were reported by LeGrow, Sheckley and Kahrhahn (2002), who

11
compared the problem-solving skills of PLA students with non-PLA students and concluded that PLA can “help individuals with a rich store of prior experience develop cognitive skills that have parity with skills developed by learners in classroom settings.” This research suggested that providing classroom instruction alone may not be as effective as combining such instruction with interventions like PLA or other activities that elicit the students’ own articulation of their prior knowledge.
Previous research on PLA suggests that there is a positive relationship between PLA and good academic outcomes for adults. However, the research has been limited, with sample sizes that are small and typically limited to a single institution. What has been missing from the research is a large-scale study that examines the experiences of PLA students in a variety of academic settings.
Participating InstitutionsIn response to an open invitation to postsecondary institutions, CAEL received a total of 66 applications from colleges and universities interested in participating in this study. In selecting the institutions for this research, we required the PLA program to have been operational by no later than 2001. Additional selection considerations included a strong adherence to the CAEL quality standards (see Fiddler, Marienau & Whitaker 2006), a good mix of PLA-earners and non-PLA students in 2001-2002, and a minimum of at least 25 PLA students in 2001-2002. CAEL also made selection decisions that would help achieve a balance of institutional characteristics such as size, geographic location, control (public, private non-profit, and private for-profit), and level (two-year and four-year).
Finally, CAEL also considered whether the institution offered the portfolio assessment method of PLA. Many institutions that practice PLA, as well as many PLA researchers, have a preference for portfolio-based PLA assessment because they believe in that method’s ability to engage the student in the learning process and to reflect on the learning that was done; this preference for the portfolio method was shared by several of our national advisors. Although institutions offering portfolio assessments were preferred, CAEL did not ultimately require this method of PLA as a necessary condition for inclusion in the study.
Forty-eight institutions (or adult student programs/departments) ultimately participated in the study; 46 are located in the U.S., and the other two in Canada. (See box on page 13 for complete list of institutional participants.) At least six of the institutions opted not to draw their samples from the entire institution: Asuza Pacific University, Indiana University, New York University, and the University of Louisville included only the adult students from specific departments (e.g., continuing education); the CUNY system submitted a dataset for all of Medgar Evers College as well as the CUNY Baccalaureate for Unique and Interdisciplinary Studies program, and Ottawa University submitted data for the Kansas City campus only.
The characteristics of all 48 institutions are described below. The characteristics are for the entire institution and not for a specific department, program or campus. For the 46 U.S. institutions, information such as size, level, control, region, degree of urbanization, and student demographics comes from the National Center for Education Statistics, Integrated Postsecondary Education Data System (IPEDS). Data are from 2001 or 2002, the starting time period of the student cohort this study is examining.
For the Canadian institutions, the institutional data were obtained from the institution’s current websites, with the exception of the 2001-2002 student demographics (the Canadian institutions were therefore not included in the student demographics analysis).
12
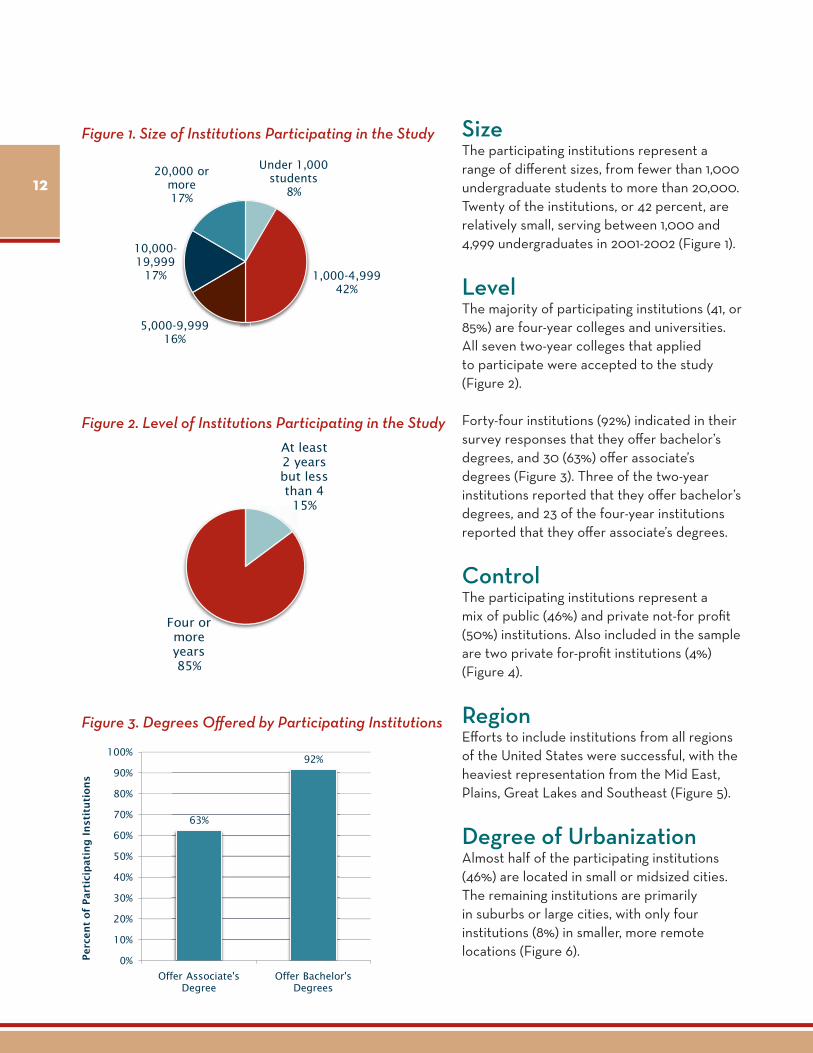
SizeThe participating institutions represent a range of different sizes, from fewer than 1,000 undergraduate students to more than 20,000. Twenty of the institutions, or 42 percent, are relatively small, serving between 1,000 and 4,999 undergraduates in 2001-2002 (Figure 1).
LevelThe majority of participating institutions (41, or 85%) are four-year colleges and universities. All seven two-year colleges that applied to participate were accepted to the study (Figure 2).
Forty-four institutions (92%) indicated in their survey responses that they offer bachelor’s degrees, and 30 (63%) offer associate’s degrees (Figure 3). Three of the two-year institutions reported that they offer bachelor’s degrees, and 23 of the four-year institutions reported that they offer associate’s degrees.
ControlThe participating institutions represent a mix of public (46%) and private not-for profit (50%) institutions. Also included in the sample are two private for-profit institutions (4%) (Figure 4).
RegionEfforts to include institutions from all regions of the United States were successful, with the heaviest representation from the Mid East, Plains, Great Lakes and Southeast (Figure 5).
Degree of UrbanizationAlmost half of the participating institutions (46%) are located in small or midsized cities. The remaining institutions are primarily in suburbs or large cities, with only four institutions (8%) in smaller, more remote locations (Figure 6).
Figure 2. Level of Institutions Participating in the Study
Figure 1. Size of Institutions Participating in the Study
Figure 3. Degrees Offered by Participating Institutions
Under 1,000 students
8%
1,000-4,99942%
5,000-9,99916%
10,000-19,999
17%
20,000 or more17%
At least 2 years but less than 415%
Four or more years85%
63%
92%
0%
10%
20%
30%
40%
50%
60%
70%
80%
90%
100%
Offer Associate's Degree
Offer Bachelor's Degrees
Perc
en
t of
Part
icip
ati
ng
In
stit
uti
on
s

Athabasca University (Canada)Azusa Pacific UniversityBarry UniversityBucks County Community CollegeCalifornia Lutheran UniversityCalumet College of St. JosephCapella UniversityCentenary CollegeCharter Oak State CollegeCUNY Baccalaureate for Unique and Interdisciplinary StudiesCUNY - Medgar Evers College of the City University of New YorkDePaul UniversityEastern Connecticut State UniversityEastern Illinois UniversityEastern Kentucky UniversityEmpire State CollegeExcelsior CollegeGolden Gate UniversityHoughton CollegeIndiana University School of Continuing StudiesInver Hills Community CollegeLakeshore Technical CollegeManhattan Christian CollegeMaryville UniversityMiami Dade College Mid-America Christian UniversityNational-Louis UniversityNew York University–SCPS–Paul McGhee DivisionNorthern Kentucky UniversityNorthern Oklahoma CollegeNorthwood UniversityOttawa UniversityPalm Beach Atlantic UniversityPennsylvania State UniversitySaint Mary-of-the-Woods CollegeSimpson CollegeSt. Edward’s UniversitySuffolk County Community CollegeThe College of New RochelleThomas Edison State CollegeUniversity of Arkansas - Fort SmithUniversity of Louisville, College of Education and Human DevelopmentUniversity of PhoenixUniversity of St. FrancisUniversity of the Fraser Valley (Canada)University of the Incarnate WordVermont State Colleges/Community College of VermontWebster University
Figure 5. Geographic Region of Institutions Participating in the Study
Figure 4. Control of Institutions Participating in the Study
Participating Institutions
Figure 6. Degree of Urbanization of Institutions Participating in the Study
Private for profit
4%
Private not-for-profit50%
Public46%
Canada4% Far West
6%
Plains15%
Great Lakes19%
Southeast15%
Southwest10%
Mid East25%
New England6%
Large City25%
Small or Midsize City
46%
Suburb21%
Town8%

14
Figure 7. Women as Percentage of All Undergraduates at Institutions Participating in This Study, 2002
U.S., 11%
87%
0%
5%
10%
15%
20%
25%
30%
35%
40%
45%
50%
U.S., 62%
0%
10%
20%
30%
40%
50%
60%
70%
80%
90%
100%
U.S., 57%
0%
10%
20%
30%
40%
50%
60%
70%
80%
90%
100%
Figure 9. Black, non-Hispanics as Percentage of All Undergraduates at Institutions Participating in This Study, 2002
Figure 8. White, non-Hispanics as Percentage of All Undergraduates at Institutions Participating in This Study, 2002

15
GenderInstitutions in our study varied widely in terms of the percentage of undergraduates who were women, according to 2002 IPEDS data, from a low of 34 percent to a high of 100 percent. The mean was 59 percent women, compared to the U.S. average of 56.6 percent in fall 2001 (U.S. Department of Education 2003) (Figure 7).
Race/EthnicityRacial makeup varied widely at the institutions in our study. The percentage of undergraduates who were white, non-Hispanic, according to 2002 IPEDS data, ranged from a low of 1 percent to a high of 94 percent. The average percentage of undergraduates who were white, non-Hispanic was 63 percent, compared to the U.S. average of 62 percent in 2001 (U.S. Department of Education, 2003) (Figure 8).
The percentage of undergraduates who were black, non-Hispanic, as reported in 2002, ranged from a low of less than 1 percent to a high of 87 percent. The average percentage of undergraduates who were black, non-Hispanic in this study was 11 percent, similar to the U.S. average in 2001 (U.S. Department of Education, 2003) (Figure 9).
The percentage of undergraduates who were Hispanic, according to 2002 IPEDS data, ranged from a low of less than 1 percent to a high of 60 percent. The average percentage of undergraduates who were Hispanic was 8 percent, compared to the U.S. average of 11 percent in 2001 (U.S. Department of Education, 2003) (Figure 10).
U.S., 11%
53% 60%
0%
5%
10%
15%
20%
25%
30%
35%
40%
Figure 10. Hispanics as Percentage of All Undergraduates at Institutions Participating in This Study, 2002
16
Figure 11. Students Age 25 or Older as Percentage of All Undergraduates at Institutions Participating in This Study, 2002
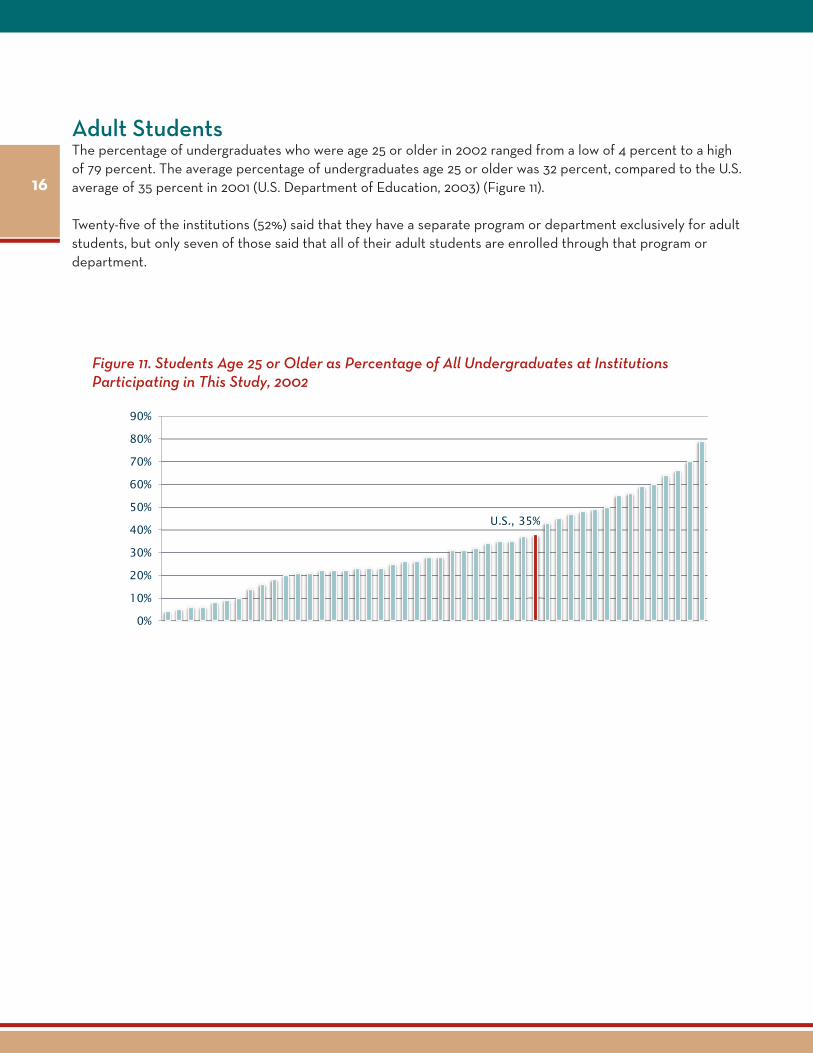
Adult StudentsThe percentage of undergraduates who were age 25 or older in 2002 ranged from a low of 4 percent to a high of 79 percent. The average percentage of undergraduates age 25 or older was 32 percent, compared to the U.S. average of 35 percent in 2001 (U.S. Department of Education, 2003) (Figure 11).
Twenty-five of the institutions (52%) said that they have a separate program or department exclusively for adult students, but only seven of those said that all of their adult students are enrolled through that program or department.
U.S., 35%
0%
10%
20%
30%
40%
50%
60%
70%
80%
90%

17
# of Adult Learner Focused Programs/
Services OfferedTotal Institutions
Percent of All Participating Institutions
4-6 5 10%
7-9 11 23%
10 or more 32 67%
Total 48 100%
Table 1. Adult Focused Services Offered
Adult Learning Focused Institution (ALFI) Characteristics/ScalePLA is not offered in a vacuum. There are many other programs and services that institutions offer that are designed to improve the experiences and success of adult students. In the Adult Learning Focused Institution (ALFI) initiative, for example, CAEL has identified a range of programs and services that make an institution supportive of its adult learners (for more information on ALFI, please see www.cael.org/alfi). Although conducting a formal assessment of whether the 48 participating institutions are “ALFI institutions” was beyond the scope of this study, we did ask them whether they offered any of the following fifteen services or programs:1. Special outreach to adults
2. Career advising
3. Educational advising
4. Student services offered in the evening
5. Student services offered on weekends
6. Courses offered in the evening
7. Courses offered on weekends
8. Flexible course schedules (e.g. modular course formats of varying lengths)
9. Accelerated course options
10. Child care
11. Online and other distance learning opportunities
12. Financial assistance for part-time learners
13. Ability to drop out and reenroll in same course without penalty due to unforeseen emergencies
14. Use of individual learning plans
15. Veteran/military support services
Two-thirds of the participating institutions said that they offered ten or more of those services/programs (Table 1).
Three-fourths (75%) of the institutions with 10,000 or more students reported that they offered 10 or more services, compared to 63 percent of institutions with fewer than 10,000 students.
Eighty-six percent of the two-year institutions reported that they offered 10 or more services, compared to only 63 percent of the four-year institutions.

18
PLA Programs Offered by Participating InstitutionsWe expected that the institutions interested in participating in this study would be those who already had a strong interest in and history of offering PLA, and that was the case.
Almost two-thirds of the participating institutions (66%) have offered PLA since before 1980, with the remainder split between the 1980s and the 1990s as the decade in which PLA was first offered (institutions first offering PLA after 2001 could not, by definition, be included in this study) (Figure 12).
PLA Methods OfferedParticipating institutions typically offer a range of PLA options, with the most commonly-offered option being standardized exams (94%). The second most common method offered by institutions in this study is portfolio assessment; however, this may be due in part to the fact that the number of portfolio assessments conducted in 2001 was considered in the selection process. Table 2 shows the percentage of our participating institutions offering the various PLA methods, compared to results from a larger survey of PLA institutions CAEL conducted in 2006.
Study participants were more likely to offer multiple methods of PLA rather than just one or two. Almost two-thirds (64%) of the 48 institutions offered five or more methods, and 84 percent offered four or more methods (See Table 3). When asked in phone interviews why they offer more than one method of PLA, several administrators pointed out that multiple methods are needed because there is more than one method of learning. Said one administrator, “It’s nice to have lots of options for people who perform differently. Some people test well, others are better at reflecting on their experience. Other options recognize that people learn from their careers.” One administrator explained that at her institution, each department determines which PLA method is used for which courses. At that institution, exam-based methods are encouraged when available because the exam is “quicker and cleaner,” but if there is no exam, then the department will accept a portfolio as evidence of student learning.
Figure 12. Year in Which PLA First Offered at the Institution
Before 198067%
1980-198914%
1990-199917%
2000-20012%

19PLA Methods
Percent of Institutions Participating in the 2009 Study Who Offer Specific
PLA Methods
Percent of PLA Institutions Surveyed in 2006 Who Offer
Specific PLA Methods
Standardized exams (e.g., CLEP, DSST, Excelsior)
94% 92%*
ACE-evaluated corporate training programs
77% 70% (ACE Guides)
ACE-evaluated military training programs
81% No data available
Institutionally-evaluated training programs
63% 38%
Institutional challenge exams
65% 57%
Portfolio assessments
88% 66%
Table 2. PLA Methods Offered by Participating Institutions, Compared to 2006 Survey Data
Table 3. Number of PLA Methods Offered by Participating Institutions
Number of PLA Methods Offered
Number of Institutions
Percent of Participating Institutions
1 2 4%
2 1 2%
3 5 10%
4 9 19%
5 17 35%
6 14 29%
Total 48 100%
*In addition, the 2006 survey found that among responding institutions, 87% offered CLEP exams, 84% offered AP exams, 48% offered DSST exams, and 28% offered Excelsior exams.

20
Size of Institution
Standardized exams (e.g., CLEP, DSST,
Excelsior)
ACE-evaluated corporate
training programs
ACE-evaluated military training
programs
Institutionally-evaluated
training programs
Institutional challenge
exams
Portfolio assessments
Under 1000n=4
75% 75% 75% 75% 25% 100%
1000-4,999n=20
100% 90% 85% 60% 70% 85%
5,000-9,999an=8
88% 63% 88% 63% 75% 88%
10,000-19,999n=8
100% 75% 88% 63% 50% 88%
20,000 or moren=8
88% 63% 63% 63% 75% 88%
All Institutions 94% 77% 81% 63% 65% 88%
Table 4. PLA Method by Size of Institution
In what ways can PLA credits be used at your institution? Percent of Participating Institutions Selecting Response (Multiple Responses Possible)
To meet elective requirements 94%
To meet general education requirements 88%
To meet program/major requirements 79%
To obtain advanced standing 69%
To waive course prerequisites 67%
To meet prerequisites for graduate or other special academic or occupational programs 25%
To fulfill residency requirements 19%
Table 5. Ways in Which PLA Credits Can Be Used
For the most part, each of the different PLA options were offered by a large percentage of the participating institutions, regardless of institution size. The exception was institutional challenge exams, which were offered by only 25 percent of the smallest institutions (Table 4).

21
Size of Institution
Standardized exams (e.g., CLEP, DSST,
Excelsior)
ACE-evaluated corporate
training programs
ACE-evaluated military training
programs
Institutionally-evaluated
training programs
Institutional challenge
exams
Portfolio assessments
Under 1000n=4
75% 75% 75% 75% 25% 100%
1000-4,999n=20
100% 90% 85% 60% 70% 85%
5,000-9,999an=8
88% 63% 88% 63% 75% 88%
10,000-19,999n=8
100% 75% 88% 63% 50% 88%
20,000 or moren=8
88% 63% 63% 63% 75% 88%
All Institutions 94% 77% 81% 63% 65% 88%
Ways That PLA Credit Can Be UsedWhen asked how PLA credits can be used at the institution, an overwhelming majority of study participants said that PLA credit can be used to meet elective requirements (94%), general education requirements (88%), or program/major requirements (79%). Somewhat fewer participating institutions said that PLA could be used to obtain advanced standing (69%) or to waive course prerequisites (67%). Far fewer institutions said that PLA could be used to meet prerequisites for graduate programs or to fulfill residency requirements (Table 5).
Institutional Policies Limiting the Use of PLA Credit EarnedAll of the participating institutions said that PLA credit may apply as “lower division credit.” Looking only at the four-year institutions, seventy-five percent (75%) reported that PLA credit may, if appropriate, apply as “upper division credit.”
Eighteen (38%) of the participating institutions limit PLA credit to specific departments or programs. This frequently occurs when there are pockets of resistance to PLA. In an interview, one university administrator explained that each school within the university treated PLA differently. “Most schools are cooperative. But sometimes, we have a school that is not cooperative. That school will not accept portfolio credits into its degree plans, and its faculty will not participate in evaluating submitted portfolios. But we know that going in, so we can steer students away from attempting credits in those areas.”
Eighty percent (80%) of the participating institutions limit the number of PLA credits that can apply towards a degree. There is significant variation in those limits, but the most common approach was to limit PLA credits to approximately half of the credits needed for the degree (i.e., 30-32 credits for an associate’s degree, and 64 credits for a bachelor’s degree).
Reason for Offering PLAWe asked the institutions why they offer PLA, allowing them to indicate one or more responses from a list of 18 possible reasons. The most popular responses were “to provide a time-saving avenue for degree completion,” “to fulfill our mission to serve adult learners,” and to “encourage greater student persistence towards a degree.” Other popular responses were “to recognize the value of learning that happens outside of the classroom,” and “to provide a cost-effective avenue for degree completion.” (The complete list of responses is found in Table 6.)
In our interviews with nine of the PLA administrators, we asked them to share with us, in their own words, why they value PLA. Explained one, “Our students are ones who have attended other institutions, have work and life experiences, many are career changers, many were never successful in higher education, and they have been working for a while. Our students tend to have experiences that will be significant enough that they are equivalent to higher learning. They have received training and certifications related to work… [PLA] gives them recognition for the learning they already acquired.”
Added another administrator, “It is a validation that what they know is important and relevant. I think that it is almost insulting to say that what they learn is not similar to what we teach them.” Another observed that before PLA there was no way to earn credit for the learning that was achieved from experience, and so “I cannot imagine a serious undergrad program for adult learners that would not do PLA. It’s essential to having full academic integrity.” One interviewee from a two-year institution echoed the most popular reason: the time factor. “In the current economic climate, people are in a hurry to get back in the workplace with upgraded

22
Table 6. Institutional Reasons for Offering PLA
Why does your institution offer PLA? Percent of Participating
Institutions Selecting Response (Multiple Responses Possible)
To provide a time-saving avenue for degree completion 92%
To fulfill our mission to serve adult learners 92%
To encourage greater student persistence towards a degree 90%
To recognize the value of learning that happens outside of the classroom 88%
To provide a cost-effective avenue for degree completion 85%
To remove barriers to education 83%
To offer a way for students to avoid class work that would be redundant 73%
To help students understand the connection between experiential learning and academic knowledge
67%
To increase analysis, critical reflection and evaluation of one’s past and present abilities as a roadmap to formulate and reach future goals (self-knowledge)
65%
To recruit students generally 60%
To recruit a specific/target student population 58%
To encourage self-esteem and self-confidence in our students 48%
To help students bypass prerequisites and register for upper-level residence courses that are more academically challenging and better suited to their educational needs/abilities.
38%
To produce a portfolio that demonstrates students’ learning and competencies for current and/or future employers.
35%
To keep up with the offerings of our competitors 31%
To reduce the incentive to transfer 31%
To fulfill part of our social justice agenda 29%
To augment writing and organizational skills 29%

23Why does your institution offer PLA? Percent of Participating
Institutions Selecting Response (Multiple Responses Possible)
To provide a time-saving avenue for degree completion 92%
To fulfill our mission to serve adult learners 92%
To encourage greater student persistence towards a degree 90%
To recognize the value of learning that happens outside of the classroom 88%
To provide a cost-effective avenue for degree completion 85%
To remove barriers to education 83%
To offer a way for students to avoid class work that would be redundant 73%
To help students understand the connection between experiential learning and academic knowledge
67%
To increase analysis, critical reflection and evaluation of one’s past and present abilities as a roadmap to formulate and reach future goals (self-knowledge)
65%
To recruit students generally 60%
To recruit a specific/target student population 58%
To encourage self-esteem and self-confidence in our students 48%
To help students bypass prerequisites and register for upper-level residence courses that are more academically challenging and better suited to their educational needs/abilities.
38%
To produce a portfolio that demonstrates students’ learning and competencies for current and/or future employers.
35%
To keep up with the offerings of our competitors 31%
To reduce the incentive to transfer 31%
To fulfill part of our social justice agenda 29%
To augment writing and organizational skills 29%
qualifications. I just talked with a student who had just been laid off and was able to suggest that she could challenge some introductory accounting courses, computers and history. It was exciting to her that she could potentially get credit for four courses in a matter of weeks.”
Other interviewees focused on one of the less popular reasons acknowledged in the survey results, namely, “to encourage self-esteem and self-confidence in our students.” In speaking about portfolio assessment, one administrator said that there is “a transformation that the student goes through in analyzing their prior learning – the student is able to prove to himself and to the faculty that he has come to the school with prior learning. It’s a validation. It strengthens the academic character, strengthens the self-confidence. They learn more about what they have learned, what they have achieved – probably more so than in the classroom.”
One interviewee observed that PLA also addresses the question of fairness, noting that foreign students can earn credit for mastery of their own language. “This is only fair since native students [in mandatory composition courses] get credit for their writing ability in their own language.”
In our interviews, we asked specifically how the institutions benefit from offering PLA. Many responded that PLA can be a tool for recruiting adult students: “With the adult market, students that are savvy customers are asking for these policies. For them it’s an indication of how adult friendly you are.” One person called PLA a “magnet for enrollment,” another “a competitive benefit.” Some institutions are able to promote specific methods of PLA for recruiting students; one administrator noted that her institution is a CLEP testing center and also that the institution has the largest portfolio program in the state. Both of these offerings help with student recruitment. Similarly, student retention was cited as an important factor. “If a student feels they are being heard, and they are getting good advice on PLA, loyalty to the school could be impacted.”
The interviewees also noted that when you offer PLA, the result is that you graduate people who are grateful to you. Said one, “You leave as friends. You have alums who are more friendly to you. In particular, the portfolio method makes the best friends. There is something magical about that method.” Another agreed with this assessment, saying, “Alumni who do [portfolio] PLA feel closer ties to the college. They’ve had more conversations with their mentor. […] The student ends up having a lot more contact with individuals in an intimate way. When you talk about what you know, you have been valued in a different way. We have healthy alumni giving.” That close contact can also help with curriculum development, according to one administrator: “The PLA process gives faculty a chance to see how higher-level learners think about topics and course materials.”
One administrator from a large public university said that when an institution offers PLA, it can say that it is serving its citizens better. “It’s improving the routes in which a student can pursue college credits. That’s a service that the university can say that it extends to its citizenry: that it acknowledges different types of learning.”
Administrators also explained that PLA helps them fulfill their missions. One interviewee from a competency-based institution said that with PLA, it’s “walking the talk.” Another said, “At the heart of the college is the goal of reaching populations that would otherwise not be educated. It’s important to our mission to acknowledge what they’ve done, what they know, their life experience.”

24
Students at the Participating InstitutionsPercentage of Adults Matriculating in 2001-2002 Earning PLA Credit through 2008The number of students in each of the 48 institutional datasets varied widely, ranging from more than 65,000 students to only 24.1 The percentage of adult students who earned PLA credit also varied widely, from a low of 2 percent to a high of 98 percent (one institution submitted data only on students in the PLA program) (Table 7 on page 26).
In our analysis, we treated all institutional datasets equally, without weighting. The one exception to this decision not to manipulate the size of the institutional samples was for one institution whose sample was so large that it would have comprised more than half of the overall total student records in the study. For that institution, we took a random ten percent sample to bring that institution’s sample size down to be comparable to the next largest sample size. The random sample’s summary student characteristics (gender, age, race/ethnicity) and academic record (number of transfer credits, PLA credit-earning ratio, graduation rate and time to degree) reflected those in the institution’s full dataset. The final dataset therefore describes students’ experiences across 48 institutions in a way that allows a diversity of institutional contexts to be visible in the results.
The combined sample for this study includes records of 62,475 adult learners from 48 institutions who matriculated in school year 2001-2002, 25% of whom earned PLA credit between 2001-2008. For the rest of this report, we will refer to this group as PLA students, and we will refer to the sample’s adult students who did not earn PLA credit as non-PLA students. To ensure student and institutional confidentiality, we will not identify specific institutions in any data reports.
PLA Students by Size of InstitutionThe percentage of PLA students among the total adult learners varied slightly, with the lowest percentage of PLA students at institutions with 10,000 to 19,999 students (17%) and the highest percentage at institutions with 5,000 to 9,999 students (36%) (Figure13).
Figure 13. PLA Students as a Percentage of All Students by Size of Institution
28%33% 36%
17%23%
72% 67% 64% 83% 77%
0%
10%
20%
30%
40%
50%
60%
70%
80%
90%
100%
Under 1,000
1,000-4,999
5,000-9,999
10,000-19,999
20,000 or more
Did not earn PLA credit
Earned PLA Credit
1 In selecting institutions for the study, selection criteria we considered were the size of the adult student population in 2001-2002 and the percentage of adult students earning PLA credit in 2001-2002. We selected institutions whose applications indicated that they would have a balance of both PLA and non-PLA credit earners, with a minimum of 25 PLA credit earners.

25
Figure 14. PLA Students as a Percentage of All Students by Level of Institution
4%
30%
96% 70%
0%
10%
20%
30%
40%
50%
60%
70%
80%
90%
100%
At least 2 but less than 4
Four or more years
Earned PLA Credit Did not earn PLA credit
12%
46%
17%
88% 54% 83%
0%
10%
20%
30%
40%
50%
60%
70%
80%
90%
100%
Private for profit Private not-for-profit
Public
Earned PLA Credit Did not earn PLA credit
PLA Students by Level and ControlThe four-year institutions in our study had much higher percentages of PLA students (30%) than two-year institutions (4%) (Figure 14).
Private not-for-profit institutions had a higher percentage of PLA students (46%) compared to public (17%) and private for-profit (12%) institutions (Figure 15). The size of institution may be an intervening variable, as 12 of the 22 public institutions in the study serve 10,000 or more students, and one of the two private for-profit institutions is large as well.
GenderNearly three-fifths of all students in our sample were female (59%), but a smaller percentage of PLA students were female (52%) (Figure 16). The male students in our sample were more likely to have earned PLA credit (29%) compared with female students (22%) (Figure 17).
Figure 16. Gender of Students in Sample
41%
48%
59% 52%
0%
10%
20%
30%
40%
50%
60%
70%
80%
90%
100%
All Students (n=62,389)
PLA Students (n=15,587)
Male Female
Figure 17. PLA Students as a Percentage of All Students by Gender
29%
22%
71% 78%
0%
10%
20%
30%
40%
50%
60%
70%
80%
90%
100%
Male Female
Earned PLA Credit Did not earn PLA credit
Figure 15. PLA Students as a Percentage of All Students by Control of Institution

Number of Students 25 Years Old or Older in Each Institutional Sample, Presented in Order
of Sample Size, from Largest to Smallest
Number of Students in the Institutional Sample with
PLA Credit
Percentage of Students in the Institutional Sample
with PLA Credit1 8,732 5,580 64%2 8,031 194 2%3 6,555 793 12%4 6,409 966 15%5 5,003 1,481 30%6 3,414 2,383 70%7 3,088 235 8%8 1,361 72 5%9 1,341 56 4%10 1,261 39 3%11 1,260 79 6%12 1,255 54 4%13 1,176 38 3%14 1,132 55 5%15 984 527 54%16 811 96 12%17 668 45 7%18 659 336 51%19 659 464 70%20 612 366 60%21 582 27 5%22 530 371 70%23 515 50 10%24 472 15 3%25 472 177 38%26 458 65 14%27 424 53 13%28 389 112 29%29 385 20 5%30 376 20 5%31 353 75 21%32 327 37 11%33 326 58 18%34 287 9 3%35 277 14 5%36 273 80 29%37 169 12 7%38 169 79 47%39 165 22 13%40 157 7 4%41 156 47 30%42 154 90 58%43 153 20 13%44 139 14 10%45 119 61 51%46 118 116 98%47 95 65 68%48 24 19 79%
Total number of students in the sample for the study
62,475
Total number of students in sample with PLA Credit
15,594
Percentage of all students in study sample with PLA credit
25%
Table 7. Size of Each Institutional Sample and Percentage of PLA students, 48 Institutions

27
Race/EthnicityNot every institution in the study was able to provide data on the race/ethnicity of their students. Of the 44,936 students for whom this data was available, just over half (55%) were white, non-Hispanic; 18 percent were Hispanic; and 17 percent were black, non-Hispanic (Figure 18).
The distribution of PLA students showed a higher percentage of white, non-Hispanics than the full student sample due to differing rates of PLA credit earning. Among the different groups, Asian/Pacific Islander students had the highest rate of PLA credit earning (40%), followed by white, non-Hispanic students (33%). Black non-Hispanic students earned PLA credit at a rate that is close to the average for the entire student sample (24%, compared to the average of 25%), while Hispanic students earned PLA credit at a comparatively low rate (15%) (Figure 19).
Figure 18. Race/Ethnicity of Students in Sample, Where Known
3% 4%
17% 15%
18% 10%
55%
66%
3% 4%
0%
10%
20%
30%
40%
50%
60%
70%
80%
90%
100%
All Students (n=44,936)
PLA Students (n=12,498)
American Indian/Alaska Native
Asian/Pacific Islander
Black non-Hispanic
Hispanic
White, Non-Hispanic
Other
29%
40%
24%
15%
33%
17% 18%
71% 76% 85% 67% 83% 82%
0
0.1
0.2
0.3
0.4
0.5
0.6
0.7
0.8
0.9
1
American Indian/Alaska Native (n=469)
Asian/Pacific Islander
(n=1,344)
Black non-Hispanic (n=7,852)
Hispanic (n=8,109)
White non-Hispanic
(n=24,599)
Other (n=2,563)
Unknown (n=17,539)
Earned PLA Credit Did not earn PLA credit
Figure 19. PLA Students as a Percentage of All Students by Race/Ethnicity

28
Figure 20. Age of Students in Sample
50%44%
33%
38%
14% 15%
2% 2%0.4% 0%
0%
10%
20%
30%
40%
50%
60%
70%
80%
90%
100%
All Students (n=61,129)
PLA Students (n=15,524)
65 or older
55-64
45-54
35-44
25-34
Figure 21. PLA Students as a Percentage of All Students by Age
22%29% 27% 24%
11%
78% 71% 73% 76% 89%
0%
10%
20%
30%
40%
50%
60%
70%
80%
90%
100%
25-34 (n=30,440)
35-44 (n=20,213)
45-54 (n=8,851)
55-64 (n=1,390)
65 or older (n=235)
Earned PLA Credit Did not earn PLA credit
Age of the Student Half of all students in our sample were aged 25-34, and the next largest group was students aged 35-44, accounting for one-third of the sample; the age distribution of PLA students shows that PLA students were slightly older (Figure 20). The age group with the highest rate of PLA earning was 35-44 year olds (29%), with 45-54 year olds close behind (27%). Students aged 25-34 and 55-64 earned PLA credit at a rate that is just below average (22% and 24%, compared with 25%). Students over age 65 had the lowest rate of PLA credit-earning (11%) (Figure 21).

29
Figure 22. Transfer Students in Sample Students with Transfer Credits (Other than PLA)Many institutions treat PLA credit on the student transcript as transfer credit. When collecting data for this study, CAEL specifically asked institutions to distinguish between transfer and PLA credit if they could. Students with non-PLA transfer credits comprised 44 percent of our total sample and 75 percent of all PLA students in the sample (Figure 22).
Students with transfer credits were almost four times more likely to earn PLA credit (43%) compared to students without transfer credits (11%) (Figure 23).
56%
25%
44% 75%
0%
10%
20%
30%
40%
50%
60%
70%
80%
90%
100%
All Students (n=61,807) PLA students (n=15,549)
No Transfer Credit Transfer Credit
Figure 23. PLA Credit-Earning and Transfer Credit-Earning
11%
43%
89% 57%
0%
20%
40%
60%
80%
100%
120%
No Transfer Credit (n=34,713) Transfer Credit (n=27,094)
Earned PLA Credit Did not earn PLA credit

30Financial Aid RecipientsNot every institution in the study was able to provide data on whether their students received need-based financial aid; 17,391 students in the sample (27%) had unknown financial aid status. Only 19 percent of all students in our sample were designated as financial aid recipients, compared to 11 percent of the PLA students in the sample (Figure 24).
Financial aid recipients were less likely to earn PLA credit; 33 percent of students who did not receive financial aid earned PLA credit compared to 15 percent of students who did receive financial aid (Figure 25). 19%
11%
53%
70%
27% 17%
0%
10%
20%
30%
40%
50%
60%
70%
80%
90%
100%
All Students (n=62,475)
PLA Students (n=15,594)
Received financial aid (n=11,664)
Did not receive financial aid (n=33,420)
Unknown (n=17,101)
15%
33%
16%
85% 67% 84%
0%
10%
20%
30%
40%
50%
60%
70%
80%
90%
100%
Received financial aid (n=11,664)
Did not receive financial aid (n=33,420)
Unknown (n=17,101)
Earned PLA Credit Did not earn PLA credit
Figure 25. PLA Students as a Percentage of All Students by Financial Aid Status
Figure 24. Financial Aid Recipients in Sample

31Students with Military ServiceOf the students in our total sample, 9 percent were confirmed to have some military background/experience (active, inactive, reserves, veteran, etc.), 25 percent had no military background, and no information on military status was available for 66 percent (more than 41,000 students) of our student sample (Figure 26).
Two-thirds (67%) of the students with military service histories earned PLA credit compared with two-fifths (40%) of students who are coded as non-military (Figure 27). However, available data on student military status come primarily from two institutions whose PLA take-up rate for all students is much higher than average. The higher PLA take-up rate among this sub-sample should therefore not be considered representative of all military students.
Figure 27. PLA Students as a Percentage of All Students by Military Status
Figure 26. Military Status of Students in Sample
9%
24%
25%
41%
66% 35%
0%
10%
20%
30%
40%
50%
60%
70%
80%
90%
100%
All Students (n=62,475) PLA Students (n=15,594)
Military No military Unknown
67%
40%
13%
33% 60% 87%
0%
10%
20%
30%
40%
50%
60%
70%
80%
90%
100%
Military (n=5,541)
No military (n=15,880)
Unknown (n=41,054)
Earned PLA Credit Did Not Earn PLA Credit

32
PLA Students by Remedial and ESL CourseworkInstitutions provided information on whether students took remedial courses for only 67 percent of the overall sample. The remaining 33 percent of the sample – more than 20,000 records – had unknown remedial course status. A very small percentage of the overall student sample (9%) was designated as having taken remedial courses, compared to an even smaller percentage of PLA students (2%) (Figure 28).
Of those students who had taken remedial coursework at the institution, 6 percent earned PLA credit, compared to 31 percent of students who had not taken remedial courses (Figure 29).
6%
31%
20%
94% 69% 80%
0%
10%
20%
30%
40%
50%
60%
70%
80%
90%
100%
Took remedial courses (n=5,336)
Did not take remedial courses
(n=36,755)
Unknown (n=20,384)
Earned PLA Credit Did not earn PLA credit
Figure 28. Students Taking Remedial Courses
9%2%
59%
72%
33% 26%
0%
10%
20%
30%
40%
50%
60%
70%
80%
90%
100%
All Students (n=62,475) PLA Students (n=15,594)
Took remedial courses
Did not take remedial courses
Unknown
Figure 29. PLA Students as a Percentage of All Students, by Remedial Coursework

33
Figure 30. Students Taking ESL Courses
Figure 31. PLA Students as a Percentage of All Students, by ESL Coursework
7% 1%
49%
44%
45% 55%
0%
10%
20%
30%
40%
50%
60%
70%
80%
90%
100%
All Students (n=62,475) PLA Students (n=15,594)
Unknown
Did not take ESL courses
Took ESL courses
2%
23%
31%
98% 77% 69%
0%
20%
40%
60%
80%
100%
120%
Took ESL courses (n=4,106)
Did not take ESL courses (n=30,449)
Unknown (n=27,920)
Earned PLA Credit Did not earn PLA credit
Similarly, information on whether the student took ESL classes was available for only 55 percent of the sample. Seven percent (7%) of the sample is designated as having taken ESL courses, compared with only 1 percent of PLA students (Figure 30). Of the 4,106 who took ESL classes, only 2 percent earned any PLA credit, compared with 23 percent of students who did not take any ESL classes (Figure 31).

34
Note: In some cases the student earning the associate degree may have also continued on and earned a bachelor’s degree as well, but only one earned degree was reported to CAEL. In addition, the outcome of “other” was used by institutions for other positive outcomes – in some cases for the earning of shorter term credentials/certificates, and in other cases for students transferring from a two-year to a four-year institution. The percentage of students with that outcome was very small and so does not factor into our analysis.
See persistence section (pages 40-42) for information about the attendance and credit-earning histories of those students not earning degrees.
PLA and Graduation RatesA key question for this study is whether PLA students earn degrees at a greater rate than non-PLA students. The study data indicate the answer is yes, and by a considerable percentage. Of all PLA students in the sample, 43 percent went on to earn a bachelor’s degree compared to only 15 percent of non-PLA students; and 13 percent of all PLA students enrolled in two-year programs earned an associate’s degree compared to six percent of non-PLA students (Figure 32). Looking at all degrees, 56 percent of PLA students earned a postsecondary degree, while only 21 percent of non-PLA students did so.
Figure 32. Degree Completion by PLA Credit-Earning for All Students
6%13%
15%
43%
1%
0%
78% 44%
0%
10%
20%
30%
40%
50%
60%
70%
80%
90%
100%
Did not earn PLA credit (n=46,881)
Earned PLA credit (n=15,594)
Did not earn degree or credential
Other
Earned Bachelor's Degree
Earned Associate's Degree

14%
29%
5%
19%
1%
0%
80% 52%
0%
10%
20%
30%
40%
50%
60%
70%
80%
90%
100%
Did not earn PLA credit (n=13,209)
Earned PLA credit (n=4,832)
Did not earn degree or credential
Other
Earned Bachelor's Degree
Earned Associate's Degree
Figure 33. Degree Completion by PLA Credit-Earning for Students Indicating Initial Goal of Associate’s Degree
3% 5%
27%
58%
0%
0%
70% 36%
0%
10%
20%
30%
40%
50%
60%
70%
80%
90%
100%
Did not earn PLA credit (n=21,055)
Earned PLA credit (n=9,760)
Did not earn degree or credential
Other
Earned Bachelor's Degree
Earned Associate's Degree
While we were unable to collect detailed information on the backgrounds of the students in our sample, we do have some information that helps us examine student populations with similar academic skills. For one subset of our sample, we know whether the student took remedial courses, and for another subset of the sample, we know the cumulative GPA. Taking remedial courses may serve as an indicator of poor academic skills at the start of a student’s matriculation, while cumulative GPA may serve as an indicator of overall academic performance.
Figure 34. Degree Completion by PLA Credit-Earning for Students Indicating Initial Goal of Bachelor’s Degree
Narrowing the analysis to the 18,041 students who indicated at the time of matriculation that their goal was an associate’s degree, we find that 29 percent of the PLA students succeeded in reaching that goal, while only 14 percent of non-PLA students did. Noteworthy is that 19 percent of PLA students indicating the goal of associate’s degree exceeded their goal and earned a bachelor’s degree within the timeframe of the study, compared to only five percent of non-PLA students (Figure 33).
Focusing the analysis on the 30,815 students who indicated at the time of matriculation that their goal was a bachelor’s degree, we find that 58 percent of PLA students were successful in achieving that goal, compared to only 27 percent of non-PLA students (Figure 34).
PLA, Graduation Rates and Measures of Academic StrengthIt may well be the case that students who pursue PLA credit are students who are already highly motivated or academically successful, and that motivation and academic strength are playing important roles in propelling the students forward to a degree. Therefore, an important question for this study is whether a higher graduation rate for PLA students exists even when comparing students of like abilities.

36
12%
38%
8%
14%5%
20%
17%
41%
1%
2%
1%
0%
81% 39% 74% 46%
0%
10%
20%
30%
40%
50%
60%
70%
80%
90%
100%
Took Remedial Courses, Non-PLA Student (n=4,860)
Took Remedial Courses, PLA
Student (n=299)
Did Not Take Remedial
Courses, Non-PLA Student
(n=24,603)
Did Not Take Remedial
Courses, PLA Student
(n=11,266)
No Degree
Other
Bachelor's Degree
Associate's Degree
Graduation Rates and Remedial CourseworkAs mentioned earlier in this report, data on whether students took remedial courses were provided by 38 institutions in the study. Among students taking remedial coursework, the PLA students had much higher degree completion rates than the non-PLA students. In the group of remedial students, 20 percent of PLA students earned bachelor’s degrees, compared to 5 percent of non-PLA students, and 38 percent of PLA students earned associate’s degrees compared to 12 percent of non-PLA students (Figure 35). This suggests that even for students who do not have strong academic backgrounds, earning PLA credits may be associated with higher graduation rates.
Graduation Rates and Grade Point AverageThere is much research suggesting that the PLA process itself may help to develop the academic skills and characteristics that a student needs to succeed in the rest of his or her studies (e.g., organization, reflection on learning that leads to higher understanding, writing skills, self-esteem). Although there is significant debate about whether Grade Point Average (GPA) is an appropriately nuanced indicator of student learning, it might be one way to measure whether a student gains skills from PLA that are then applied to non-PLA studies. However, this would require a much more complex set of data that could track GPA over time and that would be able to pinpoint exactly when a student earned the PLA credit. CAEL knows from its long history of working with PLA institutions – and this was confirmed during the data collection process for this study – that the timing of when PLA credit is posted to the transcript is not consistent from one institution to another. For example, some institutions only permit students to earn PLA credit at certain points in their studies. Further, some institutions do not have electronic data systems that would track PLA credit-posting data at all.
Nevertheless, the question of the potential relationships among GPA, PLA credit-earning and degree-earning is of interest, as we believe that it may help to understand whether it is the students’ academic strengths that lead them both to pursuing PLA credit and achieving better academic outcomes.
Figure 35. PLA Students, Degree Completion, and Remedial Coursework

37
When we looked at the cumulative GPAs of PLA students, we found that PLA students did have higher GPAs than non-PLA students. Seventy percent (70%) of PLA students had GPAs of 3.0 or higher, compared to 64 percent of non-PLA students, and 98 percent of PLA students had cumulative GPAs of 2.0 or higher, compared to 88 percent of non-PLA students (Figure 36).
When examining graduation rates by PLA status and cumulative GPA range, we found that PLA students had higher graduation rates than non-PLA students, even when controlling for GPA. Among all students with cumulative GPA of 3.0 or higher, PLA students had graduation rates of 66 percent compared to 35 percent of non-PLA students. Similarly, among all students with cumulative GPA of 2.0-2.9, PLA students had graduation rates of 44 percent compared to 28 percent of non-PLA students (Figure 37). PLA students with even lower GPAs had higher graduation rates as well (some students may be able to graduate with a cumulative GPA of less than 2.0 because of institutionally-specific academic progress policies).
24%
28%
64% 70%
0%
10%
20%
30%
40%
50%
60%
70%
80%
90%
100%
Non-PLA Students PLA Students
3.0 and higher
2.0-2.9
1.0-1.9
Under 1.0
0
Figure 36. PLA and Cumulative GPA
Figure 37. PLA, Graduation Rates, and Cumulative GPA
4%8%
2%
10%
3%
11%
28%
44%
35%
66%
0%
10%
20%
30%
40%
50%
60%
70%
80%
90%
100%
Non-PLA Student
PLA Student Non-PLA Student
PLA Student Non-PLA Student
PLA Student Non-PLA Student
PLA Student Non-PLA Student
PLA Student
0 0 Under 1.0 Under 1.0 1.0-1.9 1.0-1.9 2.0-2.9 2.0-2.9 3.0 and higher
3.0 and higher
Cumulative GPA and PLA Status
No Degree earned
Degree earned

38
PLA, Graduation Rates and Institutional CharacteristicsGraduation Rates by Institution Level: Two-year vs. Four-yearBoth two-year and four-year institutions showed higher rates of degree completion by PLA students compared to non-PLA students. PLA students at the two-year institutions that were a part of this study were four times more likely to complete degrees than non-PLA students (53% compared to 13%), and PLA students at our sample’s four-year institutions were twice as likely to earn degrees (55% compared to 24%) (Figure 38).
Graduation Rates by Institution Control: Private For- Profit, Private Not-For-Profit, and Public
Figure 39. Degree-Earning and PLA Earning by Institution Control
87%
47%
76%
45%
13% 53% 24% 55%
0%
20%
40%
60%
80%
100%
120%
Two Year Institution: Did not
earn PLA credit (n=12,117)
Two Year Institution: Earned PLA credit (n=524)
Four Year Institution: Did not
earn PLA credit (n=34,764)
Four Year Institution: Earned
PLA credit (n=15,070)
Did not earn a postsecondary degree Earned a postsecondary degree
23%
74%
43%
58%
14%
49%
77% 26% 57% 42% 86% 51%
0%
10%
20%
30%
40%
50%
60%
70%
80%
90%
100%
Private for profit: Did not earn PLA credit
(n=6,155)
Private for profit: Earned
PLA credit (n=858)
Private not-for-profit: Did not earn PLA credit
(n=9,875)
Private not-for-profit: Earned
PLA credit (n=8,387)
Public: Did not earn PLA credit
(n=30,851)
Public: Earned PLA credit (n=6,349)
Did not earn a postsecondary degree Earned a postsecondary degree
PLA students at private for-profits and public institutions earned degrees at a rate that was three times higher than non-PLA students at those institutions. A greater proportion of PLA students at private not-for-profit institutions earned degrees than non-PLA students, but the difference was not as pronounced as at private for-profit and public institutions (Figure 39).
Figure 38. Degree-Earning and PLA Earning by Institution Level

39
Figure 41. Degree-Earning and PLA Credit-Earning by Institution Size, 10,000 Students or More
Graduation Rates by Institution SizeWe also looked at how patterns in degree-earning for PLA students differed from those of non-PLA students at differently-sized institutions. Figure 40 shows the results for institutions with fewer than 1,000 students, 1,000-4,999 students, and 5,000-9,999 students. Figure 41 shows the results for institutions with 10,000-19,999 students and more than 20,000 students. Across all size categories, PLA students had higher graduation rates, with the largest graduation rate differential in institutions of 10,000 – 19,999 students.
Figure 40. Degree-Earning and PLA Earning by Institution Size, under 10,000 Students
42%
64%
44%
79%
21%
54%
58% 36% 56% 21% 79% 46%
0%
10%
20%
30%
40%
50%
60%
70%
80%
90%
100%
Under 1000 Students: Did not earn PLA credit
(n=571)
Under 1000 Students: Earned
PLA credit (n=221)
1000-4,999 Students: Did not earn PLA credit
(n=4,773)
1000-4,999 Students: Earned
PLA credit (n=2,379)
5,000 to 9,999 Students: Did not earn PLA credit
(n=5,900)
5,000 to 9,999 Students: Earned
PLA credit (n=3,257)
Earned a postsecondary degree Did not earn a postsecondary degree
19%
77%
18%
44%
81% 23% 82% 56%
0%
20%
40%
60%
80%
100%
120%
10,000-19,999 Students: Did not earn PLA credit (n=8,760)
10,000-19,999 Students: Earned PLA
credit (n=1,762)
20,000 Or More Students: Did not earn PLA credit (n=26,877)
20,000 Or More Students: Earned PLA
credit (n=7,975)
Earned a postsecondary degree Did not earn a postsecondary degree

40
PLA and PersistenceThe data presented above show that over the course of seven years, PLA students in our sample had much higher graduation rates than non-PLA students. A lingering question is: What happened to the students who did not earn a postsecondary credential? While we are unable to explain why these non-degree earners were not successful graduates (e.g., some may have stopped pursuing education entirely, while others may have transferred to institutions from which they did receive a degree), we suspect that there may be a portion of these non-degree earners who came close to their goal and who may be continuing to pursue it. Perhaps with additional time, or perhaps even additional supports, these students could be successful. A question for this study, then, is whether the non-degree earners with PLA credit had greater persistence – and came closer to their degree goals – than their non-PLA counterparts. We explored this question by examining the credit accumulation and annual credit-earning of the PLA students and non-PLA students who did not earn degrees.
Persistence by Credit Accumulation The first approach to persistence examined the percentage of credits that the non-degree-earning students earn towards their degree goals from the combination of transfer credits, PLA credits and credit earned from coursework at the institution.
More than half of all PLA students who had not yet earned a degree by the end of 2008 (56%) had accumulated 80 percent or more of the credits towards a degree between 2001-2002 and the end of 2008, compared with only 22 percent of non-PLA students with no degree (Figure 42). Conversely, over half of non-PLA students without degrees (56%) had fewer than 40 percent of the credits needed for a degree, compared to only 10 percent of PLA students without degrees.
Figure 42. PLA and Persistence by Total Credit Accumulation, No Degree Earners
28%
12%
16%13%
9%
22%
1% 2%
7%
16%18%
56%
0%
10%
20%
30%
40%
50%
60%
Earned fewer than 10% of credits for
degree
Earned 10-19% of credits needed
Earned 20-39% of credits needed
Earned 40-59% of credits needed
Earned 60-79% of credits needed
Earned 80% or more of credits
needed
Did not earn PLA credit (n=23,101) Did earn PLA credit (n=1,800)

41
Institutional leaders may also be interested in knowing the extent to which PLA students earn credits from taking courses at the institution (as opposed to credit accumulation from PLA credits or transfer credits). We examined the institutional course credits earned at institutions that limit the number of PLA credits to no more than half of the credits needed for a degree. This analysis showed that PLA students earned an average of 53.7 credits in institutional coursework, compared to an average of 43.8 credits by non-PLA students.
Persistence by the number of years of credit-earningWe also examined how credits were earned over time and whether students re-enrolled at the institution on an ongoing basis. In looking at the number of years of credit-earning between school years 2001-2002 and 2007-2008, we saw strong patterns of PLA student persistence over time. Sixty percent (60%) of non-PLA students without degrees did not earn credit in more than one year of study, while higher percentages of PLA students without degrees re-enrolled and earned credits in the second, third, fourth, fifth and sixth years (Figure 43).
60%
19%
9%
6%3% 3%
37%
23%
14%11%
7% 8%
0%
10%
20%
30%
40%
50%
60%
70%
1 2 3 4 5 6
Number of Years in Which Credit Was Earned (May Be Non- Consecutive)
Did not earn PLA credit (n=34,056) Did earn PLA credit (n=2,625)
Figure 43. PLA and Persistence by Years of Credit-Earning, No Degree Earners

42
Figure 44. PLA and Persistence by Consecutive Years of Credit-Earning, No Degree Earners
56%
18%
11%7%
4% 4%
21%
29%
23%
14%
7%6%
0%
10%
20%
30%
40%
50%
60%
1 Year 2 Years 3 Years 4 Years 5 Years 6 Years
Did not earn PLA credit (n=41,469) Did earn PLA credit (n=7,010)
A variation of the previous approach was to examine whether students earned credit in consecutive school years, with no stopping out. Again, more than half of non-PLA students without degrees (56%) only earned credit in their first year of study and earned no credit thereafter, compared with only 21 percent of PLA students without degrees. In fact, larger percentages of PLA students without degrees earned credit in two or even three consecutive school years (29% and 23%) than the percentage of PLA students who quit after only a year (Figure 44). In our interviews with PLA administrators, we learned that this finding is not a surprise. Said one, “We know that PLA students’ persistence and graduation rates are higher. They are the ones taking course after course, rather than taking time off.”
Overall, then, among the non-graduates, we do see a strong patterns of persistence for the PLA students compared to non-PLA students, both in terms of credit accumulation and annual enrollment.

43
PLA and Time to DegreePrevious research has found that two of the four biggest barriers that prevent adults from going back to school are time and money (the two others are family responsibilities and the scheduling of courses) (U.S. Department of Education 1998). PLA assessments are typically less expensive than taking a class, so PLA becomes a tool for addressing the financial barrier to education (see tuition calculation in sidebar on page 44). In addition, PLA advocates have long argued that PLA can save students time in working towards a degree.
In our calculation of time to degree, we excluded all students attending the ten institutions in our sample that do not have limits on the number of PLA credits that can be applied toward a degree, as such data could skew the results. In addition, we excluded students attending three institutions that could not provide the number of PLA credits earned.2 One institution met both criteria, so a total of twelve institutions were excluded from the analysis.
Time to Degree: Bachelor’sWhen examining the average time needed to complete the bachelor’s degree, we found that, as the number of PLA credits increased, the average time to degree decreased. On average, the greatest time savings was for students earning 13-24 PLA credits (6.6 months) and for students earning 49 or more PLA credits (10.1 months) (Figure 45). (Note: most of the participating institutions required 120-128 credits for a bachelor’s degree.)
The small rise in time to degree for students earning 25-48 PLA credits cannot be fully explained with the available data and suggests further study; for example, this may reflect the fact that, in some cases, not all PLA credits earned can be applied to a degree.
2Some institutions do not track PLA credit electronically and therefore had to determine through paper records whether a student earned PLA credit. For these institutions, we accepted yes/no for PLA credit-earning rather than specific numbers of credit in order to facilitate their data gathering.
39.7
37.2
36.1
33.1
34.5
35.8
29.6
25.0
27.0
29.0
31.0
33.0
35.0
37.0
39.0
41.0
No PLA Credit
(n=5,341)
1-6 PLA credits (n=860)
7-12 PLA credits (n=781)
13-24 PLA credits (1,170)
25-36 PLA credits (n=668)
37-48 PLA credits (n=161)
49 or more PLA credits
(n=219)
Avera
ge M
on
ths
to B
ach
elo
r's
Deg
ree
Figure 45. Average Months to Degree by Number of PLA Credits, Bachelor’s Degree Earners

44
The time to degree analysis at the bachelor’s level is potentially very meaningful for adult students. Consider an average adult student earning 15 PLA credits: this student saves, on average, six months in his or her quest to earn a bachelor’s degree. Those same 15 PLA credits, if they can be applied toward the degree, translates to significant tuition savings as well, from a low of $1,605 at a large public university (assuming the highest-cost PLA option) to a high of around $6,000 at other institutions. The table below provides several scenarios of tuition cost savings, using five institutions from our study as examples.
PLA Tuition Cost Savings at Five Sample Institutions, 15 Credit Scenario
Institution Tuition Needed for 15 Course Credits (2009-2010)* Cost for 15 PLA Credits**
Difference (Dollars Saved by
the Student)
Large public university #1 $149 per credit hour x 15 ($2,235) $20 per challenge exam x 5 ($100) $2,135
Large public university #2 $207 per credit hour x 15 ($3,105) $300 per assessment x 5
($1,500)*** $1,605
Mid-sized private college, adult program
$312 per credit x 15 ($4,680) $530 per portfolio evaluation x 5 ($2,650)*** $2,030
Large private university, adult program
$455 per credit hour x 15 ($6,825) $150 per assessment x 5 ($750) $6,075
Small private university $1,680 for 3-unit course x 15 ($8,400) $500 for credit for work
experience x 5 ($2,500) $5,900
PLA and Tuition Savings
The Pearson correlation between number of PLA credits and months to degree for students earning bachelor’s degrees is -.09, significant at the .01 level, meaning that as the number of PLA credits increases, the months to degree decrease slightly.
Also of interest is the fact that the higher the number of PLA credits earned, the lower the standard deviation from the mean. Table 8 shows the decreasing standard deviation and variance. In addition, it shows the range of the middle 50 percent (the group that is left when you omit the lowest and highest 25 percent in terms of months to degree). The spread is 27 months for the middle 50 percent of students not earning any PLA credit; this decreases fairly consistently with increasing numbers of PLA credits. In other words, the greater the number of PLA credits, the closer the student’s time to degree is to the mean; non-PLA students’ months to degree is more disparate. This suggests that the average time to degree calculated for PLA students may be a more reliable estimate than the calculated time to degree for non-PLA students.
* Current tuition rates taken from institutional websites. Does not include fees.
** PLA rates taken from information provided by the institution in online survey. Most expensive option used; assumed 3 credits hours earned per evaluation/assessment.
*** At these institutions, only the portfolio evaluation has a fee; all other PLA options are free of charge. Therefore, this calculation may be underestimating the average student’s cost savings.

45N Mean Std. Deviation Variance Median
Months to degree range for middle 50% (i.e., excludes highest and lowest 25% of students in
terms of months to degree)
Number of months between the top student and the bottom student
in the middle 50%, in terms of time to degree
No PLA credit 5,302 39.7 18.475 341.309 36 25-52 27
1-6 PLA credits 856 37.2 17.508 306.516 33 22-48 26
7-12 PLA credits 771 36.1 17.286 298.794 33 21-46 25
13-24 PLA credits 1,138 33.1 15.469 239.282 30 20-41 21
25-36 PLA credits 632 34.5 15.148 229.464 31 23-43 20
37-48 PLA credits 160 35.8 16.676 278.103 33 23-46 23
49 or more PLA credits 218 29.6 15.379 236.519 25 20-34 14
Table 8. PLA Credit-Earning and Distance From the Mean Months to Degree, Bachelor’s Degree Earners
Time to Degree: Associate’sLooking at only those students in our adjusted sample who earned associate’s degrees, we found that students earning 12 PLA credits or fewer did not appear to have any time advantage, on average, but time to degree does trend downward for students earning 13-36 PLA credits (the number of students earning more than 36 PLA credits is too small to include in the analysis) (Figure 46). (Note: participating institutions required 60-64 credits for an associate’s degree.)
Figure 46. Months to Degree by Number of PLA Credits, Associate’s Degree Earners
44.6
47.4
45.4
40.1
42.9
36.0
38.0
40.0
42.0
44.0
46.0
48.0
No PLA Credit (n=1,906)
1-6 PLA credits (n=230)
7-12 PLA credits (n=176)
13-24 PLA credits (n=78)
25-36 PLA credits (n=55)
Mon
ths
to A
ssoci
ate
's D
eg
ree
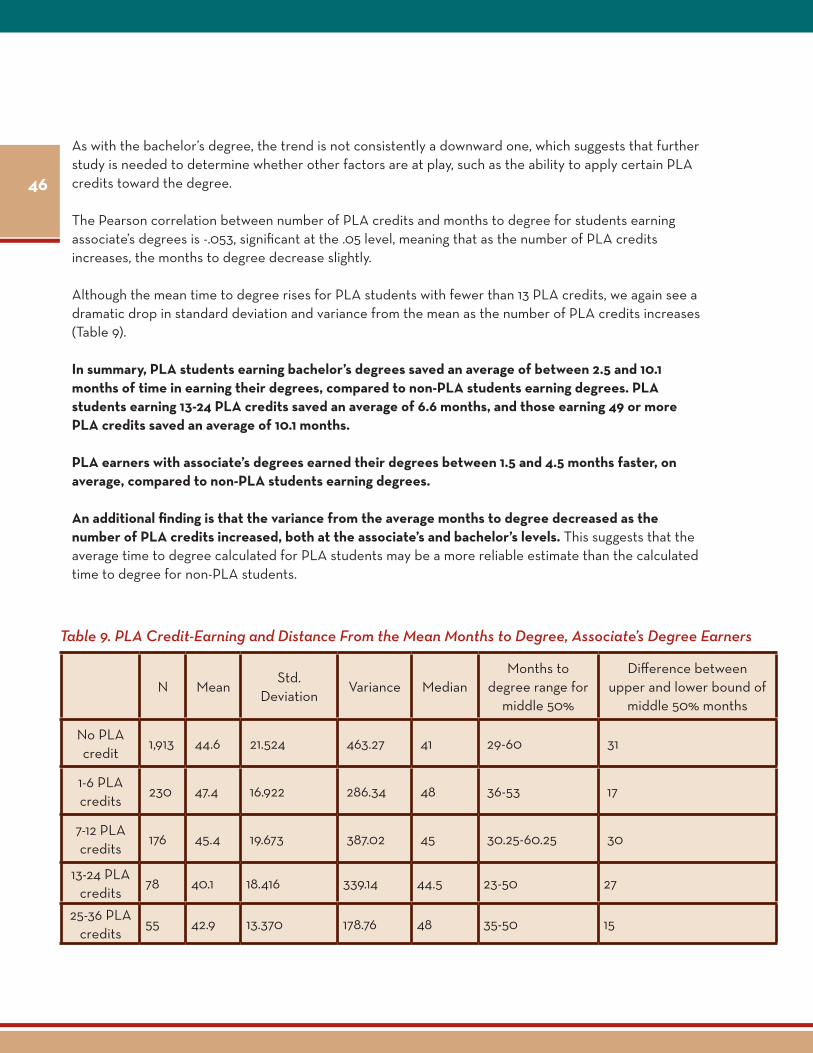
46
Table 9. PLA Credit-Earning and Distance From the Mean Months to Degree, Associate’s Degree Earners
N MeanStd.
DeviationVariance Median
Months to degree range for
middle 50%
Difference between upper and lower bound of
middle 50% months
No PLA credit
1,913 44.6 21.524 463.27 41 29-60 31
1-6 PLA credits
230 47.4 16.922 286.34 48 36-53 17
7-12 PLA credits
176 45.4 19.673 387.02 45 30.25-60.25 30
13-24 PLA credits
78 40.1 18.416 339.14 44.5 23-50 27
25-36 PLA credits
55 42.9 13.370 178.76 48 35-50 15
As with the bachelor’s degree, the trend is not consistently a downward one, which suggests that further study is needed to determine whether other factors are at play, such as the ability to apply certain PLA credits toward the degree.
The Pearson correlation between number of PLA credits and months to degree for students earning associate’s degrees is -.053, significant at the .05 level, meaning that as the number of PLA credits increases, the months to degree decrease slightly.
Although the mean time to degree rises for PLA students with fewer than 13 PLA credits, we again see a dramatic drop in standard deviation and variance from the mean as the number of PLA credits increases (Table 9).
In summary, PLA students earning bachelor’s degrees saved an average of between 2.5 and 10.1 months of time in earning their degrees, compared to non-PLA students earning degrees. PLA students earning 13-24 PLA credits saved an average of 6.6 months, and those earning 49 or more PLA credits saved an average of 10.1 months.
PLA earners with associate’s degrees earned their degrees between 1.5 and 4.5 months faster, on average, compared to non-PLA students earning degrees.
An additional finding is that the variance from the average months to degree decreased as the number of PLA credits increased, both at the associate’s and bachelor’s levels. This suggests that the average time to degree calculated for PLA students may be a more reliable estimate than the calculated time to degree for non-PLA students.

47
N MeanStd.
DeviationVariance Median
Months to degree range for
middle 50%
Difference between upper and lower bound of
middle 50% months
No PLA credit
1,913 44.6 21.524 463.27 41 29-60 31
1-6 PLA credits
230 47.4 16.922 286.34 48 36-53 17
7-12 PLA credits
176 45.4 19.673 387.02 45 30.25-60.25 30
13-24 PLA credits
78 40.1 18.416 339.14 44.5 23-50 27
25-36 PLA credits
55 42.9 13.370 178.76 48 35-50 15
Time to Degree by Institution Control and Size3
In terms of institution control, average time to degree at the bachelor level declined most consistently for PLA students at public and private not-for-profit institutions in our sample. PLA students at private not-for-profit institutions saved an average of 6.5 months with 13-24 PLA credits and 10.1 months with 49 or more PLA credits, while those at public institutions saved an average of 8.6 months with 13-24 PLA credits and 13.5 months with 49 or more PLA credits. The average time to degree was slightly higher
Figure 47. Bachelor’s Time to Degree by Institution Control
No PLA Credit
1-6 PLA credits
7-12 PLA
credits
13-24 PLA
credits
25-36 PLA
credits
37-48 PLA
credits
49 or more PLA
credits
Private For Profit 38.6 38.5 42.3 39.7
Private Not for Profit 37.3 33.0 32.5 30.8 33.7 35.2 27.2
Public 44.1 45.4 37.2 35.5 35.1 35.9 31.6
20.0
25.0
30.0
35.0
40.0
45.0
50.0
Avera
ge M
on
ths
to B
ach
elo
r's
Deg
ree
No PLA Credit
1-6 PLA credits
7-12 PLA credits
13-24 PLA credits
25-36 PLA credits
1,000-4,999 Students (n=3,153) 32.4 31.7 31.1 30.1 33.4
5,000-9,999 Students (n=1,351) 50.1 48.6 38.2 31.4 33.7
10,000-19,999 Students (n=1,887) 42.3 43.7 36.7 36.8 35.0
20,000 or More Students (n=2,537) 41.1 39.3 42.8 40.0 42.1
25.0
30.0
35.0
40.0
45.0
50.0
Avera
ge M
on
ths
to B
ach
elo
r's
Deg
ree
Figure 48. Bachelor’s Time to Degree and Institution Size
for students at public institutions, compared to private not-for-profit institutions, regardless of the number of PLA credits (Figure 47). PLA students at private for-profit institutions, on the other hand, did not experience shorter time to degree. Further study is needed to determine whether this is related to how PLA credits are earned and how they can be applied at those institutions or whether other factors are at play. (Note: there was insufficient data to include students with 25 or more PLA credits at private for-profit institutions.)
In terms of institution size, the average time to degree for students decreased as PLA credits increased at institutions serving 5,000-9,999 students and 10,000-19,999 students. Reduced average time to degree was most striking at institutions serving 5,000-9,999 students; at these institutions, students with 13-24 PLA credits had an average time to degree that was 18.7 months shorter than for students with no PLA credits. The difference was an average of 5.5 months for students at institutions serving 10,000-19,999 students. Only small decreases were evident for students at institutions serving 1,000-4,999 students or 20,000 or more students. However, the students at institutions serving 1,000-4,999 had a much lower average time to degree across the board (Figure 48).
3It was not useful to conduct the time to degree analysis by level of institution. Our sample did not have sufficient student records from two-year institutions to calculate bachelor’s time to degree, and there were similarly small numbers to analyze for associate’s time to degree in four-year institutions.
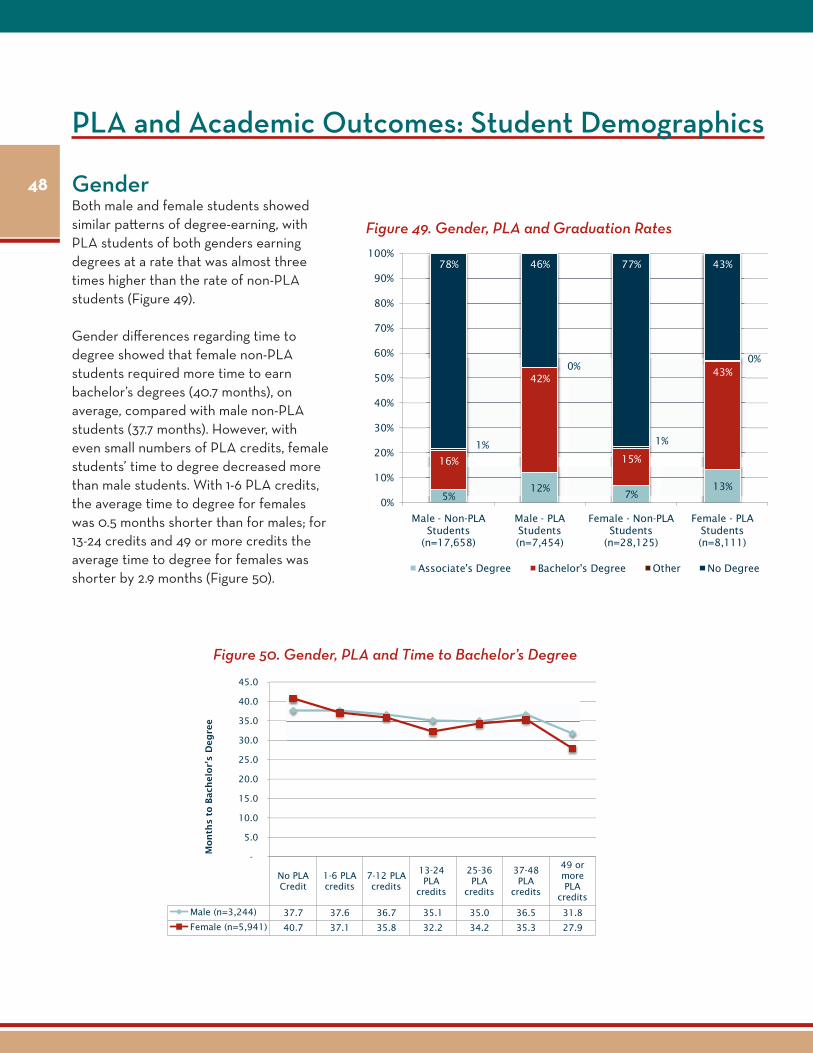
48
PLA and Academic Outcomes: Student Demographics
Figure 49. Gender, PLA and Graduation Rates
GenderBoth male and female students showed similar patterns of degree-earning, with PLA students of both genders earning degrees at a rate that was almost three times higher than the rate of non-PLA students (Figure 49).
Gender differences regarding time to degree showed that female non-PLA students required more time to earn bachelor’s degrees (40.7 months), on average, compared with male non-PLA students (37.7 months). However, with even small numbers of PLA credits, female students’ time to degree decreased more than male students. With 1-6 PLA credits, the average time to degree for females was 0.5 months shorter than for males; for 13-24 credits and 49 or more credits the average time to degree for females was shorter by 2.9 months (Figure 50).
5%12%
7%13%
16%
42%
15%
43%
1%
0%
1%
0%
78% 46% 77% 43%
0%
10%
20%
30%
40%
50%
60%
70%
80%
90%
100%
Male - Non-PLA Students
(n=17,658)
Male - PLA Students (n=7,454)
Female - Non-PLA Students
(n=28,125)
Female - PLA Students (n=8,111)
Associate's Degree Bachelor's Degree Other No Degree
No PLA Credit
1-6 PLA credits
7-12 PLA credits
13-24 PLA
credits
25-36 PLA
credits
37-48 PLA
credits
49 or more PLA
credits
Male (n=3,244) 37.7 37.6 36.7 35.1 35.0 36.5 31.8
Female (n=5,941) 40.7 37.1 35.8 32.2 34.2 35.3 27.9
-
5.0
10.0
15.0
20.0
25.0
30.0
35.0
40.0
45.0
Mo
nth
s to
Bach
elo
r's
Deg
ree
Figure 50. Gender, PLA and Time to Bachelor’s Degree

49
PLA and Academic Outcomes: Student Demographics
No PLA Credit
1-6 PLA credits
7-12 PLA credits
13-24 PLA credits
25-36 PLA credits
Male (n=850) 41.9 47.6 44.9 41.7 45.6
Female (n=1,616) 45.8 47.0 45.6 38.7 37.6
-
5.0
10.0
15.0
20.0
25.0
30.0
35.0
40.0
45.0
50.0
55.0
Mo
nth
s to
Ass
oci
ate
's D
eg
ree
Figure 51. Gender, PLA and Time to Associate’s Degree
Figure 52. Age, PLA and Graduation Rates
7%14%
6%13%
6% 9%3% 7% 5%
12%
15%
38%
17%
45%
16%
52%
11%
54%
11%
50%
1%
0%
1%
0%
1%
0%
1%
0%
1%
0%
78% 48% 76% 43% 78% 39% 85% 38% 84% 38%
0%
10%
20%
30%
40%
50%
60%
70%
80%
90%
100%
Age 25-34, Non-PLA
Students
Age 25-34, PLA
Students
Age 35-44, Non-PLA
Students
Age 35-44, PLA
Students
Age 45-54, Non-PLA
Students
Age 45-54, PLA
Students
Age 55-64, Non-PLA
Students
Age 55-64, PLA
Students
65 or older, Non-
PLA Students
65 or older, PLA Students
Associate's Degree Bachelor's Degree Other No Degree
Similarly, time to associate’s degree for female non-PLA students is longer than male non-PLA students, but most female PLA students required shorter time to earn the associate’s degree, on average, than male PLA students (the exception being women with 7-12 PLA credits) (Figure 51).
AgeLooking at the degree-earning patterns of different age groups, we found that PLA earners in every age group had higher graduation rates than non-PLA students. The difference in graduation rates was highest for those aged 55 and older (54% of PLA students earned bachelor’s degrees, compared to 11% of non-PLA students), but even the youngest learners (aged 25-34) with PLA credit had graduation rates that were more than twice those of non-PLA students in the same age group (38% of PLA students earned bachelor’s degrees, compared to 15% of non-PLA students) (Figure 52).

50
Similarly, while students of all age groups required less time to earn bachelor’s degrees with PLA credits, the greatest time to degree difference was for students aged 55-64 (Figure 53). (Note: The sizes of different subgroups within our sample were not large enough to do this analysis for associate’s degree earners.)
Race/EthnicityWhen examining the graduation rates for PLA students and non-PLA students by race/ethnicity (omitting student data from institutions that could not provide this information), we find that for each racial/ethnic group, graduation rates for PLA students were higher than non-PLA students. The most dramatic difference was for Hispanic students at the bachelor’s degree level; Hispanic PLA students earned bachelor’s degrees at a rate that was almost eight times higher than that of Hispanic non-PLA students (Figure 54). The smallest
Figure 54. Race/Ethnicity, PLA and Graduation Rates: Black, Hispanic and White
No PLA Credit
1-6 PLA credits
7-12 PLA credits
13-24 PLA
credits
25-36 PLA
credits
37-48 PLA
credits
49 or more PLA
credits
25-34 39.0 36.6 36.8 34.3 37.7 35.5 31.2
35-44 39.8 38.2 36.1 33.3 34.9 38.0 28.7
45-54 39.1 33.5 33.3 31.7 32.7 35.2 30.0
55-64 38.4 37.9 38.0 28.7 31.4 24.3 22.4
0.0
5.0
10.0
15.0
20.0
25.0
30.0
35.0
40.0
45.0
Mo
nth
s to
Bach
elo
r's
Deg
ree
Figure 53. Age, PLA and Bachelor’s Time to Degree
9%
16%
6%
17%
10%14%
17%
40%
6%
47%
19%
44%
1%
0%
1%
0%
1%
0%
74% 45% 86% 36% 70% 41%
0%
10%
20%
30%
40%
50%
60%
70%
80%
90%
100%
Black non-Hispanic, Non-PLA
Students
Black non-Hispanic, PLA
Students
Hispanic, Non-PLA Students
Hispanic, PLA Students
White, Non-Hispanic, Non-PLA
Students
White, Non-Hispanic, PLA
Students
Associate's Degree Bachelor's Degree Other No Degree

51
Figure 56. Race/Ethnicity, PLA and Bachelor’s Time to Degree: Black, Hispanic and White
Figure 55. Race/Ethnicity, PLA and Graduation Rates: Native American, Asian, and Other
No PLA Credit
1-6 PLA credits
7-12 PLA credits
13-24 PLA
credits
25-36 PLA
credits
37-48 PLA
credits
49 or more PLA
credits
Black non-Hispanic (n=7,852) 44.4 46.8 34.5 30.2 34.6 37.5 23.1
Hispanic (n=8,109) 37.9 36.0 37.3 32.0 31.6 35.7 24.7
White non-Hispanic (n=24,599) 38.4 35.8 33.7 33.1 34.8 37.1 30.1
0.0
5.0
10.0
15.0
20.0
25.0
30.0
35.0
40.0
45.0
50.0
Mo
nth
s to
Bach
elo
r's
Deg
ree
difference was for Asian/Pacific Islander students; a higher percentage of PLA students in this group earned their degrees than non-PLA students, but the difference was only eight percentage points at the bachelor level and seven percentage points at the associate level (Figure 55).
For time to degree, we had sufficient data to analyze only black, Hispanic and white students at the bachelor level. Decreases in average time to degree were apparent for all three subgroups, with the most dramatic decreases for black PLA students. With 13-24 PLA credits, black PLA students saved an average of 14.2 months for the bachelor’s degree, and with 49 or more PLA credits, they saved an average of 21.3 months (Figure 56).
10% 11%16%
23%
7% 8%
12%
31%
18%
26%
18%
49%
1%
0%
1%
0%
0%
0%
78% 59% 65% 51% 74% 44%
0%
10%
20%
30%
40%
50%
60%
70%
80%
90%
100%
American Indian/Alaska
Native, Non-PLA Students
American Indian/Alaska
Native, LA Students
Asian/Pacific Islander, Non-PLA
Students
Asian/Pacific Islander, PLA
Students
Other, Non-PLA Students
Other, PLA Students
Associate's Degree Bachelor's Degree Other No Degree
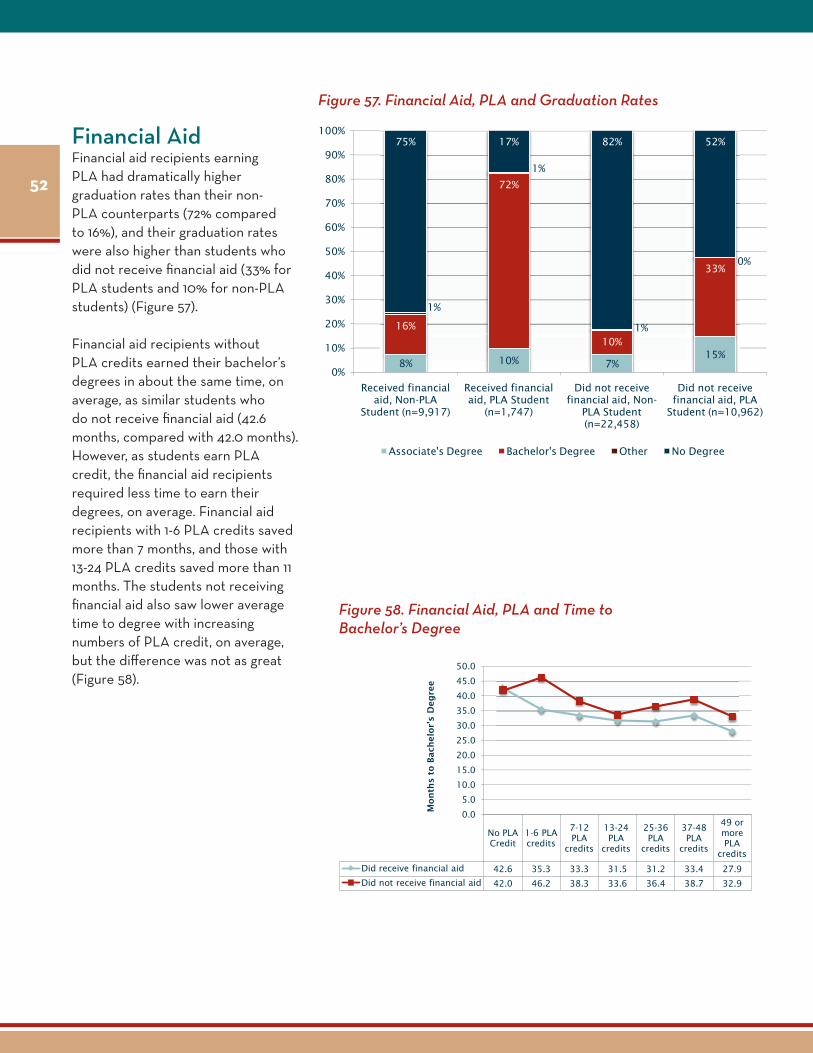
52
Figure 57. Financial Aid, PLA and Graduation Rates
Figure 58. Financial Aid, PLA and Time to Bachelor’s Degree
No PLA Credit
1-6 PLA credits
7-12 PLA
credits
13-24 PLA
credits
25-36 PLA
credits
37-48 PLA
credits
49 or more PLA
credits
Did receive financial aid 42.6 35.3 33.3 31.5 31.2 33.4 27.9
Did not receive financial aid 42.0 46.2 38.3 33.6 36.4 38.7 32.9
0.0
5.0
10.0
15.0
20.0
25.0
30.0
35.0
40.0
45.0
50.0
Mo
nth
s to
Bach
elo
r's
Deg
ree
Financial AidFinancial aid recipients earning PLA had dramatically higher graduation rates than their non-PLA counterparts (72% compared to 16%), and their graduation rates were also higher than students who did not receive financial aid (33% for PLA students and 10% for non-PLA students) (Figure 57).
Financial aid recipients without PLA credits earned their bachelor’s degrees in about the same time, on average, as similar students who do not receive financial aid (42.6 months, compared with 42.0 months). However, as students earn PLA credit, the financial aid recipients required less time to earn their degrees, on average. Financial aid recipients with 1-6 PLA credits saved more than 7 months, and those with 13-24 PLA credits saved more than 11 months. The students not receiving financial aid also saw lower average time to degree with increasing numbers of PLA credit, on average, but the difference was not as great (Figure 58).
8% 10% 7%15%
16%
72%
10%
33%
1%
1%
1%
0%
75% 17% 82% 52%
0%
10%
20%
30%
40%
50%
60%
70%
80%
90%
100%
Received financial aid, Non-PLA
Student (n=9,917)
Received financial aid, PLA Student
(n=1,747)
Did not receive financial aid, Non-
PLA Student (n=22,458)
Did not receive financial aid, PLA
Student (n=10,962)
Associate's Degree Bachelor's Degree Other No Degree

53
17%12% 12%
18%
42%41%
18%
29%
0% 0%
0%
0%
41% 47% 70% 54%
0%
10%
20%
30%
40%
50%
60%
70%
80%
90%
100%
Military service, Non-PLA Student (n=1,478)
Military service, PLA Student (n=3,598)
No military service, Non-PLA
Student (n=5,414)
No military service, Non-PLA
Student (n=4,907)
Associate's Degree Bachelor's Degree Other No Degree
Figure 59. Military Status, PLA and Graduation Rates
Figure 60. Military Status, PLA and Bachelor’s Time to Degree
MilitaryWe also examined the outcomes of PLA by military status, looking only at the data provided by a total of twelve institutions that track military status for all students. This number was further reduced to eight institutions after omitting data from institutions that could not provide the number of PLA credits or that had no PLA credit limits. The final sub-sample of students for whom military status was known was primarily comprised of students from two larger institutions that focus on non-traditional populations.
The data showed that students who identify as military (e.g., active, reserves, veterans, etc.) and who earned PLA credit did not have higher graduation rates than their non-PLA counterparts. In fact, the graduation rate was lower for those earning PLA credit (Figure 59). Note: this unusual outcome is likely explained by specific institutional factors at the two institutions that are heavily represented in the military sub-sample (e.g., multiple interventions that benefit adults, whether they earn PLA credit or not). A similar pattern of graduation rates among PLA vs. non-PLA students was found at one of those larger institutions.
No PLA Credit
1-6 PLA credits
7-12 PLA credits
13-24 PLA
credits
25-36 PLA
credits
Military service 30.0 38.1 36.8 31.4 40.7
No military service 38.3 34.3 31.7 30.7 31.9
-
5.0
10.0
15.0
20.0
25.0
30.0
35.0
40.0
45.0
Mo
nth
s to
Bach
elo
r's
Deg
ree
Similarly, military students earning PLA credit did not have shorter time to degree, on average, at the bachelor level. Non-military students, on the other hand, did show shorter time to degree with increasing numbers of PLA credit, on average (Figure 60). Note: this outcome is also likely due to the problems with the sample as explained above. Time to degree patterns of all students at the institutions that are heavily represented in the military sub-sample are similar to those of the military sub-sample.

54
PLA, Academic Outcomes and Institutional PoliciesAn important question is whether PLA students’ academic outcomes differ depending upon an institution’s PLA policies and practices. For example, a student may be able to earn 30 PLA credits from an institution, yet only be able to use those credits for elective courses and not for fulfilling requirements for the major.
We examined four institutional policies that we would expect to have the greatest impact on a student’s progress towards degree completion and a reduced time to degree:
f PLA credit can be used to obtain advanced standing at the institution
f PLA credit can be used to waive course prerequisites
f PLA credit can be used to meet general education requirements
f PLA credit can be used to meet program/major requirements
Graduation Rates and PLA Policies In examining the graduation rates of PLA students in the context of specific PLA program policies, we found that some of those policies were associated with higher graduation rates for PLA students. At institutions where PLA credit can be used to obtain advanced standing, PLA students’ bachelor’s degree-earning rates were four times that of non-PLA students (56% versus 13%), while at institutions where PLA cannot be used to obtain advanced standing, the difference was only five percentage points (32% versus 27%).
Similarly, at institutions where PLA credit can apply to course prerequisites, the bachelor’s degree-earning was more than three times higher for PLA students than for non-PLA students (42% versus 13%); at institutions where PLA credit cannot be applied to course prerequisites, PLA students had higher bachelor’s degree rates, but the difference compared to non-PLA students was not as great (45% versus 19%) (Figure 61).
9%16%
6% 9%1% 3%
9%17%
27%
32%
13%
56%
19%
45%
13%
42%
1%
0%
1%
0%
0%
0%
1%
0%
63% 52% 81% 35% 80% 52% 77% 40%
0%
10%
20%
30%
40%
50%
60%
70%
80%
90%
100%
non
-PLA
Stu
den
ts
PLA
Stu
dents
non
-PLA
Stu
den
ts
PLA
Stu
dents
non
-PLA
Stu
den
ts
PLA
Stu
dents
non
-PLA
Stu
den
ts
PLA
Stu
dents
Not used for advanced standing
Used for advanced standing Not used to waive prerequisites
Used to waive course prerequisites
No Degree
Other
Bachelor's
Associate's
Figure 61. Graduation Rates and PLA by Institutional Policies: Using PLA to Obtain Advanced Standing, Using PLA to Waive Course Prerequisites

55
Figure 62. Graduation Rates and PLA by Institution Policies: Using PLA for General Education Requirements, Using PLA for Major Requirements
1% 2%7%
13%
2% 3%7%
14%
22%
79%
15%
41%
22%
77%
14%
39%
1%
0%
1%
0%
0%
0%
1%
0%
76% 19% 78% 46% 76% 20% 78% 47%
0%
10%
20%
30%
40%
50%
60%
70%
80%
90%
100%
non-PLA Students
PLA Students non-PLA Students
PLA Students non-PLA Students
PLA Students non-PLA Students
PLA Students
Not used for general ed requirements
Used for general ed requirements
Not used for major requirements
Used for major requirements
Associate's Bachelor's Other No Degree
The other two policies we examined – one pertaining to the ability to use PLA for general education requirements, the other allowing PLA to apply to requirements in the major – did not show the same kinds of dramatic differences between PLA students’ graduation rates and those of non-PLA students (Figure 62). (It should be noted that only 3,298 students in our sample attended institutions that did not permit use of PLA for general education credits.)
When looking at these four institutional policies in combination, however, we see that PLA students attending institutions that offer the greatest flexibility in the use of PLA credit (in other words, the institutions have all four of these target policies in place) outperformed their non-PLA counterparts in terms of bachelor’s degree-earning by the highest margin (58% compared to 12%), compared to students attending institutions with only one, two or three of these policies in place (Figure 63). (Note: only 944 students in our sample attended institutions that only had one of these policies in place.)
3%8%
17%
8%
14%
44%
80%
26%
54%
11%
28%
12%
58%
0%
0%
0%
0%
1%
0%
1%
1%
56% 20% 73% 42% 81% 55% 79% 27%
0%
10%
20%
30%
40%
50%
60%
70%
80%
90%
100%
non-PLA Students
PLA Students non-PLA Students
PLA Students non-PLA Students
PLA Students non-PLA Students
PLA Students
1 target policy 2 target policies 3 target policies 4 target policies
No Degree Other Bachelor's Associate's
Figure 63. Graduation Rates and PLA, by Number of Target Policies Institution Has in Place

56
Time to Degree and PLA PoliciesIn terms of time to degree, the presence or absence of individual PLA policies did not matter. For each of the four program policies examined individually, we found that students had shorter average time to degree as the number of PLA credits increased, regardless of whether their institution has that individual policy or not.
However, the picture changed when examining the student records according to the number of ways in which they can apply PLA credit. At institutions offering the greatest flexibility in how PLA credit can be applied – institutions with three or four of the four target policies in place – there was a dramatic difference in time savings for PLA students. Students earning 13-24 PLA credits saved, on average, 8.4 to 15.4 months, compared to students with no PLA credit. Students with 13-24 PLA credits at institutions offering only one or two of the target policies experienced a smaller reduction in the time to degree (an average of 6.4 months and .8 months, respectively); however, the non-PLA students at those institutions already had a lower average time to degree, compared to students at institutions offering more ways to apply PLA credit (Figure 64). These data suggest that offering multiple ways to apply PLA credit in a curriculum may help students use those credits to make more significant progress towards their degrees.
Figure 64. Time to Degree and PLA, by Number of Target Policies Institution Has in Place
No PLA Credit
1-6 PLA credits
7-12 PLA
credits
13-24 PLA
credits
25-36 PLA
credits
1 target policy 36.6 28.2 30.5 30.2
2 target policies 36.9 37.6 39.0 36.1 35.9
3 target policies 45.1 40.1 32.7 29.7 33.5
4 target policies 41.7 36.6 35.1 33.3 35.0
20.0
25.0
30.0
35.0
40.0
45.0
50.0

57
Summary and DiscussionThe data from the 48 postsecondary institutions in our study show that PLA students had better academic outcomes, particularly in terms of graduation rates and persistence, than non-PLA adult students. Many PLA students also shortened the time required to earn a degree; the average time to degree decreased as the number of PLA credits earned increased.
The most consistent and striking finding was the difference in graduation rates of PLA students compared with students who did not earn PLA credit. Across all students from all institutions, we found that after seven years, twice as many PLA students had earned postsecondary degrees as had non-PLA students. When looking at various student subgroups, and at students from different types of institutions, we found PLA student graduation rates that were sometimes three or four times higher than non-PLA students.
In addition, we found that the non-degree-earning students with PLA credit had greater persistence than similar students without PLA credit during the seven-year period. We care about these non-degree-earning students because they are the ones for whom institutions are designing and implementing new interventions to help them be successful and earn degrees. In our study, non-degree-earning PLA students had a higher rate of re-enrollment from year to year, and earned more credits toward their degrees, on average, compared with non-PLA students. These findings suggest that students with PLA credits may need minimal interventions in order to be successful – in many instances, all they may need is a little more time. An additional persistence finding that may be of particular interest to institutions is that, on average, PLA students earn more credits through institutional coursework than do non-PLA students.
The average time to degree for PLA students in our study was shorter than for non-PLA students, particularly at the bachelor degree level, and the data showed that time to degree was negatively correlated with PLA credits. In other words, the more PLA credits a student had, the shorter the average time to degree. The data showed similar patterns at the associate’s level, though the downward time to degree was not as steep of a slope, compared to bachelor’s degree-earners. Further study of the relationship between PLA-earning and time to degree is needed, particularly exploring questions about PLA policies at the associate’s level. With fewer overall credits required for the associate’s degree, there may be fewer elective credits, for example, toward which PLA credit might be applied. While associate’s degree-earning rates for PLA students are higher than students without PLA, it may be a bigger challenge to bring down the time to degree in as dramatic a way.
Considering the above findings, an important question is why we are seeing better academic outcomes for PLA students compared with non-PLA students. One possible explanation is that students who pursue PLA credit are the students who are already highly motivated or academically successful, and that motivation and academic strength are what are propelling the students forward to a degree. Some of the PLA administrators we interviewed acknowledged that this can often be the case. However, these same administrators also described PLA itself as a powerful motivator, as a booster of self-esteem and self-confidence by validating students’ existing skills and knowledge, and as something that enhances student and alumni loyalty to the institution. These observations suggest that the argument of “PLA students are the smart ones to begin with” does not tell the whole story, especially when our data showed that academic ability did not matter. Remedial students with PLA credit had better graduations rates than their non-PLA counterparts, as did PLA students of varying GPA levels.

58
A few additional comments about the outcomes for different groups of institutions and students:
fWhen we look at PLA student outcomes in different institutional contexts, we see that in all settings PLA students have higher graduation rates than non-PLA students. Regarding institution control, we found that PLA students at public institutions had both higher graduation rates and shorter time to degree than the non-PLA students at those institutions. However, both groups of students at public institutions had lower graduation rates and longer time to degree compared with their counterparts at the other types of institutions. Therefore, while the “PLA differential” appears to be greatest at public institutions, all students at other types of institutions had better graduation rates (and students at private non-profits had shorter average time to degree), regardless of how many PLA credits were earned. Also inviting further study are the findings that students at private for-profits do not see shorter time to degree with PLA credit, and that PLA students at private non-profits do not see great differences in graduation rates compared with non-PLA students.
Further, we found that the small institutions (those serving 1,000 to 4,999 students) had similar patterns for PLA students as were found at all private non-profits. PLA students at both small institutions and at non-profits have higher graduation rates than non-PLA students, but not by large margins. Similarly, the time to degree difference for PLA students at these institutions is not very great, compared to the PLA students at other types of institutions. However, on average, all students at small institutions and at non-profit institutions have shorter time to degree, compared with the students at larger institutions, public institutions, and for-profit institutions. Future research might examine what else is happening at these smaller institutions and non-profit institutions in terms of advising, individual assistance, flexible policies that address the needs of adult students, and other policies and practices that might be working to help all students at those institutions achieve better academic outcomes.
f In terms of different student demographic characteristics, of particular interest is the finding that there is little gender difference for PLA students in terms of graduation rates. However, female PLA students shortened their time to degree more than did male PLA students. Analyzing outcomes by the age of the students, meanwhile, showed that even though a very small percentage of PLA students are over age 55, this cohort showed the greatest differences in graduation rate and in time to degree for PLA students. One possible explanation that may account for this may be that older students generally have fewer family responsibilities that impede their progress than do younger adult students; those aged 25-54 are more likely to have young dependents at home whose demands can interrupt the studies of even the most dedicated learners.
In looking at the findings for the different racial/ethnic groups, we see that even though only a small proportion of Hispanic students earned PLA credit, those who did had dramatically higher graduation rates. In addition, both Hispanic and black, non-Hispanic students saw dramatic reductions in average time to degree with increasing numbers of PLA credit, compared with white, non-Hispanic students. The students in these two groups may not all be from disadvantaged populations, but it is likely that some portion of them are. Taken with some of the other findings – such as the fact that financial aid recipients with PLA credit and remedial students with PLA credit also had higher graduation rates – the impressive outcomes of the minority students with PLA credit suggest that PLA could be a potentially important strategy for helping disadvantaged adult populations succeed in postsecondary institutions.

59
One somewhat puzzling finding was that PLA students with military status did not have higher graduation rates than non-PLA students with military status – the lone exception to our otherwise consistent findings of higher graduation rates for PLA students. The explanation for this likely is due to the fact that the sample is comprised primarily of students at two institutions. These two institutions’ overall graduation rate and time to degree patterns for all students were similar to those of the sub-sample, suggesting that institutional factors – and not military student characteristics – are shaping the outcomes we see. The two institutions have a long history of serving non-traditional student populations and may have a variety of services and programs that help adult achieve better outcomes, thus blunting any “PLA effect” that might otherwise exist.
Despite the fact that the problems with our military sub-sample prevent us from knowing about the outcomes of military students at a range of institutions, we did learn through our interviews that military students’ use of PLA could be expanded beyond current offerings. For example, one PLA administrator explained that at her institution, much of the military training that is evaluated for PLA credit results in technical course credits that cannot be applied to many degrees at four-year institutions. To some extent, she explained, this may be because of the institutional reliance on ACE guides to evaluate what is learned in the military, when perhaps a portfolio evaluation or other method could capture broader skills gained from military experience, such as leadership or other non-technical learning that is more in line with courses at four-year institutions. An additional challenge is that many military students may be earning PLA credit that can only apply to elective credits at certain institutions. The result would therefore be a student who earns a lot of PLA credit but who is not much closer to earning his or her degree. If this proves to be the case in further research, institutions seeking to serve military students may want to assess whether they could do so through the development of degree programs (perhaps applied baccalaureate degrees) that acknowledge more of and strategically augment these students’ prior learning.
As we have noted throughout this report, we did not have access to the kind of data that would allow us to control for some of the factors that have been proven to influence better academic outcomes for adult students. This limitation prevents us from going so far as to say that our data prove that PLA credit-earning has an impact on student outcomes. However, previous research that has examined the relationship between PLA and student outcomes in single institutions has been able to control for many of those factors. The fact that this larger study shows similar patterns of higher graduation rates and other academic success factors for PLA students is an important complement to that research and suggests that a “PLA effect” exists across a range of institutional contexts and with diverse student populations.

60
ConclusionThe findings – that PLA students had better academic outcomes than non-PLA students – support claims that PLA is a strategy that will help adults earn degrees and progress more quickly to their goals. In addition, institutional advocates for PLA will be gratified to learn that PLA students had better patterns of re-enrollment and, on average, higher numbers of credit hours that are earned at the institution. The benefits of PLA to the institution are clear. The student data, as well as administrators’ observations that PLA helps draw in many adults who would otherwise not consider going to school, and that PLA builds the loyalty of students and alumni to the institution, all point to institutional benefits.
Certainly questions remain about the precise nature of the relationship between PLA credit-earning and better academic outcomes. Do PLA students have higher graduation rates because PLA enhances the self-esteem and motivation of students by showing them that they have already mastered college-level learning? Is it also because PLA students already possess characteristics that are associated with better academic outcomes? What institutional policies are influencing whether and how students are using (or not using) PLA, and whether or not this helps them achieve a shorter time to degree? More individual- and cross-institutional research on PLA, both qualitative and quantitative, can begin to explore the answers to these and other critical questions.
In this study, we learned how the institutions view PLA and why they offer it, but readers may well feel the absence of the perspective of the adult learner. It would be helpful to learn more from PLA students on: how they view PLA, what they think of the assessment process (i.e., its fairness, strengths and limitations) what they may have learned from it, and whether they believe that earning PLA credit had a motivating effect for them.
The findings of this report demonstrate the value of PLA to adult students who pursue postsecondary degrees. These findings are important particularly as the U.S. strives to improve educational attainment and reachLumina’s goal of having 60 percent of the population with a college credential by 2025, as we seek to make better connections between the academy and the larger society, and as educators strive to rethink and reform systems that need to more effectively respond to the personal, academic and professional needs of our citizens. This kind of data, showing the current patterns of academic outcomes among PLA students, has never been collected on this scale before. We hope that it contributes to deeper thinking about the value of PLA, further program development in Prior Learning Assessment, and to the expansion of its availability and offerings across the U.S.

61
ReferencesAarts, Sandra, Deborah Blower, and Roberta Burke, eds. 1999. A slice of the iceberg: Cross-Canada study
on prior learning assessment and recognition. Cross-Canada Partnership on PLAR. http://www.recognitionforlearning.ca/pdf/Study_I_Start.pdf (accessed March 2, 2009).
Adelman, Clifford. 1999. Answers in the tool box: academic intensity, attendance patterns, and bachelor's degree attainment. Washington, DC: U.S. Department of Education.
Billingham, Carol J. and Joseph Travaglini. 1981. Predicting adult academic success in an undergraduate program. Alternative Higher Education. 5 (3). : 169-182.
Boornazian, S. 1994. Prior learning assessment using story: Academic access for underserved populations. PhD diss., Union Institute, New York.
Burris, J. 1997. The adult undergraduate’s experience of portfolio development: A multiple case study. PhD diss., University of Texas.
Dagavarian, Debra A. and William M. Walters. 1993. Outcomes assessment of prior learning assessment programs. In In support of prior learning assessment and outcomes assessment of prior learning assessment programs, ed. Debra A. Dagavarian, 3-8. Princeton: Proceedings of the National Institute on the Assessment of Experiential Learning.
Fiddler, M., C. Marienau, and U. Whitaker. 2006. Assessing learning: Standards, principles, and procedures (2nd ed.). Chicago: CAEL.
Fisher, V. 1991. An institutional evaluation of perceptions and expectations of a portfolio assessment program (life experience). PhD diss., Columbia University Teachers College.
Fitzgibbon, John. 2002. Assessment of PLA student success: retrospective study. Victoria, BC. The Centre for Education Information (CEISS) for the Centre for Curriculum, Transfer and Technology. http://www.aved.gov.bc.ca/pla/05_Assessment_Student_Success.pdf (accessed October 23, 2009).
Freers, S. 1994. An evaluation of adult learners’ perceptions of a community college’s assessment of prior learning program. PhD diss., Pepperdine University.
Hoffman, Theresa, Jay LeMaster, and Susan Flickinger. 1996. The effectiveness of the EXCEL program in supporting efficient learning for adults. Study of UMUC’s prior learning program linking UMUC’s best practices in PLA to student retention to their degree. University of Maryland University College. Provided to the author by Theresa Hoffman.
LeGrow, Maryanne R., Barry G. Sheckley, and Marijke Kehrhahn. 2002. Comparison of problem-solving performance between adults receiving credit via assessment of prior learning and adults completing classroom courses. Journal of Continuing Higher Education, 50 (3) : 2-13, Fall 2002.
Pearson, Walter Stephen. 2000. Enhancing adult student persistence: The relationship between prior learning assessment and persistence toward the baccalaureate degree. PhD diss., Iowa State University.
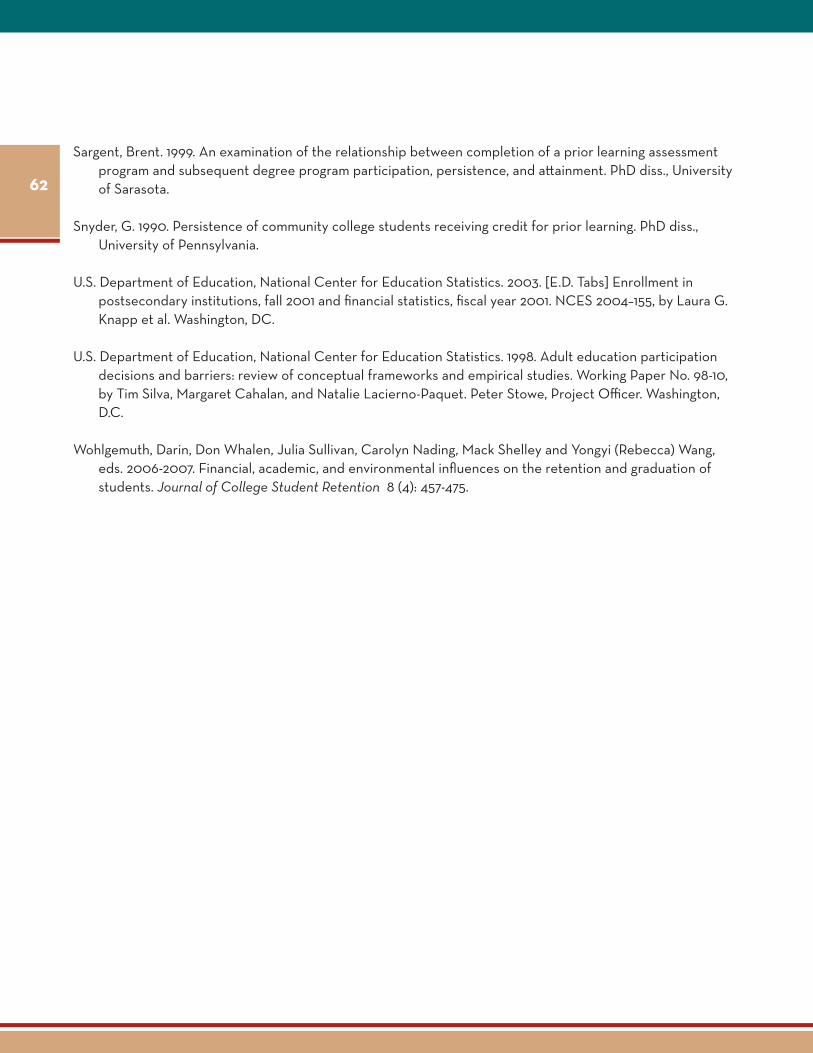
62
Sargent, Brent. 1999. An examination of the relationship between completion of a prior learning assessment program and subsequent degree program participation, persistence, and attainment. PhD diss., University of Sarasota.
Snyder, G. 1990. Persistence of community college students receiving credit for prior learning. PhD diss., University of Pennsylvania.
U.S. Department of Education, National Center for Education Statistics. 2003. [E.D. Tabs] Enrollment in postsecondary institutions, fall 2001 and financial statistics, fiscal year 2001. NCES 2004–155, by Laura G. Knapp et al. Washington, DC.
U.S. Department of Education, National Center for Education Statistics. 1998. Adult education participation decisions and barriers: review of conceptual frameworks and empirical studies. Working Paper No. 98-10, by Tim Silva, Margaret Cahalan, and Natalie Lacierno-Paquet. Peter Stowe, Project Officer. Washington, D.C.
Wohlgemuth, Darin, Don Whalen, Julia Sullivan, Carolyn Nading, Mack Shelley and Yongyi (Rebecca) Wang, eds. 2006-2007. Financial, academic, and environmental influences on the retention and graduation of students. Journal of College Student Retention 8 (4): 457-475.

63
Appendix A: Participating InstitutionsAthabasca University (Canada)Azusa Pacific UniversityBarry UniversityBucks County Community CollegeCalifornia Lutheran UniversityCalumet College of St. JosephCapella UniversityCentenary CollegeCharter Oak State CollegeCUNY Baccalaureate for Unique and Interdisciplinary StudiesCUNY - Medgar Evers College of the City University of New YorkDePaul UniversityEastern Connecticut State UniversityEastern Illinois UniversityEastern Kentucky UniversityEmpire State CollegeExcelsior CollegeGolden Gate UniversityHoughton CollegeIndiana University School of Continuing StudiesInver Hills Community CollegeLakeshore Technical CollegeManhattan Christian CollegeMaryville UniversityMiami Dade College Mid-America Christian UniversityNational-Louis UniversityNew York University—SCPS—Paul McGhee DivisionNorthern Kentucky UniversityNorthern Oklahoma CollegeNorthwood UniversityOttawa UniversityPalm Beach Atlantic UniversityPennsylvania State UniversitySaint Mary-of-the-Woods CollegeSimpson CollegeSt. Edward's UniversitySuffolk County Community CollegeThe College of New RochelleThomas Edison State CollegeUniversity of Arkansas - Fort SmithUniversity of Louisville, College of Education and Human DevelopmentUniversity of PhoenixUniversity of St. FrancisUniversity of the Fraser Valley (Canada)University of the Incarnate WordVermont State Colleges/Community College of VermontWebster University

64
Appendix B: Interview SubjectsMonica Flint, Coordinator, Experiential Learning Career ServicesBucks County Community College
Sara Leiste, PLA Coordinator, Learning Management Support and AdministrationCapella University
Nan L. Travers, Ph.D., Director of Collegewide Academic ReviewAmanda H. Treadwell, Senior Academic Review SpecialistEmpire State College
Frank DiSilvestro, Chair and Associate Professor of Adult EducationSheryl Lentz, Administrative Services CoordinatorSchool of Continuing StudiesIndiana University
Martha Kudak, Director/Chair, ASAP (Adult Success through Accelerated Programs)Inver Hills Community College
Gale E. Gibson, Dean & ProfessorCollege of Freshman StudiesMedgar Evers College
Victoria Culbreth, Executive Director, Educational OutreachNorthern Kentucky University
Elza Dinwiddie-Boyd, DeanSchool of New ResourcesThe College of New Rochelle
Gwen Hagemeyer, Director of Woods External Degree ProgramDottie King, Vice President of Academic AffairsSt. Mary-in-the-Woods College

65
Appendix C: Methodology Project SummaryThe Council for Adult and Experiential Learning (CAEL) conducted a research study in 2009 examining the academic outcomes of students who earn prior learning assessment (PLA) credit. The study examined student record data from 48 colleges and universities. Subjects were from the cohort of adult students (defined as all students aged 25 or above) who matriculated at these institutions in 2001-2002. The study followed their academic progress over the course of seven years at these institutions in terms of earned degrees, persistence and time to degree. The study was supported by a grant from Lumina Foundation for Education.
Advisory GroupThe project and methodology were designed by CAEL staff in consultation with a group of external advisors listed below:
Cheryl Blanco, Southern Regional Education BoardTim Donovan, Community College of VermontPeter Ewell, National Center for Higher Education Management Systems (NCHEMS)Morris Fiddler, DePaul School for New LearningAriel Foster, The College BoardMaryBeth Lakin, ACEAlan Mandell, Empire State CollegeBarry Sheckley, University of ConnecticutLiz Tice, Ashford UniversityHenry Van Zyl, Thomas Edison State College
A group of these advisors met at CAEL’s Chicago office in January 2009 to review the research questions and overall methodology, including selection criteria for participating institutions. Those advisors who were not able to attend in person participated in a conference call on these same topics later that month. The research design and methodology were developed based on those discussions, as well as additional written feedback from the advisors on early written drafts.
Institutions in the StudyCAEL issued an invitation in April 2009 to postsecondary institutions that have offered PLA since 2001 to participate in the study. The invitation was sent electronically to CAEL institutional members, institutions which had responded to CAEL’s 2005-2006 institutional survey on PLA policies and practices, and institutions on the mailing list of Thomas Edison State College’s National Institute on the Assessment of Adult Learning. Information requested in the applications included:
fHow long the institution had offered PLA
fWhether the institution offered portfolio assessments as one of its PLA methods
fHow many adult students were enrolled in 2001-2002
fHow many adult students earned PLA credit in 2001-2002
fHow many adult students earned portfolio PLA credit in 2001-2002
fHow the institution ensures the quality of its PLA program
66
CAEL received a total of 66 applications from colleges and universities interested in participating in this study. In selecting the institutions for the study, an internal CAEL committee required that the PLA program be operational by 2001. Additional selection considerations included a strong adherence to quality standards for the PLA program, a good mix of PLA-earners and non-PLA earners in 2001-2002 (for the purposes of comparing these two subgroups), and a minimum of at least 25 PLA earners in 2001-2002. CAEL also strived to achieve a balance of institutional characteristics such as size, geographic location, control (public vs. private), and level (two-year vs. four-year). This data was obtained from the National Center for Education Statistics, Integrated Postsecondary Education Data System (IPEDS); data was from 2001 or 2002, the starting time period of the student cohort this study is examining.
We also considered whether the institution offered the portfolio assessment method of PLA. CAEL has a preference for the portfolio-based method because of our belief in that method’s ability to engage the student in the learning process and require reflection on the learning that was done; this preference was shared by several of our national advisors. However, we did not ultimately require this method of PLA as a necessary condition for inclusion in the study.
Research QuestionsThe main questions that we expected to answer in this study were the following:
fDo adult PLA credit-earners have better persistence, compared with non-PLA credit-earners?
fDo they have higher graduation rates?
fDo they earn their degrees in a shorter time?
In addition to answering the above questions, the research study would also report on the wide range of approaches that the different institutions participating in the study take toward PLA.
Questions This Study Will Not AnswerFrom the start of the project, we acknowledged that there were limitations on what this study could or would cover. For example:
f This study could not show whether PLA credit can be a predictor of positive student outcomes. Too many other factors are involved that cannot be measured or are difficult to collect in a standardized way (e.g., goal orientation, motivation, academic strength, organizational skills, social support network, financial resources, family responsibilities, etc.).
f This study would not evaluate the quality of the PLA programs in question.
f This study could not evaluate other benefits of PLA, such as the learning outcomes that portfolio-based assessments purportedly produce for the individual student (e.g., engagement in the learning process, understanding of the learning process, etc.).
f This study would not examine whether better educational outcomes are associated with one PLA method compared with another. For example, many advocates of portfolio-based assessments believe that the portfolio process itself is instructional and helps the student engage more strongly with the institution and their educational journeys (and thus may have direct transferability to their success in their postsecondary studies). Nevertheless, this research project treated all PLA credit equally.

67
Student Record Data CollectedCAEL collected the following data from each of the participating institutions, for all undergraduate students age 25 or older who matriculated during the 2001-2002 school year; this group included both transfer students and first-time students.
fMatriculation data
fDegree goal and credits needed for that degree (where available)
fNumber of transfer credits from other institutions
fNumber of PLA credits accepted as transfer credits
fNumber of PLA credits earned through 2008
fNumber of PLA credits earned through 2008 by PLA method (where possible)
fNumber of non-PLA credits earned through 2008, total and by school year
fDegrees earned
fDate degree earned
fCumulative GPA
f Student demographics: gender, race/ethnicity, age at matriculation
f Financial aid status
fMilitary status
CAEL also requested information on remedial or developmental credits earned post enrollment, ESL credits earned post enrollment, and GED, SAT, and Compass/ACCUPLACER scores. However, not enough of the institutions were able to provide consistent data to permit analysis that included these variables.
Institutional Data CollectedCAEL also considered institutional-level data. Institutional data collected from IPEDs included:
f Size of institution
fControl (public, private, non-profit)
f Level (two-year, four-year)
fGeographic region
fDegree of urbanization
f Student demographics in 2002 (e.g, % women, % white, % adult, etc.)
Supplementing that data was information that CAEL collected from the institution directly through a survey: fNumber of credits typically required for an associate’s degree
fNumber of credits typically required for a bachelor’s degree
f Reasons for offering PLA
fWays in which PLA can be used (e.g., to waive prerequisite requirements, meet general education requirements, meet elective requirements, etc.)
f Level of courses to which PLA credit may be applied
f Fees for PLA assessments and posting credits to transcript
68
fHow the institution informs its students about PLA
fMethods of advising students regarding PLA
fWhether/how the institution regularly analyzes the use and impact of PLA
f Availability of adult-focused programs and services
fWhether the institution has a separate program or department for adult students
fHow the institution defines student success
Finally, CAEL interviewed nine of the participating institutions in December 2009 to capture more of their perspectives on the value of PLA to students and the institution, challenges in administering their PLA programs, and reactions to preliminary findings. The interview subjects were chosen to represent a diversity of institutions and PLA programs.
Data AnalysisCAEL combined the datasets of all participating institutions, and merged them with the institutional data collected from IPEDS and with the data on PLA policies and practices. With this combined dataset, CAEL carried out the following analysis:
f PLA Participants vs. non-PLA Participants. CAEL compared the characteristics of two student populations: adult students who have earned PLA credit and adult students who have not. We compare descriptive statistics for these populations, looking at how they differed in terms of demographics (age, race/ethnicity, gender, military service if known) and student enrollment patterns (first time students vs. transfer). We defined PLA-earners as any student with PLA credit from transfer or from the following assessment methods:
f Standardized exams (e.g., CLEP, DSST, Excelsior)
f ACE-evaluated corporate training programs
f ACE-evaluated military training programs
f Institutionally-evaluated training programs
f Institutional challenge exams
f Portfolio assessments
Some institutions in our study do not track PLA credit separately from transfer credit electronically; these institutions did, however, go through student transcripts manually and indicated in their database a PLA-earner from a non-PLA earner. However, this manual solution necessitated that these institutions’ students be excluded from any analysis that considered the number of PLA credits (e.g., time to degree calculations based on the number of PLA credits). Many institutions were able to provide not only the number of PLA credits earned (separate from transfer credits), but were also able to provide the number of credits for specific PLA methods (e.g., exam-based assessments, portfolio assessments, etc.).
In our analysis, we treated almost all institutional datasets equally, without weighting. The one exception to this choice not to manipulate the size of the institutional samples was for one institution whose sample was so large that it would have comprised more than half of the overall total student records in the study. For that institution, we took a random ten percent sample to

69
bring that institution’s sample size down to be comparable to the next largest sample size. The random sample’s summary student characteristics (gender, age, race/ethnicity) and academic record (number of transfer credits, PLA credit-earning ratio, graduation rate and time to degree) reflected those in the institution’s full dataset. The final dataset therefore describes students’ experiences across 48 institutions in a way that allows a diversity of institutional contexts to be visible in the results.
f Academic Outcomes. A second level of analysis looked at the academic outcomes of the two student populations: persistence toward a degree, degree-earning, and time to degree. Where possible, we also examined these outcomes by different institutional characteristics/factors, such as: size of institution, level, control, and PLA policies.
CAEL experimented with 5 different definitions of persistence:1. Total credit accumulation toward a degree (highest persistence score is earning
associate’s or bachelor’s degree; lower scores on a scale of percent of credits earned toward degree indicated as the student’s goal)
2. Same as the above, but including only the credit earned at the institution (in other words, omitting all PLA and transfer credit)
3. Number of years in which credit is earned, with no preference to consecutive years of credit earning (again, highest persistence score is earning associate’s or bachelor’s degree)
4. Number of consecutive years in which credit is earned (again, highest persistence score is earning associate’s or bachelor’s degree)
5. Combination of credit accumulation and number of years in which credit is earned, with no preference to consecutive years of credit-earning (again, highest persistence score is earning associate’s or bachelor’s degree)
Two institutions were omitted from the analysis of persistence because they were unable to provide annual credit-earning data.
CAEL also examined various levels of degree-earning: associate’s degree, bachelor’s degree, other (institutionally-defined, but assumed to include transfer to other institution or earning of a short-term certificate or other credential).
Finally, we calculated the number of months between matriculation and degree-earning, where applicable in order to examine time to degree. We omitted from this analysis students from ten institutions that did not have policies that limited the number of PLA credits that can be applied toward a degree, as we were concerned that such data could skew the results. In addition, we excluded students attending three institutions that could not provide the number of PLA credits earned.4 One institution met both criteria, so a total of twelve institutions were excluded from the analysis.
4Some institutions do not track PLA credit electronically and therefore had to determine through paper records whether a student earned PLA credit. For these institutions, we accepted yes/no for PLA credit-earning rather than specific numbers of credit in order to facilitate their data gathering.

70
f Institutional Impact. We also examined the potential relationship between PLA and educational outcomes by examining institutional efficiency measures such as degree productivity and cost efficiency (these variables will be calculated using data from IPEDS) to see if high proportions of PLA earning are related to higher overall degree-earning and lower overall instructional costs at an institution, thereby suggesting productivity and efficiency benefits to the institution. Finally, we examined the relationship between PLA practices/policies and prevalence of PLA credit earning among the students in our sample. This analysis could point toward future practice- and policy-oriented research, particularly with respect to exploring which factors might influence pursuit of credit through PLA.
CAEL AssumptionsIn carrying out the above research activities, CAEL considered several issues related to PLA within these institutions:
f PLA programs differ widely from institution to institution in how they are structured. Some colleges offer only one or two PLA methods, while others offer a wide range of options. Some invest a lot of time and resources in marketing PLA to students, while others do not. Some impose restrictions on PLA in terms of the level of course or number of credits for which it can be used, while other institutions have few, if any, limits. We have taken care in our analysis to account for these differences and acknowledge them in the final report.
f PLA programs differ widely in their adherence to quality. CAEL has heard from our institutional members that when it comes to PLA, there is often tension within the institution between quality and efficiency concerns. CAEL echoes faculty concerns about the quality of PLA, particularly when it is administered without adherence to nationally-accepted quality standards (e.g., those from CAEL and the American Council on Education). Without adherence to a clearly-articulated set of standards, quality will be replaced by efficiency as the goal because of the financial pressures on the institutions and/or a lack of a complete understanding of PLA. In this research study, CAEL has taken some steps to emphasize the need for institutions to follow PLA quality standards in order to ensure the validity of the data we collect. As part of the application process, for example, we asked institutions to provide us with information on why they offer PLA and what quality standards they follow. We considered their responses to this question as part of the selection process, yet we also recognized that these data are self-reported and therefore questionable. We further recognize that the quality issue may affect the results of the study in unknown ways.
f Each of the various PLA methods, when executed well, offers value. The various methods – exam-based, portfolio-based, challenge exams, local evaluation of training, etc. – differ in terms of potential learning outcomes, labor-intensity, perceived quality, and cost to the institution (efficiency). However, they also differ in terms of suitability for different student populations. CAEL has a preference for the portfolio-based method because of its ability to engage the student in the learning process and require reflection on the learning that was done; so, too, do several of our national advisors. Nevertheless, we also know that this method is not ideal for every student, every circumstance, or every institution. Evaluations of military and corporate training, for instance, are likely to become more important for adult learners in the near future, and many exam-based methods are executed well with great benefit to students. We therefore believe that the best scenario is when a range of options is offered, in order to address the needs of a wide range of adult student populations.

71
Limitations of This StudyA key issue affecting internal validity is self-selection bias, in particular whether students who earned PLA credit were somehow already more motivated to earn a degree or possibly had greater access to resources that enabled them to be academically successful. (This is a limitation of many past PLA research studies as well.) The two student groups that we will be comparing have not been randomly assigned to those groups. Those who earn PLA credit may therefore differ in very important ways from those who do not earn PLA credit. They may have higher skill levels, be more motivated or more organized, come from families that value education, feel more empowered in an educational setting, have had better experiences in school settings, have stronger support networks and so on. While controlling for these factors is outside the scope of this project, the study will nevertheless be useful for beginning to understand patterns of degree-earning for students who earn PLA credit – both in various institutional contexts and among different groups of adult learners. A second limitation is that even though there have been no other studies attempting to analyze data from so many institutions, the non-probability sampling procedure used in this study preclude our generalizing results directly either to the national population of institutions, or to institutional subgroups (e.g. private vs. public, large vs. small, four-year vs. two-year, etc). Despite these limitations, we hope that by conducting this study we will raise interest in PLA-related outcomes and encourage further research on the value of PLA to students and institutions.

© 2010 The Council for Adult and Experiential Learning (CAEL)
Lumina Foundation for Education works to ensure that 60 percent of Americans are college-educated by 2025.