fuel systems testing - seafish - seafish · subsidiary of belzona polymerics limited (. for each of...
TRANSCRIPT

Fuel Systems Testing
Determinations of the effect of (electro-) magnetic installations, a fuel
additive and a lubricant additive on diesel fuel consumption
prepared for:
The Sea Fish Industry Authority
with support from:
by
Thomas Clifford
Dean Millar
David Parish
Camborne School of Mines, School of Geography, Archaeology and Earth Resources, University of Exeter, Tremough Campus, Penryn, Cornwall, TR10 9EZ
July 2008

Fuel Systems Testing July 2008
2
Executive Summary
On 6th March 2008 representatives from SeaFISH and the University of Exeter met to discuss
testing of fuel economy enhancement technologies at the CSM dynamometer test cell facility.
These discussions resulted in an order for testing of various technologies to determine their
effectiveness. The proposed technologies were varied in nature, ranging from the use of
permanent and electromagnets installed on fuel lines to performance exhaust systems and engine
lubricant conditioners.
For each of these technologies, engine performance and fuel consumption tests were undertaken
once without the technology deployed, then once with the technology installed. The results from
the two tests were compared.
The central findings of the test work are as follows:
• The FuelVantage Digital Fuel Treatment system, marketed by Vaughan Industries Ltd
(http://www.magyk.com/) brought about a 1.00% improvement in specific fuel consumption for
the CSM dynamometer test cell diesel engine.
• The Ethos Max-power large permanent magnet fuel conditioner system, marketed by
Ethosworld.com Ltd (http://www.max-power.org.uk/index.php) brought about a 0.47%
improvement in specific fuel consumption for the CSM dynamometer test cell diesel engine.
• Belesta LC2, a lubricating oil additive marketed by Belesta (http://www.belesta.com/), a
subsidiary of Belzona Polymerics Limited (http://www.belzona.com/) brought about specific
fuel consumption savings of between 0.36% and 0.56%.
• Further testing of both large and small Max-power permanent magnets, marketed by
Ethosworld.com Ltd (http://www.max-power.org.uk/index.php), and the latter being applied
with opposing poles on the fuel lines leading to individual injectors, brought about specific fuel
consumption savings of 0.43%.
• MPG-CAPS fuel combustion catalyst tablets, marketed by Fuel Freedom International, FFi
Europe Ltd, (http://www.myffi.biz/t-MPG-CAPS.aspx) brought about specific fuel consumption
savings of 1.08%
• It is possible that combinations of technologies could produce further enhancements. For
example, providing an engine treatment dose of MPG-CAPS and following this with a
sequence of oil changes (with and without Belesta LC2) brought about a 3.18% improvement
in specific fuel consumption.
The report closes by identifying three avenues for further work. The first of these involves
conducting similar tests under a more dynamic, but fully controlled testing regime. The second
concerns the utilisation of heat recovered from exhaust and engine cooling systems. The third
concerns further investigations of (electro-)magnetic fuel conditioning technologies.

Fuel Systems Testing July 2008
3
Table of Contents
Executive Summary...................................................................................................................... 2 Table of Contents.......................................................................................................................... 3 Figures........................................................................................................................................... 4 Tables ............................................................................................................................................ 4 Introduction................................................................................................................................... 5
Initial scope of work – Comparative Testing ................................................................................ 5 Developmental Testing................................................................................................................ 5 Variations in the scope of work, agreed over the duration of the test schedule............................ 5 Test cycles adopted .................................................................................................................... 6 Comparative Testing – Rationale and general procedures .......................................................... 7 Dynamometer test cell – Construction and specification.............................................................. 9 Modifications to the dynamometer test facility since December 2007 ........................................ 11
Use of electromagnets on fuel feed lines.................................................................................. 14 Experimental set up................................................................................................................... 14 Experimental method................................................................................................................. 16
Use of permanent magnets on fuel feed lines .......................................................................... 17 Experimental set up – Large magnets only................................................................................ 17 Experimental set up – Large and small magnets ....................................................................... 17 Experimental method – Large magnets only.............................................................................. 18 Experimental method – Large and small magnets ..................................................................... 19
Use of engine conditioner .......................................................................................................... 20 Experimental method................................................................................................................. 20
Use of engine lubricant additive ................................................................................................ 21 Experimental method................................................................................................................. 21
Summary of Overall Test Sequence .......................................................................................... 23 Dynamometer Calibration .......................................................................................................... 24
Observed, compensated and corrected torque.......................................................................... 24 Experimental Results.................................................................................................................. 25
A. Vaughan FuelVantage Digital Fuel Treatment System.......................................................... 25 Comparison of Baseline diagnostic tests................................................................................ 26 DayTrawl test results ............................................................................................................. 27 Percentage differences of DayTrawl tests.............................................................................. 28 Percentage differences between DayTrawl tests - time series ............................................... 29
D. Ethos MaxPower Large Permanent Magnets........................................................................ 30 Comparison of Baseline diagnostic tests................................................................................ 31 DayTrawl test results ............................................................................................................. 32 Percentage differences of DayTrawl tests.............................................................................. 33 Percentage differences between DayTrawl tests - time series ............................................... 34
F. Ethos MaxPower Large & Small Permanent Magnets ........................................................... 35 Comparison of Baseline diagnostic tests................................................................................ 36 DayTrawl test results ............................................................................................................. 37 Percentage differences of DayTrawl tests.............................................................................. 38 Percentage differences between DayTrawl tests - time series ............................................... 39
G. MPG-CAPS Fuel combustion catalyst tablets ....................................................................... 40 Comparison of Baseline diagnostic tests................................................................................ 41 DayTrawl test results ............................................................................................................. 42 Percentage differences of DayTrawl tests.............................................................................. 43 Percentage differences between DayTrawl tests - time series ............................................... 44
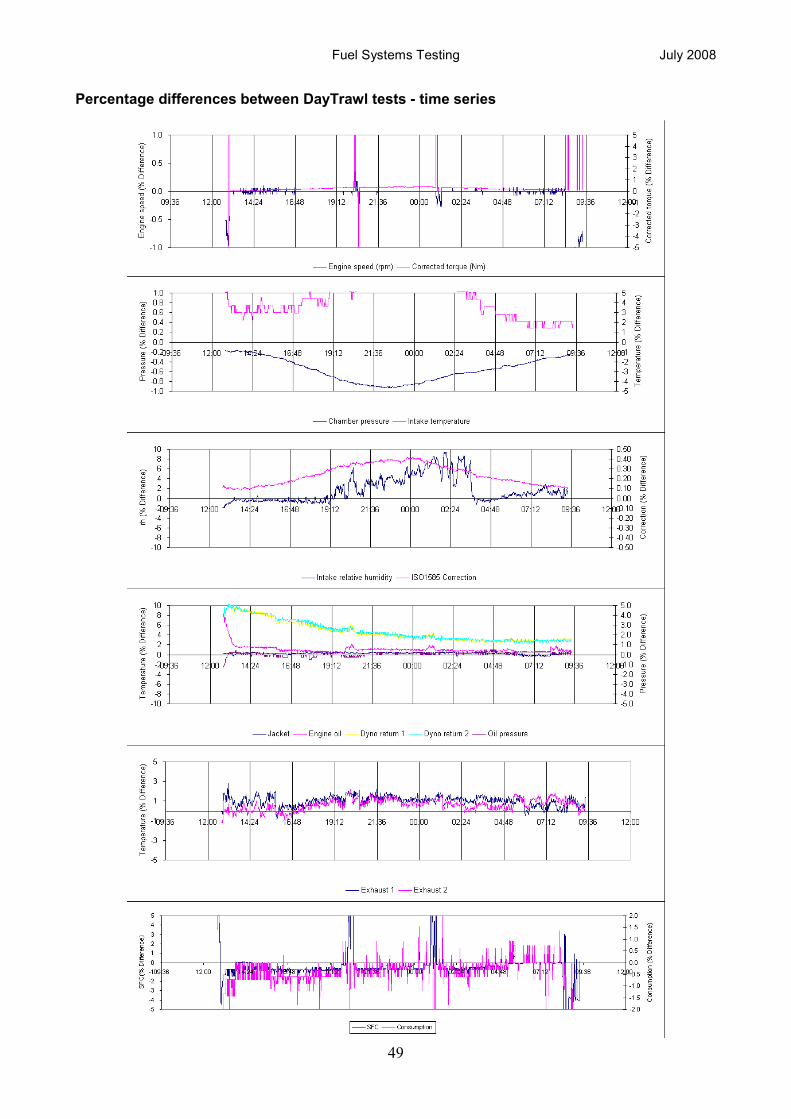
E. Belesta LC2 Lubricating oil additive – Phases A and B ......................................................... 45 Comparison of Baseline diagnostic tests................................................................................ 46 DayTrawl test results ............................................................................................................. 47 Percentage differences of DayTrawl tests.............................................................................. 48 Percentage differences between DayTrawl tests - time series ............................................... 49
E. Belesta LC2 Lubricating oil additive – Phases C and D......................................................... 50 Comparison of Baseline diagnostic tests................................................................................ 51
Fuel Systems Testing July 2008
4
DayTrawl test results ............................................................................................................. 52 Percentage differences of DayTrawl tests.............................................................................. 53 Percentage differences between DayTrawl tests - time series ............................................... 54 Further comparison between DayTrawl tests between Phase A and Phase C ....................... 55 Further comparison of DayTrawl tests between Phase A and Phase D.................................. 56
Summary of Results ................................................................................................................... 57 Discussion and Conclusions ..................................................................................................... 58
Key Findings ............................................................................................................................. 58 Indicators for Further Work........................................................................................................ 59 A modified DayTrawl test schedule ........................................................................................ 59 Heat recovery options ............................................................................................................ 61 Further investigation of (electro-)magnetic fuel conditioning technologies.............................. 62
Figures Figure 01: CSM engine dynamometer test cell – before modifications to exhaust system ............. 9 Figure 02: Dynamometer detail (N.B. Load cell unattached) ........................................................ 11 Figure 03: Exhaust extraction arrangements after comparative testing with Vaughan Industries
FuelVantage electromagnetic system but before developmental testing for Vortex Performance Exhausts Ltd.......................................................................................... 13
Figure 04: General arrangements for the FuelVantage Digital Fuel Treatment system (N.B. Yellow Transformer disconnected from supply for ‘before’ DayTrawl test).............................. 14
Figure 05: Detail photograph showing the FuelVantage Digital Fuel Treatment unit (Disconnected)................................................................................................................................... 15
Figure 06: Detail photograph showing the electromagnetic coil wrapped around the fuel supply line to the test engine.................................................................................................. 15
Figure 07: Detail photograph showing the FuelVantage Digital Fuel Treatment unit in operation. 16 Figure 08: Three ‘large’ Ethos Max-power magnets installed around the fuel supply line leading to
the test engine. ........................................................................................................... 17 Figure 09: Six ‘small’ Ethos Max-power magnets installed on the fuel supply lines leading to the
injectors of the test engine. ......................................................................................... 18 Figure 10: MPG-CAPS engine conditioning tablets (Source: http://www.myffi.biz/t-MPG-
CAPS.aspx) ................................................................................................................ 20 Figure 11: Belesta lubricant additive promotional materials (source: http://www.belesta.com/) .... 21 Figure 12: Fuel consumption transients after change from DayTrawl Stage TP07 to TP08 (4 hour
trawl) at time 00:00:00. ............................................................................................... 59
Tables
Table 01: Test cell engine specification......................................................................................... 10 Table 02: Summary of dynamometer features .............................................................................. 10 Table 03: Schedule of all testing undertaken since 4th March to 7th July 2008. .............................. 23 Table 04: Torque compensation parameter values ....................................................................... 24 Table 05: Summary of DayTrawl test data .................................................................................... 57

Fuel Systems Testing July 2008
5
Introduction
This document reports methodology and results of comparative testing a series of commercially
available products each of which is designed to improve the fuel economy of diesel engines. The
tests were untaken at the University of Exeter’s CSM engine dynamometer test cell.
Initial scope of work – Comparative Testing
On 6th March 2008 representatives from SeaFISH and the University of Exeter met to discuss
testing of various fuel economy enhancement technologies. These discussions resulted in an order
for testing of the following during the period March to June 2008:
A. The FuelVantage Digital Fuel Treatment system, marketed by Vaughan Industries Ltd
(http://www.magyk.com/)
B. An exhaust system, marketed by Vortex Performance Exhausts Ltd (http://www.vortex-
performance-exhausts.co.uk/index.php)
C. The Calorific Value Enhancer (CVE) system, marketed by Enersol Ltd
(http://www.enersolcorp.com/motive/index.cfm)
D. The Ethos Maxpower permanent magnet fuel conditioner system, marketed by
Ethosworld.com Ltd (http://www.max-power.org.uk/index.php)
E. Belester LC2, a lubricating oil additive marketed by Belesta (http://www.belesta.com/), a
subsidiary of Belzona Polymerics Limited (http://www.belzona.com/).
For each of these technologies, engine performance and fuel consumption testing would be
undertaken once without the technology deployed, then once with the technology installed and the
results from the two tests would be compared. Tests of this nature are referred to as Comparative
Tests in this report.
Developmental Testing
The testing schedule agreed allowed for Developmental Tests of each of the technologies, as
required, at the expense of the company marketing the product tested. Such work was outside of
the scope of work agreed with SeaFISH and outside the scope of work reported herein. However,
in each such instance, the developmental testing would be undertaken under separate contract
with the product provider to the satisfaction of the product provider, prior to Comparative Tests
undertaken within the scope of the work reported herein.
Variations in the scope of work, agreed over the duration of the test schedule
2 weeks within the schedule was allocated to developmental testing of the Enersol CVE system,
funded by Enersol in order that they could undertake developmental testing to tune their device to
the test cell engine, prior to comparative testing conducted under this SeaFISH programme. In
Fuel Systems Testing July 2008
6
practice, over the duration of the test schedule, Enersol were committed to a testing programme
elsewhere and were not available to participate in the SeaFISH programme.
Approximately one week of the schedule was allocated exclusively to Vortex Performance
Exhausts Ltd, in order that they could identify the most appropriate exhaust dimensions under a
separate developmental testing contract, prior to comparative testing conducted under this
SeaFISH programme. At the time of writing, developmental testing for Vortex Performance
Exhausts Ltd has been undertaken and is ongoing but, with the agreement of SeaFISH,
comparative testing of this technology has been deferred.
Within the Comparative Test schedule, and with the agreement of SeaFISH, the work planned for
Enersol Ltd and Vortex Performance Exhausts Ltd was substituted by:
F. Further testing of Max-power permanent magnets, marketed by Ethosworld.com Ltd
(http://www.max-power.org.uk/index.php)
G. MPG-CAPS fuel combustion catalyst tablets, marketed by Fuel Freedom International, FFi
Europe Ltd, (http://www.myffi.biz/t-MPG-CAPS.aspx)
In practice, the final test schedule, including developmental testing phases within, was completed
at the end of June 2008.
Test cycles adopted
Two distinct test cycles were adopted in the comparative test work reported herein. The first was
termed the Baseline test cycle. This comprises running the engine at the maximum rack position,
while using the dynamometer to control the load on the engine such that the engine speed is
steady. The test cycle starts by defining an engine speed set point of (a maximum of) 2500 rpm
and then follows a series of engine speed set points where the engine speed is progressively
reduced by 100 rpm, to a minimum engine speed of 1000 rpm. The test cycle proceeds by ramping
the engine speed back up to 2500 rpm through a series of set points where the engine speed is
increased by 100 rpm at each point. While the test is underway, engine temperatures (at various
locations), pressures, environmental conditions (humidity, atmospheric pressure, etc.) and fuel
consumption are monitored. Including warm up and warm down phases of the cycle, this test cycle
takes around 1 ½ hours to complete. The Baseline test cycle is primarily used as a diagnostic test
sequence to determine whether or not the test engine has sustained damage or an irreversible
physical change during the more prolonged DayTrawl test cycle has occurred. The DayTrawl test
cycle is outlined next.
The second test cycle adopted was called the DayTrawl test cycle. This engine duty cycle defines
engine set points where the engine torque and engine rotational speed are specified and controlled

Fuel Systems Testing July 2008
7
to simulate a typical summer season day excursion of a ~10m class trawler fishing vessel. The
cycle simulates 2 ½ hours steaming to the trawling location, then 3 x 4 hour long trawls, then a 2 ½
hour journey from the trawling location back to harbour and a 1 hour ‘warm down’ while idling.
While the test is underway, engine temperatures (at various locations), pressures, environmental
conditions (humidity, atmospheric pressure, etc.) and fuel consumption are monitored. Including
warm up and warm down phases of the cycle, this test cycle takes around 21 hours to complete
and is the main test used to determine differences in fuel economy.
Full details of both of the test cycles are provided in the report entitled: “Diesel Fuel Additives
Testing; An abstracted report from the Biofuels for the Fishing Industry project”, prepared for
SeaFISH in February 2008.
Comparative Testing – Rationale and general procedures
The engine dynamometer test cell is not operated manually during testing but is operated by
computer using a supervisory control and data acquisition (SCADA) system. During a DayTrawl
test, the SCADA system guarantees that the uncorrected work done by the engine at each set
point and over the whole test cycle is identical to that of earlier or later DayTrawl tests.
For each technology assessed, an initial DayTrawl test cycle is performed with the engine
unmodified. Then, the technology assessed is then either i) installed on the engine, ii) added to the
fuel or iii) added to the lubricant – as required by the technology being assessed. Then the engine
undergoes the DayTrawl test cycle again. When both DayTrawl test cycles have been completed,
the fuel consumption figures are compared between these tests.
Some of the technologies investigated may have effects that last longer than the duration of one
test. For example, FFi Europe Ltd state that their MPG-CAPS product works partly by depositing a
“thermally derived oxidation” film on the surfaces of the engine cylinders. To try to reduce the effect
of this and other possible effects relating to the order in which the technologies were assessed in
the determinations, each technology has its own ‘technology free’ benchmark DayTrawl test,
conducted either immediately before or immediately after the DayTrawl test designed to test the
technology. These tactics for comparative testing also aim to reduce/eliminate variance between
DayTrawl test results due to other factors, such as:
• use of different fuel batches between tests compared (same fuel used)
• long term drift in dynamometer or other sensor calibration (minimum engine hours between
comparative tests)
• changes in exhaust systems (engine fitted with 3 inch exhaust system after Vortex testing)

Fuel Systems Testing July 2008
8
In comparison to field trials, the SCADA system allows comparison between tests free from effects
due to:
• weather
• tidal currents
• operator usage variance
While the SCADA system ensures that the uncorrected work done by the test engine is the same
for each DayTrawl test, installation of the dynamometer test cell in the sub-surface of a mine aims
to reduce variance in test results due to:
• diurnal effects on the temperature and humidity of intake air
• seasonal effects on the temperature and humidity of intake air
as ambient temperature and humidity of the mine air is relatively constant.
Variations in atmospheric pressure are unavoidable and consequently an ISO1585 correction
factor is applied to calibrated torque observations, using real-time measurements of intake air
temperature, humidity and absolute pressure.
The engine is subjected to the Baseline test diagnostic, typically between testing of each
technology, and each of the DayTrawl tests, in order to verify that the engine has not suffered any
serious malfunction or sudden deterioration of performance through the test schedule.

Fuel Systems Testing July 2008
9
Dynamometer test cell – Construction and specification
Figure 01: CSM engine dynamometer test cell – before modifications to exhaust system
The test cell is located in an underground chamber about 50 metres from the entrance to the mine
in which it is located. This is a secure location with a relatively stable environment. The major
equipment is based around a 6 cylinder, normally aspirated Perkins marine diesel engine with a
nominal rating of 120hp. A dynamometer (Figure 02) is used to apply a load to the engine and to
measure the torque. A computer-controlled system is used to run the engine through pre-defined
tests in which two of i) rack position, ii) engine speed and iii) torque are specified. A set of
instruments accurately records a wide range of data such as fuel consumption, engine oil pressure
and temperature, coolant temperature, exhaust temperature, and environmental conditions.

Fuel Systems Testing July 2008
10
Table 01: Test cell engine specification
Parameter: Specification:
Manufacturer: Perkins
Type: 6.3544M
Cylinders 6
Cubic capacity 5.8 litres
Compression ratio: 16:1
Bore: 98.4mm
Stroke: 127mm
Firing order: 1-5-3-6-2-4
Combustion system: Direct injection
Cycle: 4 stroke
Output power: 89.5kW
@ Rotational speed 2800rpm
Table 02: Summary of dynamometer features
Parameter: Specification:
Manufacturer: Schenk
Type: W230
Serial number: LWH 0994
Date of manufacture: 1986
Resistance: Eddy current
Torque transducer: Load cell
Speed transducer: 60 tooth wheel / inductive cell
Calibration: Dead weight arm

Fuel Systems Testing July 2008
11
Figure 02: Dynamometer detail (N.B. Load cell unattached)
The construction of this facility and a full specification of the components and instrumentation can
be reviewed the report entitled: “Diesel Fuel Additives Testing; An abstracted report from the
Biofuels for the Fishing Industry project”, prepared for SeaFISH in February 2008.
Modifications to the dynamometer test facility since December 2007
In comparison to the test work previously reported to SeaFISH in the December 2007 report: “Bio-
Fuels for the Fishing Industry”, the dynamometer test facility has been subjected to the following
modifications:

Fuel Systems Testing July 2008
12
• The rigid, twin universal joint (UJ) and solid shaft coupling between the test engine and the
dynamometer has been replaced by twin rubber coupling with hollow shaft. This was done
to reduce wear and possible damage to the engine, as well as UJ bearings. Universal joints
had to be replaced twice during the earlier reported testing due to damaged bearings. It is
thought that this damage occurred due to instantaneous excessive loading during engine
starting and stopping with the earlier rigid coupling.
• Prior to the start of this phase of testing, the engine head was removed and broken piston
rings were replaced and a new head gasket was installed. The engine was run in for
around 85 hours before a new set of Baseline tests was undertaken to establish
repeatability of results from the engine.
• After testing of the Vaughan Industries FuelVantage system, but before testing of Vortex
performance exhaust systems, the exhaust line carrying combustion products out of the
test cell chamber was terminated closer to the engine. An exhaust extract cone was
installed such that the end of the exhaust pipe overlapped by 5-10 cm with the outer edge
of the exhaust extract cone. This was done to ensure that the pressure at the end of the
exhaust pipe was close to atmospheric during testing, as Vortex representatives has
expressed concern that the exhaust fan could influence test results. In practice under the
maximum load observed during the Day-trawl cycle, the static gauge pressure in the gap
between the end of the exhaust pipe and the extract cone was measured less than 30 Pa
(0.03 kPa). This is one order of magnitude lower than the typical variation of atmospheric
pressure during a DayTrawl test and thus was deemed to have an insignificant effect on the
test results.

Fuel Systems Testing July 2008
13
Figure 03: Exhaust extraction arrangements after comparative testing with Vaughan Industries
FuelVantage electromagnetic system but before developmental testing for Vortex Performance
Exhausts Ltd
Fuel Systems Testing July 2008
14
Use of electromagnets on fuel feed lines
Experimental set up
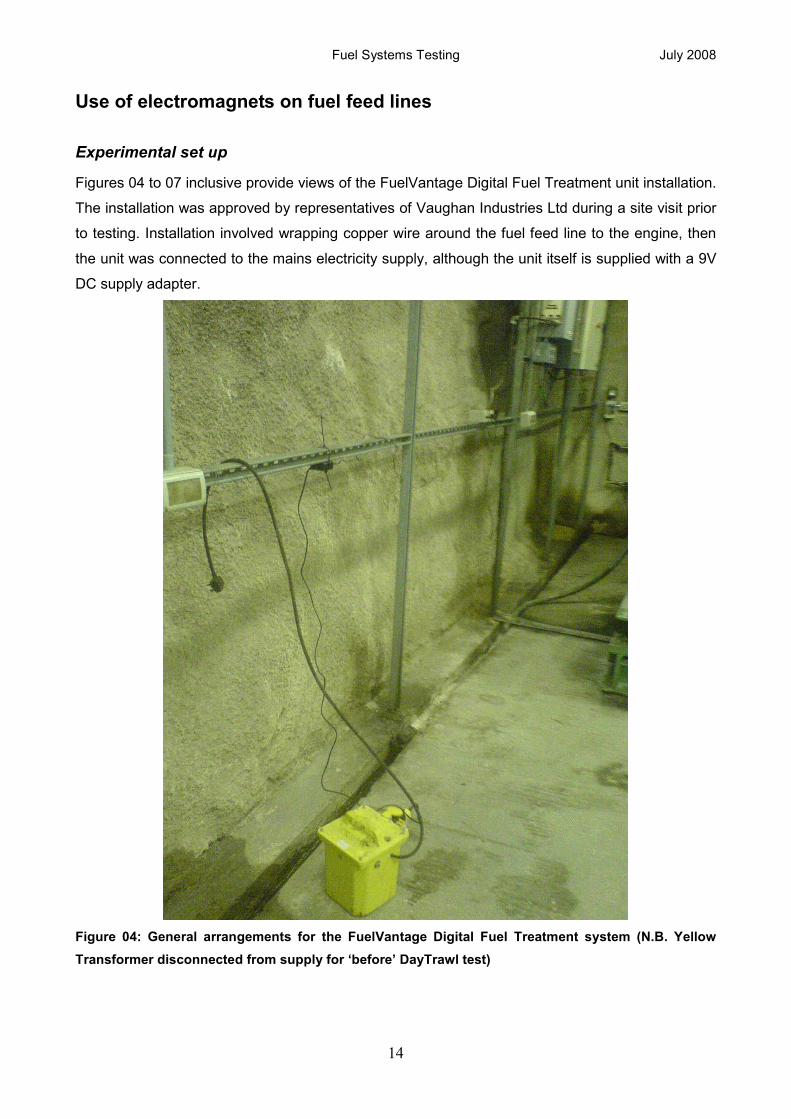
Figures 04 to 07 inclusive provide views of the FuelVantage Digital Fuel Treatment unit installation.
The installation was approved by representatives of Vaughan Industries Ltd during a site visit prior
to testing. Installation involved wrapping copper wire around the fuel feed line to the engine, then
the unit was connected to the mains electricity supply, although the unit itself is supplied with a 9V
DC supply adapter.
Figure 04: General arrangements for the FuelVantage Digital Fuel Treatment system (N.B. Yellow
Transformer disconnected from supply for ‘before’ DayTrawl test)

Fuel Systems Testing July 2008
15
Figure 05: Detail photograph showing the FuelVantage Digital Fuel Treatment unit (Disconnected)
Figure 06: Detail photograph showing the electromagnetic coil wrapped around the fuel supply line
to the test engine.

Fuel Systems Testing July 2008
16
Figure 07: Detail photograph showing the FuelVantage Digital Fuel Treatment unit in operation.
Experimental method
• Six Baseline tests were conducted to establish engine performance following engine
reassembly following repair (Baseline_003_201 to Baseline_003_206)
• DayTrawl test was attempted but failed due cut out of cooling water pump at mine sump,
forcing test abort on three occasions. Eventually diagnosed as an earth fault with the
cooling water pump switch.
• Benchmark DayTrawl test undertaken (DayTrawl_002_201) with digital fuel treatment unit
disconnected
• Intermediate Baseline test undertaken as check diagnostic (Baseline_003_207)
• DayTrawl test undertaken (DayTrawl_002_202_VEMC) with digital fuel treatment unit
operating
• Closing Baseline test undertaken as check diagnostic (Baseline_003_208_AVEMC)

Fuel Systems Testing July 2008
17
Use of permanent magnets on fuel feed lines
Experimental set up – Large magnets only
Two phases of testing were undertaken (D and F in the Introduction section presented earlier). For
the first of these phases, three of the larger Ethos Max-power permanent magnets were clipped
around the test engine fuel supply line (Figure 08). The magnets were then secured with cable ties.
The installation was approved by a representative of Ethosworld.com Ltd during a site visit after
the first phase of testing, but before the second phase of testing.
Figure 08: Three ‘large’ Ethos Max-power magnets installed around the fuel supply line leading to the
test engine.
Experimental set up – Large and small magnets
During the second phase of testing of the Ethos Max-power permanent magnets, the three large
magnets were installed around the common fuel supply line leading to the test engine (Figure 08)
and an additional 6 smaller magnets were installed around the fuel supply lines leading to each

Fuel Systems Testing July 2008
18
injector (Figure 09). Under the instruction of the Ethosworld.com Ltd representative who visited the
site, the small magnets were installed by holding repelling poles of the permanent magnets
together around the injector fuel lines with a cable tie (Not shown in Figure 09; photo taken when
installation scheme was approved by Ahmed Yoozooph on 8th May 2008).
Figure 09: Six ‘small’ Ethos Max-power magnets installed on the fuel supply lines leading to the
injectors of the test engine.
Experimental method – Large magnets only
• Benchmark DayTrawl test undertaken (DayTrawl_002_290), no magnets installed.
• Baseline test undertaken as check diagnostic (Baseline_003_214)
• DayTrawl test undertaken with large magnets installed (DayTrawl_003_291_MP)
• Baseline test undertaken with large magnets installed (Baseline_003_215_MP)
• Baseline test undertaken without large magnets installed (Baseline_003_216)

Fuel Systems Testing July 2008
19
Experimental method – Large and small magnets
• Baseline test undertaken as check diagnostic (BL003_130508)
• DayTrawl test undertaken (DT002_140508) with large Max-power magnets installed.
• Intermediate Baseline test undertaken as check diagnostic (BL003_200508). Large Max-
power magnets were removed.
• DayTrawl test undertaken (DT002_200508) with large Max-power magnets removed.
• Closing Baseline test undertaken as check diagnostic (BL003_210508)
Between the phase of testing dealing with the large Max-power magnets only and the second
involving the large and small magnets, developmental tests were undertaken for Vortex
Performance Exhausts Ltd. These ultimately required increasing the diameter of the exhaust pipe
from the exhaust manifold to the exhaust silencer tail pipe from 2 ½ inches to 3 inches. Results
from the large magnets only testing and the large and small magnets testing are thus not directly
comparable. However, benchmark DayTrawl tests in each of the two phases of testing allow the
improvements in fuel economy to be identified for both cases, and the improvements compared.

Fuel Systems Testing July 2008
20
Use of engine conditioner
Fuel Freedom International state (http://www.myffi.biz/t-MPG-CAPS.aspx) that their MPG-CAPS
fuel combustion catalyst tablets improve fuel economy in two ways. Firstly in conditioning doses of
3 capsules per 109 – 130 litres, their effect is to create film on the cylinder surfaces that alters the
heat transfer characteristics leading to higher combustion temperatures and more even distribution
of fuel within the combustion chamber. FFI also state that their tablets contain a catalyst that
promotes better dissociation of the fuel leading to improved fuel burn characteristics.
Figure 10: MPG-CAPS engine conditioning tablets (Source: http://www.myffi.biz/t-MPG-CAPS.aspx)
Experimental method
• Baseline test undertaken as check diagnostic (BL003_210508)
• Benchmark DayTrawl test undertaken (DT002_130608) running on red diesel without FFi
tablets added to fuel.
• Intermediate Baseline test undertaken as check diagnostic (BL003_140608).
• DayTrawl test undertaken (DT002_140608) running on red diesel with FFi tablets added to
the fuel according to manufacturers dosing specifications.
• Closing Baseline test undertaken as check diagnostic (BL003_150608)

Fuel Systems Testing July 2008
21
Use of engine lubricant additive
Belesta Ltd, a subsidiary of Belzona Polymerics Ltd, market a product called Belesta LC2.
According to the manufacturers, LC2 is a friction reducing supplement. It is added to existing
lubricants at 5% by volume. The manufacturers claim: wear resisting properties, fuel savings,
reduced engine noise, reduced engine temperature and lower CO2 emissions (by virtue of reduced
fuel consumption).
Figure 11: Belesta lubricant additive promotional materials (source: http://www.belesta.com/)
Experimental method
The following experimental procedure was agreed with Belesta representatives following their site
inspection of the dynamometer test cell on 4th June 2008.
Phase A
• Drain existing oil, renew engine oil filter and engine oil.
• Baseline test undertaken as a check diagnostic (BL003_160608)
• Benchmark DayTrawl test undertaken (DT002_160608).
• Baseline test undertaken as check diagnostic (BL003_170608).
Phase B
• Drain 10% by volume of engine oil (including oil in filter).
• Mix half of this volume with an equal volume of LC2, stir well and use to top up engine oil to
normal level. Reserve remaining 5% of oil used in Phase A
Fuel Systems Testing July 2008
22
• Baseline test undertaken as a check diagnostic (BL003_180608)
• DayTrawl test undertaken (DT002_180608).
• Baseline test undertaken as check diagnostic (BL003_200608).
Phase C
• Drain all oil, renew engine oil filter and engine oil, the latter blended at 5% by volume with
LC2.
• Baseline test undertaken as a check diagnostic (BL003_010708)
• Benchmark DayTrawl test undertaken (DT002_010708).
• Baseline test undertaken as check diagnostic (BL003_030708).
Phase D
• Drain all oil, renew engine oil filter and engine oil; engine oil should be the same as used in
Phase A.
• Baseline test undertaken as a check diagnostic (BL003_040708)
• Benchmark DayTrawl test undertaken (DT002_040708).
• Baseline test undertaken as check diagnostic (BL003_070708).

Fuel Systems Testing July 2008
23
Summary of Overall Test Sequence
A complete listing of test and diagnostic running of the CSM engine test cell is provided below for
completeness. Entries highlighted in light blue are developmental tests undertaken for Vortex
Performance Exhausts Ltd, not reported herein.
Table 03: Schedule of all testing undertaken since 4th March to 7
th July 2008.
Test start time Test Reference Duration Dyno Notes
(hh:mm:ss) days
16/12/07 12:00:00 Torque calibration check 00:00:00 16.12
04/03/08 12:00:00 Running in 05:00:00 16.32 New rubber coupling between engine and dyno
04/03/08 18:00:00 Running in 14:00:00 16.91
10/03/08 12:00:00 Running in 16:00:00 17.57
14/03/08 12:00:00 Running in 14:00:00 18.16
15/03/08 12:00:00 Running in 14:00:00 18.74
16/03/08 12:00:00 Running in 14:00:00 19.32
16/03/08 12:00:00 Running in 08:00:00 19.66
17/03/08 15:14:08 BASELINE_003_201_c 01:32:33 19.72 Baseline run to assess repeatability
18/03/08 08:37:55 BASELINE_003_202_c 01:36:38 19.79 Baseline run to assess repeatability
18/03/08 10:32:21 BASELINE_003_203_c 01:28:25 19.85 Baseline run to assess repeatability
18/03/08 13:26:19 BASELINE_003_204_c 01:33:52 19.91 Baseline run to assess repeatability
18/03/08 15:33:02 BASELINE_003_205_c 01:30:29 19.98 Baseline run to assess repeatability
19/03/08 07:33:07 BASELINE_003_206_c 01:38:20 20.05 Baseline run to assess repeatability
19/03/08 12:00:00 Aborted DayTrawl 04:00:00 20.21
20/03/08 12:00:00 Aborted DayTrawl 04:00:00 20.38
21/03/08 12:00:00 Aborted DayTrawl 04:00:00 20.55
25/03/08 12:39:33 DAYTRAWL_002_201_c 20:46:12 21.41 DayTrawl test without Vaughan EM coil testing
26/03/08 11:43:00 BASELINE_003_207_c 01:32:57 21.48
26/03/08 14:53:04 DAYTRAWL_002_202_VEMC_c 20:43:54 22.34 Comparative DayTrawl test with Vaughan EM coil
27/03/08 12:02:30 BASELINE_003_208_AVEMC_c 01:29:02 22.40 Conducted after 21 hour DayTrawl on fossil after Vaughan testing
28/03/08 11:00:00 Trials to test new exhaust system 00:30:00 22.42
28/03/08 12:00:00 Torque calibration check 00:00:00 22.42
28/03/08 13:05:38 BASELINE_003_209_ANE_c 01:35:33 22.49 Baseline test after new exhaust extract system installed
28/03/08 15:38:39 DAYTRAWL_002_203_NE_c 20:47:02 23.35 DayTrawl benchmark after new exhaust extractor system installed
29/03/08 12:59:17 Aborted Baseline 00:15:00 23.37 Exhaust fell off during Baseline test - significant repairs needed
31/03/08 14:52:20 BASELINE_003_211_c 01:26:51 23.43 Baseline after exhaust failure and repairs
31/03/08 18:26:06 DAYTRAWL_002_204_NE_c 20:48:19 24.29 DayTrawl after exhaust failure and repairs
01/04/08 16:38:15 BASELINE_003_212_c 02:00:08 24.38 Baseline after Daytrawl with new exhaust extractor & 2.5 inch CSM silencer
01/04/08 21:02:28 BASELINE_003_213_c 01:30:30 24.44 Baseline with Vortex Performance Exhaust silencer No. 1
04/04/08 11:40:25 SHORTDAYTRAWL_001_001_VE_c 01:57:04 24.52 Short DayTrawl with Vortex narrow silencer (No. 1)
04/04/08 14:16:19 SHORTDAYTRAWL_001_002_c 01:48:08 24.60 Short DayTrawl with HTM silencer
05/04/08 13:54:05 SHORTDAYTRAWL_001_003_VE_c 01:50:54 24.67 Short DayTrawl with Vortex broad silencer (No. 2)
08/04/08 10:39:37 DAYTRAWL_002_290_c 20:59:00 25.55 Daytrawl on 2.5 inch CSM silencer, providing datum for fixed magnets work
09/04/08 10:28:29 BASELINE_003_214_c 01:35:47 25.61 Diagnostic after DayTrawl test above
09/04/08 15:04:10 DAYTRAWL_002_291_MP_c 20:59:00 26.49 Daytrawl on 2.5 inch CSM silencer , with large permanent magnets installed
10/04/08 12:52:39 BASELINE_003_215_MP_c 01:32:16 26.55 Baseline on 2.5 inch CSM silencer, with large permanent magnets installed
11/04/08 08:44:23 BASELINE_003_216_c 01:35:50 26.62 Baseline on 2.5 inch CSM silencer, without permanent magnets
25/04/08 11:05:25 SDT01_250408_01_c 01:48:08 26.69 ShortDayTrawl with 2.5 inch CSM silencer
01/05/08 08:42:56 BL003_010508_001_c 01:38:14 26.76 Baseline with 3 inch CSM silencer
01/05/08 10:35:26 SDT01_010508_001_c 01:48:08 26.84 Short DayTrawl 3 inch CSM silencer
01/05/08 12:43:07 SDT01_010508_002_c 01:48:08 26.91 Short DayTrawl 3 inch CSM silencer
01/05/08 14:50:19 SDT01_010508_003_c 01:48:08 26.99 Short DayTrawl 3 inch CSM silencer
02/05/08 15:13:28 BL003_020508_001_c 01:35:55 27.05 Baseline with 3 inch CSM silencer
08/05/08 12:10:58 SDT01_080508_001_c 01:48:08 27.13 ShortDayTrawl with 3 inch Vortex silencer (No 3) - mistake in progression
13/05/08 08:49:11 SDT01_130508_001VE_c 01:48:08 27.20 ShortDayTrawl with 3 inch Vortex silencer (No 3) - repeat of 08/05/08
13/05/08 11:54:39 BL003_130508_001VE_c 01:32:38 27.27 Baseline with 3 inch Vortex silencer
13/05/08 14:10:57 BL003_130508_002_c 01:32:24 27.33 Baseline with 3 inch CSM silencer / Opening Baseline for fixed magnets
14/05/08 10:58:21 DT002_140508_001EM_c 20:52:43 28.20 DayTrawl with fixed magnets 140508
20/05/08 09:21:32 BL003_200508_001_c 01:34:57 28.27 Baseline between Magnets DT and Red Diesel DT 200508
20/05/08 19:02:40 DT002_200508_001_c 20:51:27 29.14 DayTrawl without Magnets 200508
21/05/08 16:30:51 BL003_210508_001_c 01:31:38 29.20 Closing Baseline for Fixed Magnets 210508 / Opening baseline for Ffi tablets
13/06/08 10:02:34 DT002_130608_001_c 20:57:42 30.07 DayTrawl on red diesel only 130608
14/06/08 07:44:08 BL003_140608_001_c 01:31:20 30.14 Baseline between Red DT and Ffi tablets DT 130608
14/06/08 09:29:10 DT002_140608_001_c 20:43:06 31.00 DayTrawl with Ffi tablets 140608
15/06/08 08:15:58 BL003_150608_001_c 01:34:17 31.07 Closing baseline for Ffi tablets 150608
16/06/08 13:59:54 BL003_160608_001_c 01:27:07 31.13 Opening baseline on Belesta work (no Belesta installed) 160608
16/06/08 15:56:19 DT002_160608_001_c 20:42:52 31.99 DayTrawl on red (no Belesta installed) 160608
17/06/08 13:47:09 BL003_170608_001_c 01:31:38 32.05 Baseline after red (no Belesta installed) 170608
18/06/08 10:26:33 BL003_180608_001_c 01:35:23 32.12 Opening baseline on Red (5% Belesta) 180608
18/06/08 12:20:54 DT002_180608_001_c 20:43:05 32.98 DayTrawl on Red (5% Belesta) 180608
20/06/08 08:37:20 BL003_200608_001_c 01:36:04 33.05 Closing baseline on Red (5% Belesta) 200608
01/07/08 10:02:11 BL003_010708_001_c 01:35:19 33.12 Opening baseline on Red (5% Belesta, 2nd rinse), 010708
01/07/08 14:35:29 DT002_010708_001_c 20:49:39 33.98 DayTrawl on Red (5% Belesta, 2nd rinse), 010708
03/07/08 08:47:10 BL003_030708_001_c 01:37:05 34.05 Closing baseline on Red (5% Belesta, 2nd rinse), 030708
04/07/08 10:33:02 BL003_040708_001_c 01:38:42 34.12 Opening baseline for closing daytrawl on red, 040708
04/07/08 12:40:32 DT002_040708_001_c 20:44:42 34.98 DayTrawl on Red (closing DayTrawl), 040708
07/07/08 08:03:58 BL003_070708_001_c 01:40:29 35.05 Closing baseline on Red, 050708
08/07/08 10:00:00 Torque calibration check 00:00:00 35.05

Fuel Systems Testing July 2008
24
Dynamometer Calibration
Signals from the load cell on the test cell dynamometer pass to a signal conditioning box and then
subsequently to a PCB card in a rack of analogue to digital converters. During testing the digital
values are recorded and displayed on the screen of the SCADA software. These are also the
values that the SCADA system uses to control the torque - when it is (operator) defined that it is
appropriate to do so.
The SCADA software has an off-line procedure that guides the process of dynamometer
calibration. A deadweight cantilever arm is placed across the dynamometer and a known load is
placed on a hanger at the end of the arm, providing known torque. The magnitude of the known
load is provided to the system and recorded, while it senses the torque through the
instrumentation. The process is repeated with different known loads. The SCADA system then
computes the calibration parameters and these are stored within the system, ready for operations.
As a part of routine testing operations, the dynamometer calibration is periodically checked using a
similar procedure to that described above. Known loads are placed on the hanger at the end of the
cantilever arm and the resulting known torque is compared with the torque displayed on the
SCADA system screen (the value which would be recorded during operations). This process is
repeated with known loads. These data are used to post process torque data recovered from the
system during testing in a process that is termed compensation.
Dynamometer calibration checks have demonstrated that it has remained stable throughout the
current period of testing.
Table 04: Torque compensation parameter values
Dyno Gain Offset
days
(Nm/Nm) (Nm)
16.12 1.010 -1.1
22.42 1.013 -2.5
35.05 1.008 -2.0
Observed, compensated and corrected torque
In DayTrawl test results that are presented, three values for torque are reported: observed torque,
compensated torque and corrected torque. The observed torque figures are those recorded by the
SCADA system. The compensated torque figures are those found after post processing using the
compensation parameters. The corrected torque figures are those found after applying an ISO1585
procedure to allow for variations in atmospheric conditions during testing. The latter procedure
determines the so-called engine correction factor and full details of this process are provided in the
report prepared for SeaFISH entitled: “Diesel Fuel Additives Testing; An abstracted report from the
Biofuels for the Fishing Industry project”, February 2008.

Fuel Systems Testing July 2008
25
Experimental Results
A. Vaughan FuelVantage Digital Fuel Treatment System
The experimental results are presented using both graphical and tabular formats.
Firstly the results of Baseline diagnostic tests are presented graphically, before, during and after
the main DayTrawl tests. These results are presented in confirmation that the test engine did not
suffer any major malfunction throughout the test sequence. With exceptions where indicated, all
Baseline tests are conducted on straight red diesel, without any of the technologies being
examined being deployed. Thus, there should be excellent agreement between Baseline
diagnostic tests, presuming the technology tested does not provide an effect beyond its
deployments.
The main results of comparative testing are then presented using a tabular format. Firstly, the
results of the Benchmark DayTrawl test are presented. Then the results of the DayTrawl test with
the technology deployed are presented. Finally, a table of percentage differences in quantities
found for each stage of the test cycle (presented in the first two tables) are presented. The
percentage differences are calculated as:
((Value with technology – Benchmark value) / Benchmark value) x 100
This means that a positive percentage difference means that the value with technology was higher
than the benchmark value without the technology. A negative percentage difference means that
the value with the technology was lower than the benchmark value without the technology. For
example, if the technology tested is found to ‘work’, the percentage difference in thermal efficiency
should be positive and the percentage difference in specific fuel consumption should be negative.
The main results of comparative testing are then presented using a graphical format. Firstly the
time series of the Benchmark DayTrawl test are presented. Then the time series of the DayTrawl
test with the technology deployed are presented. Finally, time series of the percentage differences
in engine performance and fuel consumption parameters are presented. The percentage
differences are calculated as:
((Value with technology – Benchmark value) / Benchmark value) x 100
This means that a positive percentage difference means that the value with technology was higher
than the benchmark value without the technology. A negative percentage difference means that
the value with the technology was lower than the benchmark value without the technology. For
example, if the technology tested is found to ‘work’, the percentage difference in thermal efficiency
should be positive and the percentage difference in specific fuel consumption should be negative.
For brevity, table and figure numbering are suspended until the Summary Results section below.

Comparison of Baseline diagnostic tests
300
310
320
330
340
350
360
370
1000 1200 1400 1600 1800 2000 2200 2400
Engine speed (rpm)
Torque (Nm)
30
40
50
60
70
80
90
Power (kW)
1 2 3 1 2 3
300
310
320
330
340
350
360
370
1000 1200 1400 1600 1800 2000 2200 2400
Engine speed (rpm)
Torque (Nm)
30
40
50
60
70
80
90
Power (kW)
1 2 3 1 2 3
2
3
4
5
6
7
1000 1200 1400 1600 1800 2000 2200 2400
Engine speed (rpm)
Consumption (g/s)
0.23
0.24
0.25
0.26
0.27
SFC (g/kWh)
1 2 3 1 2 3
2
3
4
5
6
7
1000 1200 1400 1600 1800 2000 2200 2400
Engine speed (rpm)
Consumption (g/s)
0.23
0.24
0.25
0.26
0.27
SFC (g/kWh)
1 2 3 1 2 3
1 - BASELINE_003_206 (Before), 2 - BASELINE_003_207 (Between DayTrawls), 3 - BASELINE_003_208_AVEMC (After)
Narrative:
Curves in upper boxes are for the
ramping down stages of the test
cycle. Curves in the lower boxes
are for the ramping up (later)
stages of the test cycle.
Curves indicate no significant
malfunction occurred with the test
engine.
Good consistency between
maximum torque and maximum
power curves between tests.
SFC for test 3 lower than others
suggesting that effect of the
technology persisted beyond
deployment but this could be
experimental variance.

DayTrawl test results

Narrative / Comment:
Specific fuel consumption is reduced for all stages in the test with the Vaughan electromagnetic coil by between 4.698% in initial stages to 0.586%
in last stage. Over all the census stages (i.e. excluding idle stages), the specific fuel consumption is reduced by 0.996%.
Given the progressive fall in improvement between the two tests, a question is raised regarding whether the improvement is sustained in the
longer term.
Percentage differences of DayTrawl tests

Fuel Systems Testing July 2008
29
Percentage differences between DayTrawl tests - time series

Fuel Systems Testing July 2008
30
D. Ethos MaxPower Large Permanent Magnets
The experimental results are presented using both graphical and tabular formats.
Firstly the results of Baseline diagnostic tests are presented graphically, before, during and after
the main DayTrawl tests. These results are presented in confirmation that the test engine did not
suffer any major malfunction throughout the test sequence. With exceptions where indicated, all
Baseline tests are conducted on straight red diesel, without any of the technologies being
examined being deployed. Thus, there should be excellent agreement between Baseline
diagnostic tests, presuming the technology tested does not provide a effect beyond its
deployments.
The main results of comparative testing are then presented using a tabular format. Firstly, the
results of the Benchmark DayTrawl test are presented. Then the results of the DayTrawl test with
the technology deployed are presented. Finally, a table of percentage differences in quantities
found for each stage of the test cycle (presented in the first two tables) are presented. The
percentage differences are calculated as:
((Value with technology – Benchmark value) / Benchmark value) x 100
This means that a positive percentage difference means that the value with technology was higher
than the benchmark value without the technology. A negative percentage difference means that
the value with the technology was lower than the benchmark value without the technology. For
example, if the technology tested is found to ‘work’, the percentage difference in thermal efficiency
should be positive and the percentage difference in specific fuel consumption should be negative.
The main results of comparative testing are then presented using a graphical format. Firstly the
time series of the Benchmark DayTrawl test are presented. Then the time series of the DayTrawl
test with the technology deployed are presented. Finally, time series of the percentage differences
in engine performance and fuel consumption parameters are presented. The percentage
differences are calculated as:
((Value with technology – Benchmark value) / Benchmark value) x 100
This means that a positive percentage difference means that the value with technology was higher
than the benchmark value without the technology. A negative percentage difference means that
the value with the technology was lower than the benchmark value without the technology. For
example, if the technology tested is found to ‘work’, the percentage difference in thermal efficiency
should be positive and the percentage difference in specific fuel consumption should be negative.
For brevity, table and figure numbering are suspended until the Summary Results section below.
Comparison of Baseline diagnostic tests
300
310
320
330
340
350
360
370
1000 1200 1400 1600 1800 2000 2200 2400
Engine speed (rpm)
Torque (Nm)
30
40
50
60
70
80
90
Power (kW)
1 2 3 4 1 2 3 4
300
310
320
330
340
350
360
370
1000 1200 1400 1600 1800 2000 2200 2400
Engine speed (rpm)
Torque (Nm)
30
40
50
60
70
80
90
Power (kW)
1 2 3 4 1 2 3 4
2
3
4
5
6
7
1000 1200 1400 1600 1800 2000 2200 2400
Engine speed (rpm)
Consumption (g/s)
0.23
0.24
0.25
0.26
0.27
SFC (g/kWh)
1 2 3 4 1 2 3 4
2
3
4
5
6
7
1000 1200 1400 1600 1800 2000 2200 2400
Engine speed (rpm)
Consumption (g/s)
0.23
0.24
0.25
0.26
0.27
SFC (g/kWh)
1 2 3 4 1 2 3 4
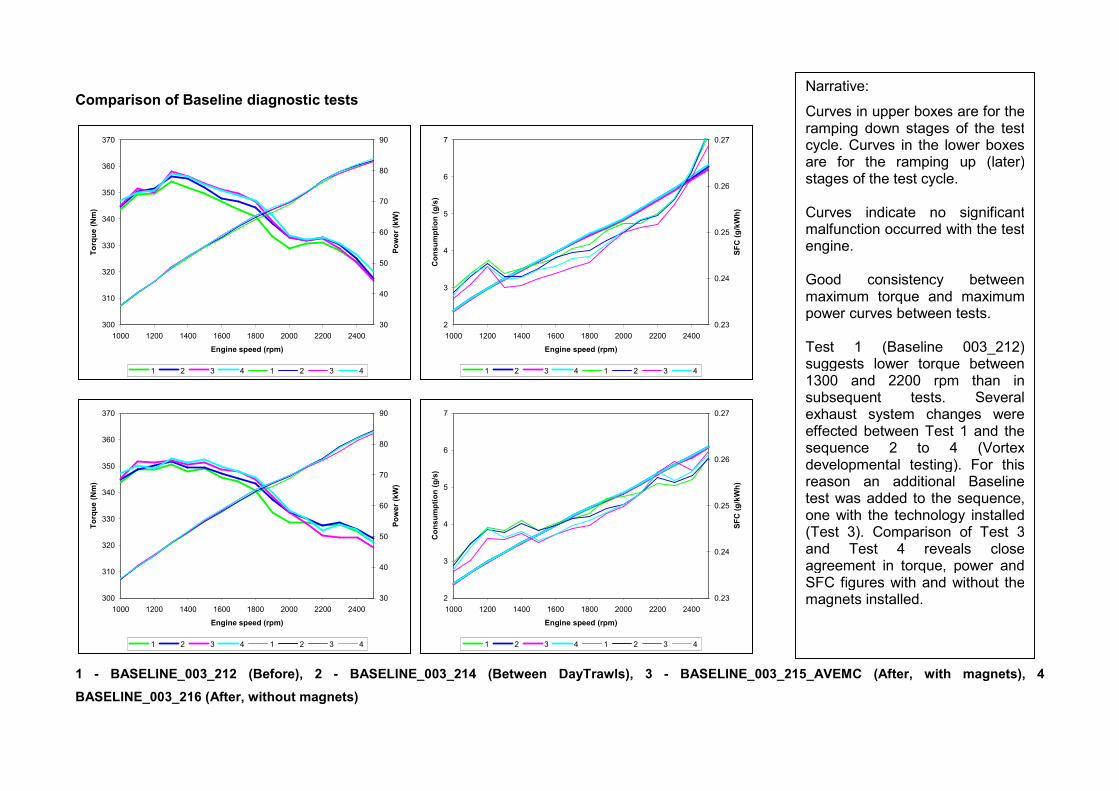
1 - BASELINE_003_212 (Before), 2 - BASELINE_003_214 (Between DayTrawls), 3 - BASELINE_003_215_AVEMC (After, with magnets), 4
BASELINE_003_216 (After, without magnets)
Narrative:
Curves in upper boxes are for the ramping down stages of the test cycle. Curves in the lower boxes are for the ramping up (later) stages of the test cycle. Curves indicate no significant malfunction occurred with the test engine. Good consistency between maximum torque and maximum power curves between tests. Test 1 (Baseline 003_212) suggests lower torque between 1300 and 2200 rpm than in subsequent tests. Several exhaust system changes were effected between Test 1 and the sequence 2 to 4 (Vortex developmental testing). For this reason an additional Baseline test was added to the sequence, one with the technology installed (Test 3). Comparison of Test 3 and Test 4 reveals close agreement in torque, power and SFC figures with and without the magnets installed.

DayTrawl test results

Narrative / Comment:
Specific fuel consumption is reduced for all stages in the test with the large Max-power permanent magnets by between 3.269% in initial stages to
0.269% in the last four hour trawl stage. Over all the census stages (i.e. excluding idle stages), the specific fuel consumption is reduced by
0.472%.
Given the progressive fall in improvement between the two tests, a question is raised regarding whether the improvement is sustained in the
longer term. This is a similar outcome to the testing with the Vaughan electromagnetic coil.
Percentage differences of DayTrawl tests

Fuel Systems Testing July 2008
34
Percentage differences between DayTrawl tests - time series

Fuel Systems Testing July 2008
35
F. Ethos MaxPower Large & Small Permanent Magnets
The experimental results are presented using both graphical and tabular formats.
Firstly the results of Baseline diagnostic tests are presented graphically, before, during and after
the main DayTrawl tests. These results are presented in confirmation that the test engine did not
suffer any major malfunction throughout the test sequence. With exceptions where indicated, all
Baseline tests are conducted on straight red diesel, without any of the technologies being
examined being deployed. Thus, there should be excellent agreement between Baseline
diagnostic tests, presuming the technology tested does not provide a effect beyond its
deployments.
The main results of comparative testing are then presented using a tabular format. Firstly, the
results of the Benchmark DayTrawl test are presented. Then the results of the DayTrawl test with
the technology deployed are presented. Finally, a table of percentage differences in quantities
found for each stage of the test cycle (presented in the first two tables) are presented. The
percentage differences are calculated as:
((Value with technology – Benchmark value) / Benchmark value) x 100
This means that a positive percentage difference means that the value with technology was higher
than the benchmark value without the technology. A negative percentage difference means that
the value with the technology was lower than the benchmark value without the technology. For
example, if the technology tested is found to ‘work’, the percentage difference in thermal efficiency
should be positive and the percentage difference in specific fuel consumption should be negative.
The main results of comparative testing are then presented using a graphical format. Firstly the
time series of the Benchmark DayTrawl test are presented. Then the time series of the DayTrawl
test with the technology deployed are presented. Finally, time series of the percentage differences
in engine performance and fuel consumption parameters are presented. The percentage
differences are calculated as:
((Value with technology – Benchmark value) / Benchmark value) x 100
This means that a positive percentage difference means that the value with technology was higher
than the benchmark value without the technology. A negative percentage difference means that
the value with the technology was lower than the benchmark value without the technology. For
example, if the technology tested is found to ‘work’, the percentage difference in thermal efficiency
should be positive and the percentage difference in specific fuel consumption should be negative.
For brevity, table and figure numbering are suspended until the Summary Results section below.
Comparison of Baseline diagnostic tests
300
310
320
330
340
350
360
370
1000 1200 1400 1600 1800 2000 2200 2400
Engine speed (rpm)
Torque (Nm)
30
40
50
60
70
80
90
Power (kW)
1 2 3 1 2 3
300
310
320
330
340
350
360
370
1000 1200 1400 1600 1800 2000 2200 2400
Engine speed (rpm)
Torque (Nm)
30
40
50
60
70
80
90
Power (kW)
1 2 3 1 2 3
2
3
4
5
6
7
1000 1200 1400 1600 1800 2000 2200 2400
Engine speed (rpm)
Consumption (g/s)
0.23
0.24
0.25
0.26
0.27
SFC (g/kWh)
1 2 3 1 2 3
2
3
4
5
6
7
1000 1200 1400 1600 1800 2000 2200 2400
Engine speed (rpm)
Consumption (g/s)
0.23
0.24
0.25
0.26
0.27
SFC (g/kWh)
1 2 3 1 2 3
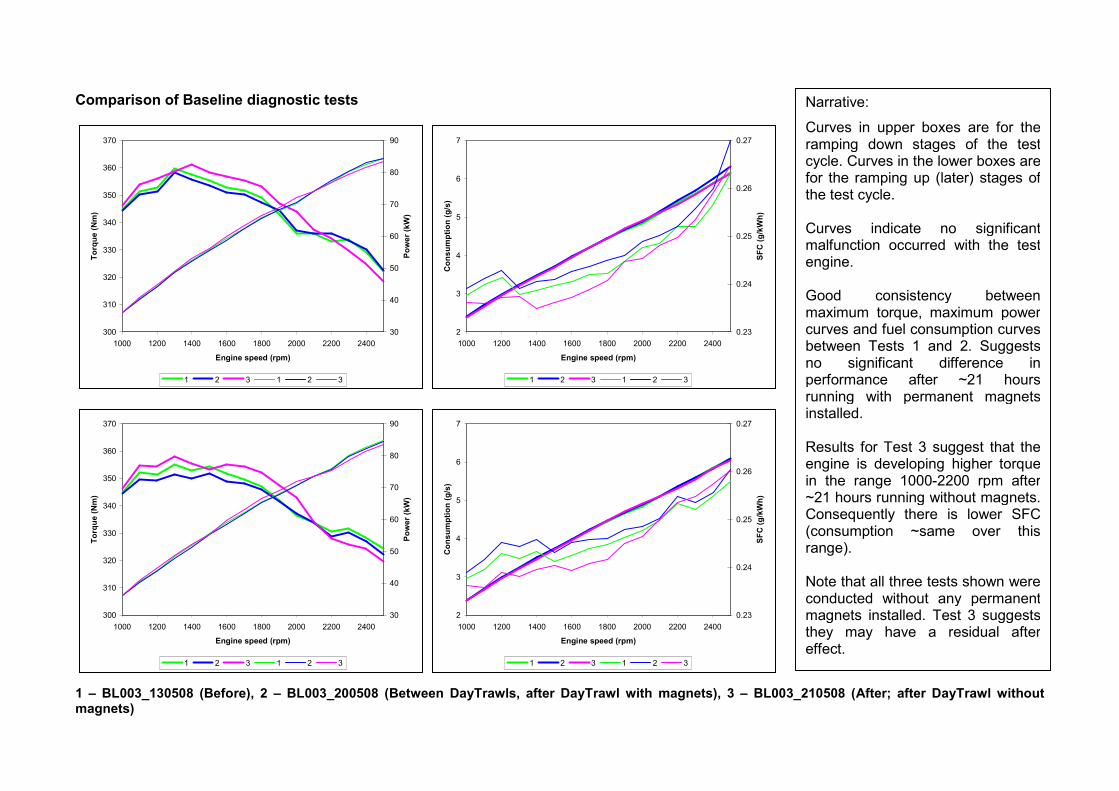
1 – BL003_130508 (Before), 2 – BL003_200508 (Between DayTrawls, after DayTrawl with magnets), 3 – BL003_210508 (After; after DayTrawl without magnets)
Narrative:
Curves in upper boxes are for the ramping down stages of the test cycle. Curves in the lower boxes are for the ramping up (later) stages of the test cycle. Curves indicate no significant malfunction occurred with the test engine. Good consistency between maximum torque, maximum power curves and fuel consumption curves between Tests 1 and 2. Suggests no significant difference in performance after ~21 hours running with permanent magnets installed. Results for Test 3 suggest that the engine is developing higher torque in the range 1000-2200 rpm after ~21 hours running without magnets. Consequently there is lower SFC (consumption ~same over this range). Note that all three tests shown were conducted without any permanent magnets installed. Test 3 suggests they may have a residual after effect.

DayTrawl test results

Narrative / Comment:
Specific fuel consumption is reduced for all stages in the test with the large and small Maxpower permanent magnets by between 1.326% and
0.255%. Over all the census stages (i.e. excluding idle stages), the specific fuel consumption is reduced by 0.431%.
This figure is comparable with the 0.472% improvement in specific fuel consumption obtained with the large permanent magnets alone. In contrast
with the tests with the large magnets alone, there does not appear to be any discernable falling trend across the stages of the tests. Whether this
is due to the presence of the small magnets, or the fact that these were installed with opposing polarity (in accordance with manufacturers
instruction on site), or some other factor, is inconclusive.
Percentage differences of DayTrawl tests

Fuel Systems Testing July 2008
39
Percentage differences between DayTrawl tests - time series

Fuel Systems Testing July 2008
40
G. MPG-CAPS Fuel combustion catalyst tablets
The experimental results are presented using both graphical and tabular formats.
Firstly the results of Baseline diagnostic tests are presented graphically, before, during and after
the main DayTrawl tests. These results are presented in confirmation that the test engine did not
suffer any major malfunction throughout the test sequence. With exceptions where indicated, all
Baseline tests are conducted on straight red diesel, without any of the technologies being
examined being deployed. Thus, there should be excellent agreement between Baseline
diagnostic tests, presuming the technology tested does not provide a effect beyond its
deployments.
The main results of comparative testing are then presented using a tabular format. Firstly, the
results of the Benchmark DayTrawl test are presented. Then the results of the DayTrawl test with
the technology deployed are presented. Finally, a table of percentage differences in quantities
found for each stage of the test cycle (presented in the first two tables) are presented. The
percentage differences are calculated as:
((Value with technology – Benchmark value) / Benchmark value) x 100
This means that a positive percentage difference means that the value with technology was higher
than the benchmark value without the technology. A negative percentage difference means that
the value with the technology was lower than the benchmark value without the technology. For
example, if the technology tested is found to ‘work’, the percentage difference in thermal efficiency
should be positive and the percentage difference in specific fuel consumption should be negative.
The main results of comparative testing are then presented using a graphical format. Firstly the
time series of the Benchmark DayTrawl test are presented. Then the time series of the DayTrawl
test with the technology deployed are presented. Finally, time series of the percentage differences
in engine performance and fuel consumption parameters are presented. The percentage
differences are calculated as:
((Value with technology – Benchmark value) / Benchmark value) x 100
This means that a positive percentage difference means that the value with technology was higher
than the benchmark value without the technology. A negative percentage difference means that
the value with the technology was lower than the benchmark value without the technology. For
example, if the technology tested is found to ‘work’, the percentage difference in thermal efficiency
should be positive and the percentage difference in specific fuel consumption should be negative.
For brevity, table and figure numbering are suspended until the Summary Results section below.

Comparison of Baseline diagnostic tests
300
310
320
330
340
350
360
370
1000 1200 1400 1600 1800 2000 2200 2400
Engine speed (rpm)
Torque (Nm)
30
40
50
60
70
80
90
Power (kW)
1 2 3 1 2 3
300
310
320
330
340
350
360
370
1000 1200 1400 1600 1800 2000 2200 2400
Engine speed (rpm)
Torque (Nm)
30
40
50
60
70
80
90
Power (kW)
1 2 3 1 2 3
2
3
4
5
6
7
1000 1200 1400 1600 1800 2000 2200 2400
Engine speed (rpm)
Consumption (g/s)
0.23
0.24
0.25
0.26
0.27
SFC (g/kWh)
1 2 3 1 2 3
2
3
4
5
6
7
1000 1200 1400 1600 1800 2000 2200 2400
Engine speed (rpm)
Consumption (g/s)
0.23
0.24
0.25
0.26
0.27
SFC (g/kWh)
1 2 3 1 2 3
1 – BL003_210508 (Before), 2 – BL003_140608 (Between DayTrawls – straight Red Diesel), 3 – BL003_150608 (After treatment with MPG-CAPS)
Narrative:
Curves in upper boxes are for the ramping down stages of the test cycle. Curves in the lower boxes are for the ramping up (later) stages of the test cycle. Curves indicate no significant malfunction occurred with the test engine. Good consistency between maximum torque, maximum power curves and fuel consumption curves between Tests 1 and 3. Tests 1 and 3 appear to deliver higher torque, with consequent superiority in SFC, in comparison to Test 2. Test 2 is a diagnostic test undertaken after around 45 hours running ‘free’ from contemporaneous effect of any technological enhancement tested. The performance curves should thus compare well with BL003_130508_002 (the Baseline test conducted to open the large and small permanent magnets work) – which it does. Test 1 may still be influenced by effects of the permanent magnets – as noted previously. The consequence is that Tests 1 & 3 may reflect after effects of 2 different technologies.

DayTrawl test results

Narrative / Comment:
Specific fuel consumption is reduced for all stages in the test where the fuel is treated with MPG-CAPS by between 6.167% and 0.076%. Over all
the census stages (i.e. excluding idle stages), the specific fuel consumption is reduced by 1.075%. It is also worth noting that specific fuel
consumption figures during the 4 hour trawl stages are 1.017%, 0.974% and 0.848%, that is, they are broadly maintained through these stages
where by far the most load is put on the test engine. This is despite the evident reduction in fuel savings as the test progresses from stage to
stage.
Percentage differences of DayTrawl tests

Fuel Systems Testing July 2008
44
Percentage differences between DayTrawl tests - time series
Fuel Systems Testing July 2008
45
E. Belesta LC2 Lubricating oil additive – Phases A and B
The experimental results are presented using both graphical and tabular formats.
Firstly the results of Baseline diagnostic tests are presented graphically, before, during and after
the main DayTrawl tests. These results are presented in confirmation that the test engine did not
suffer any major malfunction throughout the test sequence. With exceptions where indicated, all
Baseline tests are conducted on straight red diesel, without any of the technologies being
examined being deployed. Thus, there should be excellent agreement between Baseline
diagnostic tests, presuming the technology tested does not provide a effect beyond its
deployments.
The main results of comparative testing are then presented using a tabular format. Firstly, the
results of the Benchmark DayTrawl test are presented. Then the results of the DayTrawl test with
the technology deployed are presented. Finally, a table of percentage differences in quantities
found for each stage of the test cycle (presented in the first two tables) are presented. The
percentage differences are calculated as:
((Value with technology – Benchmark value) / Benchmark value) x 100
This means that a positive percentage difference means that the value with technology was higher
than the benchmark value without the technology. A negative percentage difference means that
the value with the technology was lower than the benchmark value without the technology. For
example, if the technology tested is found to ‘work’, the percentage difference in thermal efficiency
should be positive and the percentage difference in specific fuel consumption should be negative.
The main results of comparative testing are then presented using a graphical format. Firstly the
time series of the Benchmark DayTrawl test are presented. Then the time series of the DayTrawl
test with the technology deployed are presented. Finally, time series of the percentage differences
in engine performance and fuel consumption parameters are presented. The percentage
differences are calculated as:
((Value with technology – Benchmark value) / Benchmark value) x 100
This means that a positive percentage difference means that the value with technology was higher
than the benchmark value without the technology. A negative percentage difference means that
the value with the technology was lower than the benchmark value without the technology. For
example, if the technology tested is found to ‘work’, the percentage difference in thermal efficiency
should be positive and the percentage difference in specific fuel consumption should be negative.
For brevity, table and figure numbering are suspended until the Summary Results section below.

Comparison of Baseline diagnostic tests
300
310
320
330
340
350
360
370
1000 1200 1400 1600 1800 2000 2200 2400
Engine speed (rpm)
Torque (Nm)
30
40
50
60
70
80
90
Power (kW)
1 2 3 4 5 1 2 3 4 5
300
310
320
330
340
350
360
370
1000 1200 1400 1600 1800 2000 2200 2400
Engine speed (rpm)
Torque (Nm)
30
40
50
60
70
80
90
Power (kW)
1 2 3 4 5 1 2 3 4 5
2
3
4
5
6
7
1000 1200 1400 1600 1800 2000 2200 2400
Engine speed (rpm)
Consumption (g/s)
0.23
0.24
0.25
0.26
0.27
SFC (g/kWh)
1 2 3 4 5 1 2 3 4 5
2
3
4
5
6
7
1000 1200 1400 1600 1800 2000 2200 2400
Engine speed (rpm)
Consumption (g/s)
0.23
0.24
0.25
0.26
0.27
SFC (g/kWh)
1 2 3 4 5 1 2 3 4 5
1 – BL003_150608 (After treatment with MPG-CAPS, old oil), 2 – BL003_160608 (new oil), 3 – BL003_170608 (same oil, after DayTrawl), 4 – BL003_180608 (same oil with 5% LC5), 5 – BL003_200608 (same oil with 5% LC5, after DayTrawl)
Narrative:
Curves in upper boxes are for the ramping down stages of the test cycle. Curves in the lower boxes are for the ramping up (later) stages of the test cycle. Curves indicate no significant malfunction occurred with the test engine. Good consistency between Tests 1 and 2. Indicates similar engine condition from end of MPG-CAPS work and start of Belesta work. Much higher torque and much lower SFC when comparing Test 2 and Test 3. Suggests that new lubricating oil may need a ‘run in’ before it becomes really effective. Lower torque and higher SFC when comparing Test 3 and Test 4 or Test 2 and Test 4. Comparing Test 4 with Test 5 or Test 2 with Test 5 reveals another leap in torque and further reduction in SFC. This suggests that after adding the LC2 lubricant, the oil and additive may require a ‘run in’ before becoming really effective. Through this sequence of testing (including 2 intermediate DayTrawl cycles) at 1700 rpm torque has increased by 2.1% at full throttle and SFC has improved by 1.1% when ramping down and 2.3% and 1.3% when ramping up. N.B. These tests were conducted with MPG-CAPS remnant concentrations at 30% of FFI recommended levels. This was done to ensure all tests in the Belesta sequence could be conducted on the same batch of fuel.

DayTrawl test results
Narrative / Comment:
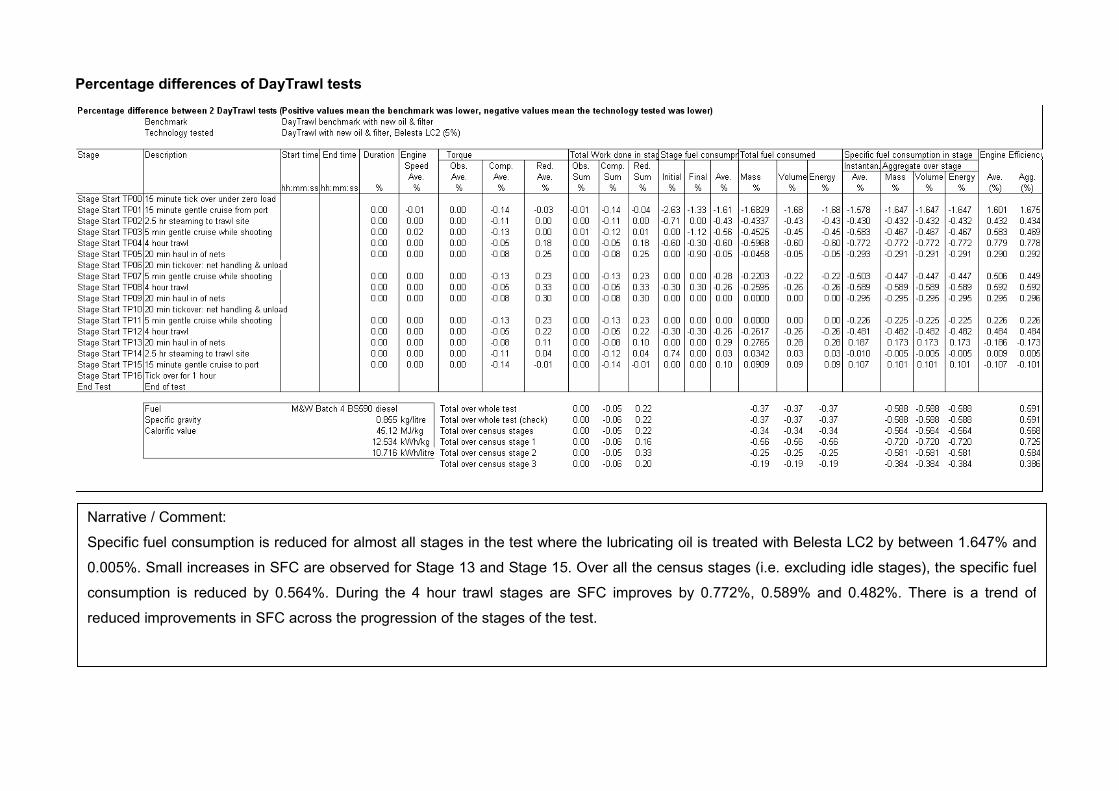
Specific fuel consumption is reduced for almost all stages in the test where the lubricating oil is treated with Belesta LC2 by between 1.647% and
0.005%. Small increases in SFC are observed for Stage 13 and Stage 15. Over all the census stages (i.e. excluding idle stages), the specific fuel
consumption is reduced by 0.564%. During the 4 hour trawl stages are SFC improves by 0.772%, 0.589% and 0.482%. There is a trend of
reduced improvements in SFC across the progression of the stages of the test.
Percentage differences of DayTrawl tests
Fuel Systems Testing July 2008
49
Percentage differences between DayTrawl tests - time series

Fuel Systems Testing July 2008
50
E. Belesta LC2 Lubricating oil additive – Phases C and D
The experimental results are presented using both graphical and tabular formats.
Firstly the results of Baseline diagnostic tests are presented graphically, before, during and after
the main DayTrawl tests. These results are presented in confirmation that the test engine did not
suffer any major malfunction throughout the test sequence. With exceptions where indicated, all
Baseline tests are conducted on straight red diesel, without any of the technologies being
examined being deployed. Thus, there should be excellent agreement between Baseline
diagnostic tests, presuming the technology tested does not provide an effect beyond its
deployments.
The main results of comparative testing are then presented using a tabular format. Firstly, the
results of the Benchmark DayTrawl test are presented. Then the results of the DayTrawl test with
the technology deployed are presented. Finally, a table of percentage differences in quantities
found for each stage of the test cycle (presented in the first two tables) are presented. The
percentage differences are calculated as:
((Value with technology – Benchmark value) / Benchmark value) x 100
This means that a positive percentage difference means that the value with technology was higher
than the benchmark value without the technology. A negative percentage difference means that
the value with the technology was lower than the benchmark value without the technology. For
example, if the technology tested is found to ‘work’, the percentage difference in thermal efficiency
should be positive and the percentage difference in specific fuel consumption should be negative.
The main results of comparative testing are then presented using a graphical format. Firstly the
time series of the Benchmark DayTrawl test are presented. Then the time series of the DayTrawl
test with the technology deployed are presented. Finally, time series of the percentage differences
in engine performance and fuel consumption parameters are presented. The percentage
differences are calculated as:
((Value with technology – Benchmark value) / Benchmark value) x 100
This means that a positive percentage difference means that the value with technology was higher
than the benchmark value without the technology. A negative percentage difference means that
the value with the technology was lower than the benchmark value without the technology. For
example, if the technology tested is found to ‘work’, the percentage difference in thermal efficiency
should be positive and the percentage difference in specific fuel consumption should be negative.
For brevity, table and figure numbering are suspended until the Summary Results section below.

Comparison of Baseline diagnostic tests
300
310
320
330
340
350
360
370
1000 1200 1400 1600 1800 2000 2200 2400
Engine speed (rpm)
Torque (Nm)
30
40
50
60
70
80
90
Power (kW)
1 2 3 4 5 1 2 3 4 5
300
310
320
330
340
350
360
370
1000 1200 1400 1600 1800 2000 2200 2400
Engine speed (rpm)
Torque (Nm)
30
40
50
60
70
80
90
Power (kW)
1 2 3 4 5 1 2 3 4 5
2
3
4
5
6
7
1000 1200 1400 1600 1800 2000 2200 2400
Engine speed (rpm)
Consumption (g/s)
0.23
0.24
0.25
0.26
0.27
SFC (g/kWh)
1 2 3 4 5 1 2 3 4 5
2
3
4
5
6
7
1000 1200 1400 1600 1800 2000 2200 2400
Engine speed (rpm)
Consumption (g/s)
0.23
0.24
0.25
0.26
0.27
SFC (g/kWh)
1 2 3 4 5 1 2 3 4 5
1 – BL003_200608 (same oil with 5% LC2, after DayTrawl), 2 – BL003_010708 (new oil, 5% LC2, 2nd rinse), 3 – BL003_030708 (new oil, 5% LC2, 2
nd rinse,
after DayTrawl), 4 – BL003_140708 (new oil again, no LC2), 5 – BL003_070708 (new oil again, no LC2, after DayTrawl)
Narrative:
Curves in upper boxes are for the ramping down stages of the test cycle. Curves in the lower boxes are for the ramping up (later) stages of the test cycle. Curves indicate no significant malfunction occurred with the test engine. Comparison between Tests 1 and 2, and 2 and 3 suggests, again, that when adding a new batch of lubricating oil (with or without lubricant additive), it seems that the new oil needs ‘running in’ before having full effect. There seems little difference between Tests 1 and 3, suggesting that the lubricating oil may have been changed ‘prematurely’ (of course, this occurred simply for the purposes of the tests). Comparing Test 3 and 4 leads to a small reduction in torque across the range and a small increase in SFC. Comparing Test 4 and Test 5 again confirms the idea that new oil (in this case without LC2) needs a run in period. Comparing Test 1 and Test 5 reveals consistent performance in torque, power and SFC. This suggests a possible residual after effect of LC2 on engine performance, even when virtually all of the oil containing LC2 is removed. N.B. These tests were conducted with MPG-CAPS remnant concentrations at 30% of FFI recommended levels. This was done to ensure all tests in the Belesta sequence could be conducted on the same batch of fuel.

DayTrawl test results

Narrative / Comment:
This table compares the performance of the test engine at the point where the engine has had a second oil change with oil dosed with Belesta LC2
in a 5% by volume proportion (before) with the performance when the engine has had a third oil change without the oil being conditioned with LC2
(after). Improvements in SFC are obtained across all stages with a third oil change and these improvements are relatively consistent. Across all
census stages, the incremental improvement in SFC is 0.920%.
Percentage differences of DayTrawl tests

Fuel Systems Testing July 2008
54
Percentage differences between DayTrawl tests - time series

Narrative / Comment:
This table compares the performance of the test engine at the benchmark condition (when the engine had its first oil change without the oil dosed
with Belesta LC2) with the performance when the engine had its second oil change with the oil being conditioned with LC2 (after). As the stages
progress, the general trend is that the SFC improves with the “2nd rinse” of LC2, but the lubricant additive consistently outperforms the straight oil
(0.426%, 0.479% and 0.423%) during the 4 hour long trawl stages of the cycle. Over all census stages the SFC improvement is 0.363%.
Further comparison between DayTrawl tests between Phase A and Phase C

Narrative / Comment:
This table compares the starting DayTrawl test in the Belesta sequence of tests, with the closing DayTrawl test in the Belesta sequence of tests. In
each case, the engine has received an oil change and an oil filter change only, that is, the LC2 lubricant conditioner was not added in either case.
The result is interesting as an improvement in SFC of 1.280% is obtained across all the census stages of the tests.
Further comparison of DayTrawl tests between Phase A and Phase D
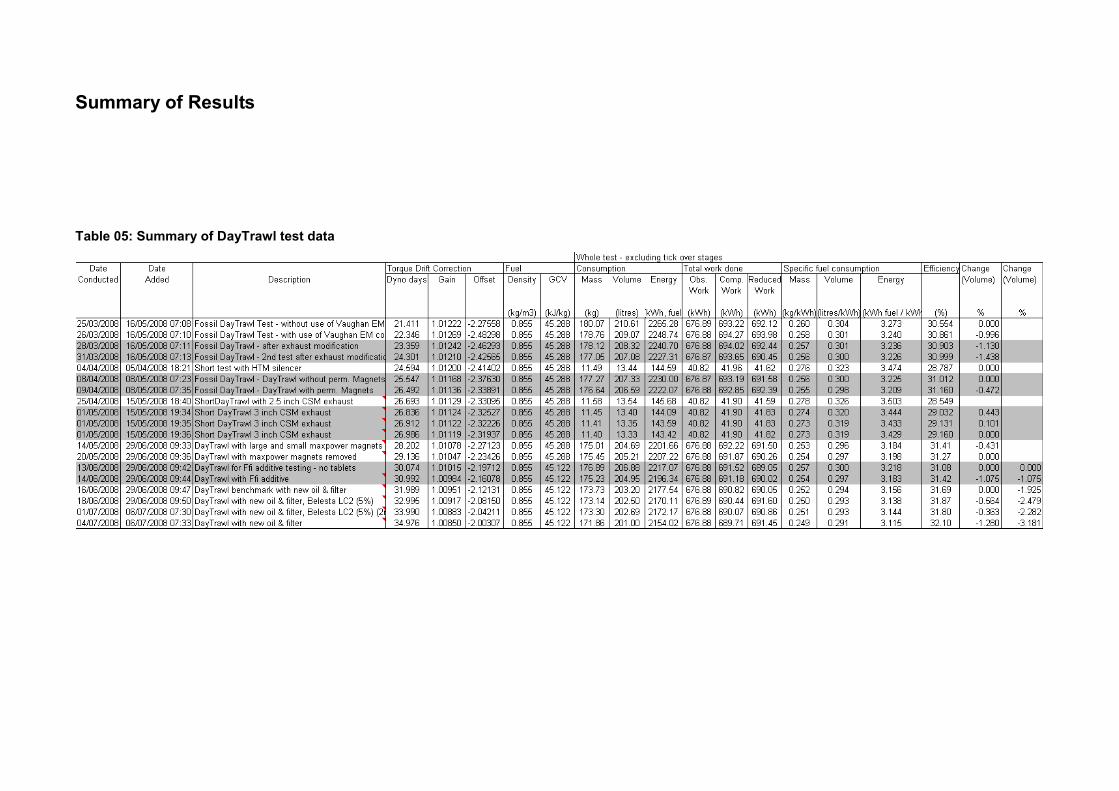
Summary of Results
Table 05: Summary of DayTrawl test data

Fuel Systems Testing July 2008
58
Discussion and Conclusions
Key Findings
Results from all DayTrawl tests relevant to the Fuel Systems Testing work reported herein are
brought together in Table 05 above. The central findings of the test work are as follows:
• The FuelVantage Digital Fuel Treatment system, marketed by Vaughan Industries Ltd
(http://www.magyk.com/) brought about a 1.00% improvement in specific fuel consumption for
the CSM Dynamometer Test Cell diesel engine.
• The Ethos Maxpower large permanent magnet fuel conditioner system, marketed by
Ethosworld.com Ltd (http://www.max-power.org.uk/index.php) brought about a 0.47%
improvement in specific fuel consumption for the CSM Dynamometer Test Cell diesel engine.
• Belester LC2, a lubricating oil additive marketed by Belesta (http://www.belesta.com/), a
subsidiary of Belzona Polymerics Limited (http://www.belzona.com/) brought about specific
fuel consumption savings of between 0.36% and 0.56%.
• Further testing of both large and small Max-power permanent magnets, marketed by
Ethosworld.com Ltd (http://www.max-power.org.uk/index.php), and the latter being applied
with opposing poles on the fuel lines leading to individual injectors, brought about specific fuel
consumption savings of 0.43%.
• MPG-CAPS fuel combustion catalyst tablets, marketed by Fuel Freedom International, FFi
Europe Ltd, (http://www.myffi.biz/t-MPG-CAPS.aspx) brought about specific fuel consumption
savings of 1.08%
• It is possible that combinations of technologies could produce further enhancements. For
example, providing an engine treatment dose of MPG-CAPS and following this with a
sequence of oil changes (with and without Belesta LC2) brought about a 3.18% improvement
in specific fuel consumption.
• The methodology for calculating these changes has been refined in comparison to results
presented in the Diesel Fuel Additives Testing; An abstracted report from the Biofuels for the
Fishing Industry project”, prepared for SeaFISH in February 2008. The revised methodology
has been applied to the data with the result that Additive A produces a 0.44% improvement,
but the remaining additives B to G produce improvements no greater than 0.08%
improvement.
• Exhaust systems, marketed by Vortex Performance Exhausts Ltd (http://www.vortex-
performance-exhausts.co.uk/index.php) ultimately did not feature in the comparative testing
programme. Work for Vortex is ongoing but is still at the developmental testing stage at
present.

Fuel Systems Testing July 2008
59
• The Calorific Value Enhancer (CVE) system, marketed by Enersol Ltd
(http://www.enersolcorp.com/motive/index.cfm) ultimately did not feature in the comparative
testing programme as Enersol were undertaking developmental testing elsewhere.
Indicators for Further Work
A modified DayTrawl test schedule
Through interactions with suppliers and manufacturers during the progress of the work, accounts
have been provided of in-service tests conducted elsewhere where the improvements offered by
products have been greater in magnitude than have been determined here. While the evidence
base for such tests remains uncertain, the possibility of fuel savings in service of greater
magnitude than determined herein cannot be ruled out. This is in part due to the specific nature of
the DayTrawl test itself.
3.27
3.28
3.29
3.30
3.31
3.32
3.33
3.34
3.35
3.36
3.37
00:00:00 00:06:00 00:12:00 00:18:00 00:24:00 00:30:00 00:36:00 00:42:00 00:48:00 00:54:00 01:00:00
Consumption (g/s)
LC2 Tests - Phase A, Stage TP08 LC2 Tests - Phase D, Stage TP08
Figure 12: Fuel consumption transients after change from DayTrawl Stage TP07 to TP08 (4 hour
trawl) at time 00:00:00.
For the DayTrawl tests reported in this work, the stage fuel consumption figures indicate that for
the 4 hour trawl stages, fuel consumption at the beginning of the stage is greater than the fuel
consumption at the end of the stage whereas the final and average stage fuel consumption values
are invariably similar. This suggests that fuel consumption is higher during or immediately after
transients in load on the engine; fuel consumption drops when the engine has settled to a new

Fuel Systems Testing July 2008
60
operating condition within the test schedule and is confirmed by the plot of minute average fuel
consumption for the first hour of a 4 hour trawl stage presented in Figure 12. For both tests
presented, the fuel consumption immediately after the stage change is approximately 1.5% higher
than the ‘asymptotic’ value.
Practically, during in-service operation, the load on the engine is likely to be varying continuously,
the degree of variation depending on, among other factors, the severity of the wave, wind and
current conditions. As the load varies, the engine rotational speed will vary but will recover toward
a value determined by the nominal rack position, effected by the engine speed control function of
the governor. The governor function allows more or less fuel to be metered to the engine injectors
if the engine speed is lower than or higher than, respectively, the value defined by the nominal rack
position set by the skipper. If, during in-service operation, the load on the engine remains steady
(as is specified during each stage of the DayTrawl test schedule), the governor will meter precisely
the amount of fuel required to keep the engine speed constant, and at a speed corresponding to
the nominal rack position set by the skipper.
Due to the constant loading conditions defined and maintained by the SCADA system, at present
the various stages of the DayTrawl test cycle must be considered rather ideal in nature, because
they effectively factor out the role of the governor in regulating the engine speed in the face of
varying engine load. It is to be expected that a dynamic loading condition on the engine is closer to
the norm rather than the exception in in-service operation and thus in consideration of comparative
testing results herein, centred around the current DayTrawl test cycle, it should be noted that they
are indicative of the fuel savings obtainable during the most ideal operating conditions of weather
and tide.
Of course this raises the question of how fuel economy is affected under less than ideal conditions.
After a large transient in loading, from 38Nm to 287Nm between stages 07 and 08, Figure 12
indicates that fuel consumption increases. These increases do not reflect the action of the
governor, as explained above, rather they reflect the ultimate establishment of a new thermal
equilibrium of the engine with its operating environment. If the regulating function of the governor
was embodied in the DayTrawl test schedule by superimposing a low amplitude load variation over
the steady loading values of each stage, then it is suspected that the aggregate engine efficiency
would reduce further (fuel consumption would increase further for the same work delivered) in
comparison to the results obtained currently. Such measures are presented in Figure 13 with the
period of variation greatly exaggerated for illustrative purposes only. A key point to note is although
the load variations (and the consequent engine speed variations) appear rather random, the
SCADA system would ensure that this prescribed duty was followed exactly, DayTrawl test, after
DayTrawl test.

Fuel Systems Testing July 2008
61
Small swellload variation
Large swellload variation
Figure 13: Illustration of proposed improvement of DayTrawl test schedule to reflect dynamic loading
environment. Period of variations greatly exaggerated.
The schematic schedule illustrated in Figure 13 could be ‘synthesized’ or alternatively, and more
appropriately, torque and engine speed instrumentation could be installed on an in-service vessel
and record the actual duty cycle and the test cell could be programmed to repeat the observed
cycle exactly - and repeatedly.
Whether or not the effect of any of the technologies tested herein would be enhanced under a
revised ‘dynamic loading’ DayTrawl test schedule depends on whether or not they have been
designed to suit such dynamic operating conditions.
Heat recovery options
The ~600ºC exhaust gas temperatures measured suggests a Carnot efficiency of 67% for the
engine. Assuming that the test engine follows a practical ideal diesel cycle, with compression ratio
of 16:1 and a cut-off ratio of between 3 and 4, suggests a practical ideal efficiency between 53%
and 57%. Within the DayTrawl test cycle results presented herein, the highest observed thermal
efficiency of the diesel engine in converting energy in the fuel into useful shaft work is around 35%.
Undoubtedly some of the work developed by the engine will be used to power auxiliary engine
components, such as the fuel pump, which has reduced the observed efficiency to this value.
However, whichever measure of efficiency is adopted it is clear that a substantial amount of the
energy contained within the fuel is ultimately delivered as heat; 65% of the energy in the fuel is

Fuel Systems Testing July 2008
62
dissipated as heat taking the observed efficiency as the ‘safest’ value. The results of the tests
reported herein and in the earlier fuel additives report, suggest that the magnitudes of fuel
economy improvements brought about by the various technologies are likely to be small. To have a
beneficial effect on the economics of fishing comparable with the significance of the fluctuations in
the price of fuel, reductions in fuel consumption may need to be more significant. Given the
magnitude of the fuel energy dissipated as heat, utilisation of this heat could provide more
substantial economic benefits in two ways suggested below:
• Utilisation of recovered heat to drive ammonia absorption refrigerators that displace
auxiliary diesels driving vapour compression refrigerators. Cost savings are realised by no
longer needing to fuel the auxiliary diesel engine. Coefficients of performance of certain
absorption refrigeration cycles are in the range of 40%, meaning that around 40% of the
high grade heating power of the exhaust gas steam could be used to provide cooling power
to fish stores. A 100kW diesel engine with a thermal efficiency of 35% may be able to
provide refrigeration power of the same order.
• Utilisation of recovered heat to produce steam to drive a generator to power auxiliary vessel
systems, displacing diesel generating sets. Cost savings are realised by no longer needing
to fuel the auxiliary diesel genset. Rankine cycle efficiency would be around 30% meaning
that around 30% of the energy available in the high grade (600ºC) heat in the exhaust gas
stream could be converted into electrical energy. A 100kW diesel engine with a thermal
efficiency of 35% may be able to provide electrical power of the same order.
In the face of prolonged high prices for marine fuel, both of these options would be worth
investigation with a desk based feasibility study in the first instance.
Further investigation of (electro-)magnetic fuel conditioning technologies
Undoubtedly the topic of (electro-)magnetic fuel conditioning technology ignites huge debate in
those interested in the subject of improving fuel economy. One only has to peruse one of the many
internet chat sites dealing with the subject (such as:
http://boards.fool.co.uk/Message.asp?mid=10969874&sort=whole) to note that, those promoting
the technology have genuine belief in and stand by their products, mainly on the basis of a body of
empirical evidence built up through (satisfied!) client interactions. At the same time, there are other
individuals who quickly become incensed with what they view as undoubtedly ‘flaky’, ‘erroneous’ or
even ‘disingenuous’ attempts to provide scientific evidence that testifies to the efficacy or otherwise
of (electro-)magnetic technologies in improving fuel economy.
The electrical conductivity of diesel hydrocarbons lies somewhere 2.5 x 10⁻¹⁰ S/m and 1 x 10-11
S/m, the former corresponding to high sulphur diesel fuel and the latter corresponding to ultra low
sulphur diesel fuel. In comparison, water has an electrical conductivity around 5 orders of
magnitude higher. With electrical conductivities as low as that for diesel, it is straightforward to
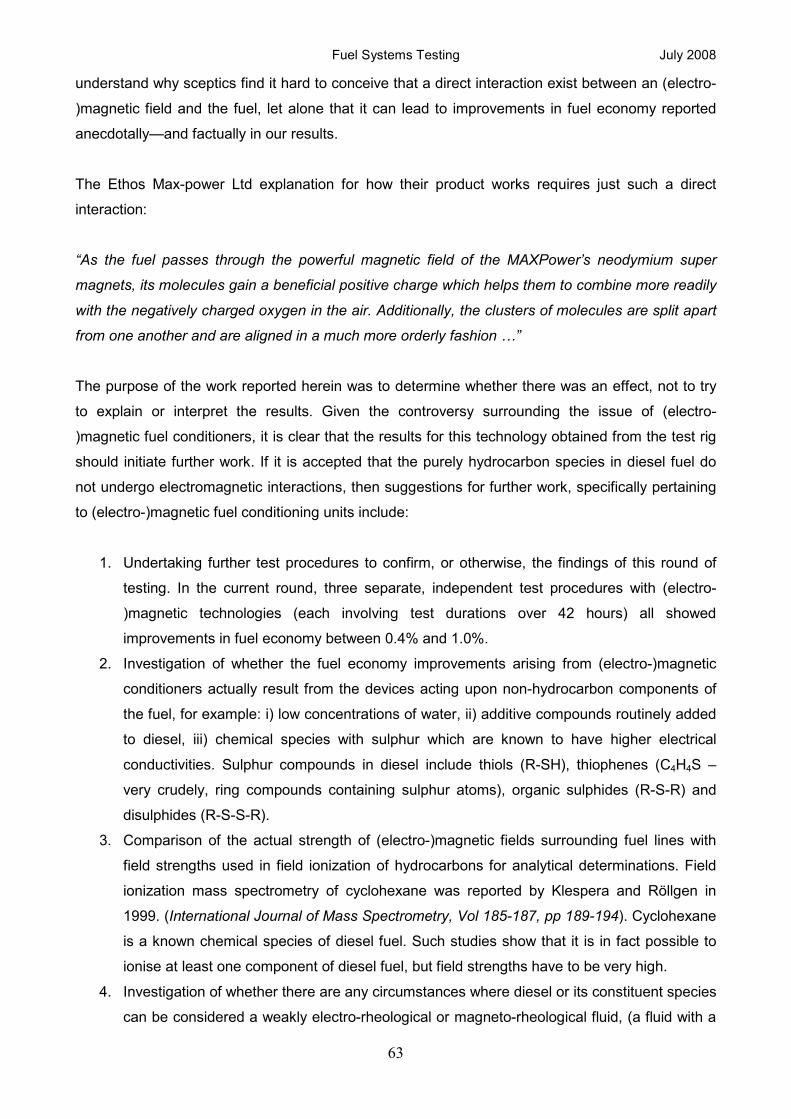
Fuel Systems Testing July 2008
63
understand why sceptics find it hard to conceive that a direct interaction exist between an (electro-
)magnetic field and the fuel, let alone that it can lead to improvements in fuel economy reported
anecdotally—and factually in our results.
The Ethos Max-power Ltd explanation for how their product works requires just such a direct
interaction:
“As the fuel passes through the powerful magnetic field of the MAXPower’s neodymium super
magnets, its molecules gain a beneficial positive charge which helps them to combine more readily
with the negatively charged oxygen in the air. Additionally, the clusters of molecules are split apart
from one another and are aligned in a much more orderly fashion …”
The purpose of the work reported herein was to determine whether there was an effect, not to try
to explain or interpret the results. Given the controversy surrounding the issue of (electro-
)magnetic fuel conditioners, it is clear that the results for this technology obtained from the test rig
should initiate further work. If it is accepted that the purely hydrocarbon species in diesel fuel do
not undergo electromagnetic interactions, then suggestions for further work, specifically pertaining
to (electro-)magnetic fuel conditioning units include:
1. Undertaking further test procedures to confirm, or otherwise, the findings of this round of
testing. In the current round, three separate, independent test procedures with (electro-
)magnetic technologies (each involving test durations over 42 hours) all showed
improvements in fuel economy between 0.4% and 1.0%.
2. Investigation of whether the fuel economy improvements arising from (electro-)magnetic
conditioners actually result from the devices acting upon non-hydrocarbon components of
the fuel, for example: i) low concentrations of water, ii) additive compounds routinely added
to diesel, iii) chemical species with sulphur which are known to have higher electrical
conductivities. Sulphur compounds in diesel include thiols (R-SH), thiophenes (C4H4S –
very crudely, ring compounds containing sulphur atoms), organic sulphides (R-S-R) and
disulphides (R-S-S-R).
3. Comparison of the actual strength of (electro-)magnetic fields surrounding fuel lines with
field strengths used in field ionization of hydrocarbons for analytical determinations. Field
ionization mass spectrometry of cyclohexane was reported by Klespera and Röllgen in
1999. (International Journal of Mass Spectrometry, Vol 185-187, pp 189-194). Cyclohexane
is a known chemical species of diesel fuel. Such studies show that it is in fact possible to
ionise at least one component of diesel fuel, but field strengths have to be very high.
4. Investigation of whether there are any circumstances where diesel or its constituent species
can be considered a weakly electro-rheological or magneto-rheological fluid, (a fluid with a

Fuel Systems Testing July 2008
64
viscosity characteristic in shear that is dependent on the strength of (electro-)magnetic field
applied). Experimental work with paraffin-water emulsions reported by C. Balan, C.
Broboana D., Gheorghiu, E. and Vékás, 2008 (J. Non-Newtonian Fluid Mech. Vol 154, pp
22–30) suggest that this may not be the case, although this is being queried. However, the
viscosity of electro- or magneto- rheological fluids can reduce in the presence of the
respective fields. Reductions in viscosity may produce improvements in atomisation of fuel
at the injectors.