fuel switching and infant health: evidence from lpg ... and motivation the policy literature data...
TRANSCRIPT
Background and Motivation The Policy Literature Data Results Conclusion
Fuel Switching and Infant Health:Evidence from LPG Subsidy in Indonesia
Imelda
Department of Economics, Universities of Hawai’i at Manoa
August 8, 2016

Background and Motivation The Policy Literature Data Results Conclusion
Cooking with Wood
Background and Motivation The Policy Literature Data Results Conclusion
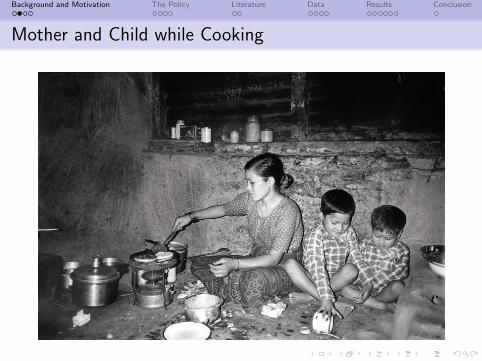
Mother and Child while Cooking
Background and Motivation The Policy Literature Data Results Conclusion
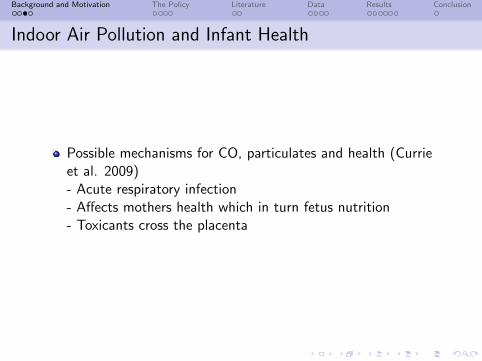
Indoor Air Pollution and Infant Health
Possible mechanisms for CO, particulates and health (Currieet al. 2009)- Acute respiratory infection- Affects mothers health which in turn fetus nutrition- Toxicants cross the placenta
Background and Motivation The Policy Literature Data Results Conclusion
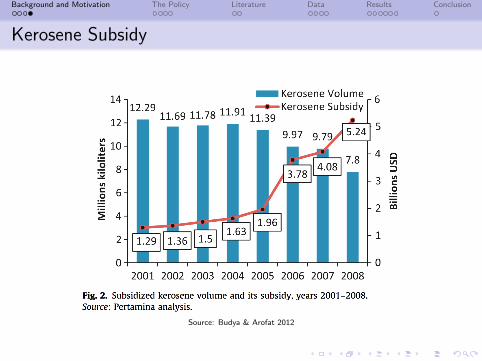
Kerosene Subsidy
Source: Budya & Arofat 2012
Background and Motivation The Policy Literature Data Results Conclusion
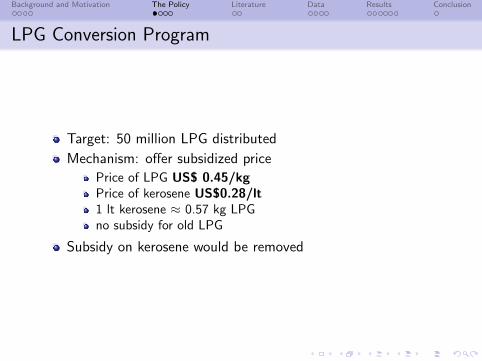
LPG Conversion Program
Target: 50 million LPG distributed
Mechanism: offer subsidized price
Price of LPG US$ 0.45/kgPrice of kerosene US$0.28/lt1 lt kerosene ≈ 0.57 kg LPGno subsidy for old LPG
Subsidy on kerosene would be removed
Background and Motivation The Policy Literature Data Results Conclusion
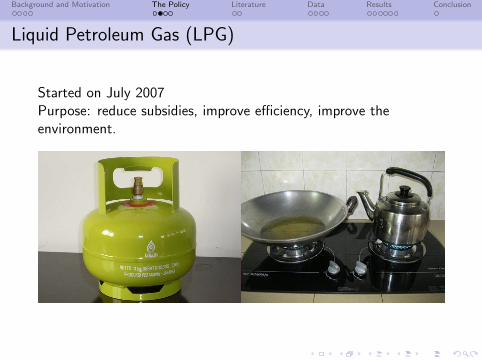
Liquid Petroleum Gas (LPG)
Started on July 2007Purpose: reduce subsidies, improve efficiency, improve theenvironment.
Background and Motivation The Policy Literature Data Results Conclusion
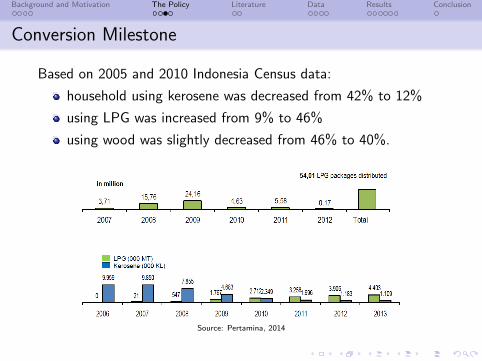
Conversion Milestone
Based on 2005 and 2010 Indonesia Census data:
household using kerosene was decreased from 42% to 12%
using LPG was increased from 9% to 46%
using wood was slightly decreased from 46% to 40%.
Source: Pertamina, 2014
Background and Motivation The Policy Literature Data Results Conclusion
Question: What was the effect of the policy on infant mortality?
Background and Motivation The Policy Literature Data Results Conclusion
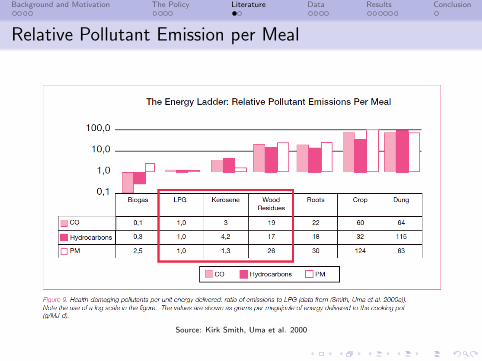
Relative Pollutant Emission per Meal
Source: Kirk Smith, Uma et al. 2000
Background and Motivation The Policy Literature Data Results Conclusion
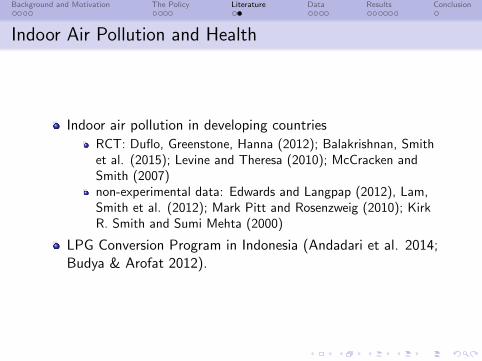
Indoor Air Pollution and Health
Indoor air pollution in developing countries
RCT: Duflo, Greenstone, Hanna (2012); Balakrishnan, Smithet al. (2015); Levine and Theresa (2010); McCracken andSmith (2007)non-experimental data: Edwards and Langpap (2012), Lam,Smith et al. (2012); Mark Pitt and Rosenzweig (2010); KirkR. Smith and Sumi Mehta (2000)
LPG Conversion Program in Indonesia (Andadari et al. 2014;Budya & Arofat 2012).
Background and Motivation The Policy Literature Data Results Conclusion
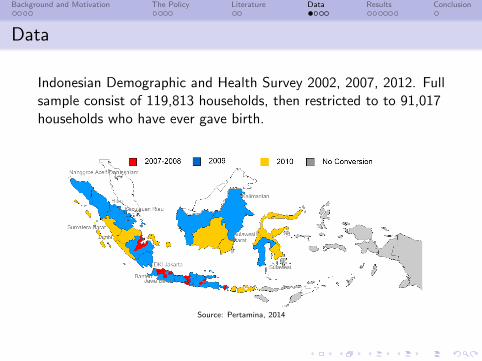
Data
Indonesian Demographic and Health Survey 2002, 2007, 2012. Fullsample consist of 119,813 households, then restricted to to 91,017households who have ever gave birth.
Source: Pertamina, 2014
Background and Motivation The Policy Literature Data Results Conclusion
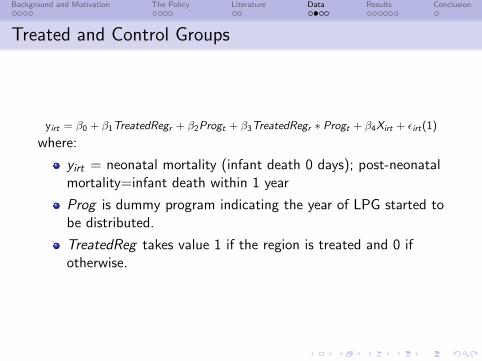
Treated and Control Groups
yirt = β0 + β1TreatedRegr + β2Progt + β3TreatedRegr ∗ Progt + β4Xirt + εirt(1)
where:
yirt = neonatal mortality (infant death 0 days); post-neonatalmortality=infant death within 1 year
Prog is dummy program indicating the year of LPG started tobe distributed.
TreatedReg takes value 1 if the region is treated and 0 ifotherwise.

Background and Motivation The Policy Literature Data Results Conclusion
X= dummies region, dummy urban, dummies municipality,dummies subdistrict, dummies for child’s year of birth anddummies for 11 calendar months of the child’s birth, year of birth xmonths, mother’s age, year of survey, child’s birth order, parent’scontraceptive method, dummy termination of pregnancy in thepast, marriage to first birth interval (months), dummy parents’literacy, household head’s gender, household head’s age andparents’ education level.
Background and Motivation The Policy Literature Data Results Conclusion
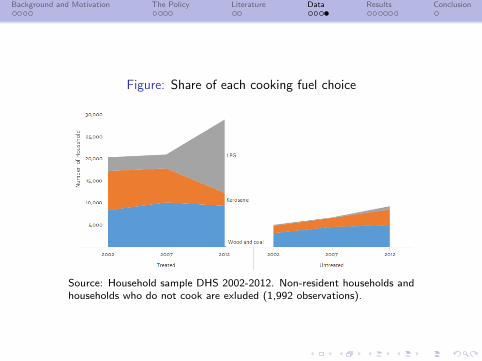
Figure: Share of each cooking fuel choice
Source: Household sample DHS 2002-2012. Non-resident households andhouseholds who do not cook are exluded (1,992 observations).
Background and Motivation The Policy Literature Data Results Conclusion
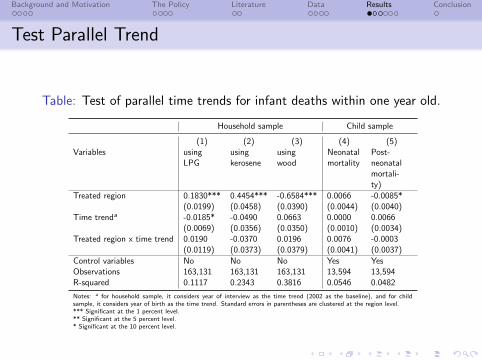
Test Parallel Trend
Table: Test of parallel time trends for infant deaths within one year old.
Household sample Child sample
(1) (2) (3) (4) (5)Variables using
LPGusingkerosene
usingwood
Neonatalmortality
Post-neonatalmortali-ty)
Treated region 0.1830*** 0.4454*** -0.6584*** 0.0066 -0.0085*(0.0199) (0.0458) (0.0390) (0.0044) (0.0040)
Time trenda -0.0185* -0.0490 0.0663 0.0000 0.0066(0.0069) (0.0356) (0.0350) (0.0010) (0.0034)
Treated region x time trend 0.0190 -0.0370 0.0196 0.0076 -0.0003(0.0119) (0.0373) (0.0379) (0.0041) (0.0037)
Control variables No No No Yes YesObservations 163,131 163,131 163,131 13,594 13,594R-squared 0.1117 0.2343 0.3816 0.0546 0.0482
Notes: a for household sample, it considers year of interview as the time trend (2002 as the baseline), and for childsample, it considers year of birth as the time trend. Standard errors in parentheses are clustered at the region level.*** Significant at the 1 percent level.** Significant at the 5 percent level.* Significant at the 10 percent level.
Background and Motivation The Policy Literature Data Results Conclusion
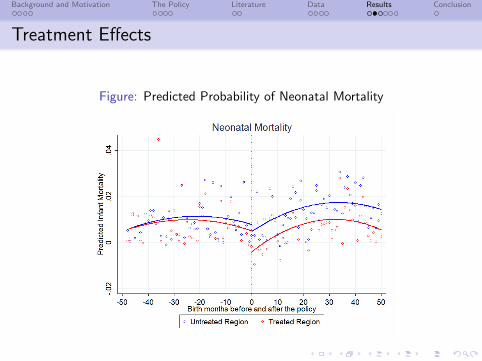
Treatment Effects
Figure: Predicted Probability of Neonatal Mortality
Background and Motivation The Policy Literature Data Results Conclusion
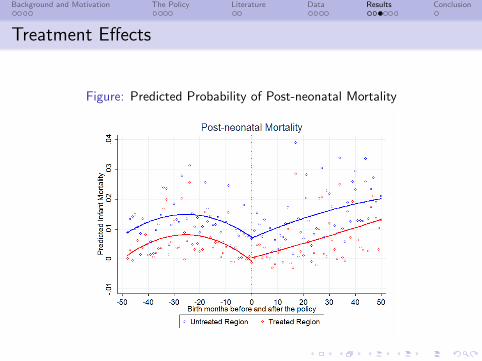
Treatment Effects
Figure: Predicted Probability of Post-neonatal Mortality
Background and Motivation The Policy Literature Data Results Conclusion
Treatment Effects
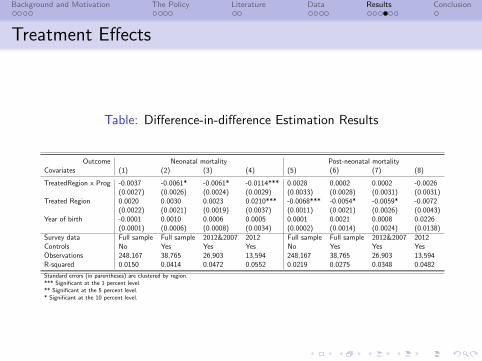
Table: Difference-in-difference Estimation Results
Outcome Neonatal mortality Post-neonatal mortalityCovariates (1) (2) (3) (4) (5) (6) (7) (8)
TreatedRegion x Prog -0.0037 -0.0061* -0.0061* -0.0114*** 0.0028 0.0002 0.0002 -0.0026(0.0027) (0.0026) (0.0024) (0.0029) (0.0033) (0.0028) (0.0031) (0.0031)
Treated Region 0.0020 0.0030 0.0023 0.0210*** -0.0068*** -0.0054* -0.0059* -0.0072(0.0022) (0.0021) (0.0019) (0.0037) (0.0011) (0.0021) (0.0026) (0.0043)
Year of birth -0.0001 0.0010 0.0006 0.0005 0.0001 0.0021 0.0008 0.0226(0.0001) (0.0006) (0.0008) (0.0034) (0.0002) (0.0014) (0.0024) (0.0138)
Survey data Full sample Full sample 2012&2007 2012 Full sample Full sample 2012&2007 2012Controls No Yes Yes Yes No Yes Yes YesObservations 248,167 38,765 26,903 13,594 248,167 38,765 26,903 13,594R-squared 0.0150 0.0414 0.0472 0.0552 0.0219 0.0275 0.0348 0.0482
Standard errors (in parentheses) are clustered by region.*** Significant at the 1 percent level.** Significant at the 5 percent level.* Significant at the 10 percent level.
Background and Motivation The Policy Literature Data Results Conclusion
Heterogeneous Effect on Subgroups
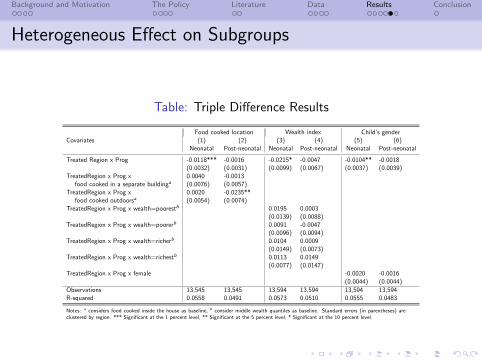
Table: Triple Difference Results
Food cooked location Wealth index Child’s genderCovariates (1) (2) (3) (4) (5) (6)
Neonatal Post-neonatal Neonatal Post-neonatal Neonatal Post-neonatal
Treated Region x Prog -0.0118*** -0.0016 -0.0215* -0.0047 -0.0104** -0.0018(0.0032) (0.0031) (0.0099) (0.0067) (0.0037) (0.0039)
TreatedRegion x Prog x 0.0040 -0.0013food cooked in a separate buildinga (0.0076) (0.0057)
TreatedRegion x Prog x 0.0020 -0.0235**food cooked outdoorsa (0.0054) (0.0074)
TreatedRegion x Prog x wealth=poorestb 0.0195 0.0003(0.0139) (0.0088)
TreatedRegion x Prog x wealth=poorerb 0.0091 -0.0047(0.0096) (0.0094)
TreatedRegion x Prog x wealth=richerb 0.0104 0.0009(0.0149) (0.0073)
TreatedRegion x Prog x wealth=richestb 0.0113 0.0149(0.0077) (0.0147)
TreatedRegion x Prog x female -0.0020 -0.0016(0.0044) (0.0044)
Observations 13,545 13,545 13,594 13,594 13,594 13,594R-squared 0.0558 0.0491 0.0573 0.0510 0.0555 0.0483
Notes: a considers food cooked inside the house as baseline, b consider middle wealth quantiles as baseline. Standard errors (in parentheses) areclustered by region. *** Significant at the 1 percent level, ** Significant at the 5 percent level, * Significant at the 10 percent level.
Background and Motivation The Policy Literature Data Results Conclusion
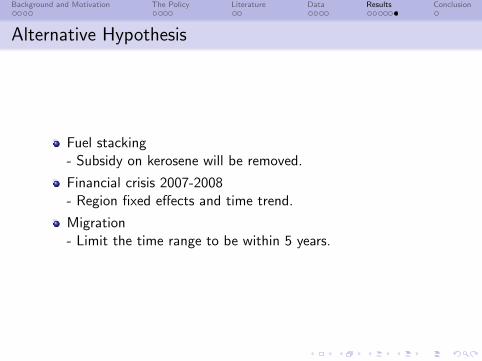
Alternative Hypothesis
Fuel stacking- Subsidy on kerosene will be removed.
Financial crisis 2007-2008- Region fixed effects and time trend.
Migration- Limit the time range to be within 5 years.
Background and Motivation The Policy Literature Data Results Conclusion
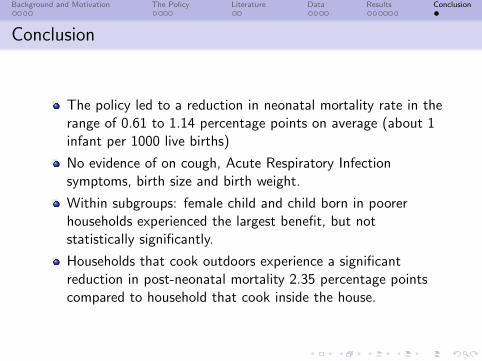
Conclusion
The policy led to a reduction in neonatal mortality rate in therange of 0.61 to 1.14 percentage points on average (about 1infant per 1000 live births)
No evidence of on cough, Acute Respiratory Infectionsymptoms, birth size and birth weight.
Within subgroups: female child and child born in poorerhouseholds experienced the largest benefit, but notstatistically significantly.
Households that cook outdoors experience a significantreduction in post-neonatal mortality 2.35 percentage pointscompared to household that cook inside the house.