fubon financial holdings - mz asia-pacific fhc _2016 eu ndr... · emerging stock trading 2 17.27%...
TRANSCRIPT
Fubon Financial Holdings
2016.06

1
Disclaimer
This meeting may contain forward-looking statements with respect to the financial condition,
results of operations and business of the company. These forward-looking statements
represent the company’s expectations or beliefs concerning future events and involve known
and unknown risks and uncertainty that could cause actual results, performance or events to
differ materially from those expressed. Certain statements, such as those that include the
words “potential”, “estimated”, and similar expressions or variations on such expressions may
be considered “forward-looking statements”. Financial numbers in this report may include
preliminary unaudited numbers or management accounts.

2
Agenda
Fubon FHC overview
Taipei Fubon Bank
Fubon Life
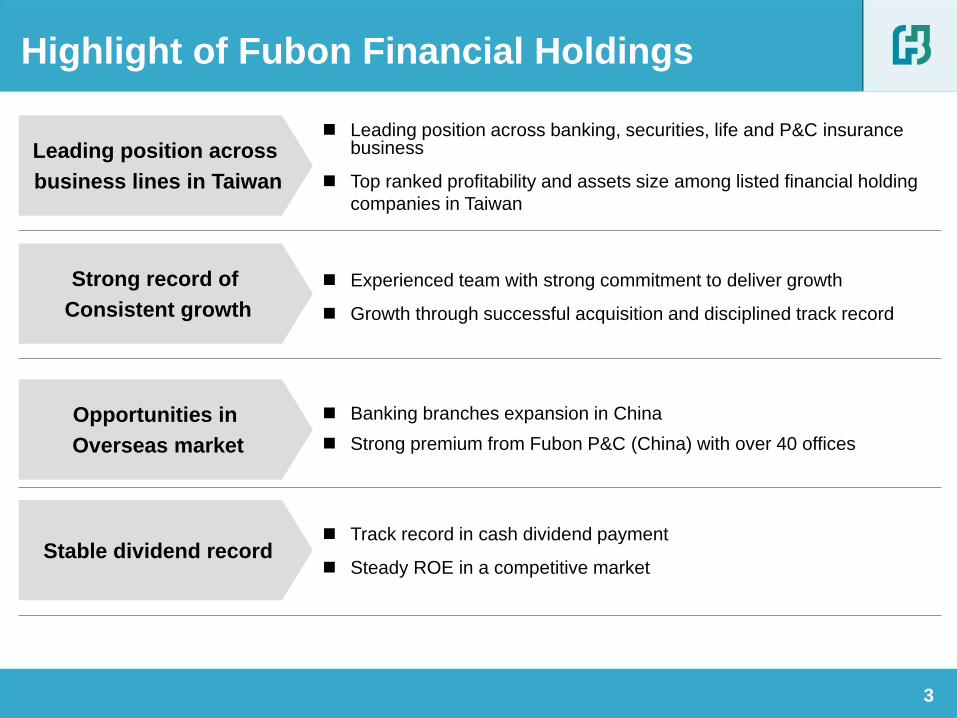
Highlight of Fubon Financial Holdings
Leading position across
business lines in Taiwan
Leading position across banking, securities, life and P&C insurance business
Top ranked profitability and assets size among listed financial holding
companies in Taiwan
Track record in cash dividend payment
Steady ROE in a competitive market
Banking branches expansion in China
Strong premium from Fubon P&C (China) with over 40 offices
Experienced team with strong commitment to deliver growth
Growth through successful acquisition and disciplined track record
Strong record of
Consistent growth
Opportunities in
Overseas market
Stable dividend record
3
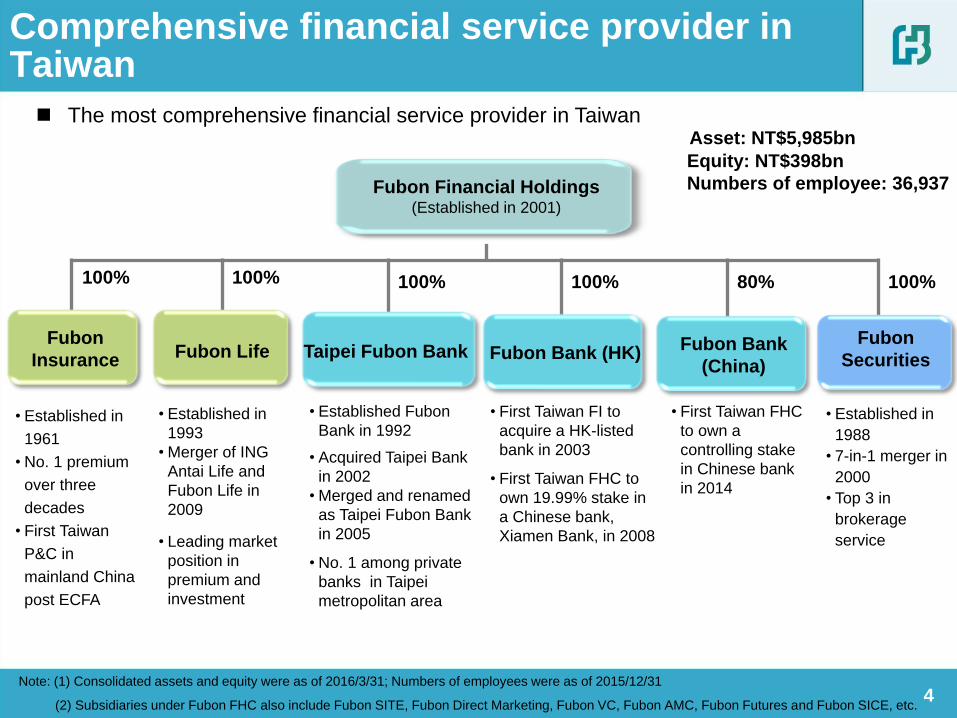
Note: (1) Consolidated assets and equity were as of 2016/3/31; Numbers of employees were as of 2015/12/31
(2) Subsidiaries under Fubon FHC also include Fubon SITE, Fubon Direct Marketing, Fubon VC, Fubon AMC, Fubon Futures and Fubon SICE, etc. 4
Comprehensive financial service provider in Taiwan
The most comprehensive financial service provider in Taiwan
• Established in
1961
• No. 1 premium
over three
decades
• First Taiwan
P&C in
mainland China
post ECFA
• Established in
1993
• Merger of ING
Antai Life and
Fubon Life in
2009
• Leading market
position in
premium and
investment
• Established Fubon
Bank in 1992 • Acquired Taipei Bank
in 2002
• Merged and renamed
as Taipei Fubon Bank
in 2005
• No. 1 among private
banks in Taipei
metropolitan area
• Established in
1988
• 7-in-1 merger in
2000
• Top 3 in
brokerage
service
Fubon Bank (HK)
Taipei Fubon Bank
Fubon
Securities
100% 80% 100% 100% 100%
Fubon Life
Fubon
Insurance
Fubon Bank
(China)
100%
• First Taiwan FHC
to own a
controlling stake
in Chinese bank
in 2014
• First Taiwan FI to
acquire a HK-listed
bank in 2003
• First Taiwan FHC to
own 19.99% stake in
a Chinese bank,
Xiamen Bank, in 2008
Fubon Financial Holdings (Established in 2001)
Asset: NT$5,985bn
Equity: NT$398bn
Numbers of employee: 36,937
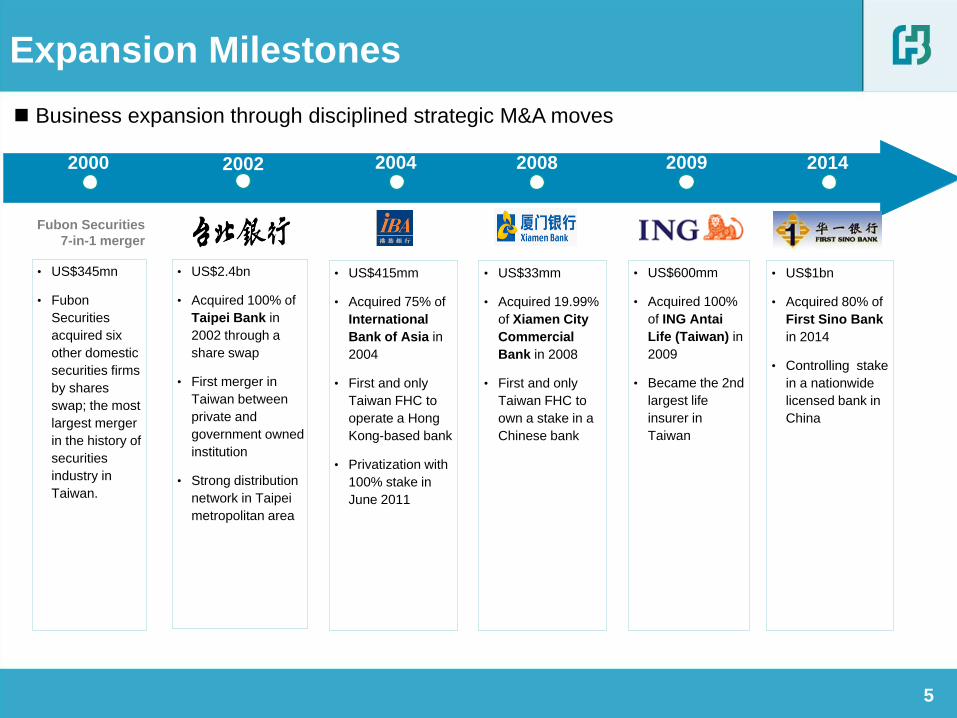
Expansion Milestones
2002 2004 2000 2009
• US$2.4bn
• Acquired 100% of
Taipei Bank in
2002 through a
share swap
• First merger in
Taiwan between
private and
government owned
institution
• Strong distribution
network in Taipei
metropolitan area
2014 2008
• US$415mm
• Acquired 75% of
International
Bank of Asia in
2004
• First and only
Taiwan FHC to
operate a Hong
Kong-based bank
• Privatization with
100% stake in
June 2011
• US$345mn
• Fubon
Securities
acquired six
other domestic
securities firms
by shares
swap; the most
largest merger
in the history of
securities
industry in
Taiwan.
• US$1bn
• Acquired 80% of
First Sino Bank
in 2014
• Controlling stake
in a nationwide
licensed bank in
China
• US$600mm
• Acquired 100%
of ING Antai
Life (Taiwan) in
2009
• Became the 2nd
largest life
insurer in
Taiwan
• US$33mm
• Acquired 19.99%
of Xiamen City
Commercial
Bank in 2008
• First and only
Taiwan FHC to
own a stake in a
Chinese bank
Fubon Securities
7-in-1 merger
5
Business expansion through disciplined strategic M&A moves

Experienced management team
6
Daniel Tsai
Chairman
• 35 years of industry experience
• Master of Comparative Law, Georgetown University
Richard Tsai
Vice Chairman
• 35 years of industry experience
• MBA, New York University
Oliver Cheng
Chairman
• 43 years of industry
experience
• Joined Fubon in 1973
• BA of Law, National
Taiwan University
Fubon Life Insurance Fubon Financial Holdings
Jerry Harn
President
• 27 years of industry
experience
• Joined Fubon in
2005
• MBA, Ohio State
University
Taipei Fubon Bank
Steve Chen
Chairman
• 40 years of industry
experience
• Joined Fubon in 1976
• MBA, Roosevelt
University
Fubon P&C Insurance
Vivien Hsu
President
• 38 years of industry
experience
• Joined Fubon in 2013
• MBA, University of New
South Wales
Fubon Securities
Samuel Hsu
Chairman
• 35 years of industry
experience
• Joined Fubon in
2013
• MBA, Chinese
Culture University
Seasoned senior management team with an average of over 30 years of experience in
financial services industry
Howard Lin
Vice Chairman
• 36 years of industry
experience
• Joined Fubon in 1997
• Ph.D., Department of
Chemical Engineering,
National Taiwan
University
Fubon Life Insurance
Fubon Bank (HK)
Raymond Lee
Managing Director &
CEO
• 42 years of industry
experience
• Joined Fubon in
2012
• Fellow of ACCA,
Member of HK
institute of CPA
Fubon Bank (China)
Peili Hong
Chairman
• 32 years of industry
experience
• Joined Fubon in
2014
• Master of
Economics, East
China Normal
University
Fubon Bank (China)
Dennis Chan
President
• 27 years of industry
experience
• Joined Fubon in
2011
• MBA, Georgetown
University

7
Leading market position across major busineses
Banking Life insurance
Securities
Note: (1) Among top 6 card issuers; per active card basis; (2) Among private banks; (3) Among top 10 brokers
All data as of 2015
Market
ranking
Market
share/amount
Monthly per card spending (1) 1 NT$9,001
Loan Syndication (2) 1 6.0%
Mortgage loan(2) 2 5.49%
FX derivative 2 14.3%
Market
ranking
Market
share
FYP through broker 1 20.6%
FYP through bancassurance 1 19.2%
First year premium 2 17.3%
Total premium 2 16.2%
FYP through tied agents 3 14.3%
Market
ranking
Market
share
Emerging stock trading 2 17.27%
IPO amount 2 16.92%
SPO amount 2 15.31%
Brokerage per branch(3) 2 0.09%
Brokerage 3 5.19%
Market
ranking
Market
share
Direct written premium 1 22.48%
Personal line 1 21.85%
Commercial line 1 24.01%
Average premium per employee
(million) 1 NT$11.76
P&C

Subsidiary Service network
Bank
Taipei Fubon Bank 5 branches : HK, Hanoi, Binh Duong, Ho Chi Minh City,
Singapore
Fubob Bank (HK) 23 branches, 2 securities services centers and 1 personal
loan center
Xiamen Bank 49 branches & sub-branches: Xiamen, Fujian, Chong Qing
Fubon Bank (China)
22 branches & sub-branches: Shanghai, Suzhou, Tianjin,
Shenzhen, Kunshan, Beijing, Nanjing
Insurance
Fubon Insurance
(China) 42 offices: Xiamen, Fujian, Chong Qing, Dalian, Liaoning
Fubon Insurance -
Vietnam subsidiary
5 offices: Ho Chi Minh City, Hanoi, Binh Duong, Dong Nai,
Hai Phong
Fubon Insurance
Broker (Philippines) 1 office: Manila
Fubon Insurance
Broker (Thailand) 1 office: Bangkok
Fubon Life -
Vietnam subsidiary 2 offices: Hanoi, Ho Chi Minh City
Fubon Life -
Hong Kong subsidiary 1 office: Hong Kong
Securities
Fubon Securities HK subsidiary
Founder Fubon
Fund management Beijing
8
Note: Rep offices in Malaysia, Indonesia and China from subsidiaries under Fubon FHC.
Hong Kong
Chong Qing
Vietnam
Fujian
Taiwan
Liaoning
Thailand
Indonesia
Shanghai
Tianjin
Guangdong
Beijing
Jiangsu
Philippines
Vision: A leading financial institution in Asia
Singapore
9
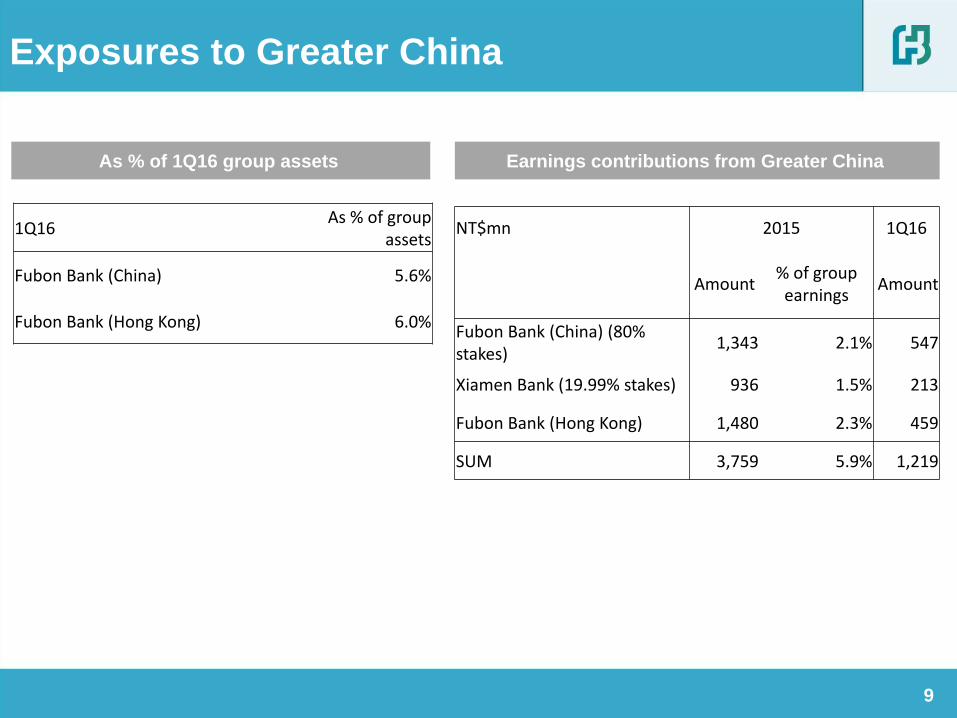
Exposures to Greater China
As % of 1Q16 group assets Earnings contributions from Greater China
1Q16 As % of group
assets
Fubon Bank (China) 5.6%
Fubon Bank (Hong Kong) 6.0%
NT$mn 2015 1Q16
Amount % of group
earnings Amount
Fubon Bank (China) (80% stakes)
1,343 2.1% 547
Xiamen Bank (19.99% stakes) 936 1.5% 213
Fubon Bank (Hong Kong) 1,480 2.3% 459
SUM 3,759 5.9% 1,219
10
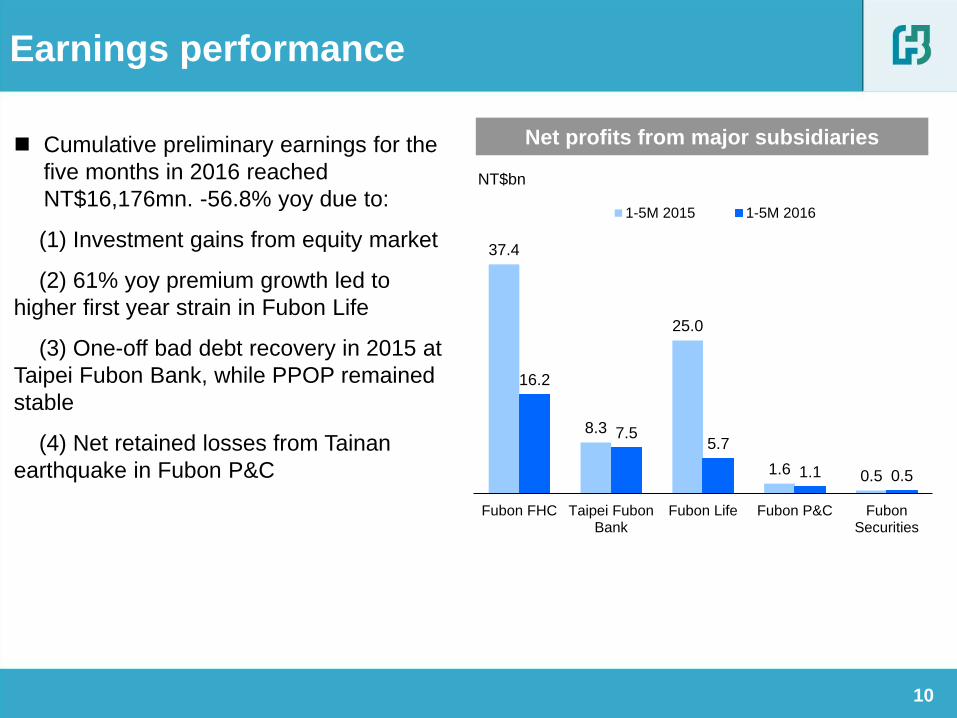
Earnings performance
Net profits from major subsidiaries
NT$bn
Cumulative preliminary earnings for the
five months in 2016 reached
NT$16,176mn. -56.8% yoy due to:
(1) Investment gains from equity market
(2) 61% yoy premium growth led to
higher first year strain in Fubon Life
(3) One-off bad debt recovery in 2015 at
Taipei Fubon Bank, while PPOP remained
stable
(4) Net retained losses from Tainan
earthquake in Fubon P&C
37.4
8.3
25.0
1.6 0.5
16.2
7.5 5.7
1.1 0.5
Fubon FHC Taipei FubonBank
Fubon Life Fubon P&C FubonSecurities
1-5M 2015 1-5M 2016
11
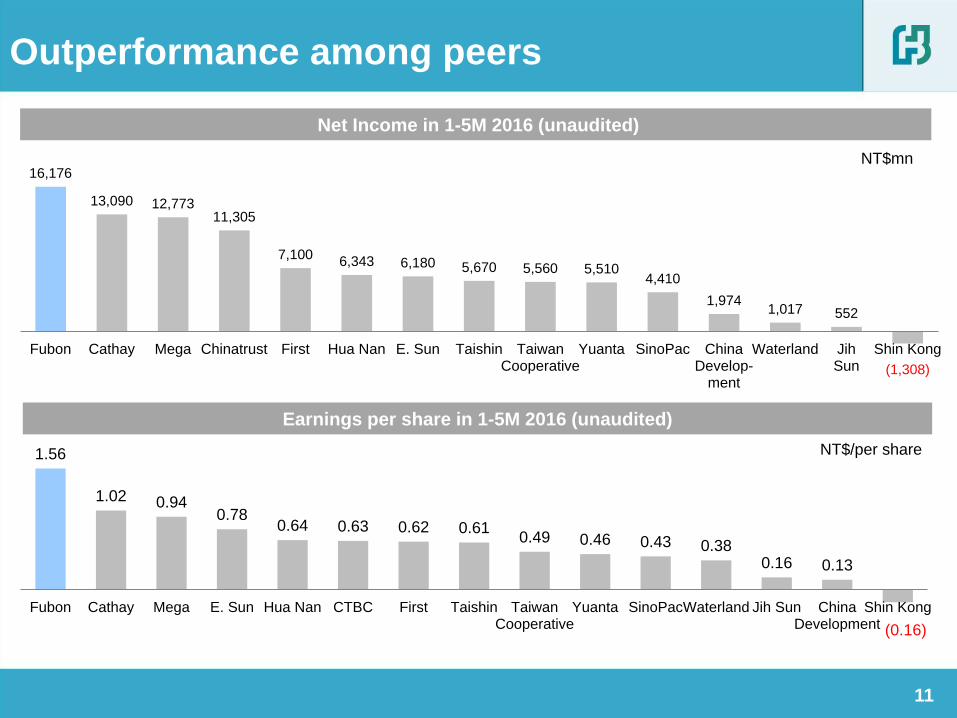
Net Income in 1-5M 2016 (unaudited)
Earnings per share in 1-5M 2016 (unaudited)
NT$mn
Outperformance among peers
NT$/per share
16,176
13,090 12,773 11,305
7,100 6,343 6,180 5,670 5,560 5,510
4,410
1,974 1,017 552
(1,308)
Fubon Cathay Mega Chinatrust First Hua Nan E. Sun Taishin TaiwanCooperative
Yuanta SinoPac ChinaDevelop-
ment
Waterland JihSun
Shin Kong
1.56
1.02 0.94 0.78
0.64 0.63 0.62 0.61 0.49 0.46 0.43 0.38
0.16 0.13
(0.16)
Fubon Cathay Mega E. Sun Hua Nan CTBC First Taishin TaiwanCooperative
Yuanta SinoPacWaterland Jih Sun ChinaDevelopment
Shin Kong
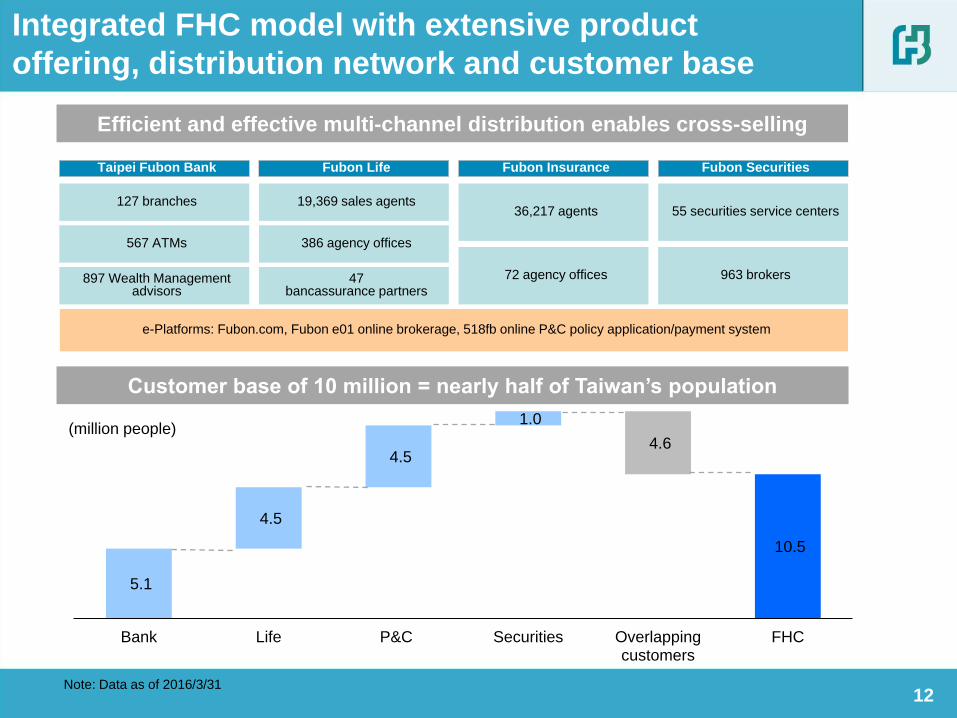
Efficient and effective multi-channel distribution enables cross-selling
Customer base of 10 million = nearly half of Taiwan’s population
Note: Data as of 2016/3/31
e-Platforms: Fubon.com, Fubon e01 online brokerage, 518fb online P&C policy application/payment system
(million people)
Taipei Fubon Bank Fubon Life Fubon Insurance Fubon Securities
386 agency offices
36,217 agents
72 agency offices
55 securities service centers
567 ATMs
897 Wealth Management advisors
127 branches
963 brokers 47 bancassurance partners
19,369 sales agents
12
Integrated FHC model with extensive product
offering, distribution network and customer base
5.1
10.5
4.5
4.5
1.0
4.6
Bank Life P&C Securities Overlappingcustomers
FHC

13 13
Taiwan macro/policy outlook
Opportunities Challenges
• Initiatives to promote five
targeted industries
• Social welfare improvement:
long term care and public
apartments
• Taiwan stock market stimulus
• Economic growth outlook
• Interest rate environment
• Cross-strait deregulation
• Tax reform: inheritance tax,
sales tax, and corporate tax

14
Channels
• Bank branch relocation & Life agency growth
• e-platforms for efficiency and business growth
• Cross-sale synergy
Opportunities
• Growth opportunities in life insurance and wealth
management business
• Portfolio management along with asset growth
Growth opportunities
Expansion
• Business contribution aim to diversify
• M&A and strategic alliance opportunities from domestic and
overseas

1.2
1.6 1.7
1.2 1.0
1.5
0.0
2.0
1.0 1.0 1.0
1.5
3.0
2.0
2002 2003 2004 2005 2006 2007 2008 2009 2010 2011 2012 2013 2014 2015
Dividends & ROE
15 15
Cash dividends
NT$
ROE
6.3%
9.8% 9.9%
6.8% 5.3%
8.8% 7.0%
11.3%
9.3%
13.5%
10.8% 11.5%
16.1% 16.40%
2002 2003 2004 2005 2006 2007 2008 2009 2010 2011 2012 2013 2014 2015
16
Agenda
Fubon FHC overview
Taipei Fubon Bank
Fubon Life

Growth momentum outperforming industry
Total loan growth (5 year CAGR)
Market share by loans among private banks
Leading commercial banking service
provider in Taiwan
Major product lines are corporate
banking, retail banking, credit card,
and wealth management services
Outperformance in greater China
franchise
17 Note: All data as of 2015/12/31
6.20%
4.99%
Fubon Industry Average
5.8%
4.6% 4.4% 4.0%
3.3%
CTBC TaipeiFubon Bank
CathayUnited Bank
E. SUN Taishin
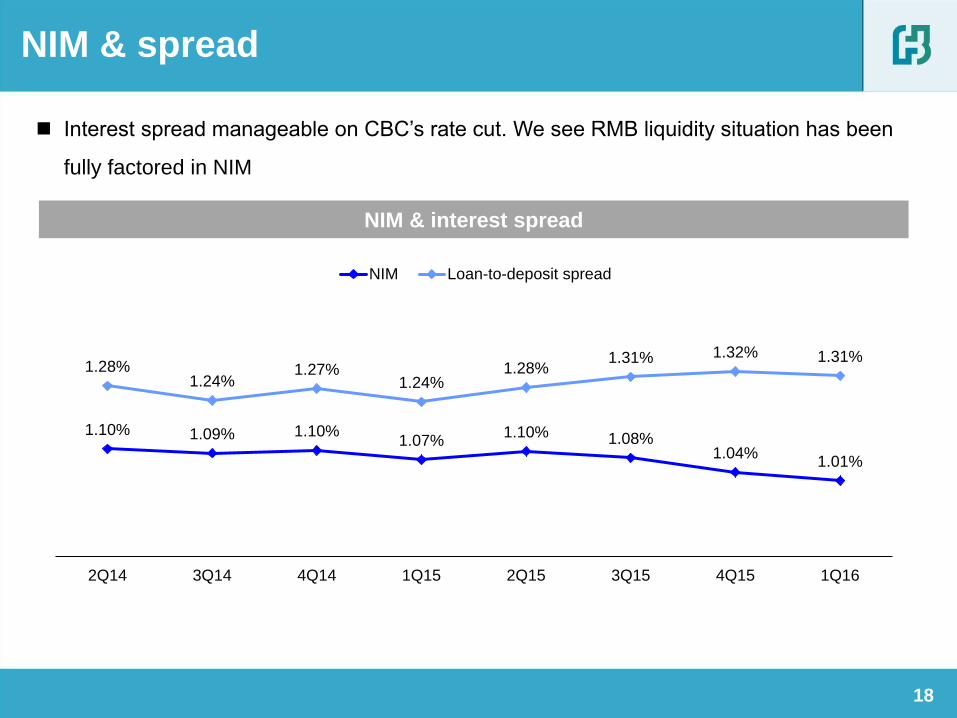
NIM & spread
Interest spread manageable on CBC’s rate cut. We see RMB liquidity situation has been
fully factored in NIM
18
1.10% 1.09% 1.10% 1.07%
1.10% 1.08% 1.04%
1.01%
1.28% 1.24%
1.27% 1.24%
1.28% 1.31% 1.32% 1.31%
2Q14 3Q14 4Q14 1Q15 2Q15 3Q15 4Q15 1Q16
NIM Loan-to-deposit spread
NIM & interest spread

Strong wealth management business
continues
Wealth management business growth momentum continues through client penetration rate
and financial consultant productivity enhancement
19
Wealth management fee
NT$mn
0
500
1,000
1,500
2,000
2,500
3,000
1Q15 1Q16
+16.5%
-0.7%
31.5%
7.7%
0
2,000
4,000
6,000
8,000
10,000
2013 2014 2015
Wealth management fee Growth rate

20
Agenda
Fubon FHC overview
Taipei Fubon Bank
Fubon Life
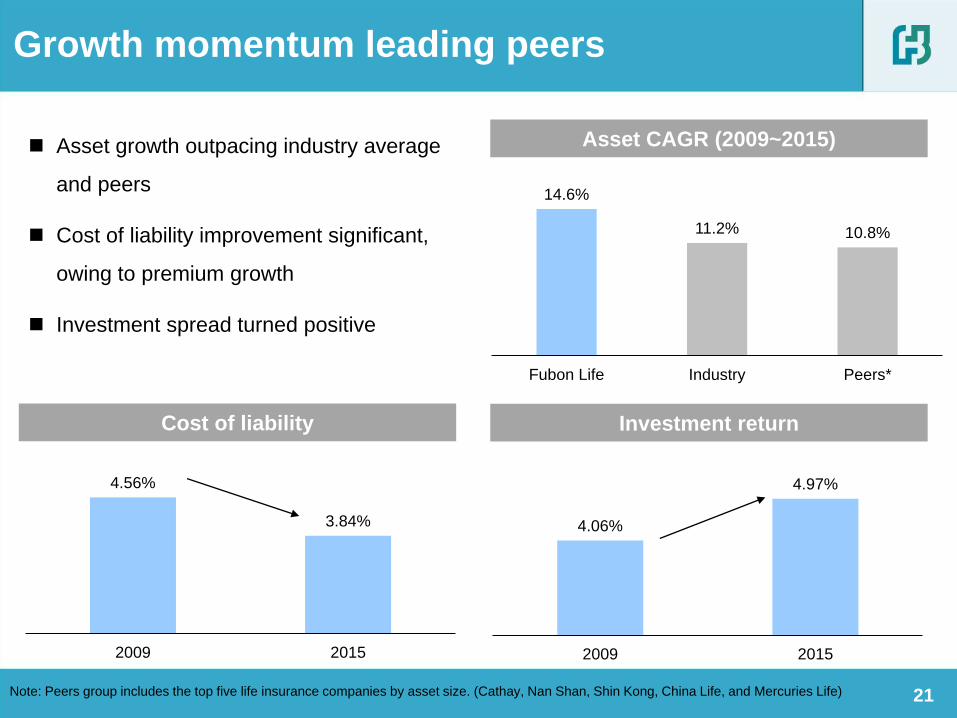
4.06%
4.97%
2009 2015
21
Growth momentum leading peers
Asset CAGR (2009~2015)
Investment return Cost of liability
Note: Peers group includes the top five life insurance companies by asset size. (Cathay, Nan Shan, Shin Kong, China Life, and Mercuries Life)
Asset growth outpacing industry average
and peers
Cost of liability improvement significant,
owing to premium growth
Investment spread turned positive
4.56%
3.84%
2009 2015
14.6%
11.2% 10.8%
Fubon Life Industry Peers*
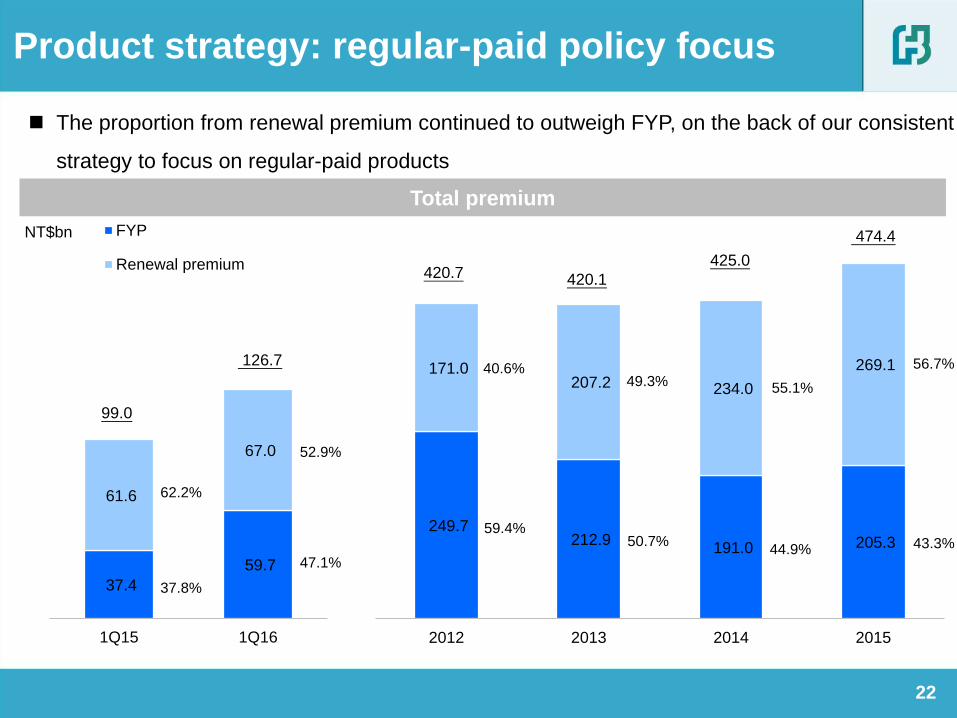
37.4
59.7
61.6
67.0
1Q15 1Q16
FYP
Renewal premium
249.7 212.9
191.0 205.3
171.0 207.2 234.0
269.1
2012 2013 2014 2015
420.7 420.1
425.0
474.4
56.7%
43.3%
55.1%
44.9%
49.3%
50.7%
40.6%
59.4%
99.0
126.7
52.9%
47.1%
62.2%
37.8%
The proportion from renewal premium continued to outweigh FYP, on the back of our consistent
strategy to focus on regular-paid products
22
NT$bn
Product strategy: regular-paid policy focus
Total premium

23 23
Investment income mainly came from recurring revenue
Sustainable positive spread
Temporary negative spread in 1Q16 due to strong FYP growth
Investment performance
Note: *2013 data is on pro forma basis to reflect fair value method for investment property evaluation.
NT$bn 2012 2013* 2014 2015 1Q16
Recurring investment income 62.7 75.2 88.7 101.0 23.1
Recurring investment income contributions 91% 87% 81% 78% 90%
Recurring yield (a) 3.43% 3.48% 3.57% 3.70% 3.14%
Capital gains 0.58% 0.95% 1.17% 1.27% 0.58%
Breakeven point (b) 3.18% 3.09% 2.91% 2.97% 3.24%
Spread (c)=(a)-(b) 0.25% 0.39% 0.66% 0.73% -0.10%
Investment income 68.6 86.3 109.9 130.3 25.5
Total investment assets 1,932.3 2,227.2 2,588.0 2,814.0 2,866.1

24 24
Deployment in overseas fixed income
Overseas fixed income investment strategy
Active deployment in overseas fixed income assets. Overseas fixed income recurring yield
remains intact despite reducing exposures to high yield bond funds
1.4
3.6 2.4 2.5
1.0
5.7
1.4
3.14%
3.75% 3.56%
3.12%
2.72%
2.96%
2.72%
1H13 2H13 1H14 2H14 1H15 2H15 1Q16
Overseas fixed income net change
US 30 year government bond yield
US$bn
Recurring yield maintained
3.17%
3.35%
1Q15 1Q16
Overall recurring yield (after hedge)
25 25
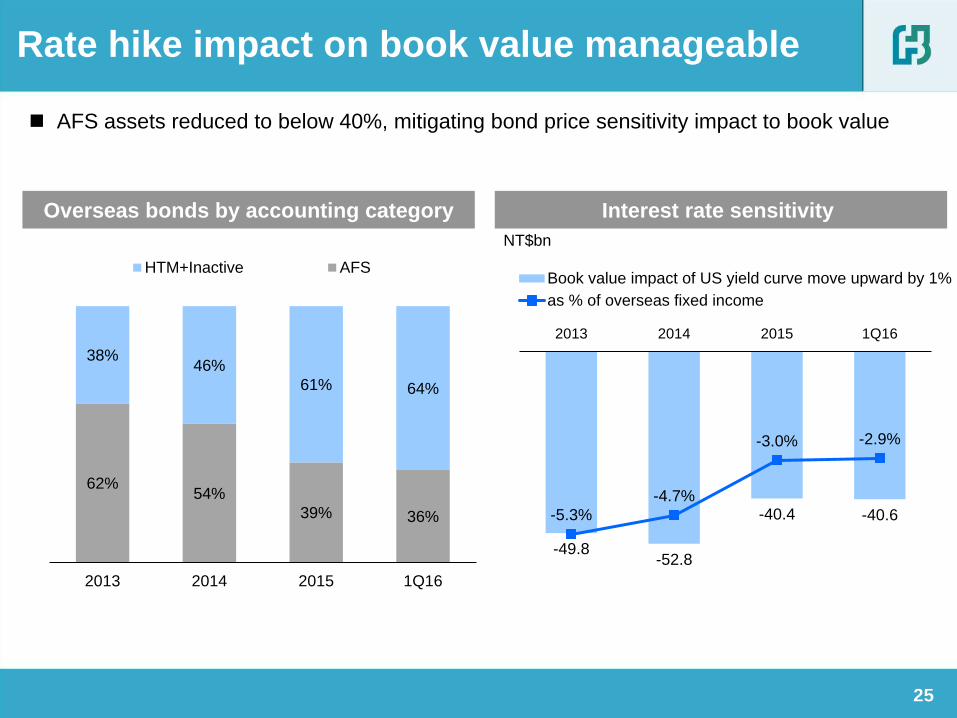
Overseas bonds by accounting category
Rate hike impact on book value manageable
AFS assets reduced to below 40%, mitigating bond price sensitivity impact to book value
Interest rate sensitivity
62% 54%
39% 36%
38% 46%
61% 64%
2013 2014 2015 1Q16
HTM+Inactive AFS
NT$bn
-49.8 -52.8
-40.4 -40.6 -5.3%
-4.7%
-3.0% -2.9%
2013 2014 2015 1Q16
Book value impact of US yield curve move upward by 1%
as % of overseas fixed income

26
Track record in consistent hedging strategies
0.75% 0.68% 0.58% 0.28% 1.01%
43.4% 45.5% 52.3% 57.9% 57.7%
Hedging costs (incl. FX gains/losses)
Overseas Investment
Hedging composition & costs
82.5% 81.4% 76.3% 75.6% 74.7%
2.7% 7.9% 10.8% 8.1%
5.4% 2.6% 2.0% 1.5% 4.3%
12.1% 13.2% 13.8% 12.1% 12.9%
2012 2013 2014 2015 1Q16
Equities/ mutualfunds
Other currencies
Naked USD
Currency swap &FX Policy
2016.06
Strategy and Performance of Fubon Life

Fubon Life’s financial goals
Short-term
Balanced
SoE
Long-term
Sustainable
Value
Creation
Ultimate
Maximized
Shareholders’
Value
Financial Goals
Mortality
Expense Interest
Source of Earnings
Reduce Cost of Liabilities
Maintain Mortality Gain
Enhance Expense Margin
Increase Investment
Return
Reduce Breakeven Points Increase Recurring
Yields and Return
Targets and Actions
28
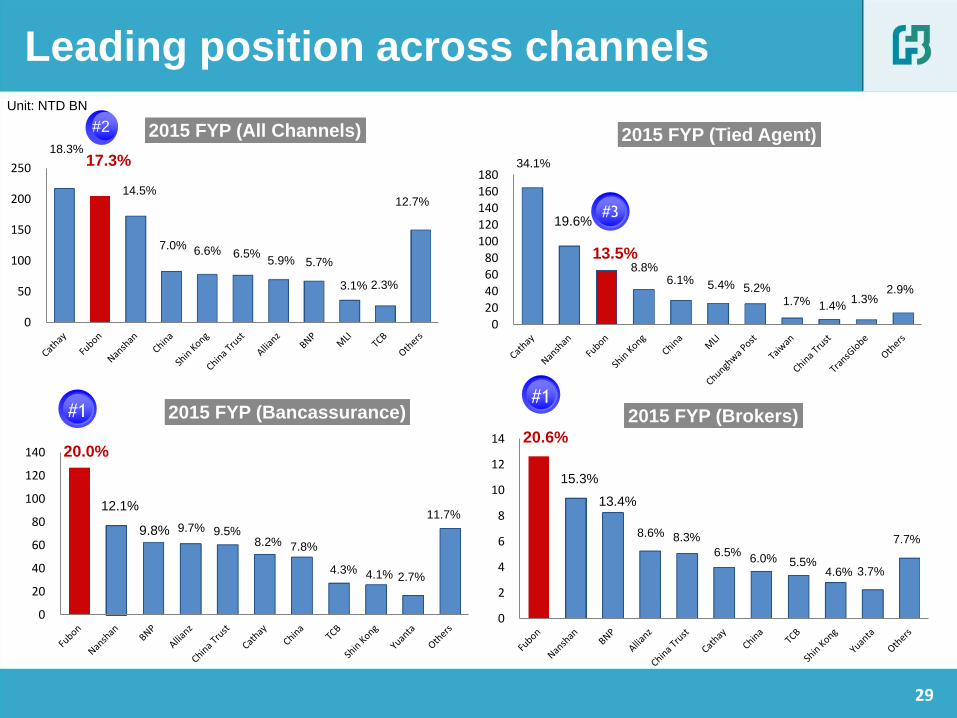
18.3% 17.3%
14.5%
7.0% 6.6% 6.5% 5.9% 5.7%
3.1% 2.3%
12.7%
0
50
100
150
200
250
2015 FYP (All Channels)
Leading position across channels Unit: NTD BN
#2
#3
#1 #1
34.1%
19.6%
13.5% 8.8%
6.1% 5.4% 5.2% 1.7% 1.4%
1.3% 2.9%
020406080
100120140160180
2015 FYP (Tied Agent)
20.0%
12.1%
9.8% 9.7% 9.5% 8.2% 7.8%
4.3% 4.1% 2.7%
11.7%
0
20
40
60
80
100
120
140
2015 FYP (Bancassurance)
20.6%
15.3%
13.4%
8.6% 8.3%
6.5% 6.0% 5.5%
4.6% 3.7%
7.7%
0
2
4
6
8
10
12
14
2015 FYP (Brokers)
29

Growing agency force
Number of Tied-Agents
Source: Taiwan Insurance Institution
Size of tied agents force is increasing, a CAGR of 9.3% from 2008 to 2015, while 0.1% for the industry.
Fubon’s tied-agent force grows from 11.6% to 21.5% of the industry agent force.
% of Industry Tied-Agents
30

3.36%
2.76%
3.03%2.97%
3.18%
3.09%
2.91%2.97%
3.27%3.30%
3.33%
3.43%3.48%
3.57%
3.70%
FY08 FY09 FY10 FY11 FY12 FY13 FY14 FY15
Breakeven Point
Recurring Return
5.17%
4.56%
4.16%4.16% 4.07%
3.98%
3.88% 3.84%
3.16%
4.06%
3.78%3.80%
4.01%
4.05%
4.74%
4.97%
FY08 FY09 FY10 FY11 FY12 FY13 FY14 FY15
Cost of Liabilities
Investment Return
Self sustainable growth strategy delivers
promising financial results
Note1:Recurring return of FY08 is unavailable.
Note2:Breakeven point = (Profit before tax – Investment income)/Average investment assets
Breakeven Point vs. Recurring Return Cost of Liability vs. Investment Return
31
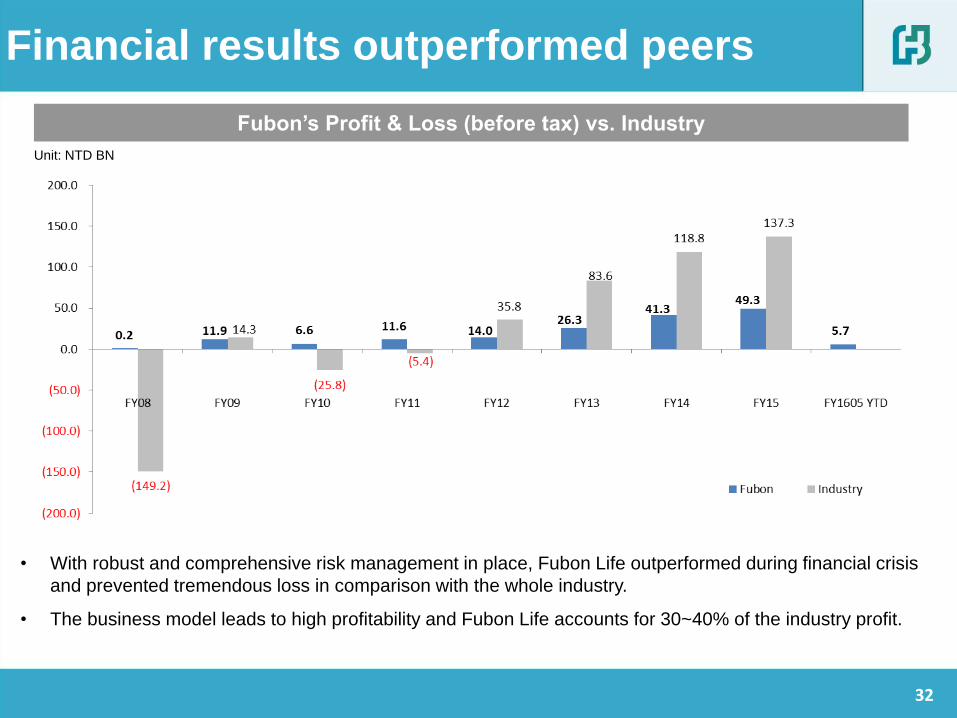
Fubon’s Profit & Loss (before tax) vs. Industry
Financial results outperformed peers
Unit: NTD BN
• With robust and comprehensive risk management in place, Fubon Life outperformed during financial crisis
and prevented tremendous loss in comparison with the whole industry.
• The business model leads to high profitability and Fubon Life accounts for 30~40% of the industry profit.
32

66
96 101 102
167 170
224
183 206
FY08 FY09 FY10 FY11 FY12 FY13 FY14 FY15 FY16Q1
Net worth AUM
904 1,125
1,425 1,614
1,955 2,242
2,583 2,837 2,923
FY08 FY09 FY10 FY11 FY12 FY13 FY14 FY15 FY16Q1
Unit: NTD BN
• ROE adjustment : excludes the release of special reserve from unrealized gains on property. Fubon released 2.6 NTD billion in 2013 and none for 2014 and 2015.
• Fubon 2008Y includes ex-Fubon and ex-ING Antai. Fubon 2015 dividend upstream 8,800m.
Source:TII、Company’s information
22
Financial performance
23
Impact from fair value method on investment property
Return on Equity
2.6%
13.4%
6.7%
9.9% 9.6%
14.8%
18.0%20.2%
FY08 FY09 FY10 FY11 FY12 FY13 FY14 FY15
Average ROE: 11.9%
33
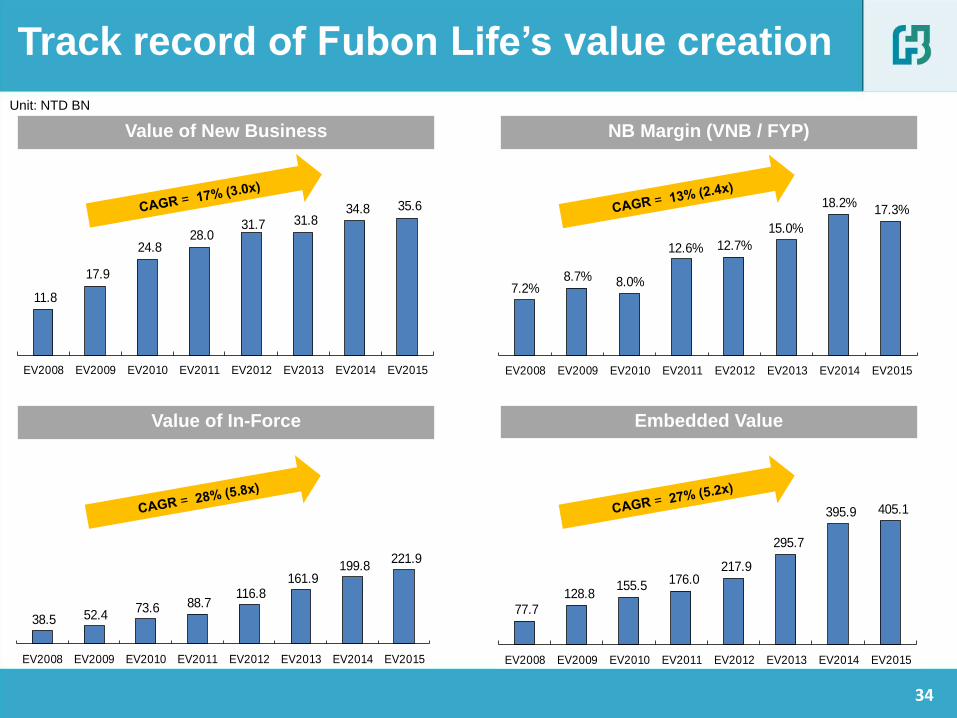
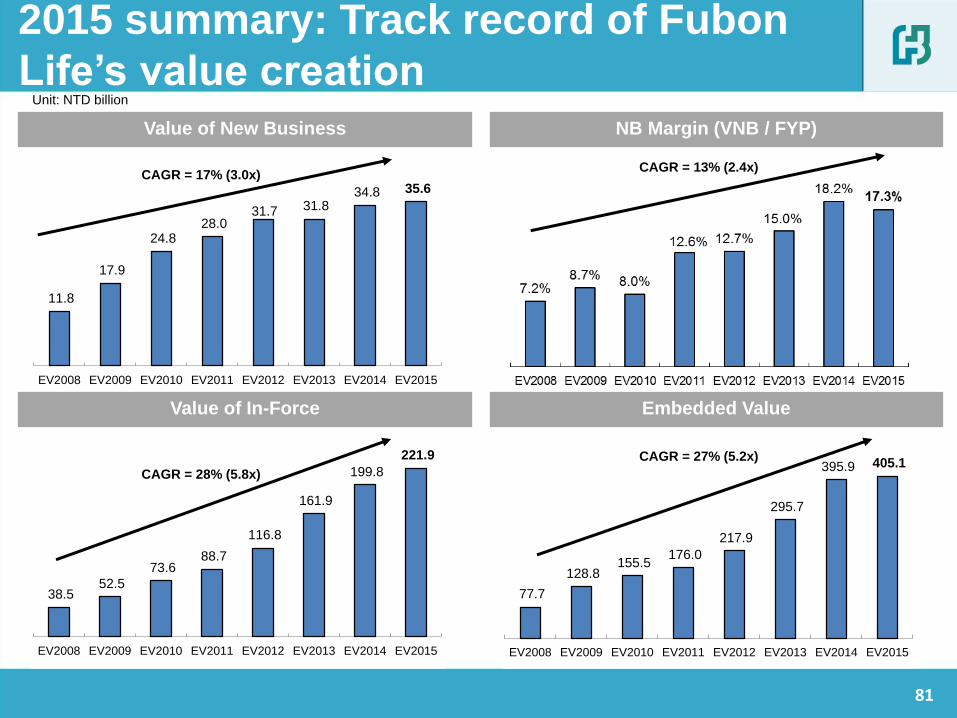
7.2%8.7% 8.0%
12.6% 12.7%
15.0%
18.2%17.3%
EV2008 EV2009 EV2010 EV2011 EV2012 EV2013 EV2014 EV2015
11.8
17.9
24.8 28.0
31.7 31.8 34.8 35.6
EV2008 EV2009 EV2010 EV2011 EV2012 EV2013 EV2014 EV2015
38.5 52.4 73.6 88.7
116.8 161.9
199.8 221.9
EV2008 EV2009 EV2010 EV2011 EV2012 EV2013 EV2014 EV2015
77.7 128.8
155.5 176.0 217.9
295.7
395.9 405.1
EV2008 EV2009 EV2010 EV2011 EV2012 EV2013 EV2014 EV2015
77.7 128.8
155.5 176.0 217.9
295.7
395.9 405.1
EV2008 EV2009 EV2010 EV2011 EV2012 EV2013 EV2014 EV2015
Unit: NTD BN
NB Margin (VNB / FYP) Value of New Business
Value of In-Force Embedded Value
Track record of Fubon Life’s value creation
34
Investment return:
assumptions vs. actual
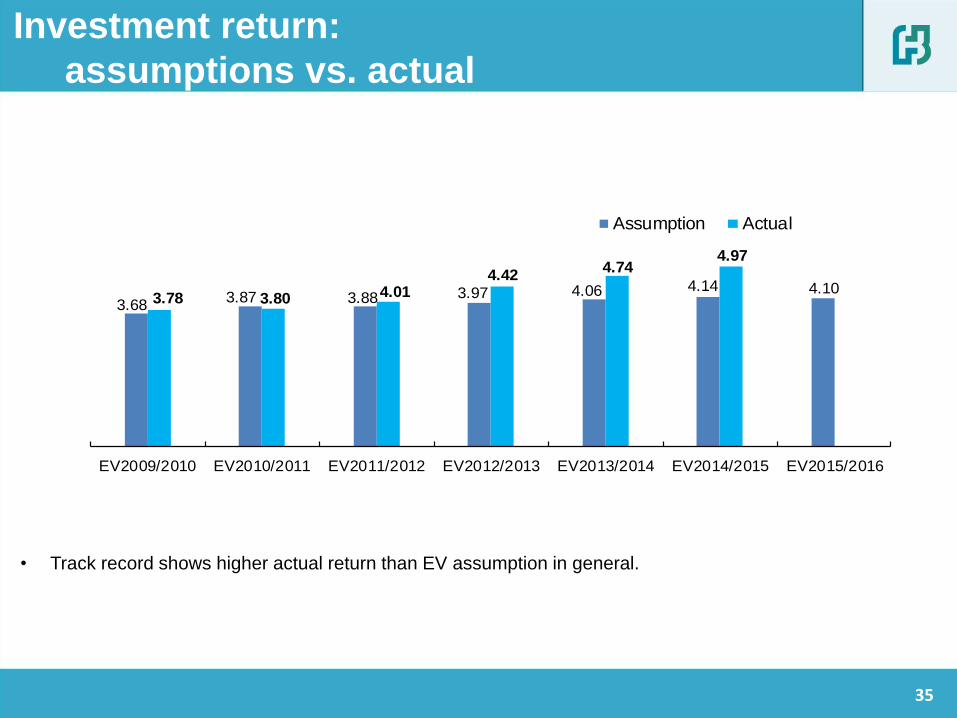
3.68 3.87 3.88 3.97 4.06 4.14 4.10
3.78 3.80 4.01 4.42
4.74 4.97
EV2009/2010 EV2010/2011 EV2011/2012 EV2012/2013 EV2013/2014 EV2014/2015 EV2015/2016
Assumption Actual
• Track record shows higher actual return than EV assumption in general.
35
2016.05.11
Fubon Financial 2016 Q1 Interim Results
and
2015 Embedded Value of Fubon Life
Disclaimer
This meeting may contain forward-looking statements with respect to the financial
condition, results of operations and business of the company. These forward-looking
statements represent the company’s expectations or beliefs concerning future events
and involve known and unknown risks and uncertainty that could cause actual
results, performance or events to differ materially from those expressed. Certain
statements, such as those that include the words “potential”, “estimated”, and similar
expressions or variations on such expressions may be considered “forward-looking
statements”. Financial numbers in this report may include preliminary unaudited
numbers or management accounts.
37

Performance review by subsidiary
• Fubon Life
• Fubon Securities
Performance highlights of Fubon Financial Holdings
• Fubon Insurance
Agenda
• Taipei Fubon Bank
• Fubon Bank (China)
• Fubon Bank (China)
2015 Embedded value of Fubon Life
38
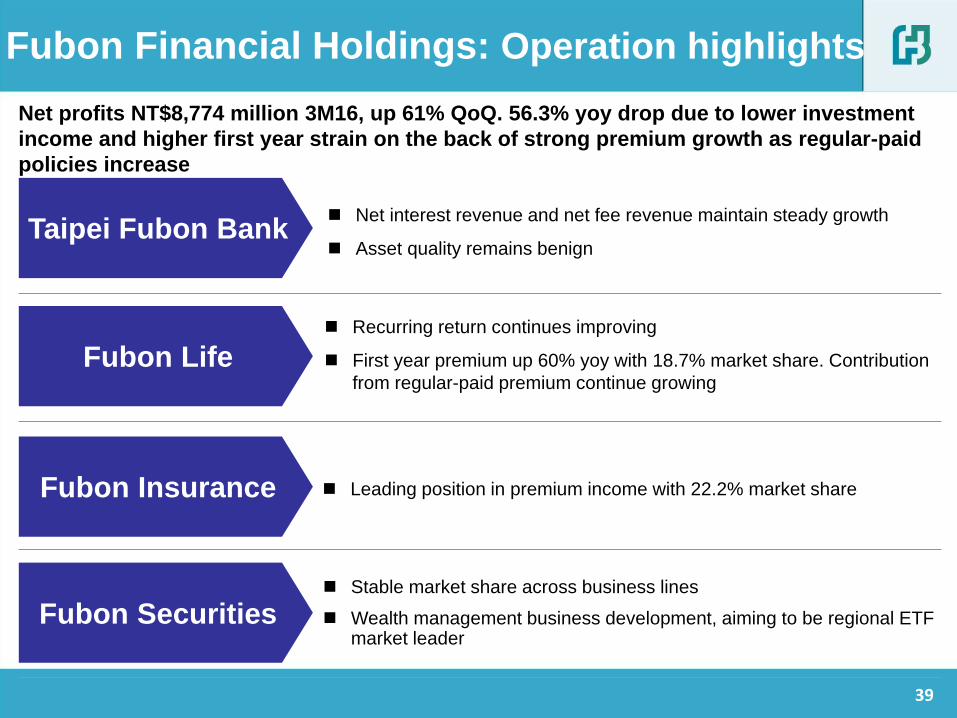
Fubon Financial Holdings: Operation highlights
Taipei Fubon Bank
Stable market share across business lines
Wealth management business development, aiming to be regional ETF market leader
Fubon Life
Fubon Insurance
Fubon Securities
Net profits NT$8,774 million 3M16, up 61% QoQ. 56.3% yoy drop due to lower investment
income and higher first year strain on the back of strong premium growth as regular-paid
policies increase
Recurring return continues improving
First year premium up 60% yoy with 18.7% market share. Contribution
from regular-paid premium continue growing
Net interest revenue and net fee revenue maintain steady growth
Asset quality remains benign
Leading position in premium income with 22.2% market share
39
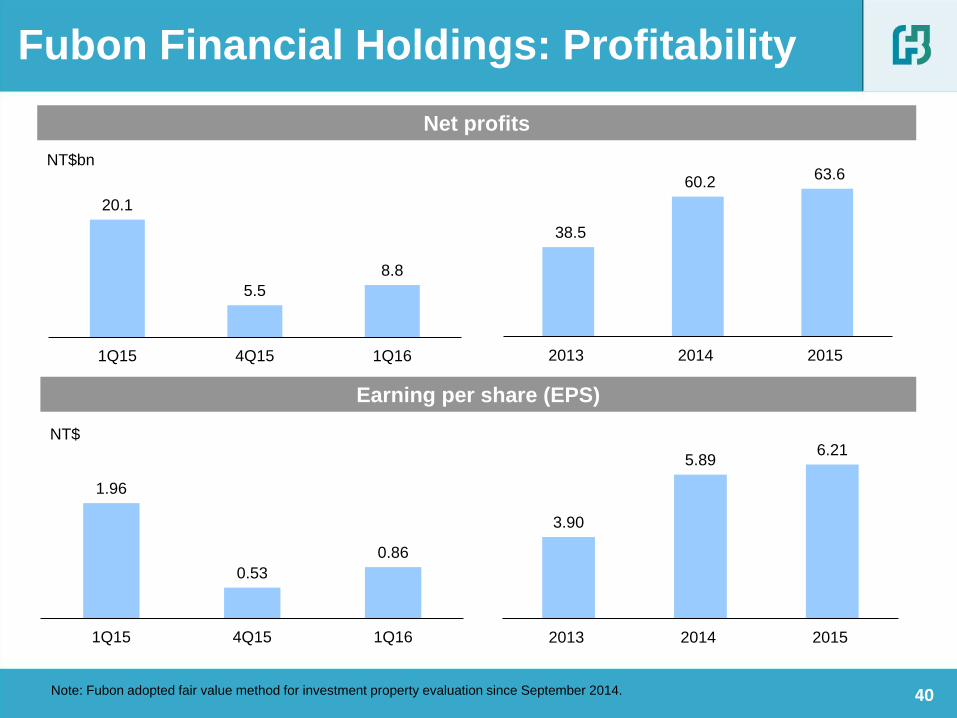
Net profits
Earning per share (EPS)
NT$
Note: Fubon adopted fair value method for investment property evaluation since September 2014.
NT$bn
Fubon Financial Holdings: Profitability
38.5
60.2 63.6
2013 2014 2015
20.1
5.5
8.8
1Q15 4Q15 1Q16
3.90
5.89 6.21
2013 2014 2015
1.96
0.53
0.86
1Q15 4Q15 1Q16
40

Fubon Financial Holdings: Net profits from major subsidiaries
Net profits from major subsidiaries Profit contribution from major subsidiaries
NT$bn NT$bn
Note:
(1) Profit contribution are based on the summation of five major
subsidiaries; (2) Fubon Bank (China) contributed NT$547 mn net
profits to the Company on the basis of 80% shareholding.
4.9
13.3
0.9 0.4
0.8
2.7 2.2
0.6 0.6 0.1
4.9
2.1
0.5 0.4 0.7
Taipei FubonBank
Fubon Life Fubon P&C FubonSecurities
Fubon Bank(HK)
1Q15 4Q15 1Q16
Taipei Fubon
Bank, 4.9 , 57.3%
Fubon Life, 2.1 , 24.8%
Fubon P&C, 0.5 ,
6.0%
Fubon Securities, 0.4 , 4.2%
Fubon Bank (HK), 0.7 ,
7.8%
41
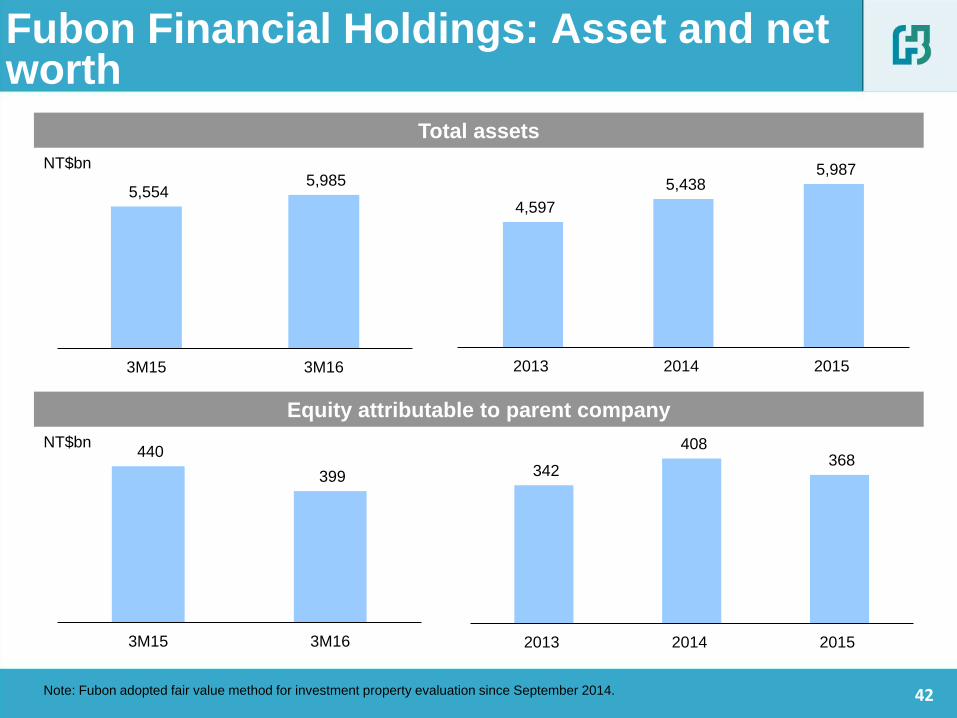
Total assets
Equity attributable to parent company
NT$bn
NT$bn
Fubon Financial Holdings: Asset and net worth
Note: Fubon adopted fair value method for investment property evaluation since September 2014.
4,597
5,438 5,987
2013 2014 2015
5,554 5,985
3M15 3M16
342
408 368
2013 2014 2015
440
399
3M15 3M16
42
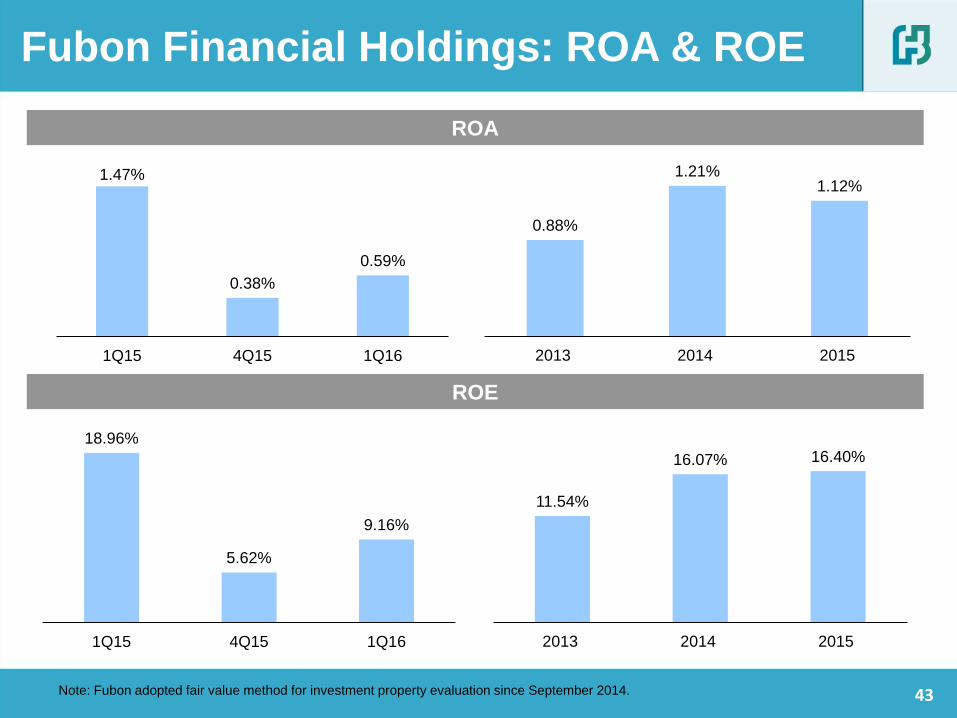
ROA
ROE
Fubon Financial Holdings: ROA & ROE
Note: Fubon adopted fair value method for investment property evaluation since September 2014.
0.88%
1.21% 1.12%
2013 2014 2015
1.47%
0.38%
0.59%
1Q15 4Q15 1Q16
11.54%
16.07% 16.40%
2013 2014 2015
18.96%
5.62%
9.16%
1Q15 4Q15 1Q16
43
Performance review by subsidiary
• Fubon Life
• Fubon Securities
Performance highlights of Fubon Financial Holdings
• Fubon Insurance
Agenda
• Taipei Fubon Bank
• Fubon Bank (China)
2015 Embedded value of Fubon Life
44

4.2 4.5
3.0 3.2
2.1 2.1
1.0 1.8
1Q15 1Q16
Fubon Bank (China)
Treasury & others
Net fee income
Net interest income
15.8 17.3 17.9
8.4 10.6 11.1
9.5
11.0 7.4
5.2 6.0
2013 2014 2015
Taipei Fubon Bank: Revenue
Revenue composition of Taipei Fubon Bank
NT$bn
Steadily growth from net interest income and net fees
33.7
Note: Consolidated basis; Fubon Bank (China) accounted starting from Jan. 7th, 2014
44.1 42.4
10.3
11.5
41.0%
28.1%
38.7%
10.1%
20.3%
28.6%
15.3%
17.9%
28.2%
42.2% 39.3%
24.0%
25.0%
11.7%
46.8%
25.0%
14.1%
17.5%
26.3%
45

40.6%
77.6% 7.3%
5.4%
40.3%
13.6%
11.8%
3.5%
1Q15 1Q16
SN and others
Mutual funds
Custodian andtrust
Insurancecommission
Taipei Fubon Bank: Fee and wealth
management revenue
Sources of fee revenue(1) Wealth management fee(2)
NT$mn NT$mn
Note: (1) Fee income including Taipei Fubon Bank standalone and Taipei Fubon Bank Life Insurance Agency
(2) Wealth management revenue includes fee in the chart and other income (1Q16: NT$93mn; 1Q15: NT$106mn)
(3) Data are stand-alone basis in page 11-16
2,957
3,239 2,690
2,309
+16.5%
78.1% 83.0%
10.3%
9.2% 7.3%
3.7% 4.3%
4.0%
1Q15 1Q16
Others
Syndicationloan
Credit card
Wealthmanagement
46
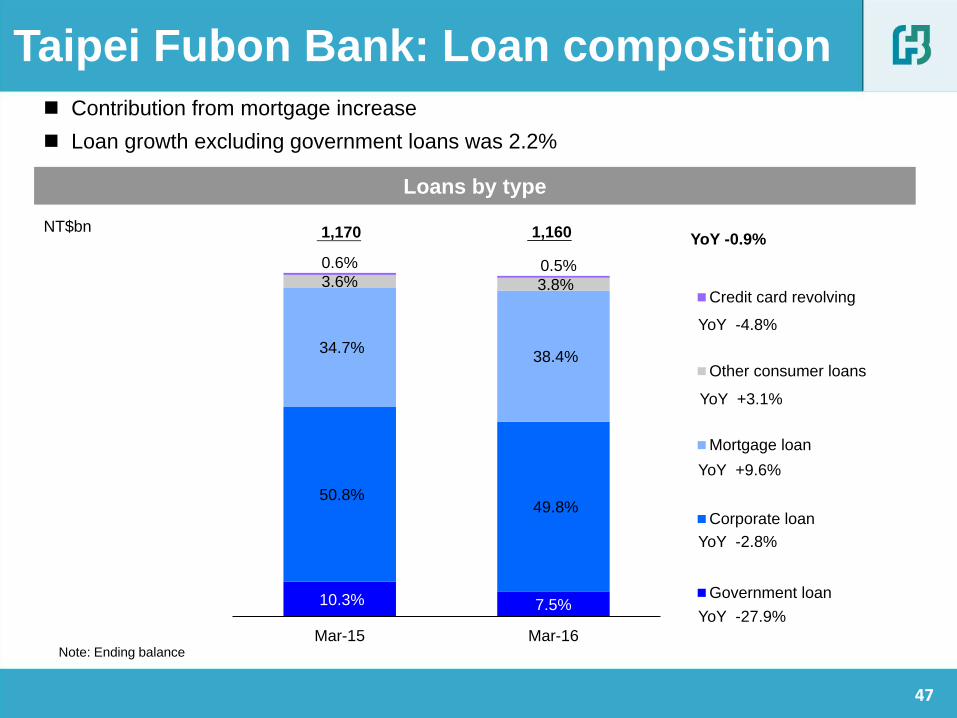
Loans by type
10.3% 7.5%
50.8% 49.8%
34.7% 38.4%
3.6% 3.8%
0.6% 0.5%
Mar-15 Mar-16
Credit card revolving
Other consumer loans
Mortgage loan
Corporate loan
Government loan
Taipei Fubon Bank: Loan composition
NT$bn 1,160 YoY -0.9%
YoY -4.8%
YoY +3.1%
YoY +9.6%
YoY -2.8%
YoY -27.9%
Contribution from mortgage increase
Loan growth excluding government loans was 2.2%
1,170
Note: Ending balance
47
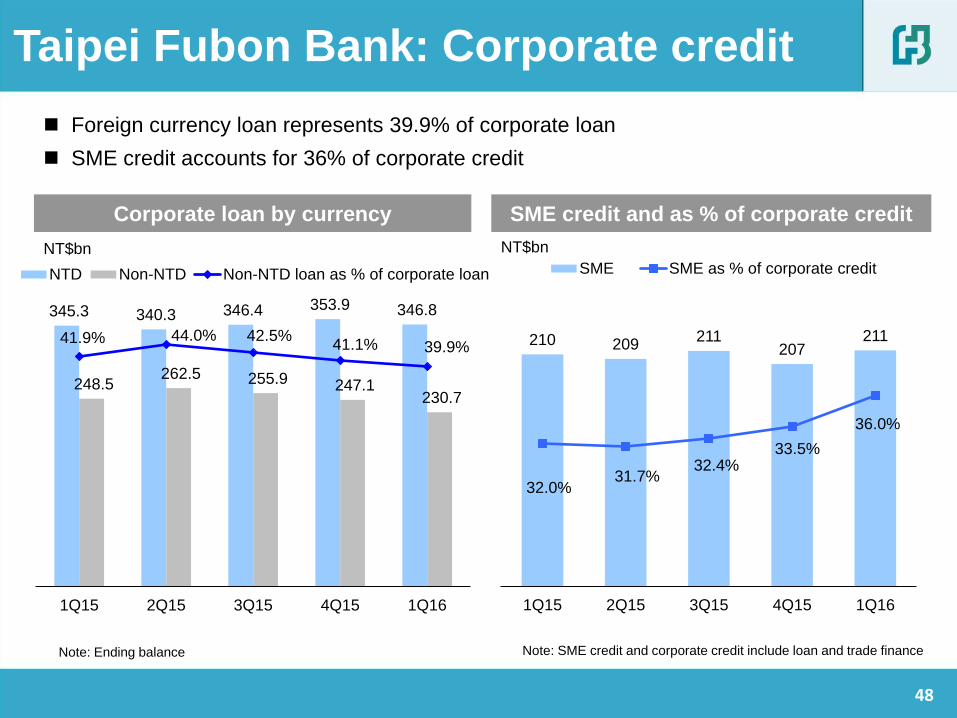
210 209 211
207 211
32.0% 31.7%
32.4% 33.5%
36.0%
1Q15 2Q15 3Q15 4Q15 1Q16
SME SME as % of corporate credit
345.3 340.3 346.4 353.9 346.8
248.5 262.5 255.9 247.1
230.7
41.9% 44.0% 42.5% 41.1% 39.9%
1Q15 2Q15 3Q15 4Q15 1Q16
NTD Non-NTD Non-NTD loan as % of corporate loan
Taipei Fubon Bank: Corporate credit
Corporate loan by currency SME credit and as % of corporate credit
NT$bn
Foreign currency loan represents 39.9% of corporate loan
SME credit accounts for 36% of corporate credit
NT$bn
Note: SME credit and corporate credit include loan and trade finance Note: Ending balance
48

Taipei Fubon Bank: Interest yield and margin
NIM and loan-to-deposit spread
Loan yield and deposit yield
Note: Loan rate calculation inclusive of credit card revolving
1.10% 1.09% 1.10% 1.07% 1.10% 1.08% 1.04% 1.01%
1.28% 1.24% 1.27%
1.24% 1.28% 1.31% 1.32% 1.31%
2Q14 3Q14 4Q14 1Q15 2Q15 3Q15 4Q15 1Q16
NIM Loan-to-deposit spread
2.08% 2.04% 2.08% 2.05% 2.05% 2.05% 2.03% 2.00%
0.80% 0.80% 0.81% 0.81% 0.77% 0.74% 0.70% 0.69%
2Q14 3Q14 4Q14 1Q15 2Q15 3Q15 4Q15 1Q16
Loan rate Deposit rate
49

41.7% 47.7%
58.3% 52.3%
Mar-15 Mar-16
Time
Demand
55.8% 52.9%
44.2% 47.1%
Mar-15 Mar-16
Time
Demand
Taipei Fubon Bank: Deposit mix and LDR
NTD loan-to-deposit ratio (LDR) Deposit mix in NTD
Deposit mix in foreign currency
NT$bn
NT$bn
Foreign currency LDR
1,039 1,103
382 438
Note: Ending balance
66.2%
53.5%
Mar-15 Mar-16
88.2% 83.8%
Mar-15 Mar-16
50

(118)
186
1Q15 1Q16
0.0%
0.2%
0.4%
0.6%
Mar-13 Mar-14 Mar-15 Mar-16
Corporate loan Mortgage loan
Taipei Fubon Bank: Asset quality
NPL ratio
NPL ratio by business Net provision
Coverage ratio
0.27%
0.03%
NT$mn
Net recovery
0.11% 0.11% 0.12%
0.15% 0.18%
Mar-15 Jun-15 Sep-15 Dec-15 Mar-16
0.26% Market
average 1095.99% 1113.09% 1033.47%
816.37% 716.80%
Mar-15 Jun-15 Sep-15 Dec-15 Mar-16
51
Performance review by subsidiary
• Fubon Life
• Fubon Securities
Performance highlights of Fubon Financial Holdings
• Fubon Insurance
Agenda
• Taipei Fubon Bank
• Fubon Bank (China)
2015 Embedded value of Fubon Life
52

37.4
59.7
61.6
67.0
1Q15 1Q16
212.9 191.0 205.3
207.2 234.0
269.1
2013 2014 2015
Renewal premium
FYP
28% yoy growth in total premium income
NT$bn
Fubon Life: Total premium
420.1 425.0
474.4
56.7%
43.3%
55.1%
44.9%
49.3%
50.7%
99.0
126.7
52.9%
47.1%
62.2%
37.8%
53
FYP composition
Fubon Life: First year premium (FYP)
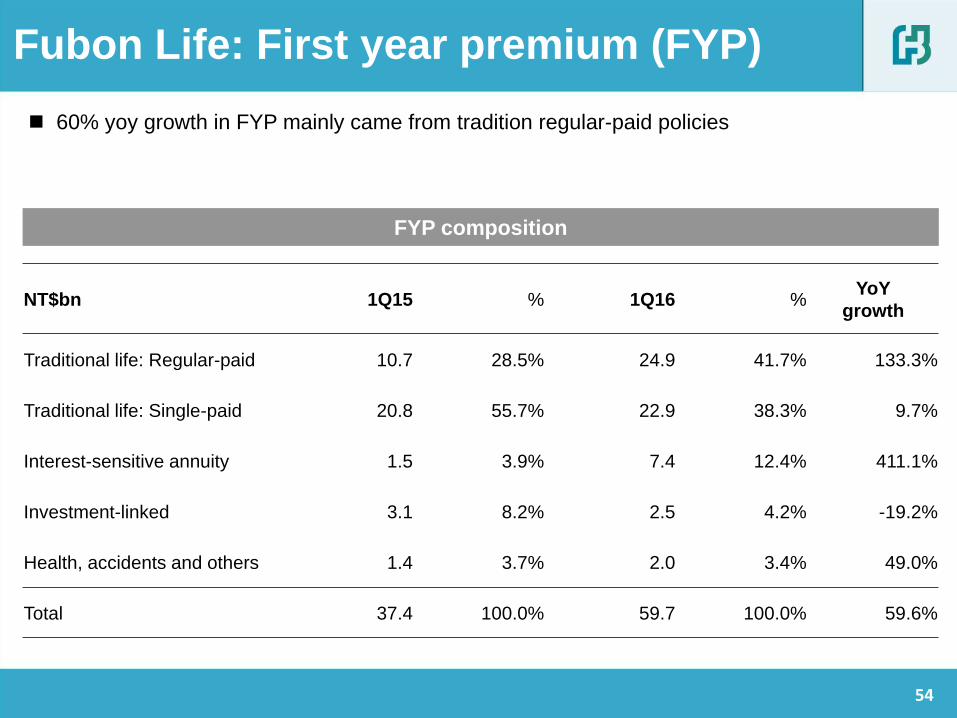
60% yoy growth in FYP mainly came from tradition regular-paid policies
NT$bn 1Q15 % 1Q16 % YoY
growth
Traditional life: Regular-paid 10.7 28.5% 24.9 41.7% 133.3%
Traditional life: Single-paid 20.8 55.7% 22.9 38.3% 9.7%
Interest-sensitive annuity 1.5 3.9% 7.4 12.4% 411.1%
Investment-linked 3.1 8.2% 2.5 4.2% -19.2%
Health, accidents and others 1.4 3.7% 2.0 3.4% 49.0%
Total 37.4 100.0% 59.7 100.0% 59.6%
54

FYPE growth 139% yoy led to
improvement in FYPE/FYP ratio
VNB grew 133.5% in 1Q16 yoy
Fubon Life: Value of new business (VNB)
& First year premium equivalent (FYPE)
FYPE
/FYP
NT$bn
12.3
29.4
32.9% 49.3%
VNB
FYPE
NT$bn
Note: 1Q16 VNB is based on 2015 EV actuarial assumptions
FYPE by channel
36.8% 29.9%
30.0% 38.3%
18.2% 21.0%
15.0% 10.8%
1Q15 1Q16
Other
Bancassurance: throughTaipei Fubon bank
Bancassurance: throughexternal banks
Tied agents
10.8% 6.9% 1.3% 2.6% 2.7%
0.9% 17.0% 7.8%
68.3%
81.8%
1Q15 1Q16
Traditional life:Regular-paid
Traditional life:Single-paid
Investment-linked
Interest-sensitiveannuity
Health, accidentsand others
VNB/
FYP 16.8% 24.6%
6.3
14.7
1Q15 1Q16
55
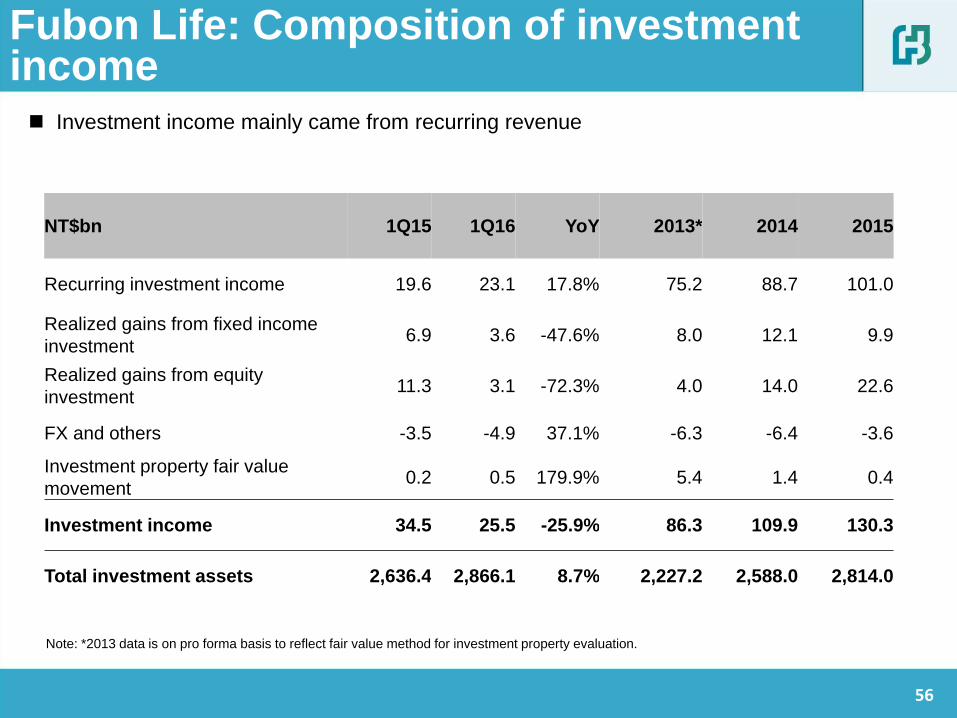
Investment income mainly came from recurring revenue
Fubon Life: Composition of investment income
Note: *2013 data is on pro forma basis to reflect fair value method for investment property evaluation.
NT$bn 1Q15 1Q16 YoY 2013* 2014 2015
Recurring investment income 19.6 23.1 17.8% 75.2 88.7 101.0
Realized gains from fixed income
investment 6.9 3.6 -47.6% 8.0 12.1 9.9
Realized gains from equity
investment 11.3 3.1 -72.3% 4.0 14.0 22.6
FX and others -3.5 -4.9 37.1% -6.3 -6.4 -3.6
Investment property fair value
movement 0.2 0.5 179.9% 5.4 1.4 0.4
Investment income 34.5 25.5 -25.9% 86.3 109.9 130.3
Total investment assets 2,636.4 2,866.1 8.7% 2,227.2 2,588.0 2,814.0
56
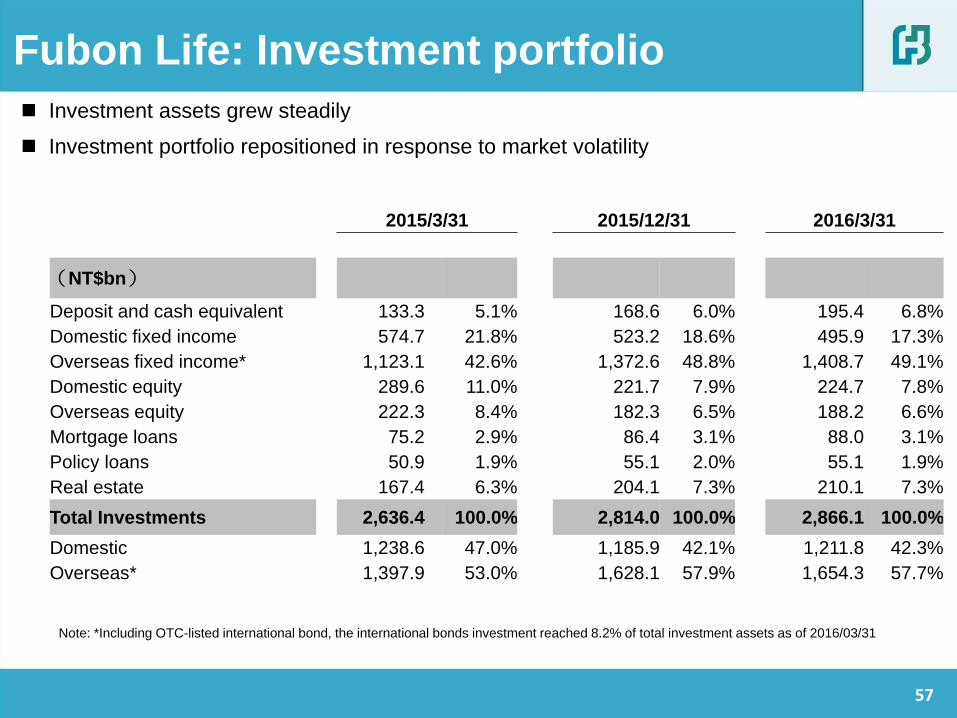
Investment assets grew steadily
Investment portfolio repositioned in response to market volatility
Fubon Life: Investment portfolio
Note: *Including OTC-listed international bond, the international bonds investment reached 8.2% of total investment assets as of 2016/03/31
2015/3/31 2015/12/31 2016/3/31
(NT$bn)
Deposit and cash equivalent 133.3 5.1% 168.6 6.0% 195.4 6.8%
Domestic fixed income 574.7 21.8% 523.2 18.6% 495.9 17.3%
Overseas fixed income* 1,123.1 42.6% 1,372.6 48.8% 1,408.7 49.1%
Domestic equity 289.6 11.0% 221.7 7.9% 224.7 7.8%
Overseas equity 222.3 8.4% 182.3 6.5% 188.2 6.6%
Mortgage loans 75.2 2.9% 86.4 3.1% 88.0 3.1%
Policy loans 50.9 1.9% 55.1 2.0% 55.1 1.9%
Real estate 167.4 6.3% 204.1 7.3% 210.1 7.3%
Total Investments 2,636.4 100.0% 2,814.0 100.0% 2,866.1 100.0%
Domestic 1,238.6 47.0% 1,185.9 42.1% 1,211.8 42.3%
Overseas* 1,397.9 53.0% 1,628.1 57.9% 1,654.3 57.7%
57

Fubon Life: Portfolio of overseas fixed
income
Overseas fixed income by region Overseas fixed income by asset type
4.0% 2.8%
45.7% 38.8%
45.9% 55.2%
4.4% 3.2%
Mar-15 Mar-16
Others
Corporatecredit
Financialbond
Governmentbond
21.6% 19.2%
52.4% 60.9%
26.0% 19.9%
Mar-15 Mar-16
Asia & Other
North America
Europe
58

-36 -36
-67 -65
1Q15 1Q16 CS cost
FX gain/loss & netprovision of FXreserve
Hedging cost & FX gain/loss FX position
Recurring return
Fubon Life: Hedging composition
Currency swap &
FX Policy, 74.7%
Naked USD, 8.1%
Other currencies
, 4.3% Equities/ mutual funds , 12.9%
3.17%
3.35%
2.98%
3.14%
1Q15 1Q16
Beforehedge
Afterhedge
-103bps -101bps
59
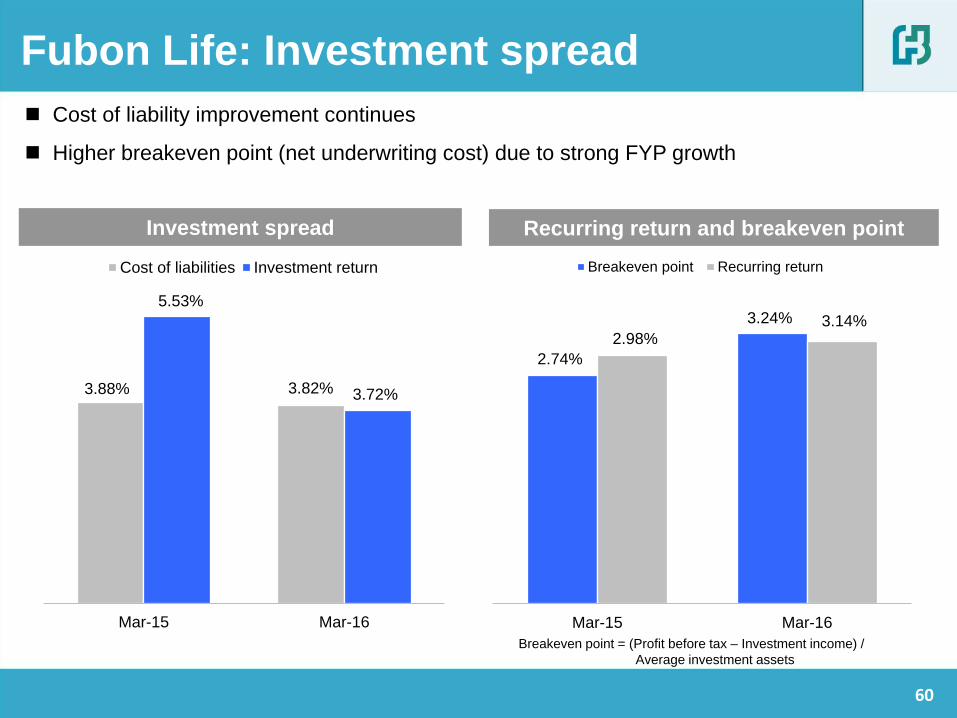
Fubon Life: Investment spread
Cost of liability improvement continues
Higher breakeven point (net underwriting cost) due to strong FYP growth
Breakeven point = (Profit before tax – Investment income) /
Average investment assets
Investment spread Recurring return and breakeven point
2.74%
3.24%
2.98% 3.14%
Mar-15 Mar-16
Breakeven point Recurring return
3.88% 3.82%
5.53%
3.72%
Mar-15 Mar-16
Cost of liabilities Investment return
60
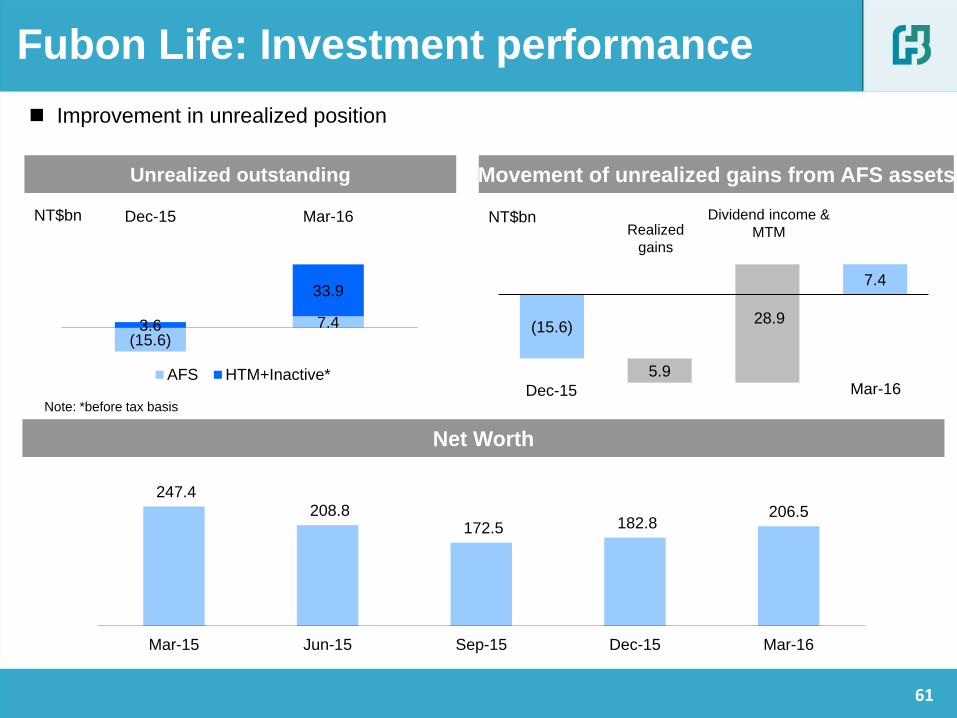
(15.6)
7.4
5.9
28.9
Net Worth
Unrealized outstanding
Fubon Life: Investment performance
Improvement in unrealized position
NT$bn NT$bn Realized
gains
Dividend income &
MTM
Dec-15 Mar-16
Movement of unrealized gains from AFS assets
247.4 208.8
172.5 182.8 206.5
Mar-15 Jun-15 Sep-15 Dec-15 Mar-16
Note: *before tax basis
(15.6) 7.4 3.6
33.9
Dec-15 Mar-16
AFS HTM+Inactive*
61

Performance review by subsidiary
• Fubon Life
• Fubon Securities
Performance highlights of Fubon Financial Holdings
• Fubon Insurance
Agenda
• Taipei Fubon Bank
• Fubon Bank (China)
2015 Embedded value of Fubon Life
62

50.6% 52.1%
13.4%
13.7% 7.6%
5.7% 2.9%
3.3% 15.3%
15.2% 10.2%
10.0%
1Q15 1Q16
Others
Health/Injury
Engineering
Marine
Fire
Auto
Net combined ratio
NT$bn
Premium growth outperformed industry. Top 1 position in premium market share
Net claim ratio increase due to net retained losses from Tainan earthquake
Note: Standalone basis Note: Exclusive of auto compulsory due to the claims are reimbursed
Fubon Insurance: Operating snapshot
Direct written premium by product
7.1
8.1 97.4%
88.8%
54.1% 61.8%
34.7%
35.6%
1Q15 1Q16
Net expense ratio
Net claim ratio
63

Performance review by subsidiary
• Fubon Life
• Fubon Securities
Performance highlights of Fubon Financial Holdings
• Fubon Insurance
Agenda
• Taipei Fubon Bank
• Fubon Bank (China)
2015 Embedded value of Fubon Life
64
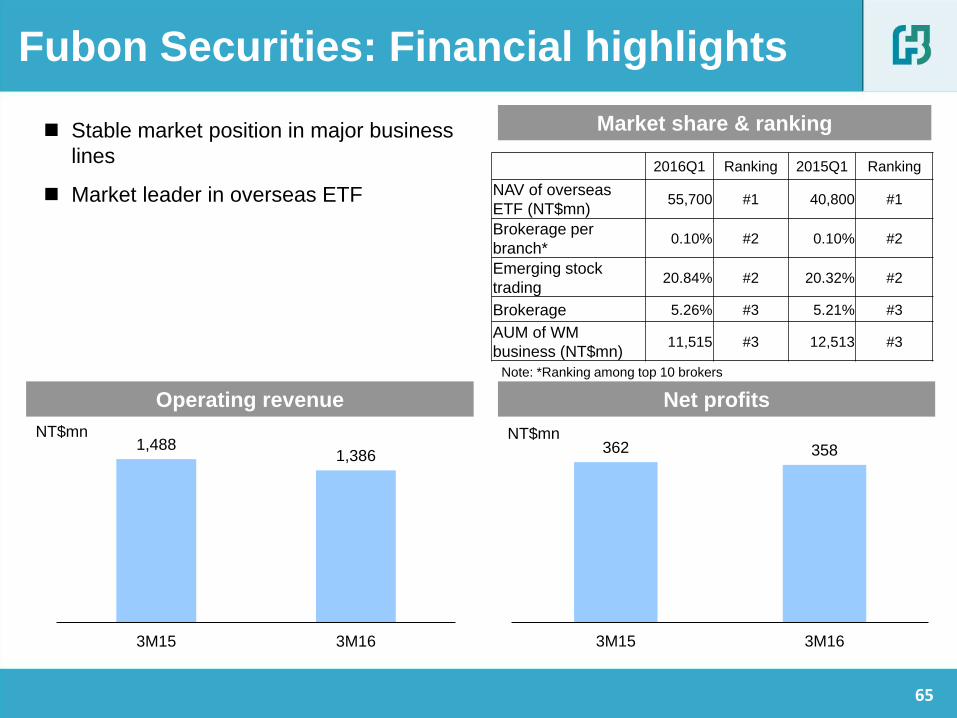
Fubon Securities: Financial highlights
Market share & ranking
Operating revenue
NT$mn
Stable market position in major business
lines
Market leader in overseas ETF
Net profits
NT$mn 1,488
1,386
3M15 3M16
362 358
3M15 3M16
2016Q1 Ranking 2015Q1 Ranking
NAV of overseas
ETF (NT$mn) 55,700 #1 40,800 #1
Brokerage per
branch* 0.10% #2 0.10% #2
Emerging stock
trading 20.84% #2 20.32% #2
Brokerage 5.26% #3 5.21% #3
AUM of WM
business (NT$mn) 11,515 #3 12,513 #3
Note: *Ranking among top 10 brokers
65

Performance review by subsidiary
• Fubon Life
• Fubon Securities
Performance highlights of Fubon Financial Holdings
• Fubon Insurance
Agenda
• Taipei Fubon Bank
• Fubon Bank (China)
2015 Embedded value of Fubon Life
66

20,670 23,522
7,567 4,867
Mar-15 Mar-16
Rediscount Loans (excluding rediscount)
Fubon Bank (China): Key balance sheet
items
Assets Net worth
Deposits Loans
RMB$m
28,388 28,237
RMB$m RMB$m
RMB$m
37,882
43,387
Mar-15 Mar-16
4,578
5,033
Mar-15 Mar-16
60,885 67,367
Mar-15 Mar-16
67

Fubon Bank (China): Financial highlight
ROAA & ROAE
NIM Net Profits
NPL ratio & Coverage ratio
RMB$m
84
152
1Q15 1Q16
0.55%
0.86% 7.39%
12.24%
1Q15 1Q16
ROAA ROAE
1.17%
1.91%
230.0% 157.5%
Mar-15 Mar-16
NPL Coverage ratio
1.36%
1.55%
1Q15 1Q16
68

Performance review by subsidiary
• Fubon Life
• Fubon Securities
Performance highlights of Fubon Financial Holdings
• Fubon Insurance
Agenda
• Taipei Fubon Bank
• Fubon Bank (China)
2015 Embedded value of Fubon Life
69
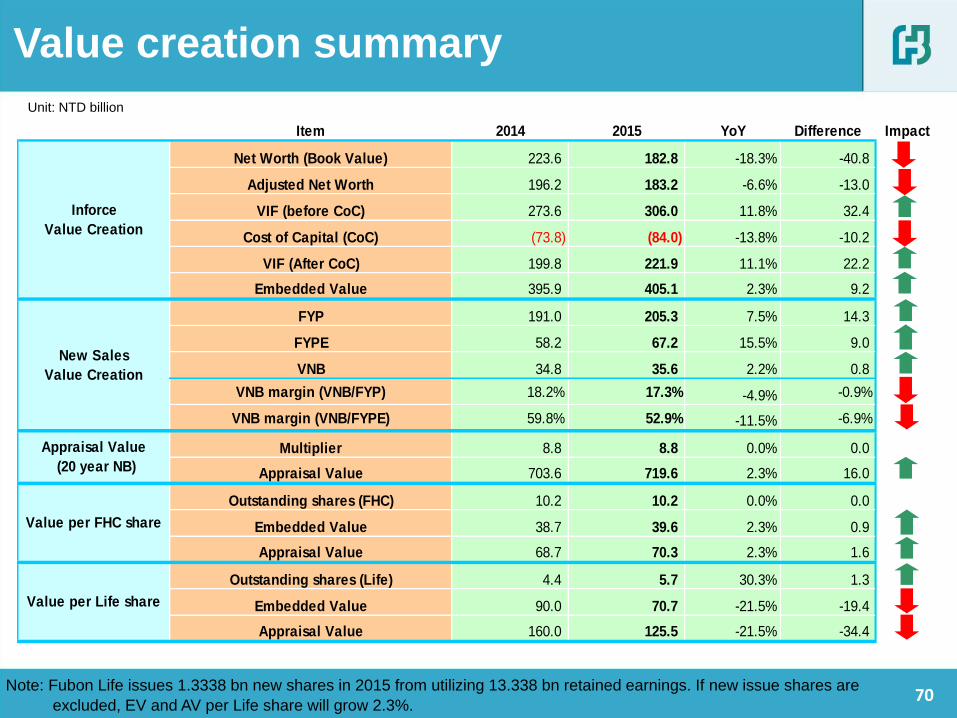
Unit: NTD billion
Item 2014 2015 YoY Difference Impact
Net Worth (Book Value) 223.6 182.8 -18.3% -40.8
Adjusted Net Worth 196.2 183.2 -6.6% -13.0
VIF (before CoC) 273.6 306.0 11.8% 32.4
Cost of Capital (CoC) (73.8) (84.0) -13.8% -10.2
VIF (After CoC) 199.8 221.9 11.1% 22.2
Embedded Value 395.9 405.1 2.3% 9.2
FYP 191.0 205.3 7.5% 14.3
FYPE 58.2 67.2 15.5% 9.0
VNB 34.8 35.6 2.2% 0.8
VNB margin (VNB/FYP) 18.2% 17.3% -4.9% -0.9%
VNB margin (VNB/FYPE) 59.8% 52.9% -11.5% -6.9%
Multiplier 8.8 8.8 0.0% 0.0
Appraisal Value 703.6 719.6 2.3% 16.0
Outstanding shares (FHC) 10.2 10.2 0.0% 0.0
Embedded Value 38.7 39.6 2.3% 0.9
Appraisal Value 68.7 70.3 2.3% 1.6
Outstanding shares (Life) 4.4 5.7 30.3% 1.3
Embedded Value 90.0 70.7 -21.5% -19.4
Appraisal Value 160.0 125.5 -21.5% -34.4
Value per FHC share
Value per Life share
Inforce
Value Creation
New Sales
Value Creation
Appraisal Value
(20 year NB)
Note: Fubon Life issues 1.3338 bn new shares in 2015 from utilizing 13.338 bn retained earnings. If new issue shares are
excluded, EV and AV per Life share will grow 2.3%.
Value creation summary
70
Graph
add
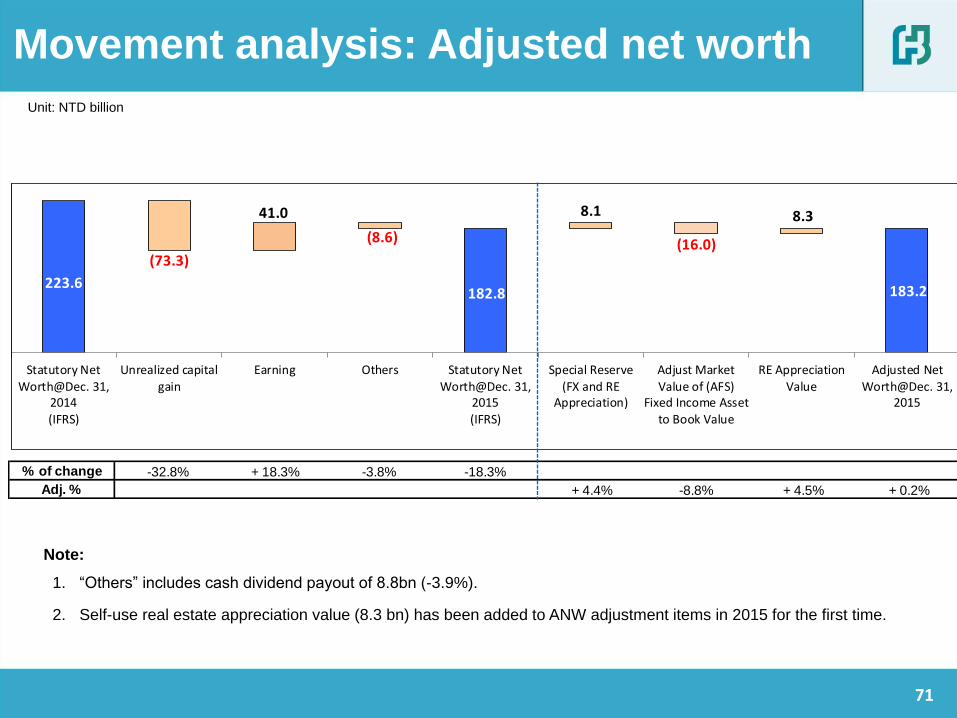
% of change -32.8% + 18.3% -3.8% -18.3%
Adj. % + 4.4% -8.8% + 4.5% + 0.2%
223.6
(73.3)
41.0
(8.6)
182.8
8.1
(16.0)
8.3
183.2
Statutory NetWorth@Dec. 31,
2014(IFRS)
Unrealized capitalgain
Earning Others Statutory NetWorth@Dec. 31,
2015(IFRS)
Special Reserve(FX and RE
Appreciation)
Adjust MarketValue of (AFS)
Fixed Income Assetto Book Value
RE AppreciationValue
Adjusted NetWorth@Dec. 31,
2015
Note:
1. “Others” includes cash dividend payout of 8.8bn (-3.9%).
2. Self-use real estate appreciation value (8.3 bn) has been added to ANW adjustment items in 2015 for the first time.
Movement analysis: Adjusted net worth
Unit: NTD billion
71

% of change -0.8% -9.3% + 11.7% + 1.0% -6.3% + 0.5% + 15.1% + 11.8%
273.6
(2.3)(25.4)
32.0 2.7
(17.2)
1.3 41.2
306.0
-80.0
-30.0
20.0
70.0
120. 0
170. 0
220. 0
270. 0
320. 0
2014 VIF(before CoC)
Model Change Existingbusiness -
transfer to networth
Required returnon existing
business
Data Change Eco.Assumption
Change
Non-eco.Assumption
Change
2015VNB(before
CoC)
2015 VIF(beforeCoC)
Note:
1. Economic assumption change includes changes of foreign exchange rate (+0.9%) and investment return (-7.2%).
2. The equivalent return of EV2014 reporting for VIF increased from 4.64% to 4.70% to reflect rolling over effect.
3. The equivalent return of EV2015 reporting for VIF is 4.58%.
4. 2015 VNB (after CoC) is 35.6 bn.
Unit: NTD billion
Movement analysis: Value of in-force
(before CoC)
72
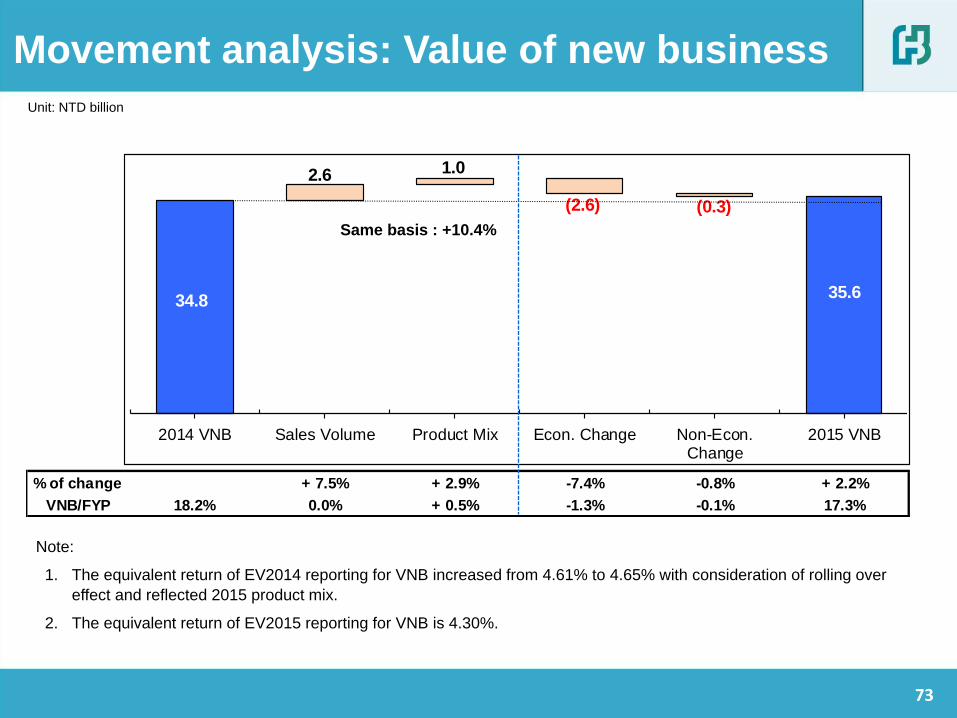
Same basis YoY +14%
% of change + 7.5% + 2.9% -7.4% -0.8% + 2.2%
VNB/FYP 18.2% 0.0% + 0.5% -1.3% -0.1% 17.3%
34.8
2.6 1.0
(2.6) (0.3)
35.6
-8.0
-6.0
-4.0
-2.0
0.0
2.0
4.0
6.0
8.0
10. 0
12. 0
14. 0
16. 0
18. 0
20. 0
22. 0
24. 0
26. 0
28. 0
30. 0
32. 0
34. 0
36. 0
38. 0
40. 0
2014 VNB Sales Volume Product Mix Econ. Change Non-Econ.Change
2015 VNB
Same basis : +10.4%
Note:
1. The equivalent return of EV2014 reporting for VNB increased from 4.61% to 4.65% with consideration of rolling over
effect and reflected 2015 product mix.
2. The equivalent return of EV2015 reporting for VNB is 4.30%.
Movement analysis: Value of new business
Unit: NTD billion
73

Year 2014 Year 2015
Investment
return
VIF
NTD Traditional Policies :
Year 2015 to Year 2052 at 3.98%~5.43%(2053+)
USD Policies :
Year 2015 to Year 2030 at 5.16%~5.96%(2031+)
V1NB
NTD Traditional Policies :
Year 2014 to Year 2047 at 3.89%~5.43%(2048+)
USD Policies :
Year 2014 to Year 2043 at 5.14%~5.96%(2044+)
ISA
Average retained spread for the Interest sensitive
business is around 100bps.
VIF
NTD Traditional Policies :
Year 2016 to Year 2052 at 3.86%~5.57%(2053+)
USD Policies :
Year 2016 to Year 2040 at 5.15%~5.96%(2041+)
V1NB
NTD Traditional Policies :
Year 2015 to Year 2050 at 3.46%~5.55%(2051+)
USD Policies:
Year 2015 to Year 2045 at 4.37%~5.96%(2046+)
ISA
Average retained spread for the Interest sensitive
business is around 50~100 bps.
Risk Discount
Rate
VIF: 11.0%
V1NB: 10.5%
VIF: 11.0%
V1NB: 10.5%
Equivalent
Return
VIF: 4.64% (rolling over to 2015: 4.70%)
V1NB: 4.61% (rolling over to 2015: 4.65%)
VIF: 4.58%
V1NB: 4.30%
YC (10 year)
Initial / ultimate
TWD: 1.64% / 3.50%
USD : 2.28% / 5.25%
TWD: 1.16% / 3.50%
USD: 2.19% / 5.25%
Note
• The FX reserve mechanism was stipulated from 2012, its respective cost is reflected in the derivation of portfolio return.
Economic assumptions
74
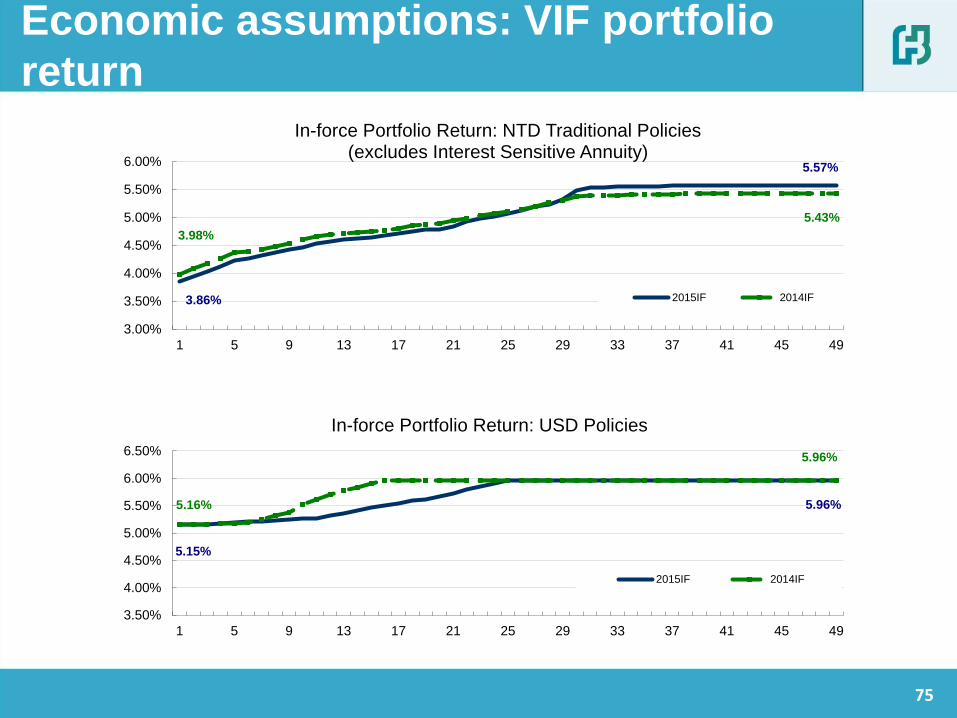
3.86%
5.57%
3.98%
5.43%
3.00%
3.50%
4.00%
4.50%
5.00%
5.50%
6.00%
1 5 9 13 17 21 25 29 33 37 41 45 49
In-force Portfolio Return: NTD Traditional Policies (excludes Interest Sensitive Annuity)
2015IF 2014IF
5.15%
5.96% 5.16%
5.96%
3.50%
4.00%
4.50%
5.00%
5.50%
6.00%
6.50%
1 5 9 13 17 21 25 29 33 37 41 45 49
In-force Portfolio Return: USD Policies
2015IF 2014IF
Economic assumptions: VIF portfolio
return
75

3.46%
5.55%
3.89%
5.43%
3.00%
3.50%
4.00%
4.50%
5.00%
5.50%
6.00%
1 5 9 13 17 21 25 29 33 37 41 45 49
NB Portfolio Return: NTD Traditional Policies (excludes Interest Sensitive Annuity)
2015NB 2014NB
4.37%
5.96%
5.14% 5.96%
3.50%
4.00%
4.50%
5.00%
5.50%
6.00%
6.50%
1 5 9 13 17 21 25 29 33 37 41 45 49
NB Portfolio Return: USD Policies
2015NB 2014NB
Economic assumptions: V1NB portfolio
return
76
Economic assumptions: Discount rate
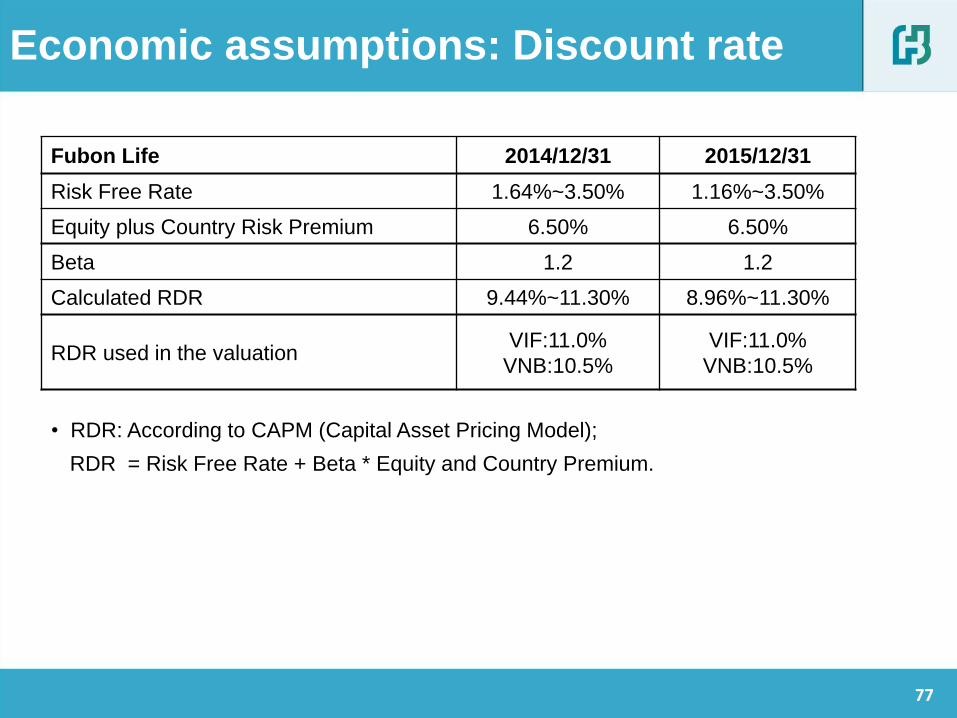
Fubon Life 2014/12/31 2015/12/31
Risk Free Rate 1.64%~3.50% 1.16%~3.50%
Equity plus Country Risk Premium 6.50% 6.50%
Beta 1.2 1.2
Calculated RDR 9.44%~11.30% 8.96%~11.30%
RDR used in the valuation VIF:11.0%
VNB:10.5%
VIF:11.0%
VNB:10.5%
• RDR: According to CAPM (Capital Asset Pricing Model);
RDR = Risk Free Rate + Beta * Equity and Country Premium.
77

Cost of capital
Cost of Capital projection
Maintain the regulatory minimum RBC level of 200% with consideration of following factors:
1) Add 30% C3 risk capital of previous year for all traditional products every year (excludes investment-linked product);
2) Reflect current business operation and future strategy.
Risk-based capital (RBC) regulation changes in 2015:
1) Lower risk factor of foreign real estate investment via SPV-loan in C0 (from 0.2608 to 0.1) to be the same as foreign real estate investment via SPV-equity investment;
2) Lower risk factor of domestic and foreign private equity fund investment in C1 (from 0.2950 to 0.2638);
3) Lower risk factor of domestic stock investment in C1 from 0.2411 to 0.2274;
4) Raise the extra charge percentage of previous year’s C3 risk for traditional products from 10% to 30%.
78

-17.8% 17.8% -25.6% 25.6%
-14.0% 14.0% -19.9% 19.9%
(54.4)
306.0
54.4
Return - 0.25% Base Return + 0.25%
(56.8)
405.1
56.8
Return - 0.25% Base Return + 0.25%
(56.8)
221.9
56.8
Return - 0.25% Base Return + 0.25%
(7.1)35.6
7.1
Return - 0.25% Base Return + 0.25%
Sensitivity summary:Portfolio return
Note: ANW will not be affected by portfolio return.
VIF (before CoC) VIF
EV VNB
Unit: NTD billion
79
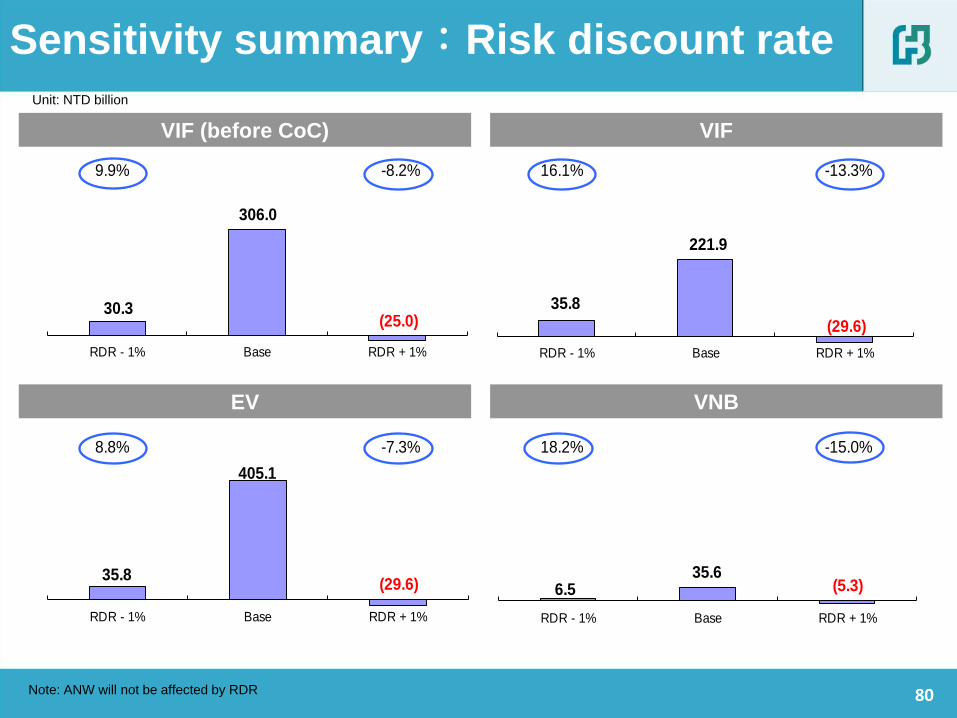
9.9% -8.2% 16.1% -13.3%
8.8% -7.3% 18.2% -15.0%
30.3
306.0
(25.0)
RDR - 1% Base RDR + 1%
35.8
405.1
(29.6)
RDR - 1% Base RDR + 1%
35.8
221.9
(29.6)
RDR - 1% Base RDR + 1%
6.5 35.6
(5.3)
RDR - 1% Base RDR + 1%
VIF (before CoC) VIF
EV VNB
Sensitivity summary:Risk discount rate
Note: ANW will not be affected by RDR
Unit: NTD billion
80
11.8
17.9
24.8 28.0
31.7 31.8 34.8 35.6
EV2008 EV2009 EV2010 EV2011 EV2012 EV2013 EV2014 EV2015
Value of New Business
單位: 新台幣十億元
38.5 52.5
73.6 88.7
116.8
161.9
199.8
221.9
EV2008 EV2009 EV2010 EV2011 EV2012 EV2013 EV2014 EV2015
77.7
128.8 155.5
176.0
217.9
295.7
395.9 405.1
EV2008 EV2009 EV2010 EV2011 EV2012 EV2013 EV2014 EV2015
CAGR = 17% (3.0x) CAGR = 13% (2.4x)
CAGR = 28% (5.8x)
CAGR = 27% (5.2x)
2015 summary: Track record of Fubon
Life’s value creation NB Margin (VNB / FYP)
Value of In-Force Embedded Value
Unit: NTD billion
81

3.68 3.87 3.88 3.97 4.06 4.14 4.10
3.78 3.80 4.01
4.42
4.74 4.97
EV2009/2010 EV2010/2011 EV2011/2012 EV2012/2013 EV2013/2014 EV2014/2015 EV2015/2016
Investment return: Assumption vs. Actual
Note:
1. Track record shows higher actual return than EV assumption in general.
2. The investment return for 2013 and 2014 includes fair value recognition of investment property, which is
+0.38% and +0.05% respectively.
82

The Engagement
• Deloitte Advisory (Hong Kong) Limited (“Deloitte Consulting”) were retained by Fubon Life to perform an
independent review of the Embedded Value (EV) as at 31 December 2015 and the Value of One Year’s New
Business (V1NB) written over the period of 1 January 2015 to 31 December 2015.
Scope of Deloitte Consulting’s Involvement
• Review and opine on the reasonableness of the EV and V1NB as calculated by the Company;
• Review of the reasonableness of the assumptions used in the calculations, taking into consideration both the
Company’s recent experience and the experience of the Taiwanese life insurance market;
• Review, at a high-level, model changes to the actuarial projection model since the previous valuation date;
• Review of the Company’s projection approach of the Cost of Capital;
• Review of the data put through the model compared to the policy data on the Company’s policy administration
systems to judge the extent to which the business has been valued in the financial model and to identify the
portion (if any) omitted and how that was valued;
• Review of the approach used to determine the Adjusted Net Worth (“ANW”), in particular, the adjustments
made in deriving the ANW, and any other adjustments made outside of the actuarial projection model;
• Review of the Company's analysis of change in the Value of In-Force Business (“VIF”) between 31 December
2014 and 31 December 2015.
Deloitte Consulting
The Engagement • Deloitte Advisory (Hong Kong) Limited (“Deloitte Consulting”) were retained by Fubon Life to perform an
independent review of the Embedded Value (EV) as at 31 December 2015 and the Value of One Year’s New
Business (V1NB) written over the period of 1 January 2015 to 31 December 2015.
Scope of Deloitte Consulting’s Involvement • Review and opine on the reasonableness of the EV and V1NB as calculated by the Company;
• Review of the reasonableness of the assumptions used in the calculations, taking into consideration both the
Company’s recent experience and the experience of the Taiwanese life insurance market;
• Review, at a high-level, model changes to the actuarial projection model since the previous valuation date;
• Review of the Company’s projection approach of the Cost of Capital;
• Review of the data put through the model compared to the policy data on the Company’s policy
administration systems to judge the extent to which the business has been valued in the financial model and
to identify the portion (if any) omitted and how that was valued;
• Review of the approach used to determine the Adjusted Net Worth (“ANW”), in particular, the adjustments
made in deriving the ANW, and any other adjustments made outside of the actuarial projection model;
• Review of the Company's analysis of change in the Value of In-Force Business (“VIF”) between 31 December
2014 and 31 December 2015.
Independent review by Deloitte Consulting
83

Fubon Life calculated the EV and V1NB at Risk Adjusted Discount Rates (“RDR”) of
11.0% and 10.5% respectively.
RFR based on current government
bond yield
RFR based on Company’s long-
term view
Equivalent RFR for New Business
Equivalent RFR for In-Force Business
Risk Free Rate (“RFR”) 1.16% 3.50% 2.59% 2.64%
Equity and Country Risk Premium 6.50% 6.50% 6.50% 6.50%
Beta 1.20 1.20 1.20 1.20
Calculated Risk Discount Rate 8.96% 11.30% 10.39% 10.44%
Risk Discount Rate used in the Valuation for VIF
11.00%
Risk Discount Rate used in the Valuation for V1NB
10.50%
Reference – RDR based on Capital Asset Pricing Model (CAPM):
RDR = RFR + Beta * Equity and Country Risk Premium
Deloitte Consulting
Risk adjusted discount rates
84

Deloitte Consulting independently derived a range of RDRs using the CAPM
approach:
The low end of the RDR is developed based on the current yield on 10-year Taiwan government bonds.
The high end of the RDR is developed based on the Company’s view of the 10-year Taiwan government bond in the future.
The equivalent RFR is the RFR equivalent to using a set of graded-up RFR from 1.16% to 3.50% that derives the same VIF and V1NB.
The Equity and Country Risk Premium was developed based on the Country Default Spreads and Risk Premiums research published by New York University.
The Beta of 1.2 was set using a risk profiling approach which considers risks related to the product range, distribution diversification/vulnerability, regulatory intervention and investments. Note that this beta value is consistent with that used in previous valuations.
The RDR assumption applied by Fubon Life in the valuation lies within the range of RDR that we derived.
In particular, we feel comfortable with different RDRs being used for the valuation of the in-force and new business, given the specific market conditions in Taiwan: it is well-known that the legacy business has a much riskier profile than the current new business, and hence it is reasonable for shareholders to be expecting a higher rate of return for the higher risk level. We feel that Fubon Life has taken a good approach in splitting up the RDR assumption for the two distinctively different blocks of business.
Deloitte Consulting
Comments: Risk adjusted discount rates
85

A set of rising investment return assumption has been used in this valuation
which is considered reasonable for the present market conditions.
Fubon Life’s derivation of the investment return assumption is featured by the following:
• Derivation methodology is consistent with that applied in previous valuations;
• The methodology involves:
For VIF, the investment return assumption was derived from a combination of the investment return
generated by the run-off of the existing asset portfolio and of that from future purchases of new
assets;
For V1NB, the new business is not supported by returns on existing assets and the investment
return was derived from future purchases of new assets;
• New assets are purchased at the prevailing new money rates, which are set to equal to the expected future
risk free rates plus a risk margin for each asset type;
• Future risk free rates are set starting off with the actual yield curves as at the valuation date and are
assumed to rise to a long-term level over a 10-year period. For New Taiwan Dollar and US Dollar
respectively, the initial risk free rates are 1.16% and 2.19% and a long-term risk free rate of 3.50% and
5.25% is assumed.
• Different assumptions were derived for different types of business, which were assumed to have a different
long-term asset allocation.
• For some business lines, the investment return assumption derived in the above-mentioned manner was
capped at a certain level for conservative reasons.
Deloitte Consulting
Comments: Investment return (1)
86

It is in Deloitte Consulting’s view that:
Methodology
• Fubon Life’s derivation methodology for the investment return assumption is reasonable
and consistent with the way that the ANW is calculated;
Economic Assumptions
• The expected long-term risk-free rate for New Taiwan Dollar yield and US Dollar yield are
maintained at 3.5% and 5.25% respectively.
• We note that taking a view on the future capital market is not uncommon under the
traditional Embedded Value methodology. On a macro-economic level the arguments put
forward for rising interest rates are plausible, and we note that the expected future rise in
yields is spread out over a reasonably long period of 10 years.
• Readers should be aware that capital market conditions are subject to the impact of
many forces. Yields and prices of financial instruments can move dramatically in a short
period of time. As a result, it is difficult to predict the interest rate level in the future with
great certainty. Readers should refer to the sensitivity tests to develop a broader
understanding of the impact of the investment return assumption on the assessment of
the economic value of Fubon Life.
• Overall, the economic assumptions appear to be reasonable.
Deloitte Consulting
Comments: Investment return (2)
87
Non - Economic Assumptions
• The non-economic assumptions reflect Fubon Life’s best estimate of future operating experience, and
are appropriately supported by the company’s historical operating experience.
Deloitte Consulting
Comments: Non-Economic assumptions
88

Deloitte Consulting have reviewed the Embedded Value and Value of
One Year’s New Business results at a high-level under the generally accepted method for
calculating traditional embedded values in Taiwan:
• Review of the changes in the VIF relative to the assumption changes and model changes
from 2014 to 2015;
• Review of the changes in the new business profit margin relative to that in 2014 based on
information on changes in sales mix, sales volume and valuation assumptions;
• Review of the sensitivities relative to the base case results.
The Embedded Value and Value of One Year’s New Business results appear to be
reasonable within the above context.
Deloitte Consulting’s detailed opinion can be found in their opinion letter.
Deloitte Consulting
Comments: EV and V1NB Results
89

Thank you
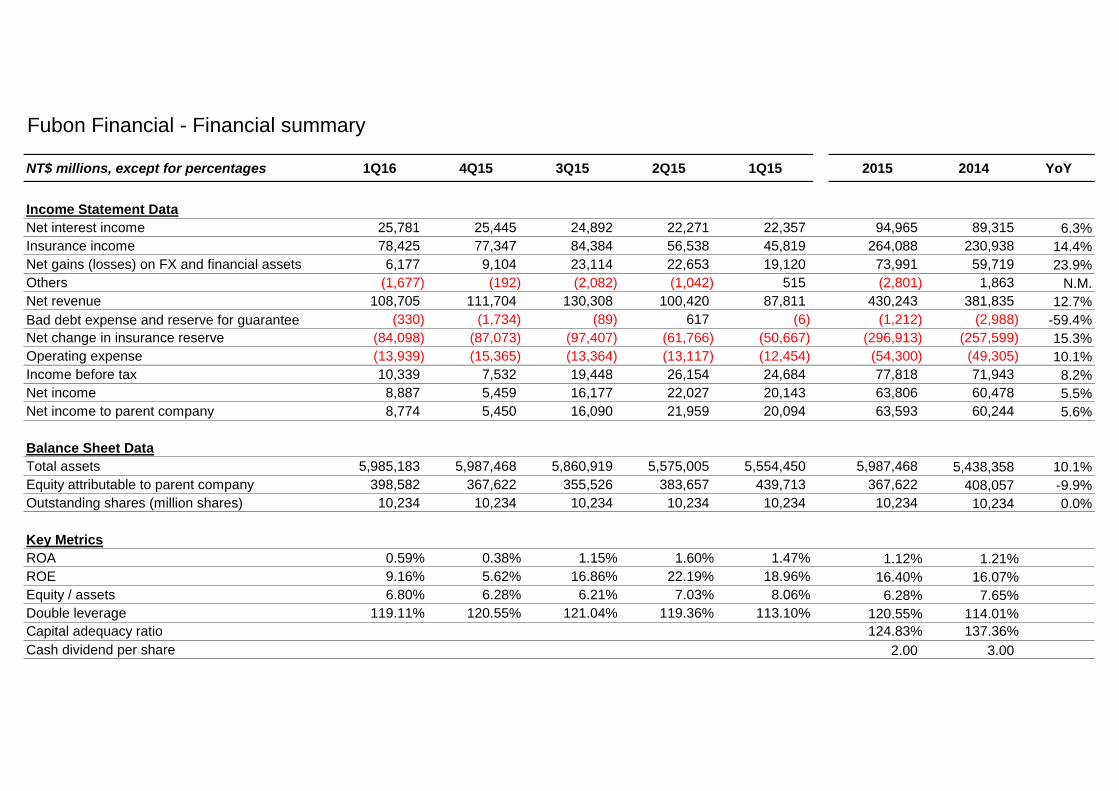
Fubon Financial - Financial summary
NT$ millions, except for percentages 1Q16 4Q15 3Q15 2Q15 1Q15 2015 2014 YoY
Income Statement Data
Net interest income 25,781 25,445 24,892 22,271 22,357 94,965 89,315 6.3%
Insurance income 78,425 77,347 84,384 56,538 45,819 264,088 230,938 14.4%
Net gains (losses) on FX and financial assets 6,177 9,104 23,114 22,653 19,120 73,991 59,719 23.9%
Others (1,677) (192) (2,082) (1,042) 515 (2,801) 1,863 N.M.
Net revenue 108,705 111,704 130,308 100,420 87,811 430,243 381,835 12.7%
Bad debt expense and reserve for guarantee (330) (1,734) (89) 617 (6) (1,212) (2,988) -59.4%
Net change in insurance reserve (84,098) (87,073) (97,407) (61,766) (50,667) (296,913) (257,599) 15.3%
Operating expense (13,939) (15,365) (13,364) (13,117) (12,454) (54,300) (49,305) 10.1%
Income before tax 10,339 7,532 19,448 26,154 24,684 77,818 71,943 8.2%
Net income 8,887 5,459 16,177 22,027 20,143 63,806 60,478 5.5%
Net income to parent company 8,774 5,450 16,090 21,959 20,094 63,593 60,244 5.6%
Balance Sheet Data
Total assets 5,985,183 5,987,468 5,860,919 5,575,005 5,554,450 5,987,468 5,438,358 10.1%
Equity attributable to parent company 398,582 367,622 355,526 383,657 439,713 367,622 408,057 -9.9%
Outstanding shares (million shares) 10,234 10,234 10,234 10,234 10,234 10,234 10,234 0.0%
Key Metrics
ROA 0.59% 0.38% 1.15% 1.60% 1.47% 1.12% 1.21%
ROE 9.16% 5.62% 16.86% 22.19% 18.96% 16.40% 16.07%
Equity / assets 6.80% 6.28% 6.21% 7.03% 8.06% 6.28% 7.65%
Double leverage 119.11% 120.55% 121.04% 119.36% 113.10% 120.55% 114.01%
Capital adequacy ratio 124.83% 137.36%
Cash dividend per share 2.00 3.00
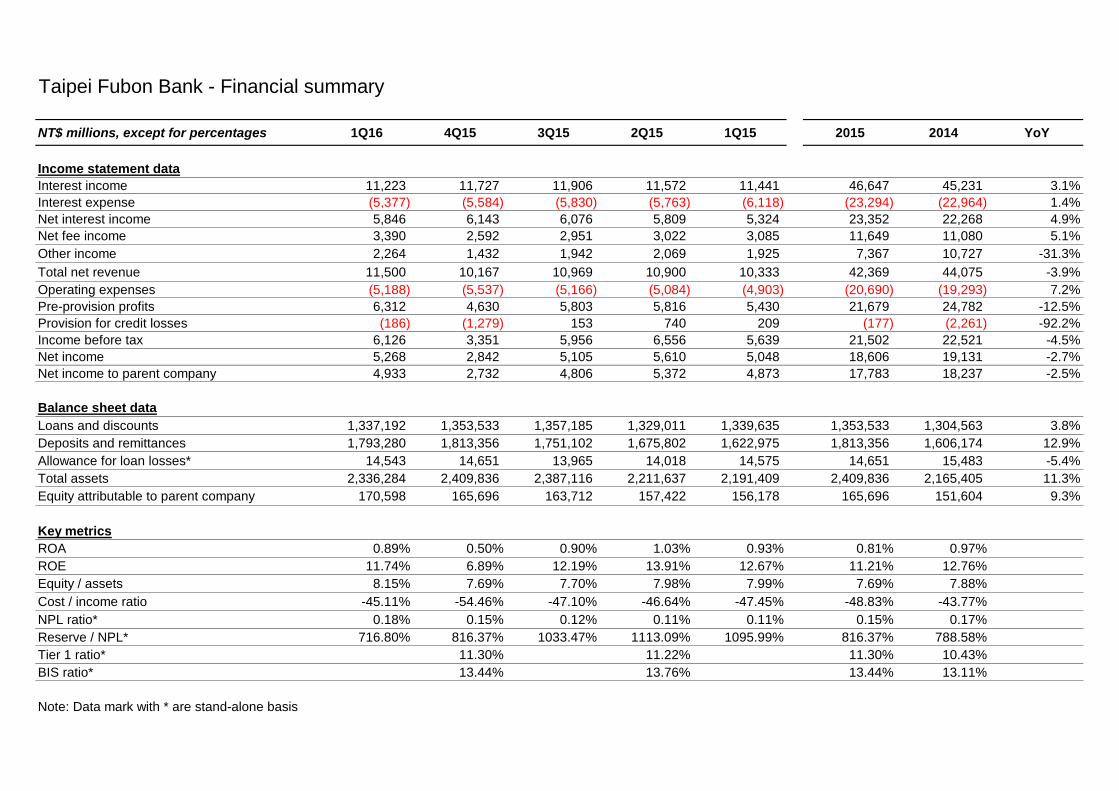
Taipei Fubon Bank - Financial summary
NT$ millions, except for percentages 1Q16 4Q15 3Q15 2Q15 1Q15 2015 2014 YoY
Income statement data
Interest income 11,223 11,727 11,906 11,572 11,441 46,647 45,231 3.1%
Interest expense (5,377) (5,584) (5,830) (5,763) (6,118) (23,294) (22,964) 1.4%
Net interest income 5,846 6,143 6,076 5,809 5,324 23,352 22,268 4.9%
Net fee income 3,390 2,592 2,951 3,022 3,085 11,649 11,080 5.1%
Other income 2,264 1,432 1,942 2,069 1,925 7,367 10,727 -31.3%
Total net revenue 11,500 10,167 10,969 10,900 10,333 42,369 44,075 -3.9%
Operating expenses (5,188) (5,537) (5,166) (5,084) (4,903) (20,690) (19,293) 7.2%
Pre-provision profits 6,312 4,630 5,803 5,816 5,430 21,679 24,782 -12.5%
Provision for credit losses (186) (1,279) 153 740 209 (177) (2,261) -92.2%
Income before tax 6,126 3,351 5,956 6,556 5,639 21,502 22,521 -4.5%
Net income 5,268 2,842 5,105 5,610 5,048 18,606 19,131 -2.7%
Net income to parent company 4,933 2,732 4,806 5,372 4,873 17,783 18,237 -2.5%
Balance sheet data
Loans and discounts 1,337,192 1,353,533 1,357,185 1,329,011 1,339,635 1,353,533 1,304,563 3.8%
Deposits and remittances 1,793,280 1,813,356 1,751,102 1,675,802 1,622,975 1,813,356 1,606,174 12.9%
Allowance for loan losses* 14,543 14,651 13,965 14,018 14,575 14,651 15,483 -5.4%
Total assets 2,336,284 2,409,836 2,387,116 2,211,637 2,191,409 2,409,836 2,165,405 11.3%
Equity attributable to parent company 170,598 165,696 163,712 157,422 156,178 165,696 151,604 9.3%
Key metrics
ROA 0.89% 0.50% 0.90% 1.03% 0.93% 0.81% 0.97%
ROE 11.74% 6.89% 12.19% 13.91% 12.67% 11.21% 12.76%
Equity / assets 8.15% 7.69% 7.70% 7.98% 7.99% 7.69% 7.88%
Cost / income ratio -45.11% -54.46% -47.10% -46.64% -47.45% -48.83% -43.77%
NPL ratio* 0.18% 0.15% 0.12% 0.11% 0.11% 0.15% 0.17%
Reserve / NPL* 716.80% 816.37% 1033.47% 1113.09% 1095.99% 816.37% 788.58%
Tier 1 ratio* 11.30% 11.22% 11.30% 10.43%
BIS ratio* 13.44% 13.76% 13.44% 13.11%
Note: Data mark with * are stand-alone basis

Fubon Life - Financial summary
NT$ millions, except for percentages 1Q16 4Q15 3Q15 2Q15 1Q15 2015 2014 YoY
Income statement data
First year premium 59,722 62,108 62,152 43,604 37,418 205,282 190,974 7.5%
Retained earned premium 120,845 122,879 125,791 99,205 92,422 440,297 390,077 12.9%
Total investment income 25,537 26,382 32,907 36,376 34,591 130,256 109,876 18.5%
Recurring investment income 23,110 25,326 33,093 22,885 19,736 101,040 88,695 13.9%
Other investment income 2,427 1,056 (186) 13,491 14,855 29,216 21,181 37.9%
Realized gains (losses) from fixed income 3,603 1,520 (2,633) 4,112 6,872 9,870 12,127 -18.6%
Realized gains (losses) from equity 3,138 (612) (368) 12,271 11,331 22,622 14,021 61.3%
FX and others (4,855) (420) 3,301 (2,969) (3,541) (3,629) (6,413) -43.4%
Investment property fair value movement 541 569 (486) 77 193 353 1,446 -75.6%
Other income 626 647 686 458 367 2,159 2,006 7.6%
Total operating revenue 147,008 149,908 159,383 136,038 127,381 572,711 501,960 14.1%
Retained claim payment 45,527 47,735 44,330 45,926 49,610 187,601 168,249 11.5%
Net commission expense 9,113 7,101 7,314 6,300 5,378 26,093 23,215 12.4%
Net change in insurance liability 85,625 86,518 91,860 62,329 51,957 292,665 254,691 14.9%
General and administrative expense 4,122 4,672 3,761 3,601 3,491 15,526 13,652 13.7%
Other operating costs 462 441 447 664 379 1,932 1,078 79.2%
Total operating costs and expenses 144,850 146,466 147,713 118,821 110,816 523,816 460,885 13.7%
Net non-operating income / (expenses) 106 141 141 91 144 518 222 133.7%
Income before tax 2,265 3,583 11,812 17,309 16,710 49,413 41,296 19.7%
Net income 2,137 2,169 9,770 15,827 13,252 41,018 35,367 16.0%
Net income to parent company 2,137 2,169 9,770 15,827 13,252 41,018 35,367 16.0%
Balance sheet data
Total assets 3,117,105 3,035,563 2,951,402 2,843,190 2,845,002 3,035,563 2,790,427 8.8%
Total assets (general account) 2,982,282 2,900,201 2,821,057 2,709,001 2,708,199 2,900,201 2,653,199 9.3%
Insurance liabilities 2,728,570 2,656,145 2,569,316 2,447,646 2,390,639 2,656,145 2,346,722 13.2%
Total liabilities 2,910,646 2,852,781 2,778,892 2,634,408 2,597,645 2,852,781 2,566,830 11.1%
Total liabilities (general account) 2,775,823 2,717,419 2,648,546 2,500,220 2,460,842 2,717,419 2,429,603 11.8%
Equity attributable to parent company 206,459 182,782 172,511 208,781 247,357 182,782 223,597 -18.3%
Key matrices
ROA 0.28% 0.30% 1.36% 2.25% 1.88% 1.41% 1.35%
ROE 4.39% 4.27% 19.73% 29.28% 22.51% 20.19% 17.96%
Equity / Assets 6.62% 6.02% 5.85% 7.34% 8.69% 6.02% 8.01%
Claims and benefits ratio 37.67% 38.85% 35.24% 46.29% 53.68% 42.61% 43.13%
Expense ratio 3.41% 3.80% 2.99% 3.63% 3.78% 3.53% 3.50%
Persistency ratio - 13th month 96.19% 96.66% 94.57% 95.22% 95.24% 96.66% 95.12%
Persistency ratio - 25th month 92.92% 92.07% 90.71% 90.43% 90.13% 92.07% 89.67%

Fubon Insurance - Financial summary
NT$ millions, except for percentages 1Q16 4Q15 3Q15 2Q15 1Q15 2015 2014 YoY
Income statement data
Direct written premiums 9,297 8,874 8,452 9,540 8,150 35,016 32,718 7.0%
Retention of earned premiums 7,230 6,833 7,024 6,833 6,450 27,139 24,653 10.1%
Net income from investment 497 485 739 852 735 2,811 2,498 12.5%
Other operating revenue 345 363 331 304 297 1,295 1,082 19.7%
Retained insurance payments 3,833 3,887 3,796 3,348 3,218 14,250 13,128 8.5%
Net change in liability reserve 358 (329) 377 256 352 656 626 4.7%
Commission and operating expenses 3,306 3,506 3,178 3,203 2,885 12,772 11,363 12.4%
Non-Operating Income (22) (9) (36) (29) (22) (96) (109) -12.2%
Income before tax 553 607 707 1,153 1,005 3,472 3,007 15.5%
Net income 444 485 566 962 826 2,839 2,420 17.3%
Net income to parent company 516 595 674 1,050 895 3,213 2,816 14.1%
Balance sheet data
Total assets 94,323 89,213 90,125 87,732 86,170 89,213 83,349 7.0%
Investment assets 65,752 64,689 64,278 61,978 63,377 64,689 60,362 7.2%
Policy reserve 51,580 47,470 48,059 47,350 45,445 47,470 44,930 5.7%
Equity attributable to parent company 30,281 28,677 28,099 28,829 30,057 28,677 27,665 3.7%
Summary ratios
ROA 1.94% 2.25% 2.61% 4.50% 3.90% 3.29% 2.99%
ROE 7.00% 8.44% 9.67% 14.87% 12.40% 11.41% 10.06%
Total investment return 3.05% 3.10% 4.74% 5.57% 4.83% 4.50% 4.21%
Solvency margin (NWP/equity) 99.48% 99.62% 97.27% 104.81% 87.28% 97.95% 94.11%
Retention ratio 75.19% 75.46% 75.13% 74.35% 76.42% 75.30% 76.11%
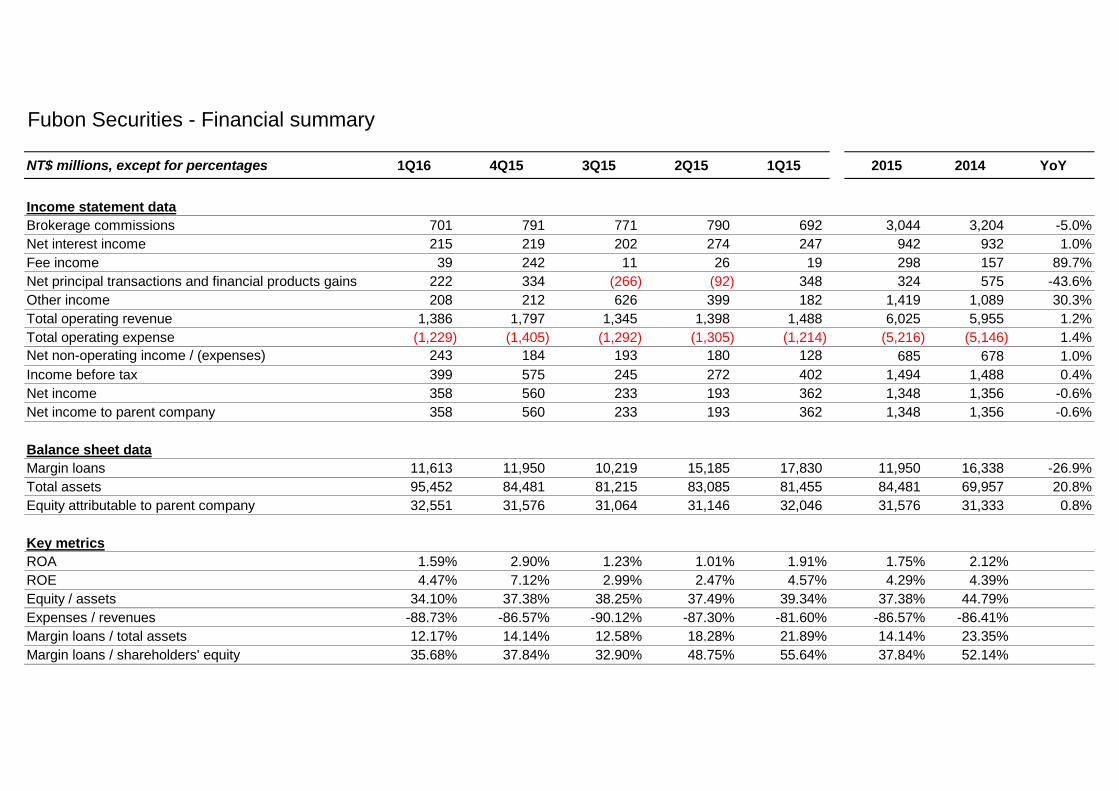
Fubon Securities - Financial summary
NT$ millions, except for percentages 1Q16 4Q15 3Q15 2Q15 1Q15 2015 2014 YoY
Income statement data
Brokerage commissions 701 791 771 790 692 3,044 3,204 -5.0%
Net interest income 215 219 202 274 247 942 932 1.0%
Fee income 39 242 11 26 19 298 157 89.7%
Net principal transactions and financial products gains 222 334 (266) (92) 348 324 575 -43.6%
Other income 208 212 626 399 182 1,419 1,089 30.3%
Total operating revenue 1,386 1,797 1,345 1,398 1,488 6,025 5,955 1.2%
Total operating expense (1,229) (1,405) (1,292) (1,305) (1,214) (5,216) (5,146) 1.4%
Net non-operating income / (expenses) 243 184 193 180 128 685 678 1.0%
Income before tax 399 575 245 272 402 1,494 1,488 0.4%
Net income 358 560 233 193 362 1,348 1,356 -0.6%
Net income to parent company 358 560 233 193 362 1,348 1,356 -0.6%
Balance sheet data
Margin loans 11,613 11,950 10,219 15,185 17,830 11,950 16,338 -26.9%
Total assets 95,452 84,481 81,215 83,085 81,455 84,481 69,957 20.8%
Equity attributable to parent company 32,551 31,576 31,064 31,146 32,046 31,576 31,333 0.8%
Key metrics
ROA 1.59% 2.90% 1.23% 1.01% 1.91% 1.75% 2.12%
ROE 4.47% 7.12% 2.99% 2.47% 4.57% 4.29% 4.39%
Equity / assets 34.10% 37.38% 38.25% 37.49% 39.34% 37.38% 44.79%
Expenses / revenues -88.73% -86.57% -90.12% -87.30% -81.60% -86.57% -86.41%
Margin loans / total assets 12.17% 14.14% 12.58% 18.28% 21.89% 14.14% 23.35%
Margin loans / shareholders' equity 35.68% 37.84% 32.90% 48.75% 55.64% 37.84% 52.14%
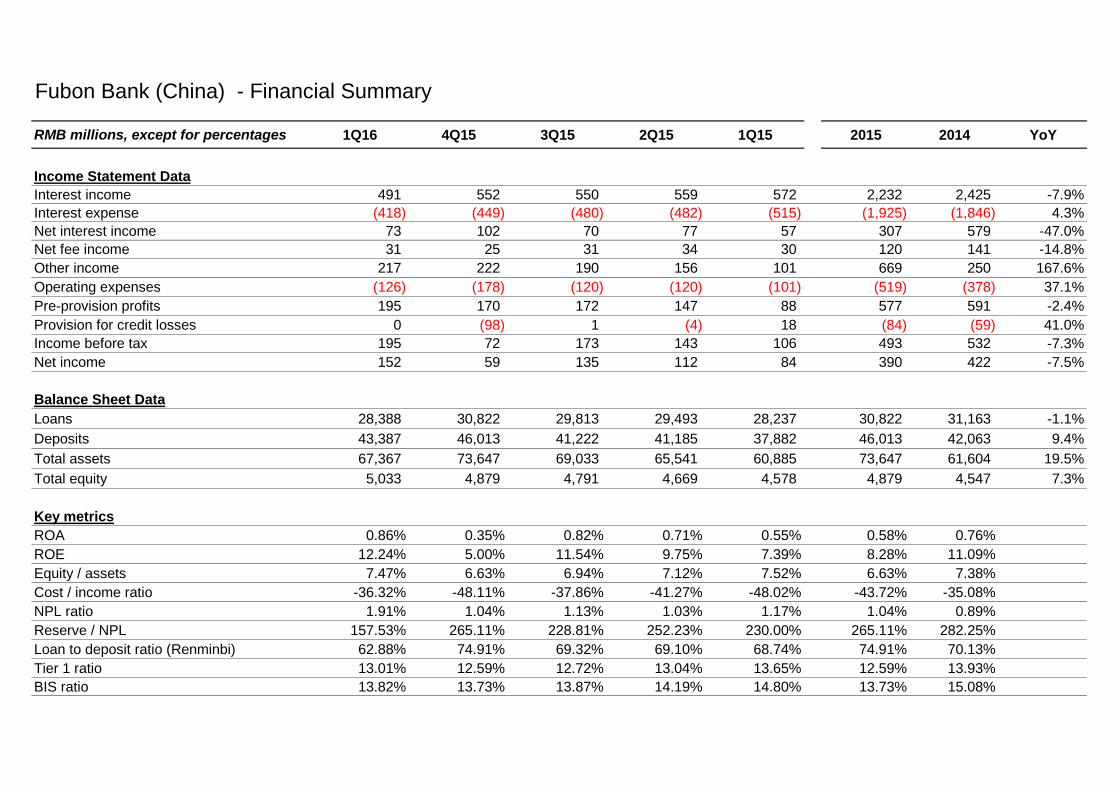
Fubon Bank (China) - Financial Summary
RMB millions, except for percentages 1Q16 4Q15 3Q15 2Q15 1Q15 2015 2014 YoY
Income Statement Data
Interest income 491 552 550 559 572 2,232 2,425 -7.9%
Interest expense (418) (449) (480) (482) (515) (1,925) (1,846) 4.3%
Net interest income 73 102 70 77 57 307 579 -47.0%
Net fee income 31 25 31 34 30 120 141 -14.8%
Other income 217 222 190 156 101 669 250 167.6%
Operating expenses (126) (178) (120) (120) (101) (519) (378) 37.1%
Pre-provision profits 195 170 172 147 88 577 591 -2.4%
Provision for credit losses 0 (98) 1 (4) 18 (84) (59) 41.0%
Income before tax 195 72 173 143 106 493 532 -7.3%
Net income 152 59 135 112 84 390 422 -7.5%
Balance Sheet Data
Loans 28,388 30,822 29,813 29,493 28,237 30,822 31,163 -1.1%
Deposits 43,387 46,013 41,222 41,185 37,882 46,013 42,063 9.4%
Total assets 67,367 73,647 69,033 65,541 60,885 73,647 61,604 19.5%
Total equity 5,033 4,879 4,791 4,669 4,578 4,879 4,547 7.3%
Key metrics
ROA 0.86% 0.35% 0.82% 0.71% 0.55% 0.58% 0.76%
ROE 12.24% 5.00% 11.54% 9.75% 7.39% 8.28% 11.09%
Equity / assets 7.47% 6.63% 6.94% 7.12% 7.52% 6.63% 7.38%
Cost / income ratio -36.32% -48.11% -37.86% -41.27% -48.02% -43.72% -35.08%
NPL ratio 1.91% 1.04% 1.13% 1.03% 1.17% 1.04% 0.89%
Reserve / NPL 157.53% 265.11% 228.81% 252.23% 230.00% 265.11% 282.25%
Loan to deposit ratio (Renminbi) 62.88% 74.91% 69.32% 69.10% 68.74% 74.91% 70.13%
Tier 1 ratio 13.01% 12.59% 12.72% 13.04% 13.65% 12.59% 13.93%
BIS ratio 13.82% 13.73% 13.87% 14.19% 14.80% 13.73% 15.08%