fta workshop on travel forecasting for new starts1march 2009 the arrf ii model bill woodford aecom...
TRANSCRIPT

FTA Workshop on Travel Forecasting for New Starts 1March 2009
The ARRF II Model
Bill Woodford
AECOM Consult

FTA Workshop on Travel Forecasting for New Starts 2March 2009
ARRF-II Overview of Presentation
Introduction to the Aggregate Rail Ridership Forecasting Model (ARRF)
Application issues with ARRF-I Goals for ARRF-II ARRF-II Calibration ARRF-II Forecasts
Charlotte Phoenix

FTA Workshop on Travel Forecasting for New Starts 3March 2009
Introduction to ARRF
New generation of rail projects offers opportunity to understand markets and ridership experience outside very largest metropolitan areas
Forecasting for new projects could usefully tap this experience, if done carefully: Relatively simple, robust approach Transferable using consistently available data
Idea grew out of Charlotte aggregate forecasts based on model developed by the Phoenix MPO

FTA Workshop on Travel Forecasting for New Starts 4March 2009
ARRFPurpose and Basic Approach
Purpose: Supplement conventional forecasting models with: Insights into reasonableness of forecasts Understanding of potential markets TARGETS for model calibration in starter-line cases BASIS FOR QC comparisons in system-expansion cases
Aggregate Rail Ridership Forecasting (ARRF) Model relates: Y2000 CTPP JTW - to - NTD ~Y2000 rail ridership

FTA Workshop on Travel Forecasting for New Starts 5March 2009
ARRF-ILRT Systems Used to Calibrate Model
Excluded very largest metro areas
Year 2000 unless more recent data matches survey that provides insights into travel patterns
Snapshot of ridership and system extent at a single point in time
City Year
Weekday Unlinked
Trips
Baltimore 2000 27,415 Buffalo 2000 23,155 Cleveland 2000 14,062 Dallas 2000 37,682 Denver 2001 31,423 Portland 2000 73,562 Sacramento 2000 29,102 Salt Lake City 2002 33,615 San Diego 2000 83,474 San Jose 2001 30,295 St. Louis 2002 37,281
Source: National Transit Database

FTA Workshop on Travel Forecasting for New Starts 6March 2009
ARRF-ICommuter Rail Systems Used to Calibrate Model
City Year
Weekday Unlinked
Trips
Baltimore-DC MARC 2000 20,851 Dallas-Ft. Worth TRE 2000 4,229 LA Metrolink 2000 26,300 Miami Tri-Rail 2000 7,381 San Diego Coaster 2000 4,327 San Francisco Caltrain 2000 30,616 San Jose ACE 2000 3,500 Seattle Sounder 2000 1,120 Washington DC VRE 2000 8,057
Source: National Transit Database (APTA for ACE)
Excluded very largest metro areas
National Transit Database used except for ACE where 2000 appeared to be an outlier
Snapshot of ridership and system extent at a single point in time

FTA Workshop on Travel Forecasting for New Starts 7March 2009
ARRF-IModel Structure
Separate models for LRT and commuter rail LRT model:
CTPP Flows stratified by employment density Commuter rail model:
CTPP Flows stratified by employment density and income
Level-of-Service variables: Speed (NTD vehicle miles/vehicle hours) Train miles per direction route mile Connection to rail distributor (only Seattle has none)

FTA Workshop on Travel Forecasting for New Starts 8March 2009
ARRF-ISample Computation of CTPP JTW Inputs
10 11 12 13 14 15 16 17 18
19 20 21 22 23 24 25 26 27
28 29 30 31 32 33 34 35 36
37 38 39 40 41 42 43 44 45
46 47 48 49 50 51 52 53 54
55 56 57 58 59 1 2 3 60 61 624 5 67 8 9
63 64 65 66 67 68 69 70 71 72 73
72 73 74 75 76 77 78 79 80 81 82
81 82 83 84 85 86 87 88 89 90 91
90 91 92 93 94 95 96 97 98 99 100
99 100 101 102 103 ## 105 106 107 108 109
108 109 110 111 112 ## 114 115 116 117 118
0.8*1.0*JTW(90 to 8)
0.8*0.1*JTW(90-to-7)
0.6*0.1*JTW(81-to-7)
Stratifications:
HH Income (Part I)
Auto Ownership (III)
Employment Density (II)
Schematic zone map

FTA Workshop on Travel Forecasting for New Starts 9March 2009
ARRF-ILRT Model
Weekday Unlinked Drive Access to WorkRail Trips= 0.030 * CTPP PNR 6 -to-1 Mile JTW Flows (<50K Den) +
0.202 * CTPP PNR 6 -to-1 Mile JTW Flows (>50K Den)
Weekday Unlinked Other(Non-Drive Access to Work)Rail Trips= 0.395 * CTPP 2 -to-1 Mile JTW Flows (<50K Den) +
0.449 * CTPP 2 -to-1 Mile JTW Flows (>50K Den)
Total Weekday UnlinkedRail Trips= Weekday Unlinked Drive Access to Work Rail Trips +
Weekday Unlinked Other Rail Trips

FTA Workshop on Travel Forecasting for New Starts 10March 2009
ARRF-ILRT Predicted vs. Actual
Comparison of ARRF-I and Observed Ridership
0
10000
20000
30000
40000
50000
60000
70000
80000
90000
0 10000 20000 30000 40000 50000 60000 70000 80000 90000
Observed Weekday Ridership
AR
RF
-I W
eekd
ay R
ider
ship
R2 = 0.958

FTA Workshop on Travel Forecasting for New Starts 11March 2009
ARRF-ICommuter Rail Model
Commuter Rail WeekdayUnlinked Trips =Nominal Ridership x Demand Adjustment Factor
Nominal Ridership=0.069*High Income CTPP Flows within 6 miles of a PNR station at the home end and 1 mile of any station at the work end of the trip +
0.041*Medium Income CTPP Flows within 6 miles of a PNR station at the home end and 1 mile of any station at the work end of the trip +
0.151*Low Income CTPP Flows within 2 miles of any station at the home end and 1 mile of any station at the work end of the trip
Demand Adjustment Factor=(1+0.3*Percent Deviation in Average System Speed) x(1+0.3*Percent Deviation in Train Miles per Mile) x Rail Connection Index

FTA Workshop on Travel Forecasting for New Starts 12March 2009
ARRF-ICommuter Rail Predicted vs. Actual
Comparison of ARRF-I and Observed Commuter Rail Ridership
0
5000
10000
15000
20000
25000
30000
35000
0 5,000 10,000 15,000 20,000 25,000 30,000 35,000
Observed Weekday Ridership
AR
RF
-I W
eekd
ay R
ider
ship
R2 = 0.993

FTA Workshop on Travel Forecasting for New Starts 13March 2009
Application of ARRF I to New Projects
City/Ridership Estimate
Walk Access
Drive Access
Special Events Total
CharlotteObserved (April 2008 Survey) 10,800 4,000 (note 1) 14,800 Observed (June 2008 Counts) 16,500 Forecast (Model: local calibration to bus ridership) 4,300 2,100 6,400 Forecast (Model with Houston PNR Constants) 4,400 3,100 1,700 9,200 ARRF-I 8,300 4,100 12,400 PhoenixObserved (January 2001 counts/1st Month of operation) 30,000 Forecasted (New Starts Report) 26,100 ARRF-I 26,400
Note 1: Significant special event ridership observed on an anecdotal basis
Market

FTA Workshop on Travel Forecasting for New Starts 14March 2009
ARRF-IINeeds Identified from ARRF- I Application
Unified commuter rail / LRT model
Improved processing of CTPP input data to exclude trips that would use same station to board/alight
More accurate characterization of trips by work/non-work and mode of access based on FTA survey data library
More accurate selection of year consistent with survey data and mature markets

FTA Workshop on Travel Forecasting for New Starts 15March 2009
ARRF-IIUnified LRT/Commuter Rail Model
Problem arises with hybrid projects that use commuter rail equipment but operate in urban environments with frequent, all day service
Different LRT and commuter rail structures generate significantly different answers for the same project

FTA Workshop on Travel Forecasting for New Starts 16March 2009
ARRF-IIImproved CTPP Processing to exclude trips using same station
Shelbyville
Springfield
Middletown
Schematic Zone Map
ARRF-I Springfield Middletown Shelbyville Total ARRF-II Springfield Middletown Shelbyville TotalSpringfield 15,000 7,500 2,500 25,000 Springfield 7,500 2,500 10,000Middletown 7,500 15,000 2,500 25,000 Middletown 7,500 2,500 10,000Shelbyville 2,500 2,500 20,000 25,000 Shelbyville 2,500 2,500 5,000Total 25,000 25,000 25,000 75,000 Total 10,000 10,000 5,000 25,000
Springfield-Middletown LRT 45,000 Springfield-Middletown LRT 15,000Middletown-Shelbyville LRT 40,000 Middletown-Shelbyville LRT 5,000

FTA Workshop on Travel Forecasting for New Starts 17March 2009
ARRF-IICalibration Approach
Separately estimate models (where survey data exists) for: Walk Access, Home-Based Work Drive Access, Home-Based Work Walk Access, Other purposes Drive Access, Other purposes
Combine into a single model and normalize to match total ridership for all modes

FTA Workshop on Travel Forecasting for New Starts 18March 2009
ARRF-IICTPP Trip Rates (Before LOS Adjustment)
Walk access trips: CTPP Buffer: 2 miles on production end / 1 miles on attraction end Higher for non-work than for work trips Slightly higher for CBD than non-CBD
Drive access trips: CTPP Buffer: 6 miles on production end / 1 miles on attraction end Much higher for work than for work trips Much higher for CBD than non-CBD
Trip Purpose/Employment Density
Walk Access
Drive Access
Home-Based Work - to destinations with <50,000 emp/sq mile 0.103631 0.038882 - to destinations with >50,000 emp/sq mile 0.146814 0.135892Non-Work - to destinations with <50,000 emp/sq mile 0.181801 0.013572 - to destinations with >50,000 emp/sq mile 0.184666 0.038878

FTA Workshop on Travel Forecasting for New Starts 19March 2009
ARRF-IILevel of Service
Ridership = {CTPP JTW x CTPP Rates} x Level-of Service Factor Level-of-Service Factor= Speed Factor x Frequency Factor Speed=NTD Vehicle Miles/NTD Vehicle Hours (includes layover) Speed and Frequency Factors computed using ARC elasticity:
Frequency in trains/day per direction Speed in mph
Normalized so that the average multiplier for all systems is 1.0 Limited to prevent large factors out of range of calibration
experience
FrequencyeAvgFreqFrequency
AvgFreqFrequencyFreqFactor
2/)( Speede
AvgSpeedSpeed
AvgSpeedSpeedrSpeedFacto
2/)(
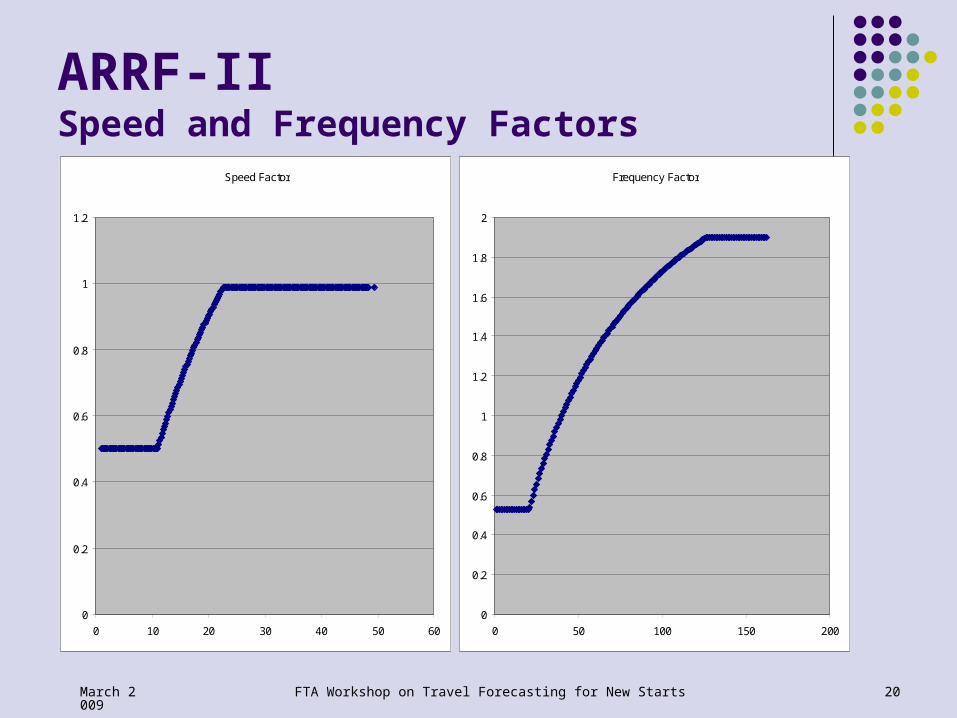
FTA Workshop on Travel Forecasting for New Starts 20March 2009
ARRF-IISpeed and Frequency Factors
Frequency Factor
0
0.2
0.4
0.6
0.8
1
1.2
1.4
1.6
1.8
2
0 50 100 150 200
Speed Factor
0
0.2
0.4
0.6
0.8
1
1.2
0 10 20 30 40 50 60

FTA Workshop on Travel Forecasting for New Starts 21March 2009
Demand Adjustment Parameters
MinMax
Frequency
FreqFactorFreqFactorionDividerNormalizat
FreqFactorMinMaxactorFinalFreqF ,,
Arc Elasticity NormalizationElasticity Mid-point Divider Minimum Maximum
Speed Factor 0.70 23.38 0.9879 0.50 0.99 Frequency Factor 0.62 58.78 0.7644 0.53 1.90
MinMax
Speed
rSpeedFactorSpeedFactoionDividerNormalizat
rSpeedFactoMinMaxFactorFinalSpeed ,,

FTA Workshop on Travel Forecasting for New Starts 22March 2009
ARRF-IICalibration Results by Access Type
Modeled vs. Observed Trips by Access Type
-
10,000
20,000
30,000
40,000
50,000
60,000
70,000
80,000
- 20,000 40,000 60,000 80,000
Observed Daily Ridership
Mo
del
ed D
aily
Rid
ersh
ip
Walk Access Trips
Drive Access Trips
Referencex

FTA Workshop on Travel Forecasting for New Starts 23March 2009
ARRF-II Calibration by Purpose
Modeled vs. Observed Trips by Purpose
-
10,000
20,000
30,000
40,000
50,000
60,000
70,000
80,000
- 20,000 40,000 60,000 80,000
Observed Daily Ridership
Mo
del
ed D
aily
Rid
ersh
ip
HBW Trips
Non-Work Trips
Referencex
FTA Workshop on Travel Forecasting for New Starts 24March 2009
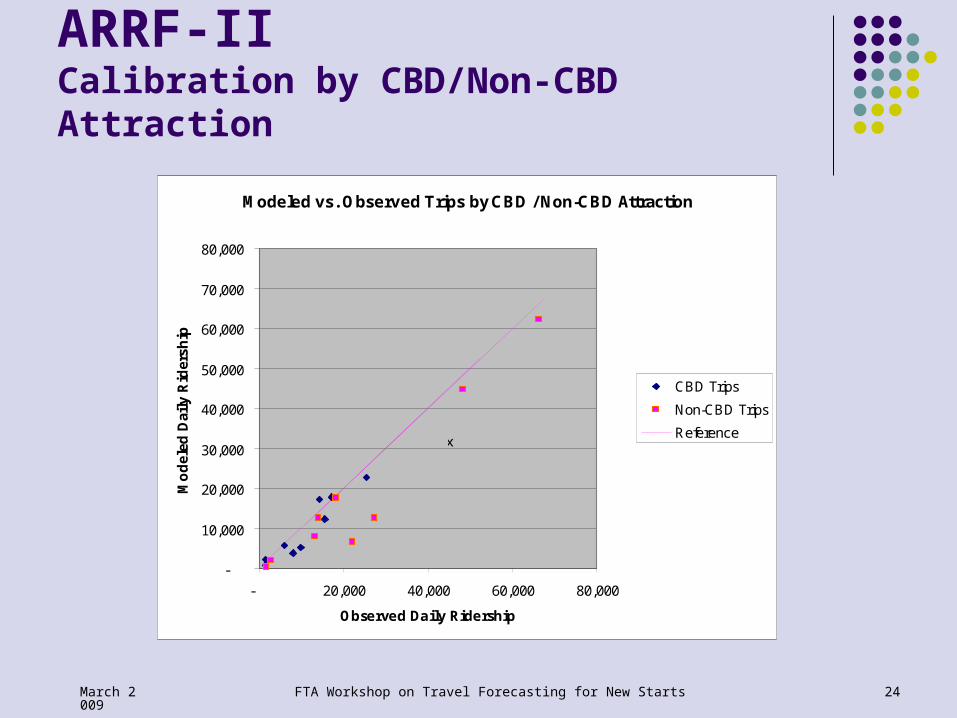
ARRF-IICalibration by CBD/Non-CBD Attraction
Modeled vs. Observed Trips by CBD / Non-CBD Attraction
-
10,000
20,000
30,000
40,000
50,000
60,000
70,000
80,000
- 20,000 40,000 60,000 80,000
Observed Daily Ridership
Mo
del
ed D
aily
Rid
ersh
ip
CBD Trips
Non-CBD Trips
Referencex

FTA Workshop on Travel Forecasting for New Starts 25March 2009
ARRF-IICalibration Results Total Ridership
Comparison of Modeled And Acutal Ridership
-
10,000
20,000
30,000
40,000
50,000
60,000
70,000
80,000
90,000
- 20,000 40,000 60,000 80,000 100,000
Observed Daily Ridership
Mo
del
ed D
aily
Rid
ersh
ip
Model - LRT
Model - Commuter Rail
Reference
R2 = 0.952. Good match for both LRT and Commuter Rail Systems

FTA Workshop on Travel Forecasting for New Starts 26March 2009
ARRF-IIApplication to New LRT Cities
City/Ridership Estimate
Walk Access
Drive Access
Special Events Total
CharlotteObserved (April 2008 Survey) 10,800 4,000 (note 1) 14,800 Observed (June 2008 Counts) 16,500 Forecast (Model: local calibration to bus ridership) 4,300 2,100 6,400 Forecast (Model with Houston PNR Constants) 4,400 3,100 1,700 9,200 ARRF-I 8,300 4,100 12,400 ARRF-II 8,700 6,800 15,500 PhoenixObserved (January 2001 counts/1st Month of operation) 30,000 Forecasted (New Starts Report) 26,100 ARRF-I 26,400 ARRF-II 15,500 9,300 24,800
Note 1: Significant special event ridership observed on an anecdotal basis
Market

FTA Workshop on Travel Forecasting for New Starts 27March 2009
FTA Conclusions, Next Steps
Conclusions FTA likes QC with ARRF FTA likes starter-line information from ARRF FTA thinks II is better than I -- robustness
Next steps Additional variables (income, others?) Application package Documentation

FTA Workshop on Travel Forecasting for New Starts 28March 2009
Distribution of ARRF II
Short term (while next steps are underway) Request to Nazrul Islam, FTA FTP-site transfer of application files from AECOM Start-up coaching from AECOM
Long term Request to Nazrul Islam, FTA E-mail delivery of application files, documentation

FTA Workshop on Travel Forecasting for New Starts 29March 2009
Model Testing – Methods
Session 7 Conventional approach FTA recommendations Thoughts on good practice

FTA Workshop on Travel Forecasting for New Starts 30March 2009
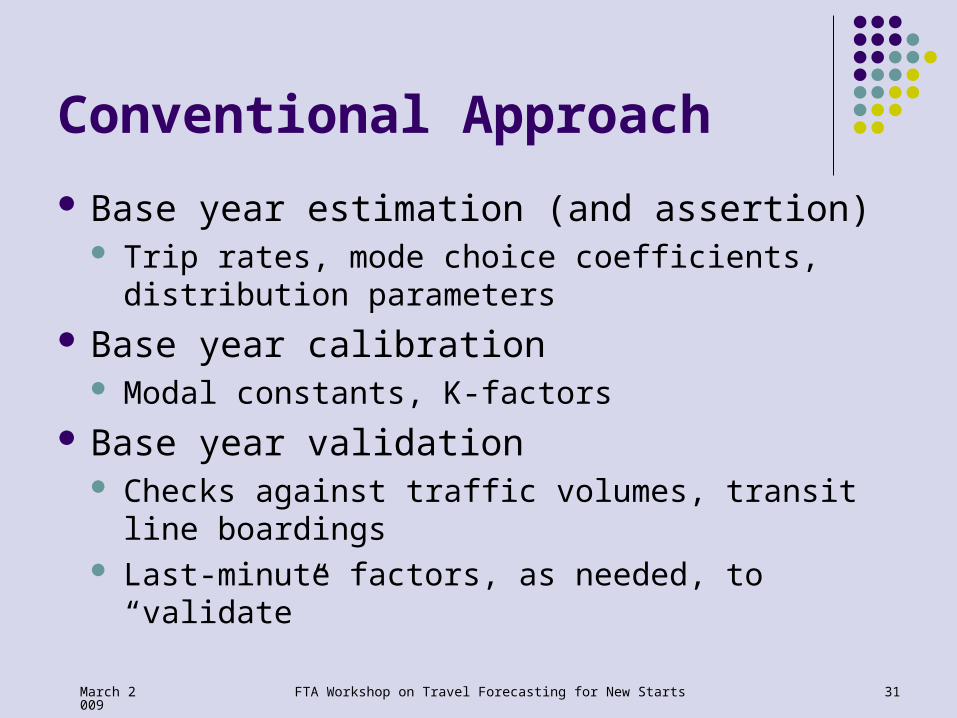
Conventional Approach
Observed data for some recent year(s) Aggregate checks Lots of factoring Model deemed “validated” and ready to use
FTA Workshop on Travel Forecasting for New Starts 31March 2009
Conventional Approach
Base year estimation (and assertion) Trip rates, mode choice coefficients, distribution
parameters Base year calibration
Modal constants, K-factors Base year validation
Checks against traffic volumes, transit line boardings
Last-minute factors, as needed, to “validate”

FTA Workshop on Travel Forecasting for New Starts 32March 2009
FTA Recommendations
Data matching “calibrated” model Model assessment “plausible” model Forecast testing “tested” model Documentation “ready-for-forecasters”
model

FTA Workshop on Travel Forecasting for New Starts 33March 2009
FTA RecommendationsData Matching
Central focus on transit components Transit network, access representations Transit pathbuilding Mode choice
Unavoidable focus on upstream components Socio-economic models Trip generation and distribution Highway network and highway speed prediction

FTA Workshop on Travel Forecasting for New Starts 34March 2009
FTA RecommendationsModel Assessment
Specific behavioral explanations for: Trip rates and distribution parameters Mode choice coefficients and constants
Relative values of parameters across: Socio-economic classes Travel modes Other segmentations
Adjustments Intelligent and iterative – find and fix the errors Needs a formal conclusion in model testing

FTA Workshop on Travel Forecasting for New Starts 35March 2009
FTA RecommendationsTesting of Forecasting Capability
Meaningful tests Not parametric “sensitivity testing” Not forecasts for the calibration-data year Application of the entire model for very different conditions
Best: forecast for some recent year with data Back-cast Fore-cast from the validation year to a base year Most powerful if it spans a major transit improvement
Next-best: forecasts for conditions without data Horizon-year forecast Forecast for a major transit alternative

FTA Workshop on Travel Forecasting for New Starts 36March 2009
FTA RecommendationsDocumentation
The usual stuff, of course Model development Users’ guide
But also Formal assessment of model plausibility Results of forecast testing Purview of the model for transit forecasting
What it knows about What it does not know about
markets, modes, behaviors

FTA Workshop on Travel Forecasting for New Starts 37March 2009
Thoughts on Good PracticeModel Tests
Performance rather than validation standards Lots of important topics
Person trip tables Roadway skims Changes over time and across alternatives Quality of data
Today’s focus: transit rider data and transit model components

FTA Workshop on Travel Forecasting for New Starts 38March 2009
Thoughts on Good PracticeTransit Model Tests
Transit rider travel patterns Trip tables: the expanded survey and the model Mode choice focus
Transit paths Aggregate
Assignment of expanded survey trip tables Comparison of line boardings and other aggregations
Disaggregate Individual records from the survey Path-choice focus

FTA Workshop on Travel Forecasting for New Starts 39March 2009
Thoughts on Good PracticeTransit Travel Patterns
An understanding of the big picture District-to-district flows
By mode and market segment Production and attraction totals Transfer rates
Mode shares Area-to-area Zone-to-zone differences

FTA Workshop on Travel Forecasting for New Starts 40March 2009
Thoughts on Good PracticeTransit Paths - Aggregate
Assignment results Expanded transit rider tables
Boardings by mode, route, route segment, station, other Reasons for differences from observed
Modeled transit rider tables Load volumes, on/off distributions, time-of-day Modes of access and egress Park-ride usage Distribution of walk trip distances Major under/over patterns Documentation of differences from observed
FTA Workshop on Travel Forecasting for New Starts 41March 2009
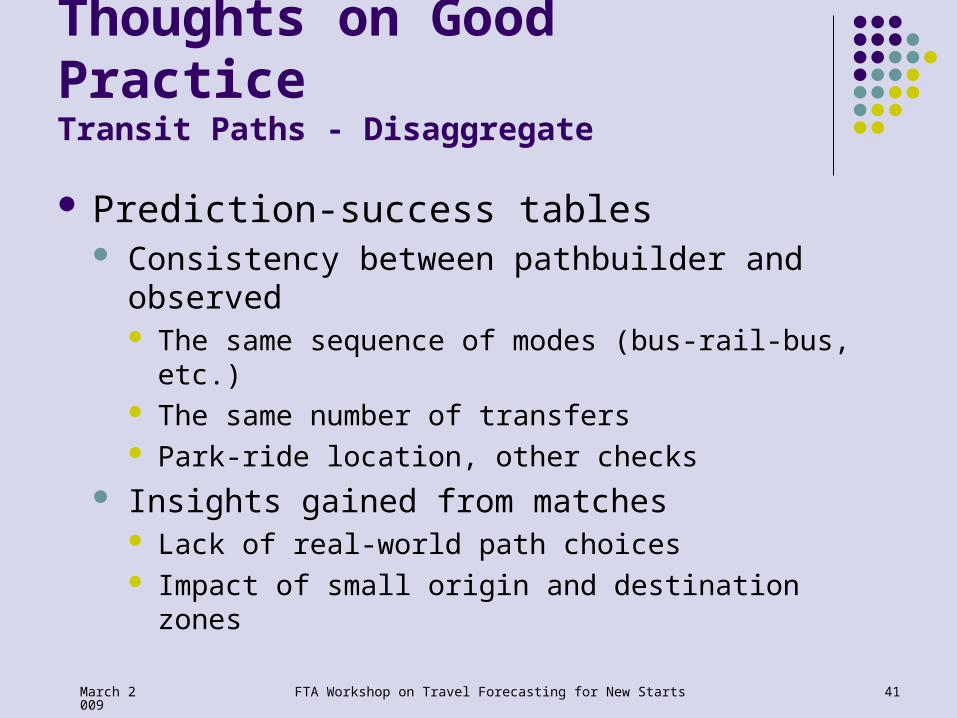
Thoughts on Good PracticeTransit Paths - Disaggregate
Prediction-success tables Consistency between pathbuilder and observed
The same sequence of modes (bus-rail-bus, etc.) The same number of transfers Park-ride location, other checks
Insights gained from matches Lack of real-world path choices Impact of small origin and destination zones
FTA Workshop on Travel Forecasting for New Starts 42March 2009
Thoughts on Good PracticePrediction-Success Tables
Insights gained from misses Reasonability of “observed” trip data Reasonability of coded network Zone size: centroids versus points Initial wait and transfer wait times Park-ride or kiss-ride location Unmeasured attributes of better service Other

FTA Workshop on Travel Forecasting for New Starts 43March 2009
Model Testing – Some Examples
Session 8 Model Testing with 2007 Tri-Rail On-
Board Survey Data David Schmitt, AECOM
Pathbuilder Tests using 2007 DART On-Board Survey Arash Mirzaei, NCTCOG

FTA Workshop on Travel Forecasting for New Starts 44March 2009
Model Testing with 2007Tri-Rail On-Board Survey Data
David Schmitt
AECOM

FTA Workshop on Travel Forecasting for New Starts 45March 2009
Tri-Rail On-Board SurveyMarch 2007
First major data collection effort of Tri-Rail riders since 1999
The 2007 survey underwent a comparison with limited count data
The expanded 2007 dataset was used to verify the model’s reflection of current transit rider patterns; the model previously underwent a traditional calibration and validation in 2006
FTA Workshop on Travel Forecasting for New Starts 46March 2009
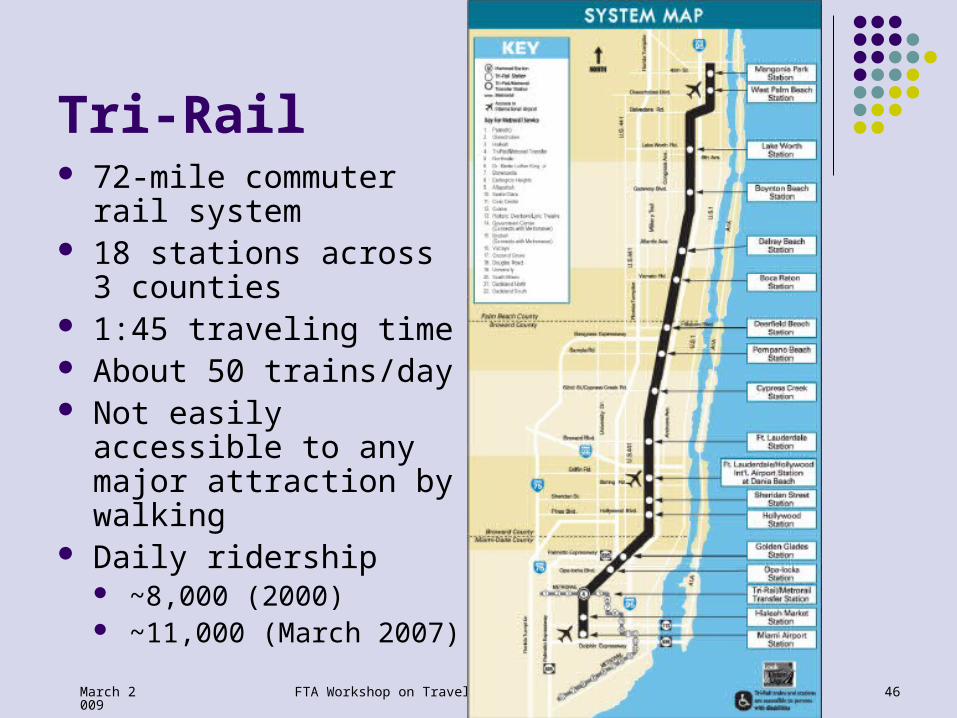
Tri-Rail 72-mile commuter rail
system 18 stations across 3
counties 1:45 traveling time About 50 trains/day Not easily accessible to
any major attraction by walking
Daily ridership ~8,000 (2000) ~11,000 (March 2007)
FTA Workshop on Travel Forecasting for New Starts 47March 2009
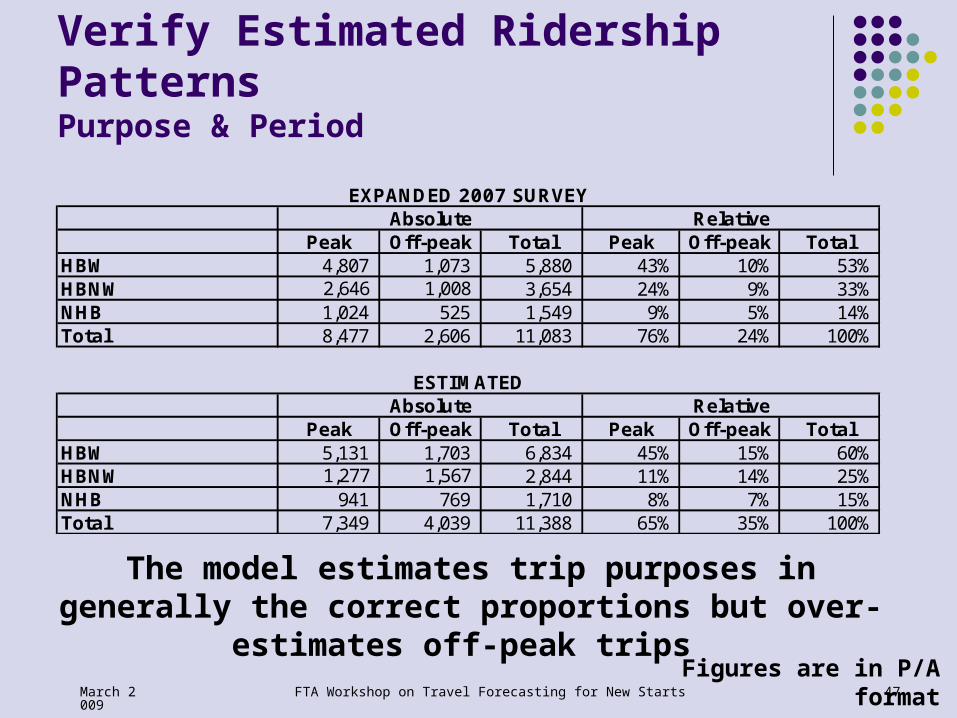
Verify Estimated Ridership Patterns Purpose & Period
The model estimates trip purposes in generally the correct proportions but over-estimates off-peak trips
Peak Off-peak Total Peak Off-peak TotalHBW 4,807 1,073 5,880 43% 10% 53%HBNW 2,646 1,008 3,654 24% 9% 33%NHB 1,024 525 1,549 9% 5% 14%Total 8,477 2,606 11,083 76% 24% 100%
Peak Off-peak Total Peak Off-peak TotalHBW 5,131 1,703 6,834 45% 15% 60%HBNW 1,277 1,567 2,844 11% 14% 25%NHB 941 769 1,710 8% 7% 15%Total 7,349 4,039 11,388 65% 35% 100%
RelativeAbsolute
Absolute Relative
EXPANDED 2007 SURVEY
ESTIMATED
Figures are in P/A format

FTA Workshop on Travel Forecasting for New Starts 48March 2009
0-car 1-car 2+-car Total 0-car 1-car 2+-car TotalHBW 452 1,906 3,522 5,880 4% 17% 32% 53%HBNW 206 875 2,574 3,655 2% 8% 23% 33%NHB 181 471 897 1,549 2% 4% 8% 14%Total 839 3,252 6,993 11,084 8% 29% 63% 100%
0-car 1-car 2+-car Total 0-car 1-car 2+-car TotalHBW 2,483 2,611 1,744 6,838 22% 23% 15% 60%HBNW 1,126 1,053 665 2,844 10% 9% 6% 25%NHB 72 332 1,306 1,710 1% 3% 11% 15%Total 3,681 3,996 3,715 11,392 32% 35% 33% 100%
EXPANDED 2007 SURVEY
ESTIMATED
Verify Estimated Ridership Patterns Purpose & Market Segment
The model over-estimates captive riders & under-estimates choice riders
Figures are in P/A format

FTA Workshop on Travel Forecasting for New Starts 49March 2009
Peak Off-peak Total Peak Off-peak TotalWalk 833 324 1,157 8% 3% 10%Park-ride 3,158 641 3,799 28% 6% 34%Drop-off 3,106 890 3,996 28% 8% 36%Bus/ rail 1,379 752 2,131 12% 7% 19%Total 8,476 2,607 11,083 76% 24% 100%
Peak Off-peak Total Peak Off-peak TotalWalk 3,220 1,616 4,836 28% 14% 42%Park-ride 2,391 1,262 3,653 21% 11% 32%Drop-off 1,296 862 2,158 11% 8% 19%Bus/ rail 447 299 746 4% 3% 7%Total 7,354 4,039 11,393 65% 35% 100%
Absolute Relative
Access Mode
EXPANDED 2007 SURVEYAbsolute Relative
ESTIMATED
Verify Estimated Ridership Patterns Access Mode & Period
The model under-estimates drop-off and bus/rail access trips
Figures are in P/A format

FTA Workshop on Travel Forecasting for New Starts 50March 2009
Verify Estimated Ridership Patterns Egress Modes
High proportion of auto-egress riders (31%), which were confirmed by station egress observations
Current pathbuilding procedures assume only walk- and transit-egress modes, so these will need to be updated to reflect auto-egress modes
Egress Mode Absolute RelativeWalk 2,356 21%Park-ride 964 9%Drop-off 2,489 22%Bus/ rail 4,536 41%School bus 569 5%Other 170 2%Total 11,084 100%
EXPANDED 2007 SURVEY
Figures are in P/A format

FTA Workshop on Travel Forecasting for New Starts 51March 2009
Verify Estimated Ridership PatternsStation-to-Station Movements (2007 Survey)
Pink boxes show top 10 station-to-station movements Survey shows a predominant north-to-south movement (63% of all trips)

FTA Workshop on Travel Forecasting for New Starts 52March 2009
Verify Estimated Ridership PatternsStation-to-Station Movements (Model)
Pink boxes show top 10 station-to-station movements Model shows a predominant south-to-north movement (54% of all trips)

FTA Workshop on Travel Forecasting for New Starts 53March 2009
Understanding the DifferencesTri-Rail Trip Length (miles)
Comparison of distance traveled on Tri-Rail (survey vs model)
0%
5%
10%
15%
20%
25%
30%
35%
40%0-
10
10-2
0
20-3
0
30-4
0
40-5
0
50-6
0
60-7
0
70+
Distance (miles)
Per
cen
t o
f T
ri-R
ail
Tri
ps
%Survey %Model
Average Trip Length (model estimation): 15.6 miles
Average Trip Length (On-board survey): 30.0 miles

FTA Workshop on Travel Forecasting for New Starts 54March 2009
Understanding the DifferencesI-95 vs. Tri-Rail Trip Lengths (miles)
Trip Length Distribution on I-95(Trips using I-95 segments in Broward and Palm Beach Counties Only: Estimated ~1.2 m trips)
0%
5%
10%
15%
20%
25%
30%
35%
40%
0 1 2 3 4 5 6 7 8 9
Distance Category (miles)
% o
f Tri
ps o
n I-9
5
Survey Estimated
Note: I-95 survey data reflect unweighted records
Does the same disparity also reflected in the dominant freeway?
Answer: Not really

FTA Workshop on Travel Forecasting for New Starts 55March 2009
Understanding the DifferencesTri-Rail HBW Trips (only geocodable records)
Red boxes highlight major travel markets Records are in P/A format

FTA Workshop on Travel Forecasting for New Starts 56March 2009
Understanding the DifferencesWork Trip Comparison
Top six markets are collectively over-estimates 84,000 work trips Miami CBD missing 55,000 jobs
Figures are in P/A format

FTA Workshop on Travel Forecasting for New Starts 57March 2009
Findings
Tri-Rail riders The model is generally correct about the trip purposes and
time of day distribution The model is less correct in its understanding of:
Captive vs. choice riders Drop-off and bus/rail access trips Predominant P/A trip flow and key attraction stations Length of the trip spent on Tri-Rail
The model is not reflecting auto egress trips at all Work trips
The model over-estimates work trips in key Tri-Rail travel markets

FTA Workshop on Travel Forecasting for New Starts 58March 2009
Next Steps Identify reasons for low Miami CBD employment Investigate reasons for over-estimation of inter-
county work trips Incorporate auto egress procedures for Tri-Rail
trips Experiment ways to better reflect longer trips by
riders traveling in the proper predominant direction
Incorporate understanding of time of day, access mode and captive/choice Tri-Rail rider patterns into the mode choice model

FTA Workshop on Travel Forecasting for New Starts 59March 2009
FTA Workshop on Travel Forecasting for New Starts 59March 2009
Pathbuilder Tests using 2007 DART On-Board Survey
Arash Mirzaei, P.E.
North Central Texas Council of Governments (NCTCOG)

FTA Workshop on Travel Forecasting for New Starts 60March 2009
FTA Workshop on Travel Forecasting for New Starts 60March 2009
Background
FTA recommends tests comparing model-derived transit paths with observed paths obtained from transit rider surveys
In the September 2007 FTA forecasting workshop, David Kurth presented some of the challenges in calibration of pathbuilding
In early 2008, NCTCOG prepared significant cleanups of the 2007 DART on-board survey that resulted in reliable origin-to-destination transit paths
This presentation shows current NCTCOG experience in using this on-board survey to understand model limitations and calibrate a transit pathbuilder

FTA Workshop on Travel Forecasting for New Starts 61March 2009
Pathbuilder Calibration
Definition: the pathbuilder is calibrated when it produces paths that are reasonably correct “Correct” means they are the same as observed “Reasonably” means some deviation from “all correct
paths” is acceptable Method: use the pathbuilder to create zone-to-zone
transit paths and compare with observed paths, and change the pathbuilder parameters to minimize the differences What to compare -> Define calibration measure Which parameters to change and how much -> Develop an
optimization algorithm

FTA Workshop on Travel Forecasting for New Starts 62March 2009
NCTCOG Previous Pathbuilder Calibration
Observed paths were not available No optimization program was used Calibration considered multiple items
Reasonableness of parameters Reasonableness of transit paths and mode of access Ridership by mode - light rail, commuter rail, express bus,
local bus Ridership by geographic groups of routes Ridership at route level Boardings and alightings at rail stations

FTA Workshop on Travel Forecasting for New Starts 63March 2009
NCTCOG New Pathbuilder Calibration Approach
1. Conduct transit survey that provides observed paths
2. Code a high quality transit network
3. Segment the observed trip records (origin, destination, and routes used) by time period and mode of access
4. For each segment, use the paths from the unweighted records to calculate unweighted boardings for each used route
5. For each segment, create an unweighted transit origin-destination matrix
6. Define discrete value ranges for pathbuilder parameters to be tested
7. Create a pathbuilder with values from step 6
8. Assign the origin-destination matrix to the transit network using the pathbuilder
9. Calculate the model-assigned boardings for each route
10. Record statistical measures for “modeled versus observed” boardings by route
11. Change the pathbuilder parameters and go back to step 7 until all values are tested and statistical results recorded
12. Find the optimum solution for the pathbuilder parameters based on obtaining the best statistical results

FTA Workshop on Travel Forecasting for New Starts 64March 2009
Path Comparison Challenges
Observed paths need to be reliable: how can we make sure we have correct paths?
Ridership rather than paths is the standard model output: how can we get the software to output paths?
Paths are not single numbers to compare with measures like %RMSE and R2: how should we evaluate calibration success?
Coded networks are abstractions of reality: is the network resolution high enough to make path comparison meaningful?
FTA Workshop on Travel Forecasting for New Starts 65March 2009
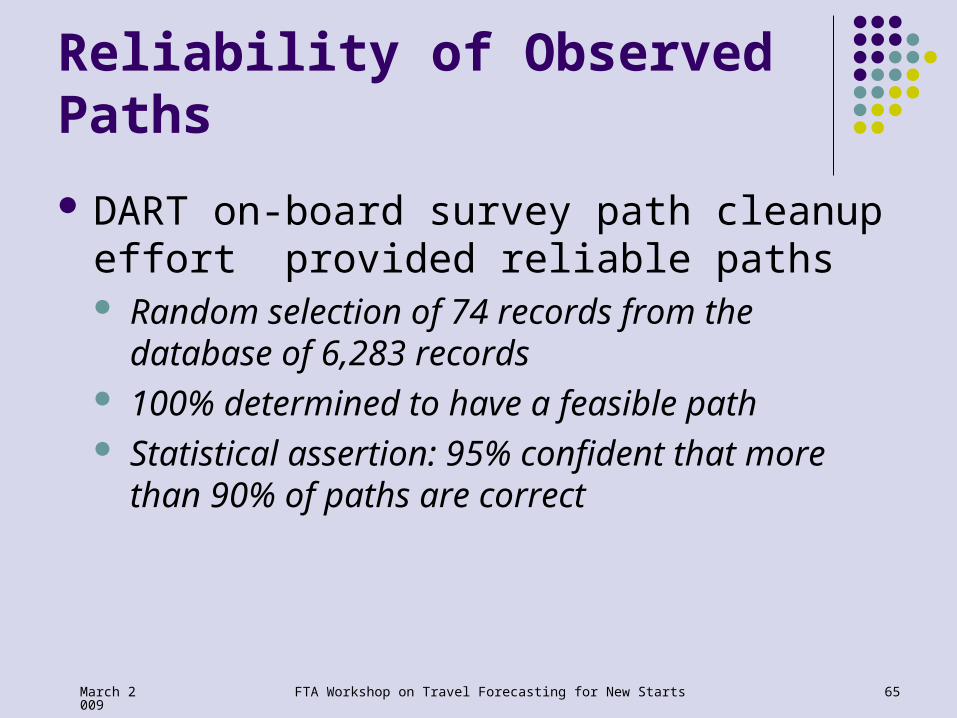
Reliability of Observed Paths
DART on-board survey path cleanup effort provided reliable paths Random selection of 74 records from the
database of 6,283 records 100% determined to have a feasible path Statistical assertion: 95% confident that more
than 90% of paths are correct
FTA Workshop on Travel Forecasting for New Starts 66March 2009
Obtaining Modeled Paths
Transit paths are not standard outputs from TransCAD 4.8 in a programmable environment Tracking specific modes as part of the path is
standard in TransCAD We can easily track, for example, if LRT is part of
a path Using TransCAD 5.0, we were able to get the
modeled path as an output

FTA Workshop on Travel Forecasting for New Starts 67March 2009
Path Comparison Measures
Boardings by route Easy to compare with %RMSE, R2, and so on If all paths are correct, ridership will be correct - but not
vice-versa How much can we learn about the success of the
pathbuilder from the ridership? Transfer rate = (total boardings) / (total linked trips) Specific transit modes used Combined path characteristics such as generalized
cost, IVTT, and OVTT Major routes of the path comparison

FTA Workshop on Travel Forecasting for New Starts 68March 2009
Pathbuilder Segmentation
Mode of access Walk Access Drive Access
Time period 6:30 a.m. to 9:00 a.m. 9:00 a.m. to 3:00 p.m.

FTA Workshop on Travel Forecasting for New Starts 69March 2009
Pathbuilder Parameters Tested
Use brute force to find the optimum values OVTT weight {1.5, 2.0, 2.5, 3.0, 3.5}
Walk access Walk egress Initial wait time Transfer wait time Transfer wait time
IVTT weight {1.0} In-vehicle time Dwell time
Transfer penalty time {3, 4, 5, 6, 7} Max. initial wait time {15, 20, 25, 30, 35, 40, 45} Max. transfer wait time {15, 20, 25, 30, 35, 40, 45} Value of time ($/hr) {2.73, 4, 5, 7, 9}

FTA Workshop on Travel Forecasting for New Starts 70March 2009
Optimized Parameters
Ridership %RMSE = 55 OVTT weight {1.5, 2.0, 2.5, 3.0, 3.5} IVTT weight {1.0} Transfer penalty time {3, 4, 5, 6, 7} Max. initial wait time {15, 20, 25, 30, 35, 40, 45} Max. transfer wait time {15, 20, 25, 30, 35, 40,
45} Value of time ($/hr) {2.73, 4, 5, 7, 9}
FTA Workshop on Travel Forecasting for New Starts 71March 2009
Comparison of Approaches
1. Optimized parameters with no preferential treatment for rail modes
2. NCTCOG 2002 previously calibrated model which includes preferential treatment for rail modes in regards to wait time
3. Optimized parameters with preferential treatment for rail modes in form of 0.8 IVTT weight

FTA Workshop on Travel Forecasting for New Starts 72March 2009
Optimized RunBoardings
Ridership Comparision_NoRail
0
10
20
30
40
50
60
70
80
0 10 20 30 40 50 60 70 80
Observed Ridership
Mo
del
Rid
ersh
ip
Ridership Comparision
0
50
100
150
200
250
300
350
0 50 100 150 200 250 300 350
Observed Ridership
Mo
del
Rid
ersh
ip
%RMSE = 55
FTA Workshop on Travel Forecasting for New Starts 73March 2009
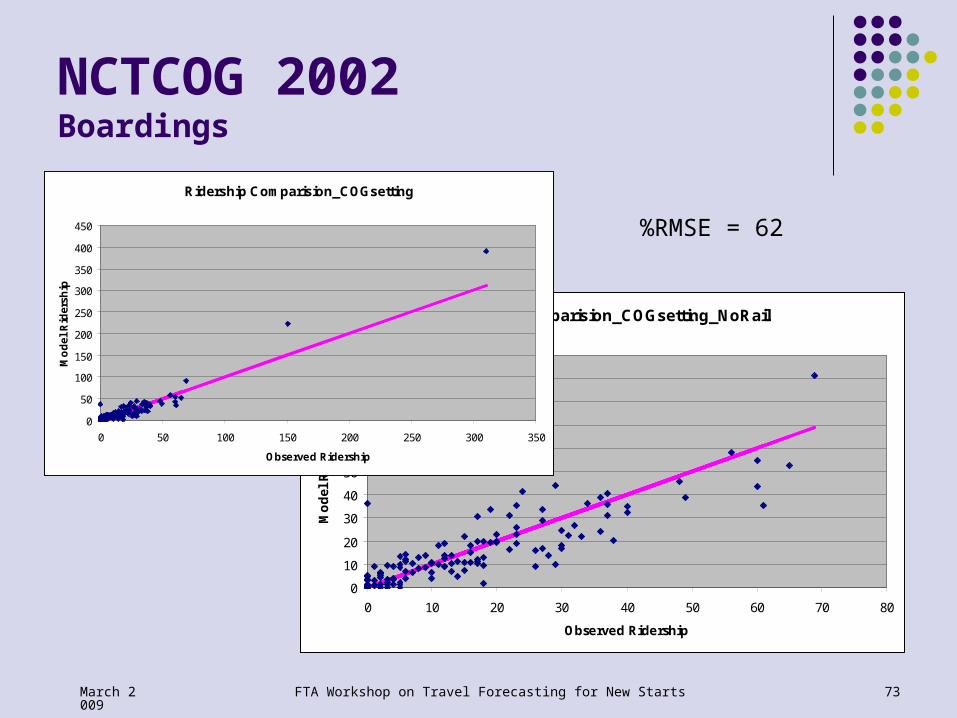
NCTCOG 2002Boardings
Ridership Comparision_COGsetting_NoRail
0
10
20
30
40
50
60
70
80
90
100
0 10 20 30 40 50 60 70 80
Observed Ridership
Mo
del
Rid
ersh
ip
Ridership Comparision_COGsetting
0
50
100
150
200
250
300
350
400
450
0 50 100 150 200 250 300 350
Observed Ridership
Mo
del
Rid
ersh
ip
%RMSE = 62

FTA Workshop on Travel Forecasting for New Starts 74March 2009
Optimized Run with 0.8 Rail IVTT Boardings
Ridership Comparision_IVTTWGT_noRail
0
10
20
30
40
50
60
70
80
0 10 20 30 40 50 60 70 80
Observed Ridership
Mo
del
Rid
ersh
ip
Ridership Comparision_AddIVTTWGT
0
50
100
150
200
250
300
350
0 50 100 150 200 250 300 350
Observed Ridership
Mo
del
Rid
ersh
ip
%RMSE = 48

FTA Workshop on Travel Forecasting for New Starts 75March 2009
Optimized RunGeneralized Cost
0.00
2.00
4.00
6.00
8.00
10.00
12.00
14.00
0.00 2.00 4.00 6.00 8.00 10.00 12.00 14.00
Observed GC
Mo
del
GC

FTA Workshop on Travel Forecasting for New Starts 76March 2009
NCTCOG 2002Generalized Cost
0.00
2.00
4.00
6.00
8.00
10.00
12.00
14.00
16.00
0.00 2.00 4.00 6.00 8.00 10.00 12.00 14.00 16.00
Observed Generalized Cost
Mo
del
Gen
eral
ized
Co
st
FTA Workshop on Travel Forecasting for New Starts 77March 2009
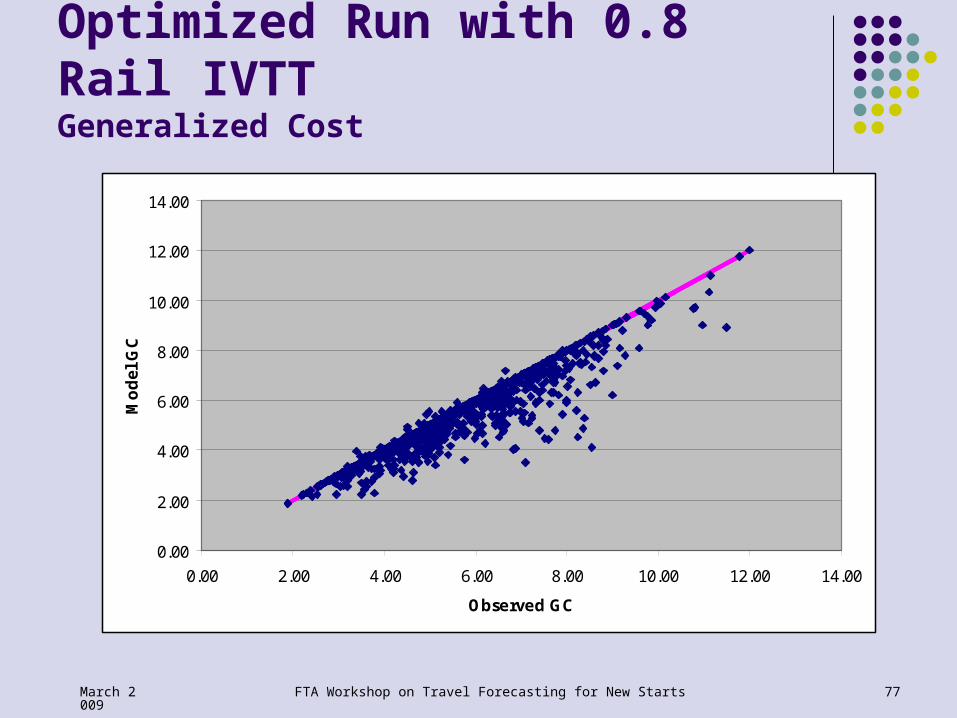
Optimized Run with 0.8 Rail IVTTGeneralized Cost
0.00
2.00
4.00
6.00
8.00
10.00
12.00
14.00
0.00 2.00 4.00 6.00 8.00 10.00 12.00 14.00
Observed GC
Mo
del
GC

FTA Workshop on Travel Forecasting for New Starts 78March 2009
Optimized Run with 0.8 Rail IVTT Path Times
Walk Time= AccessWalkTime+EgressWalkTime+TransferWalkTime
0
10
20
30
40
50
60
70
0 10 20 30 40 50 60 70 80
Observed Walk Time_CombinedGC
Mo
del
Wal
k T
ime
IVTT Comparision
0
20
40
60
80
100
120
0 20 40 60 80 100 120
Observed IVTT_CombinedGC
Mo
del
IV
TT
WaitTime=Initial Wait Time+Transfer Wait Time
0
10
20
30
40
50
60
70
80
0 10 20 30 40 50 60 70 80
Observed WaitTime_CombinedGC
Mo
del
Wai
tTim
e
TotalTime=WalkTime+IVTT+WaitTime
0
20
40
60
80
100
120
140
160
180
0 50 100 150 200 250
Observed WaitTime_CombinedGC
Mo
del
Wai
tTim
e

FTA Workshop on Travel Forecasting for New Starts 79March 2009
Distribution by Transit Mode
Linked Trips Observed Optimized Run NCTCOGOpt. with 0.8
Rail IVTT
Using Modes # % # % # % # %
LRT (No CRT) 408 35% 350 30% 572 49% 385 33%
CRT (No LRT) 14 1% 14 1% 25 2% 14 1%
LRT & CRT 20 2% 15 1% 18 2% 18 2%
Bus Only 727 62% 790 68% 554 47% 752 64%
Total 1,169 100% 1,169 100% 1,169 100% 1,169 100%
FTA Workshop on Travel Forecasting for New Starts 80March 2009
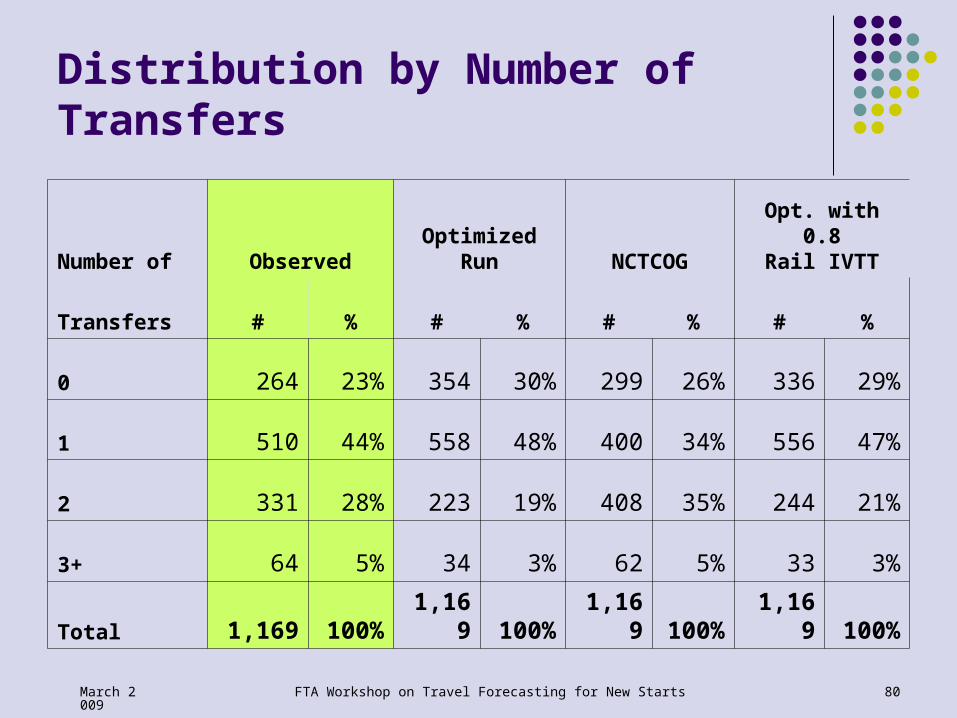
Distribution by Number of Transfers
Number of Observed Optimized Run NCTCOGOpt. with 0.8
Rail IVTT
Transfers # % # % # % # %
0 264 23% 354 30% 299 26% 336 29%
1 510 44% 558 48% 400 34% 556 47%
2 331 28% 223 19% 408 35% 244 21%
3+ 64 5% 34 3% 62 5% 33 3%
Total 1,169 100% 1,169 100% 1,169 100% 1,169 100%

FTA Workshop on Travel Forecasting for New Starts 81March 2009
Other Possible Tests
For observed paths using rail Percent of modeled paths using rail If path does not include rail:
The reduction in travel time needed to “bring out” the rail path
Impact of using zone centroids rather than actual origin and destination locations
For observed paths using bus only Percent of modeled paths using bus(es) only Examination of paths using rail

FTA Workshop on Travel Forecasting for New Starts 82March 2009
Other Possible Tests (continued)
For observed paths with no transfers Percent of modeled paths without transfers Examination of possible reasons for misses
Repeat for observed paths with 1 and 2+ transfers
FTA Workshop on Travel Forecasting for New Starts 83March 2009
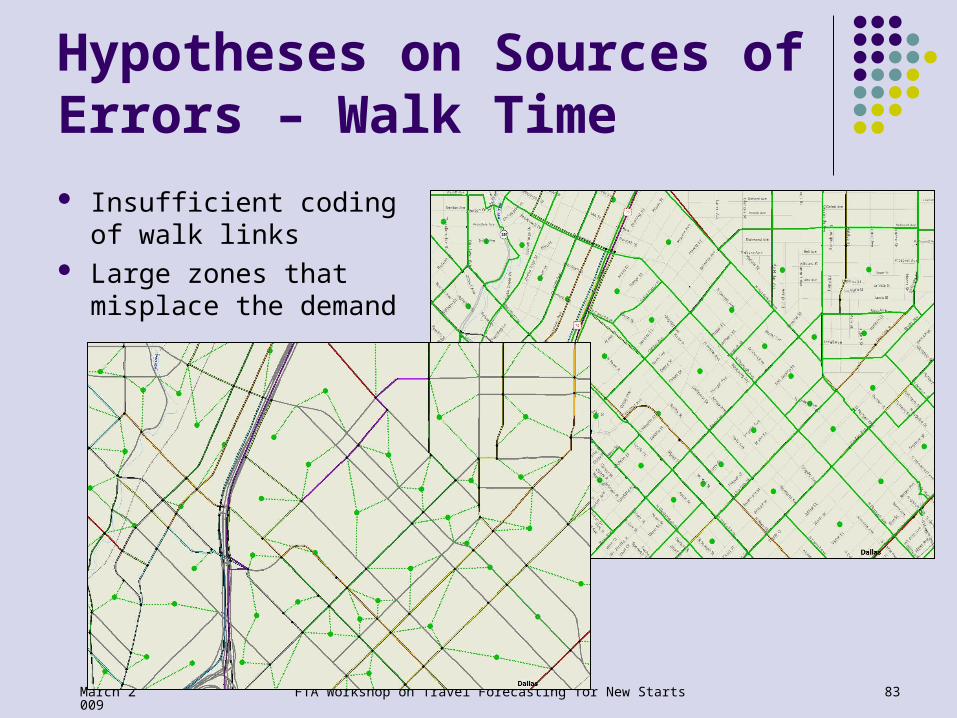
Hypotheses on Sources of Errors – Walk Time
Insufficient coding of walk links
Large zones that misplace the demand
FTA Workshop on Travel Forecasting for New Starts 84March 2009
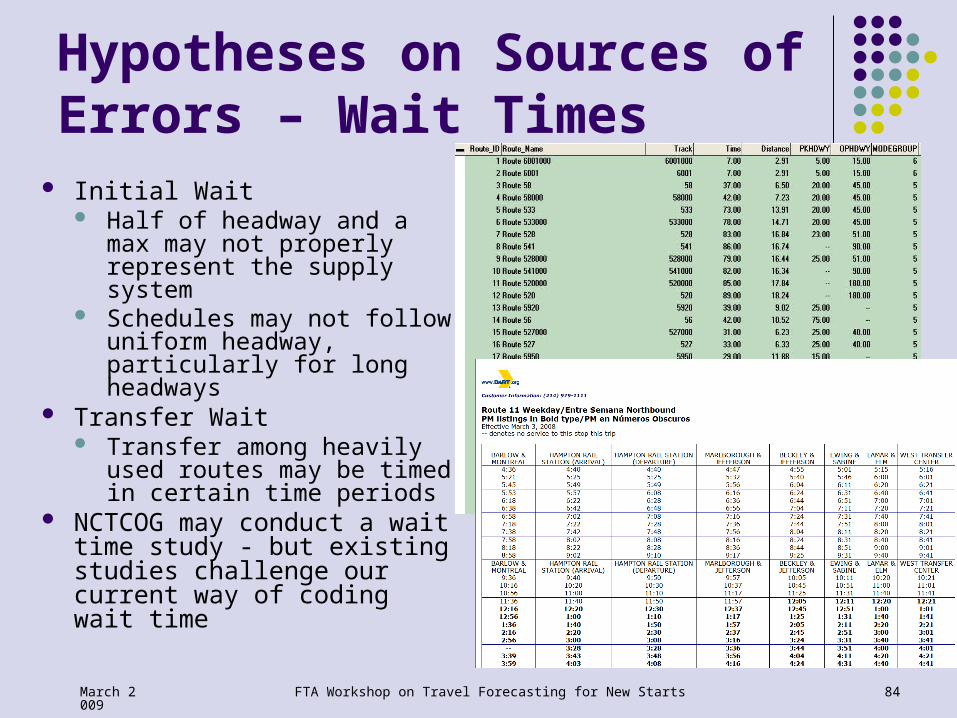
Hypotheses on Sources of Errors – Wait Times
Initial Wait Half of headway and a max
may not properly represent the supply system
Schedules may not follow uniform headway, particularly for long headways
Transfer Wait Transfer among heavily
used routes may be timed in certain time periods
NCTCOG may conduct a wait time study - but existing studies challenge our current way of coding wait time

FTA Workshop on Travel Forecasting for New Starts 85March 2009
Preliminary Conclusions Objective function of the optimization based on boarding
RMSE created paths that are consistently less costly than estimated observed cost; to reach to consistent results (correct paths and boarding) a more complex objective function and optimization process is needed
The boarding values included many small values, which may cause abrupt changes in RMSE without showing any meaningful behavioral trend
Close examination of the coded network and observed route boarding should be done to ensure every reasonable observed route is coded properly

FTA Workshop on Travel Forecasting for New Starts 86March 2009
Preliminary Conclusions (continued)
Calculation of “Observed GC” needs close examination, since it is calculated through model manipulation
Effect of walk network may be significant in the success of the proper calibration since it is a major issue for transit walk users
Effect of proper coding of both initial wait time and transfer wait time deserves close examination
Both data and model inaccuracies limit the calibration level: over calibration could be misleading

FTA Workshop on Travel Forecasting for New Starts 87March 2009
Acknowledgment
FTA staff: for providing ideas and help in analyzing the results Jim Ryan Ken Cervenka
NCTCOG Model Group staff: for managing the project, analysis, and presentation Kathy Yu Hua Yang

FTA Workshop on Travel Forecasting for New Starts 88March 2009
Analytical Support of Cases for Projects
Session 9 Information requirements The need for clear focus An approach Implications for current practice

FTA Workshop on Travel Forecasting for New Starts 89March 2009
Information Requirements
Contents of the ≈5-page case for the project Context (key activity centers, transportation facilities/services) Current conditions Anticipated future (No-build) conditions Merits of the project
Benefits of the low-cost alternative Additional benefits from the build alternatives (LPA)
Uncertainties Stand-alone document for non-technical readers

FTA Workshop on Travel Forecasting for New Starts 90March 2009
The Need for Clear Focus
Many generalities but few insights Demographics, activity centers, development plans Increasing congestion, aggregate transit ridership
Lots of model statistics but no information Aggregate ridership changes Increased transit shares Project boardings

FTA Workshop on Travel Forecasting for New Starts 91March 2009
An Approach
Work backwards from the benefits Isolate the users of the build alternative/LPA Identify the travel markets with the largest benefits Describe the specific causes of those benefits Describe the TSM benefits for those markets Explain the limitations on TSM performance Describe the future conditions for those markets Describe the current conditions for those markets
Forego interesting-but-unhelpful extras
FTA Workshop on Travel Forecasting for New Starts 92March 2009
Implications for Practice
Technical approach Isolation of trips using the project
Guideway trip tables from mode choice Select-link analysis from transit assignment
Analysis of causes of benefits Time savings by market (O-D, purpose, access) Comparison of impedances for principal benefitting markets
Management Provisions in scopes of work Resources

FTA Workshop on Travel Forecasting for New Starts 93March 2009
Implications for Practice (continued)
FTA initiatives Rating of the case for each proposed project
Coherent, compelling arguments high Disjointed, ungrounded ramblings low All of the others medium
Possible adjustment of “justification” ratings Coordination with project sponsors
With technical staff (scope, budget …; early starts) With managers (importance, attention, resources….)

FTA Workshop on Travel Forecasting for New Starts 94March 2009
Honolulu Rail ProjectSalt Lake Blvd Alignment
FTA Workshop on Travel Forecasting for New Starts 94March 2009
Project characteristics
-- 20 miles
-- Elevated rail
-- 2-car trains
-- Headways 3&6 mins.
-- $5.3 billion (Y.O.E. $)
Corridor characteristics
-- 765k people
-- 225k daily bus trips
-- Geographically constrained
-- Highway/street congestion
mountain
range
mountain
range
mountain
range
highway tunnels

FTA Workshop on Travel Forecasting for New Starts 95March 2009
Honolulu Rail ProjectAnticipated Elements of the Case
Setting and current/future conditions Geographic constraints on development, roadways Urban core: most jobs, “established” households Western expansion: “new” households, few jobs so far Long commutes and severe congestion Slow buses – from the west and within the core Heavy bus ridership Continued trends – congestion, westward expansion

FTA Workshop on Travel Forecasting for New Starts 96March 2009
Honolulu Rail ProjectAnticipated Elements of the Case (continued)
Problems Transit access from the west to the core Transit movements within the core Transit support for mixed development of the west

FTA Workshop on Travel Forecasting for New Starts 97March 2009
Honolulu Rail ProjectAnticipated Elements of the Case (continued)
Merits of the project TSM alternative
Expresses on paint-separated freeway HOV lanes Arterial BRT services, particularly in the core Fundamental constraint: severe congestion and
mixed-traffic bus operations

FTA Workshop on Travel Forecasting for New Starts 98March 2009
Honolulu Rail ProjectAnticipated Elements of the Case (continued)
Merits of the project (continued)
Rail alternative Full separation from traffic Dramatic savings in transit running times Ancillary benefits in transit headways (from equilibration)
Effective in addressing all three problems Very high user-benefits, with high costs good CEI
Uncertainties (up next)

FTA Workshop on Travel Forecasting for New Starts 99March 2009
Honolulu Rail ProjectAnticipated Elements of the Case (continued)
Some observations Elements of the case = big-picture concepts Principal travel markets, service impacts crucial Travel forecasting details/statistics out of place Information from the forecasts but not about the
forecasts Start early; update often; involve FTA staff

FTA Workshop on Travel Forecasting for New Starts 100March 2009
Uncertainty Analysis
Session 10 Requirement, purposes, and contents Candidate sources of uncertainty Analytical approaches Thoughts/questions Analysis of uncertainties in Honolulu

FTA Workshop on Travel Forecasting for New Starts 101March 2009
FTA Requirements
SAFETEA-LU requires FTA to: Rate projects with respect to the likelihood that they
will maintain their ratings as they move through project development
Evaluate the performance of forecasting contractors FTA policy guidance requires sponsors to:
Analyze and document capital-cost uncertainties Analyze and document project-rider uncertainties Effective
six months after guidance issued ≈ late fall 2009

FTA Workshop on Travel Forecasting for New Starts 102March 2009
FTA Workshop on Travel Forecasting for New Starts 102March 2009
Purposes
Analysis of uncertainties improves: Honesty in presentation of forecasts Quality control of forecasts Information for decision-makers Comparisons of predicted and actual outcomes FTA assessments of contractors (and others)

FTA Workshop on Travel Forecasting for New Starts 103March 2009
FTA Workshop on Travel Forecasting for New Starts 103March 2009
Contents
A range of forecasts for the horizon year (and the opening year?)
Upper bound Most likely Lower bound
Specific sources of significant uncertainty Source Current assumption Alternative outcomes, likelihoods, and implications
Documentation (in appendices) of analyses
opening year (and horizon year?)
FTA Workshop on Travel Forecasting for New Starts 104March 2009
FTA Workshop on Travel Forecasting for New Starts 104March 2009
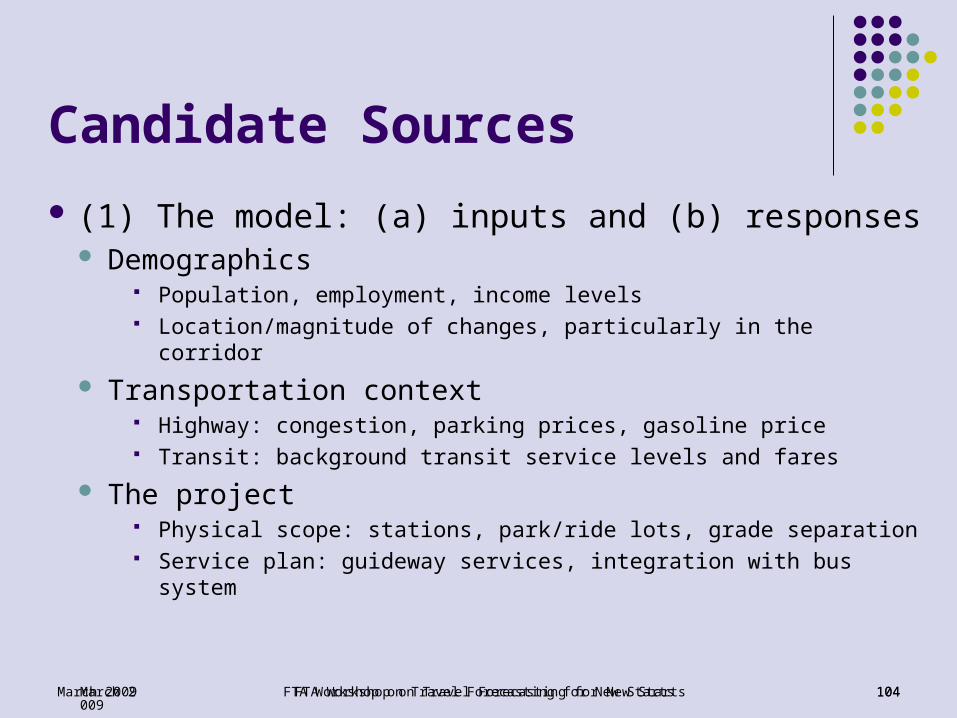
Candidate Sources
(1) The model: (a) inputs and (b) responses Demographics
Population, employment, income levels Location/magnitude of changes, particularly in the corridor
Transportation context Highway: congestion, parking prices, gasoline price Transit: background transit service levels and fares
The project Physical scope: stations, park/ride lots, grade separation Service plan: guideway services, integration with bus system

FTA Workshop on Travel Forecasting for New Starts 105March 2009
FTA Workshop on Travel Forecasting for New Starts 105March 2009
Candidate Sources (continued)
(2) New items beyond the model’s experience New transit modes (and model parameters)
Transit mode-specific constants and coefficients Nesting coefficients for transit access and line-haul
New behaviors Choice riders Formal park-ride access Free-fare riders (students, CBD free-fare zone) Circulation travel on fixed guideways

FTA Workshop on Travel Forecasting for New Starts 106March 2009
FTA Workshop on Travel Forecasting for New Starts 106March 2009
Analytical Approaches
(1) The model: (a) inputs and (b) responses Build-up of the ridership forecasts For the LPA, certainly; maybe for other alternatives Validation forecast, plus increments to 2030, i.e.:
1 - Transit service levels 3 - Highway service levels
2 - Demographics 4 - Parking costs
Assessment Key drivers of the forecasts Items with significant uncertainties?
Alternative assumptions for the range of forecasts

FTA Workshop on Travel Forecasting for New Starts 107March 2009
FTA Workshop on Travel Forecasting for New Starts 107March 2009
Analytical Approaches
(1) The model – examples of uncertain drivers Substantial growth in CBD employment
Basis? Consistency with recent history?
Parking costs CBD densities within range of data for parking-cost model? Suburban parking costs – entirely new phenomenon?
Cuts to “redundant” bus services in the project corridor Riders facing forced transfers that add time compared to bus? Fewer bus cutbacks and fewer project riders?

FTA Workshop on Travel Forecasting for New Starts 108March 2009
FTA Workshop on Travel Forecasting for New Starts 108March 2009
Analytical Approaches (continued)
(2) New items beyond the model’s experience New modes, new behaviors Approaches
Data and insights from similar projects in similar settings FTA guidance on transit alternative-specific effects ARRF estimates as a second set of “data” for matching
Range of possible outcomes Assumptions for the range of forecasts
FTA Workshop on Travel Forecasting for New Starts 109March 2009
FTA Workshop on Travel Forecasting for New Starts 109March 2009
Analytical Approaches (continued)
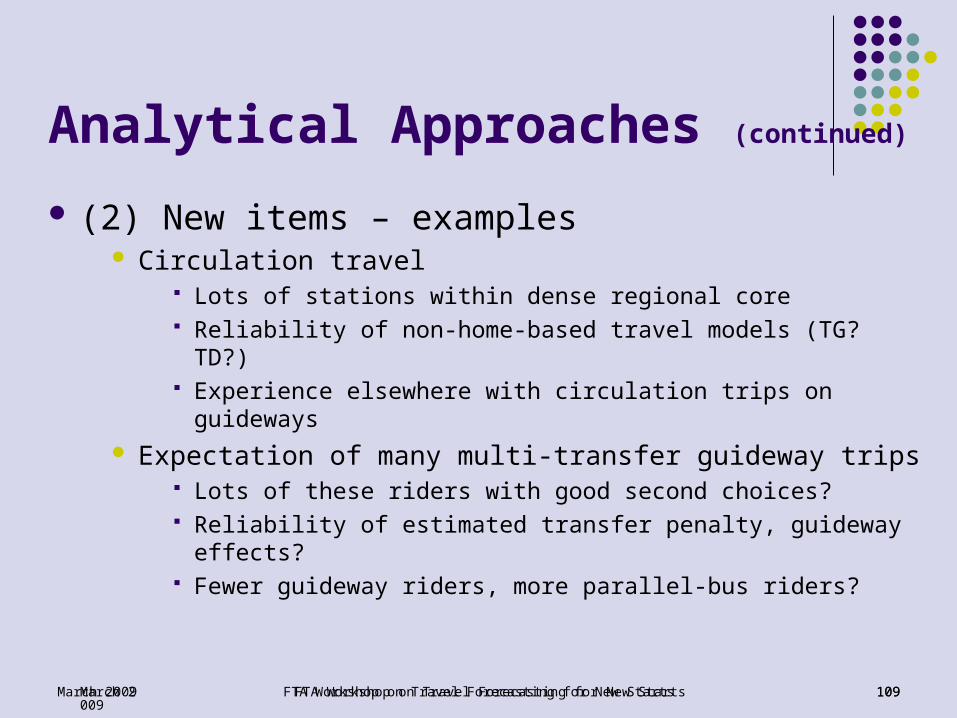
(2) New items – examples Circulation travel
Lots of stations within dense regional core Reliability of non-home-based travel models (TG? TD?) Experience elsewhere with circulation trips on guideways
Expectation of many multi-transfer guideway trips Lots of these riders with good second choices? Reliability of estimated transfer penalty, guideway effects? Fewer guideway riders, more parallel-bus riders?

FTA Workshop on Travel Forecasting for New Starts 110March 2009
FTA Workshop on Travel Forecasting for New Starts 110March 2009
Summary of Analytical Results
Standard estimate: vv,000 guideway trips/day Upper bound: xx,000 guideway trips/day Best estimate: yy,000 guideway trips/day Lower bound: zz,000 guideway trips/day
Upside Uncertainties Downside Uncertainties
1. Source with most potential 1. Source with most potential
2. Source with 2nd-most potential 2. Source with 2nd-most potential
3. Source with 3nd-most potential 3. Source with 3nd-most potential
4. Source with 4th-most potential 4. Source with 4th-most potential
5. <more?> 5. <more?>

FTA Workshop on Travel Forecasting for New Starts 111March 2009
Thoughts / Questions
Forecasting – an inherently uncertain task Single-number forecasts – unrealistic, misleading Range of possible outcomes
Honest portrayal of limits of technical work Sharing of risk between tech staff and decision-makers Basis for assessments of accuracy, performance
Implementation Effective: ≈ late fall 2009 Agency/consultant scopes, schedules, and budgets

FTA Workshop on Travel Forecasting for New Starts 112March 2009
Uncertainties in Honolulu
Bill Davidson – PB The Honolulu Rapid Transit Project Summary of results Supporting analyses Assumptions for the range of forecasts

FTA Workshop on Travel Forecasting for New Starts 113March 2009
Honolulu Rail ProjectSalt Lake Blvd Alignment
FTA Workshop on Travel Forecasting for New Starts 113March 2009
Project characteristics
-- 20 miles
-- Elevated rail
-- 2-car trains
-- Headways 3&6 mins.
-- $5.3 billion (Y.O.E. $)
Corridor characteristics
-- 765k people
-- 225k daily bus trips
-- Geographically constrained
-- Highway/street congestion
mountain
range
mountain
range
mountain
range
highway tunnels

FTA Workshop on Travel Forecasting for New Starts 114March 2009
AnalysisModel Inputs and Responses
Rail-trip Build-up Forecast
Attribute #1 #2 #3 #4 #5 #6 #7 #8
Person trips -- ’05 ’18 ’18 ‘30 ‘30 ‘30 ’30
Highway speeds -- ’05 ’18 ’18 ‘05 ‘05 ’30- ’30
Bus speeds ‘30 ’30 ’18 ’30 ‘30 ’05+ ’30 ‘30
Transit network ‘30 ‘30 ’18 ‘30 ‘30 ‘30 ’30 ’30
Transit demand ’05a ’05p ’18 ’18p ’30h ’30b ’30c ‘30
Rail trips per day 60k 73k 73k 77k 86k 72k 118k 87k
Notes:
- Transit demand ’05a is the 2005 on-board survey.
- Bus speeds ’05+ are based on highway speeds from the assignment of 2005 person trips onto the 2030 highway network.
- Highway speeds ’30- are from the assignment of 2030 person trips onto the 2005 highway network.
FTA Workshop on Travel Forecasting for New Starts 115March 2009
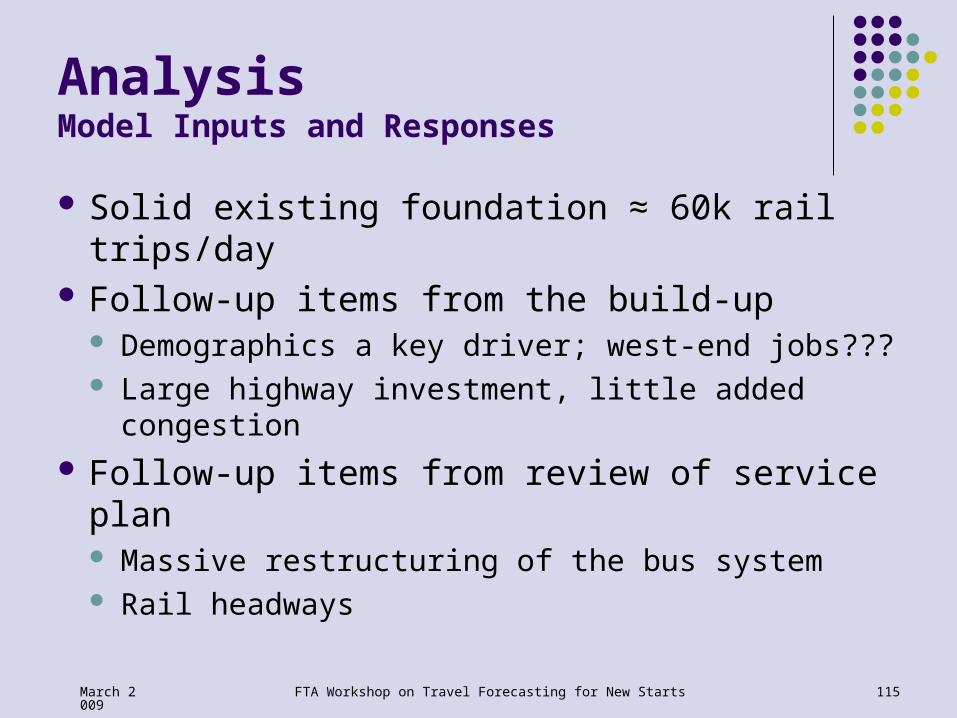
AnalysisModel Inputs and Responses
Solid existing foundation ≈ 60k rail trips/day Follow-up items from the build-up
Demographics a key driver; west-end jobs??? Large highway investment, little added congestion
Follow-up items from review of service plan Massive restructuring of the bus system Rail headways

FTA Workshop on Travel Forecasting for New Starts 116March 2009
AnalysisModel Inputs and Responses
Demographics: west-end jobs Large gains of households/jobs in adopted plan Market forces pushing household growth Job growth may depend on “unhappy” policies Test results: 2030 with 2017 jobs distribution 94k Assumptions for the range of forecasts
UB: 2017 distribution pattern in 2030 BG: MPO long range plan projections LB: Increased job growth in Ewa/Kapolei

FTA Workshop on Travel Forecasting for New Starts 117March 2009
AnalysisModel Inputs and Responses
Large highway investment Only modest congestion increases 20052030
Only 1,000 rail riders added by worse congestion $3 billion highway improvements in adopted plan Test results: no highway improvements118,000 Assumptions for the range of forecasts
UB: 2018 highway plan BG: 2018 highway plan + selected projects LB: full adopted regional plan

FTA Workshop on Travel Forecasting for New Starts 118March 2009
AnalysisModel Inputs and Responses
Massive bus-system restructuring Geographic constraints most routes in corridor Rail alignment affects large majority of routes Test for “unhappy TSM riders” 5,000 of 87,000 Assumptions for the range of forecasts
UB: Bus service plan unchanged BG: Bus service plan, but with 5 routes restored LB: Bus service plan, but with 10 routes restored

FTA Workshop on Travel Forecasting for New Starts 119March 2009
AnalysisModel Inputs and Responses
Rail Headways 3-minute peak / 6-minute off-peak
2-car trains on 4-car-capable platforms Phased implementation
Service level & passenger load balancing Test result: 5-min peak / 10-min offpeak 79,400 Assumptions for the range of forecasts
UB: 3-minute peak/6-minute off-peak BG: 3-minute peak/6-minute off-peak LB: 5-minute peak/10-minute off-peak

FTA Workshop on Travel Forecasting for New Starts 120March 2009
AnalysisNew Items beyond the Model’s Experience
Follow-up items on model inexperience Absence of current formal park-ride riders Bus-access to rail Multi-transfer trips Guideway effects Special markets – circulation trips

FTA Workshop on Travel Forecasting for New Starts 121March 2009
AnalysisNew Items beyond the Model’s Experience
Absence of current formal PnR ridersCurrent lot Cars Spaces Bus routes
Hawaii Kai ? 134 1, 80, 80A, 82, 95
Mililani Mauka 30 176 52, 88A, 98
Royal Kunia 12 149 97, 434
Wahiawa 40 50 52, 62, 83, 83A, 98
Haleiwa ? 20 52, 83A, 76
Few lots Chickens and go-carts Lots of bus service Few park/ride trips
Initial forecast with model calibrated with Honolulu’05 90,400 daily rail trips Walk 17%, bus 63%, FPnR 0.5%, IPnR 2.7%, KnR 17%
Calibration against access-to-rail trips from Portland Revised forecast: 98,600 daily rail trips Walk 15%, bus 56%, FPnR 23%, IPnR 2%, KnR 4%
FTA Workshop on Travel Forecasting for New Starts 122March 2009
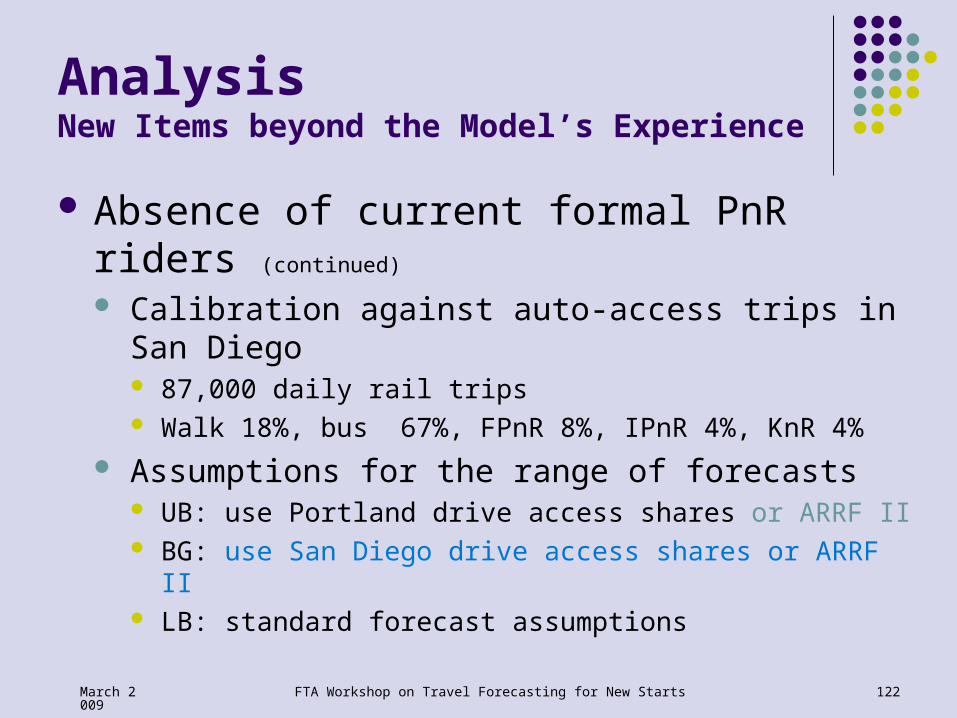
AnalysisNew Items beyond the Model’s Experience
Absence of current formal PnR riders (continued)
Calibration against auto-access trips in San Diego 87,000 daily rail trips Walk 18%, bus 67%, FPnR 8%, IPnR 4%, KnR 4%
Assumptions for the range of forecasts UB: use Portland drive access shares or ARRF II BG: use San Diego drive access shares or ARRF II LB: standard forecast assumptions

FTA Workshop on Travel Forecasting for New Starts 123March 2009
AnalysisNew Items beyond the Model’s Experience
Bus-access to rail Honolulu 2005 access shares
91% walk access, 9% auto access 35% 0-car, 30% 1-car, 35% 2+ car Only 8% of 1-car household riders drive to transit in 2005 Only 16% of 2+ car household riders drive to transit in 2005
Forecast with model calibrated with Honolulu’05 29% of bus access comes from 1-car households 45% of bus access comes from 2+car households
Assumptions for the range of forecasts UB: standard forecast results BG: shift 2+car hhold bus-access trips to drive access LB: shift 25% of 2+car hhold bus-access trips to auto

FTA Workshop on Travel Forecasting for New Starts 124March 2009
AnalysisNew Items beyond the Model’s Experience
Multi-transfer trips More than 50% of rail riders must transfer more Path-choice OK in the model? Transfer penalty? Already checked for unhappy tsm riders Test for competing bus paths in build 32 trips
Only Home-Based Work Transfer > 2, bus path better than rail path
Assumptions for the range of forecasts UB: no change BG: no change LB: no change

FTA Workshop on Travel Forecasting for New Starts 125March 2009
AnalysisNew Items beyond the Model’s Experience
Unmeasured guideway effects Rail = local bus in standard forecasts Rail substantially improves unmeasured attributes
- Visibility/learnability - Schedule flexibility for riders
- Reliability - Amenities at stops, on vehicles
Test Results: full “other” effects 103,400 Assumptions for the range of forecasts
UB: K=14.5/5.5 minutes + C(ivtrail) = 0.85 x C(ivtother)
BG: K=7/3 minutes + C(ivtrail) = 0.95 x C(ivtother) LB: Standard Forecast
FTA Workshop on Travel Forecasting for New Starts 126March 2009
AnalysisNew Items beyond the Model’s Experience
Circulation trips Re-estimated original WMATA model using 2002
data Densities along Honolulu corridor relatively similar
to Washington DC densities Circulation riders
14,600 rail tripsAdded to the 87,000 trips from the standard forecastJust under 15% of total rail ridership

FTA Workshop on Travel Forecasting for New Starts 127March 2009
SpecificationsFor the UB, LB, and BG Forecasts

FTA Workshop on Travel Forecasting for New Starts 128March 2009
FTA Workshop on Travel Forecasting for New Starts 128March 2009
Summary of Results
Standard estimate: 87,000 rail trips per day Upper bound: xx,000 rail trips per day Best estimate: yy,000 rail trips per day Lower bound: zz,000 rail trips per day
Upside Uncertainties Downside Uncertainties
1. Unmeasured attributes 1. Unhappy TSM riders
2. Drive access behavior 2. Rail headways
3. Highway congestion levels 3. 2+ car households bus access
4. West End employment 4. West End employment
105,000 95,000 80,000

FTA Workshop on Travel Forecasting for New Starts 129March 2009
FTA Workshop on Travel Forecasting for New Starts 129March 2009
Conclusions on the Forecasts
Strong confidence in lower end Concerned about drive access behavior
Important design implications West End development and highway
improvement investments will have measurable impact on ridership Very difficult to determine confidence levels
Standard estimate likely an under-estimate
FTA Workshop on Travel Forecasting for New Starts 130March 2009
FTA Workshop on Travel Forecasting for New Starts 130March 2009
Observations on the Effort
New way of thinking about forecasting Direct connection to the real world Insights Not about model mechanics
Learning process new investigations West End employment growth Examination of highway investments Drive access behavior
Direct contribution to case for the project FTA assistance in understanding the benefits of the project

FTA Workshop on Travel Forecasting for New Starts 131March 2009
Observations on the Effort
Client support and interest New task in the work plan
QA/QC Uncertainty analysis
Peer review topics
FTA Workshop on Travel Forecasting for New Starts 131March 2009