front page - institute of national affairs
TRANSCRIPT


ActivitiesActivities20102010
ActualsActualsK’000K’000
20112011AppropApprop
K’000K’000
20122012EstimatesEstimates
K’000K’000
TotalTotal
K’000K’000
Top Management & General Administration
163,463.8 188,825.5 319,036.3 671,325.6
Development & Implementation of Educ. Stds
19,240.5 53,135.1 44,124.8 116,500.4
Basic Education 22,591.8 24,481.5 23.212.5 70,285.8
General Secondary Education 15,861.3 37,836.2 42,778.2 96,475.7
Education Recurrent Budget
General Secondary Education 15,861.3 37,836.2 42,778.2 96,475.7
Vocational Education 2,936.3 3,777.0 4,090.3 10,803.6
Technical Education 12,772.8 16,205.0 17,704.1 46,681.9
Teacher Education 15,121.6 25,434.7 28,875.0 69,431.3
Library Services & Literacy Services
2,325.8 2,644.5 1,924.3 6,894.6
Government Records & Archives 447.8 529.4 492.1 1,469.3
TotalTotal 269,883.4269,883.4 378,303.6378,303.6 482,237.6482,237.6 1,089,868.21,089,868.2

ProjectsProjects 20102010ActualsActualsK’000K’000
201201AppropAppropK’000K’000
20122012EstimatesEstimates
K’000K’000
TotalTotal
K’000K’000Top Management & General Administration
49,745.8 68,087.0 51,672.0 169,504.8
Development & Implementation of Educ. Stds
76,384.7 46,678.0 209,201.0 332,263.7
Basic Education 15,935.3 165,111.0 18,639.0 199,685.3
General Secondary Education 0 71,010.0 13,376.0 84,386.0
Vocational Education 996.5 10,000.0 14,707.0 25,703.5
Education Development Budget
Vocational Education 996.5 10,000.0 14,707.0 25,703.5
Technical Education 3,631.9 2,913.0 0 6,544.9
Teacher Education 0 587.0 960.0 1,547.0
Library Services & Literacy Services 0 11,000.0 8,000.0 19,000.0
Government Records & Archives 0 0 0 0
Total Development BudgetTotal Development Budget 96,947.496,947.4 375,386.0375,386.0 316,555.0316,555.0 788,889.4788,889.4
Total Recurrent BudgetTotal Recurrent Budget 254,761.7254,761.7 352,868.9352,868.9 482,237.6482,237.6 1,089,868.21,089,868.2
TotalTotal 351,710.1351,710.1 728,254.9728,254.9 798,792.6798,792.6 1,878,757.61,878,757.6

Total National Education Budget
42%
Education Budget
RECURRENTRECURRENT42% RECURRENTRECURRENT
DEVELOPMENTDEVELOPMENT58.058.0%%

Summary Expenditure Items
EXPENTURE ITEMSEXPENTURE ITEMS20102010
ActualActualK’000K’000
20112011AppropAppropK’000K’000
20122012EstimatesEstimates
K’000K’000TotalTotalK’000K’000
Personal Emoluments 73,267.8 88,460.2 103,234.5 264,962.5
Goods and Other Services
29,952.5 30,589.7 44,703.0 105,244.9Goods and Other Services
29,952.5 30,589.7 44,703.0 105,244.9
Current Transfers 151,486.2 213,602.0 313,100.1 678,188.3
Capital Expenditure 55.6 20,217.0 21,200.0 41,472.6
TotalTotal 254,761.8254,761.8 352,868.9352,868.9 482,237.6482,237.6 1,089,868.31,089,868.3

Summary of Expenditure
24.3%24.3%
3.8%3.8%Expenditure by Items
Personnel Emolument
Goods and Other Services
9.7%9.7%62.2%62.2%Current Transfers
Captial Expenditure

ProvinceProvince 20102010ActualActualK’000K’000
20112011AppropApprop
K’000K’000
20122012EstimateEstimate
K’000K’000
TotalTotal
K’000K’000
Manus 9,375.5 9,807.6 12,811.7 31,994.8New Ireland 17,757.4 18,556.9 20,949.1 57,263.4
Teachers Salaries – New Guinea Islands Region
New Ireland 17,757.4 18,556.9 20,949.1 57,263.4
East New Britain 33,091.8 34,193.8 42,601.0 109,886.8
West New Britain 25,537.0 26,530.7 28,520.3 80,588.0
Autonomous Bougainville
29,491.0 32,664.0 37,351.6 99,506.6
TotalTotal 115,252.7115,252.7 121,753.0121,753.0 142,233.7142,233.7 379,239.4379,239.4
ProvinceProvince20102010
ActualActualK’000K’000
20112011AppropApprop
K’000K’000
20122012EstimateEstimate
K’000K’000
TotalTotalK’000K’000
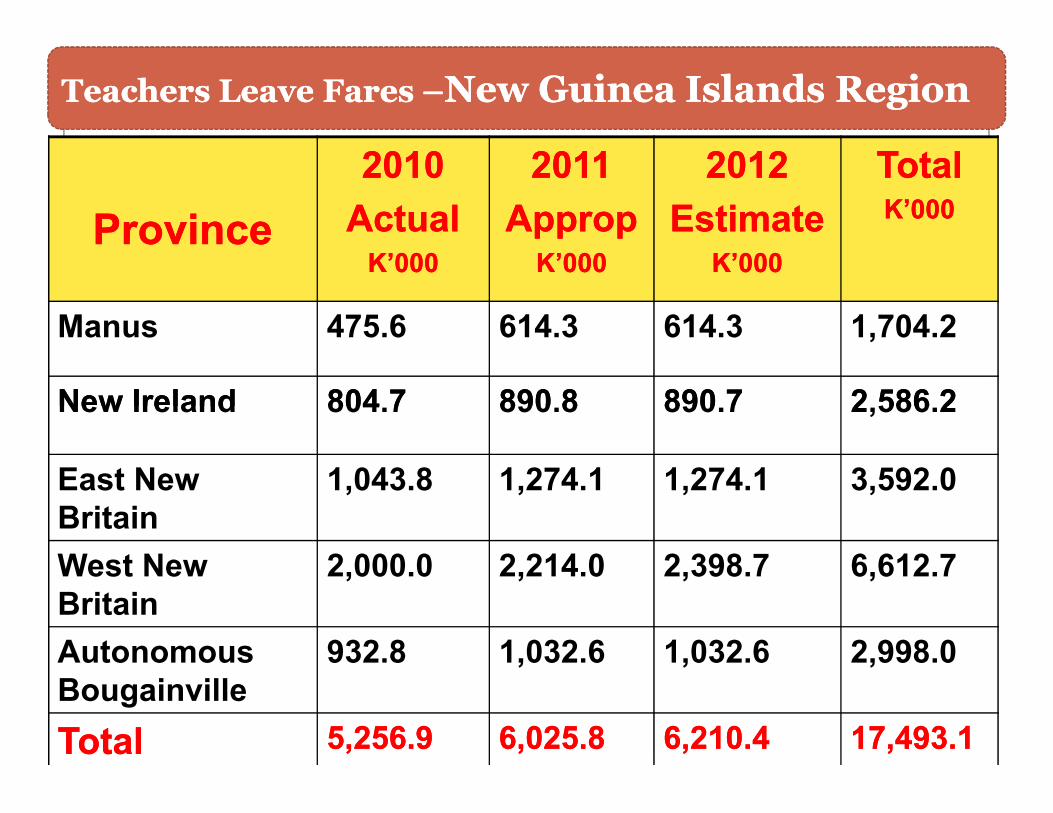
Manus 475.6 614.3 614.3 1,704.2
New Ireland 804.7 890.8 890.7 2,586.2
Teachers Leave Fares Teachers Leave Fares ––New Guinea Islands RegionNew Guinea Islands Region
New Ireland 804.7 890.8 890.7 2,586.2
East New Britain
1,043.8 1,274.1 1,274.1 3,592.0
West New Britain
2,000.0 2,214.0 2,398.7 6,612.7
Autonomous Bougainville
932.8 1,032.6 1,032.6 2,998.0
TotalTotal 5,256.95,256.9 6,025.86,025.8 6,210.46,210.4 17,493.117,493.1

ProvinceProvince 20102010ActualsActuals
K’000K’000
20112011AppropApprop
K’000K’000
20122012EstimatesEstimates
K’000K’000
TotalTotal
K’000K’000
Manus 1,362.3 1,619.2 2,179.7 5,161.2
New Ireland 845.0 771.2 579.3 2,195.5
Education Function Grants - Provinces
New Ireland 845.0 771.2 579.3 2,195.5
East New Britain
2,303.8 2,591.2 3,266.6 8,161.6
West New Britain
1,167.9 2,405.6 3,801.0 7,374.5
AutonomousBougainville
0 0 0 0
TotalTotal 40,221.2 46,606.3 59,462.8 146,290.3

BudgetBudget 20102010ActualActualK’000K’000
20112011AppropAppropK’000K’000
20122012EstimateEstimate
K’000K’000
TotalTotalK’000K’000
Recurrent 254,761.7 352,868.9 482,237.6 1,089,868.21,089,868.2
Development 96,948.4 375,386.0 316,555.0 788,889.4788,889.4
Teachers Salaries
115,252.7 121,753.0 142,233.7 379,239.4379,239.4
Summary – Total Education Allocation
Teachers Salaries
115,252.7 121,753.0 142,233.7 379,239.4379,239.4
Teachers Leave Fares
5,256.9 6,025.8 6,210.4 17,493.117,493.1
Functions Grants
5,679.0 7,387.2 9,826.6 22,892.822,892.8
Provincial Development
44,135.0 33,935.0 33,050.0 111,135.0111,135.0
TOTALTOTAL 522,033.7522,033.7 897,370.9897,370.9 990,113.3990,113.3 2,409,517.92,409,517.9


Health Recurrent Budget
ActivitiesActivities20102010
ActualActualK’000K’000
20112011AppropAppropK’000K’000
20122012EstimatesEstimates
K’000K’000
TotalTotalK’000K’000
Top Management & Services 28,067.2 27689.9 30750.3 86,507.4Urban Health Facilities 24781.7 33,053.2 39,005.1 96,840.0
Rural Health Support Services 0 0 0 0Family Health Services 6,614.0 6,206.0 8,113.4 20,933.4Disease Control 6,614.0 6,206.0 8,113.4 20,072.0Environment Health & Water Supply
658.9 806.7 1,100.7 2,566.3
Health Promotion & Education 1,220.5 1,312.6 1,137.8 3,670.9
Medical Supplies and Equipment
97,420.8 16,933.9 161,607.9 419,962.6
Human Resource Development 43,599.4 29,413.0 27,042.6 100,055.0
TotalTotal 205,496.9205,496.9 261,684.0261,684.0 272,147.6272,147.6 739,328.5739,328.5

Health Development Budget
ActivitiesActivities20102010
ActualActualK’000K’000
20112011AppropApprop
K’000K’000
20122012EstimatesEstimates
K’000K’000
TotalTotalK’000K’000
Top Management & Services 128,058.5 182,497.0 210,539.0 521,094.5
Urban Health Facilities 25,000.0 11,700.0 36,700.0 133,540.0
Rural Health Support Services 43,534.0 24,208.0 0 67,742.0Family Health Services 0 1,955.0 0 1,955.0Disease Control 17,101.0 10,674.0 10,048.0 37,823.0Environment Health & Water Supply
64.8 18,736.0 20,072.0 38,872.8
Health Promotion & Education 567.0 8,013.0 0 8,580.0Medical Supplies and Equipment
24,400.0 18,500.0 42,900.0 462,862.6
Human Resource Development
0 1,000.0 7,000.0 8,000.0
TotalTotal 147,791.3147,791.3 315,809.0315,809.0 302,067.0302,067.0 1,502,995.81,502,995.8

ExpenditureExpenditureItemsItems
20102010ActualActualK’000K’000
20112011AppropApprop
K’000K’000
20122012EstimateEstimate
K’000K’000
TotalTotal
K’000K’000
Personal Emoluments 45,602.9 53,258.1 62,158.4 161,019.4
Summary By Expenditure Items
Goods & Other Services 122,623.4 155,422.0 163,380.3 441,425.7
Current Transfers 35,996.7 24,403.9 18,034.9 78,435.5
Capital Expenditure 1,274.0 28,600.0 28,574.0 58,448.0
TotalTotal 205,497.0205,497.0 261,684.0261,684.0 272,147.6272,147.6 739,328.6739,328.6

Summary By Expenditure Items
21.8%21.8%10.6%10.6%
7.9%7.9%
Expenditure Items
Personal Emoluments
Goods & Other Services
59.7%59.7%
Goods & Other ServicesCurrent Transfers
Capital Expenditure

HospitalHospital20102010
ActualActualK’000K’000
20112011AppropApprop
K’000K’000
20122012EstimatesEstimates
K’000K’000
TotalTotalK’000K’000
Lorengau 4,700.8 5,006.7 5,757.0 15,464.5
Kavieng 6,579.9 8,839.0 9,555.2 24,974.1
Provincial Hospitals Provincial Hospitals –– New Guinea Islands RegionNew Guinea Islands Region
Kavieng 6,579.9 8,839.0 9,555.2 24,974.1
Nonga Base 1,088.0 11,785.7 13,451.4 26,325.1
Kimbe 9,635.5 10,802.1 11,457.7 31,895.3
Buka 7,056.2 7,951.6 8,634.8 23,642.6
TotalTotal 24,359.624,359.6 39,378.439,378.4 43,099.143,099.1 106,837.1106,837.1

ProvinceProvince 20102010ActualActual
K’000K’000
20112011AppropApprop
K’000K’000
20122012EstimatesEstimates
K’000K’000
TotalTotalK’00K’0000
Manus 534.2 547.5 585.9 1,667.6
New Ireland 3,017.4 3,179.8 3,407.0 9,604.2
Church Health Services Church Health Services –– New Guinea Islands RegionNew Guinea Islands Region
New Ireland 3,017.4 3,179.8 3,407.0 9,604.2
East New Britain
5,027.0 5,087.5 5,456.8 15,571.3
West New Britain
2,334.2 3,379.8 3,624.0 9,338.0
ABG 3,421.0 3,488.0 3,736.1 10,645.1
TotalTotal 14,333.814,333.8 15,682.615,682.6 16,809.816,809.8 46,826.246,826.2

PProvincerovince 20102010ActualActualK’000K’000
20112011AppropApprop
K’000K’000
22012012EstimatesEstimates
K’000K’000
TotalTotalK’000K’000
Manus 1,269.8 1,526.7 2,106.6 4,903.1
New Ireland 1,160.1 1,160.1 848.3 3,168.5
Function Grants
New Ireland 1,160.1 1,160.1 848.3 3,168.5
East New Britain
1,737.2 2,082.2 3,883.4 7,702.8
West New Britain
767.9 2,005.6 2,906.5 5,680.0
ABG 0 0 0 0
TotalTotal 4,935.04,935.0 6,774.66,774.6 9,744.89,744.8 21,454.421,454.4

ProvinceProvince 20102010ActualActualK’000K’000
20112011AppropApprop
K’000K’000
20122012EstimatesEstimates
K’000K’000
TotalTotalK’000K’000
Manus 2,000.0 0 2,000.0 4,000.0
New Ireland 29,215.0 24,450.0 26,050.0 79,715.0
East New Britain 8,250.0 5,250.0 1,250.0 14,750.0
Provincial Health Development Grants
East New Britain 8,250.0 5,250.0 1,250.0 14,750.0
West New Britain 2,170.0 1,750.0 750.0 4,670.0
ABG 8,000.0 1,000.0 0 9,000.0
TotalTotal 49,635.049,635.0 49,635.049,635.0 32,450.032,450.0 30,050.030,050.0

BudgetBudget20102010
ActualActualK’000K’000
20112011AppropAppropK’000K’000
20122012EstimatesEstimates
K’000K’000
TotalTotalK’000K’000
Recurrent 439,965.9 261,684.0 272,147.6 739,328.5739,328.5
Development 145,791.3 315,809.0 302,067.0 763,667.3763,667.3
Summary – Total Health Allocation
Hospitals 56,347.1 66,359.2 61,558.5 184,264.8184,264.8
Church Health Services
19,275,.7 20,673.1 22,154.1 62,102.962,102.9
Function Grants
13,054.9 16,343.6 19,321.1 48,719.648,719.6
Provincial Development
21,652.0 93,100.0 61,000.0 158,752.0158,752.0
TOTALTOTAL 439,965.9439,965.9 681,718.9681,718.9 680,248.3680,248.3 1,801,933.11,801,933.1

DISTRICT SERVICES DISTRICT SERVICES
IMPROVEMENT IMPROVEMENT
PROGRAM PROGRAM (DSIP)(DSIP)
DISTRICT SERVICES DISTRICT SERVICES
IMPROVEMENT IMPROVEMENT
PROGRAM PROGRAM (DSIP)(DSIP)
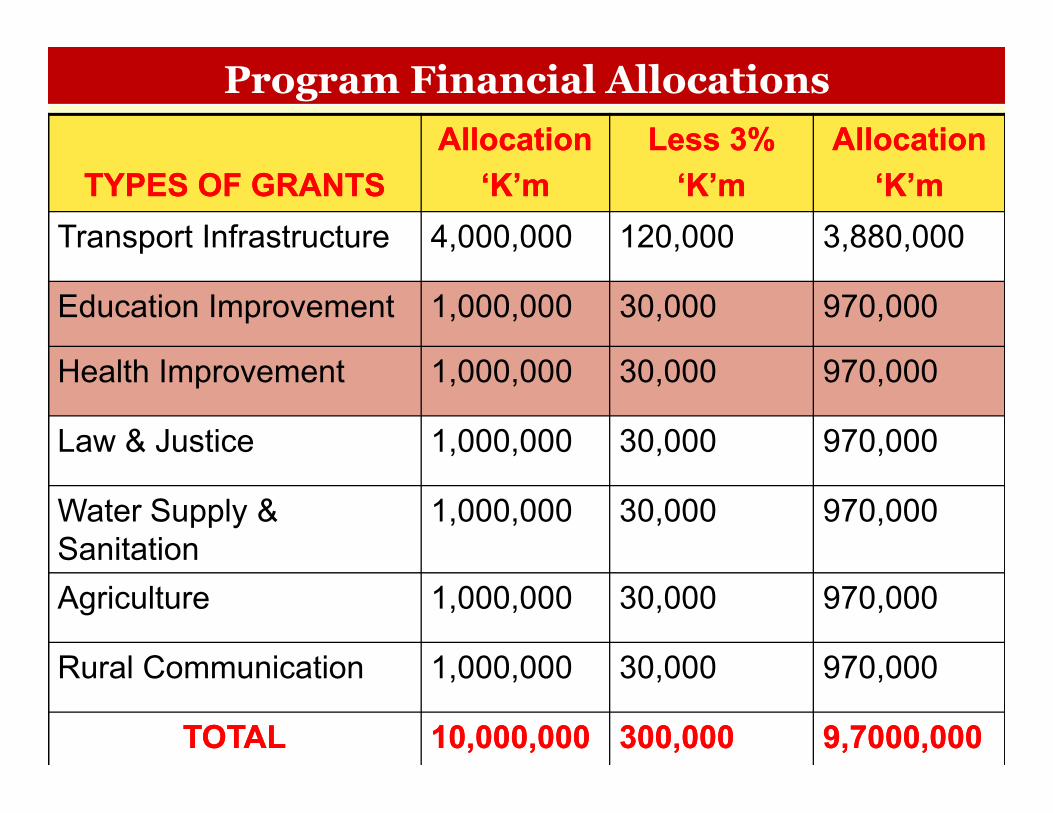
Program Financial Allocations
TYPES OF GRANTSTYPES OF GRANTSAllocationAllocation
‘‘K’mK’mLess 3%Less 3%
‘‘K’mK’mAllocationAllocation
‘‘K’mK’mTransport Infrastructure 4,000,000 120,000 3,880,000
Education Improvement 1,000,000 30,000 970,000
Health Improvement 1,000,000 30,000 970,000
Law & Justice 1,000,000 30,000 970,000
Water Supply & Sanitation
1,000,000 30,000 970,000
Agriculture 1,000,000 30,000 970,000
Rural Communication 1,000,000 30,000 970,000
TOTALTOTAL 10,000,00010,000,000 300,000300,000 9,7000,0009,7000,000
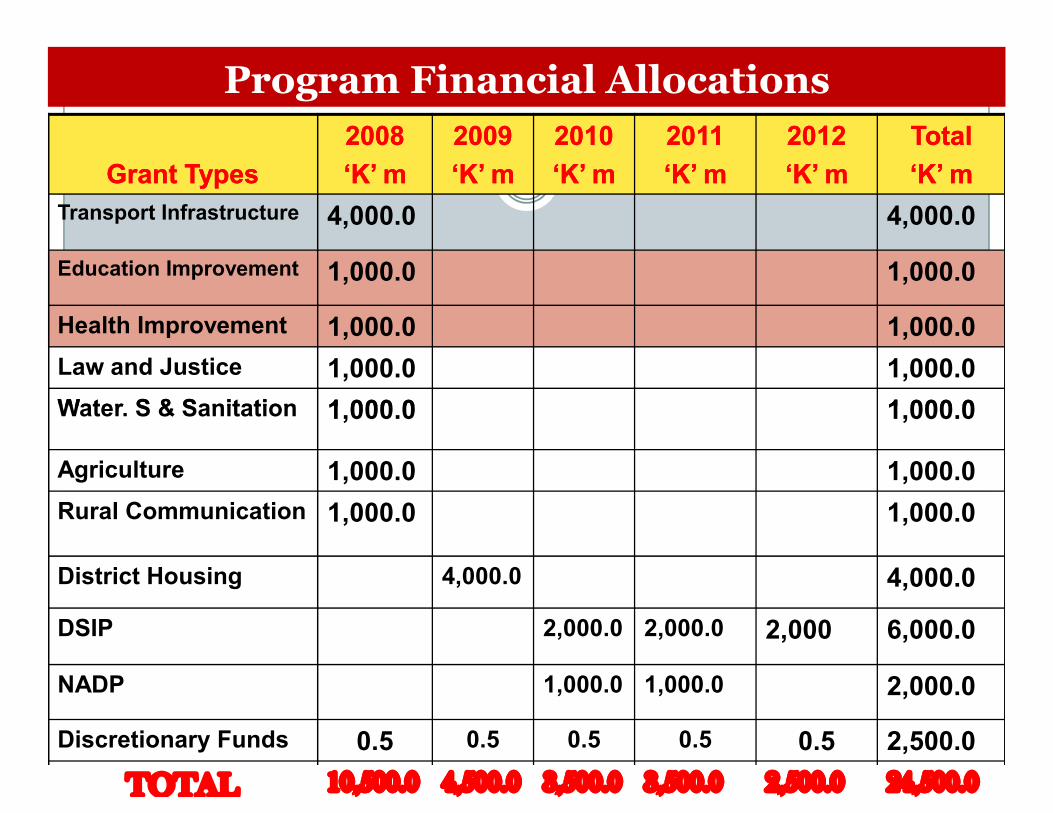
Grant TypesGrant Types20082008‘K’ m‘K’ m
20092009‘K’ m‘K’ m
20102010‘K’ m‘K’ m
20112011‘K’ m‘K’ m
20122012‘K’ m‘K’ m
TotalTotal‘K’ m‘K’ m
Transport Infrastructure 4,000.0 4,000.0
Education Improvement 1,000.0 1,000.0
Health Improvement 1,000.0 1,000.0Law and Justice 1,000.0 1,000.0Water. S & Sanitation 1,000.0 1,000.0
Program Financial Allocations
Water. S & Sanitation 1,000.0 1,000.0
Agriculture 1,000.0 1,000.0Rural Communication 1,000.0 1,000.0
District Housing 4,000.0 4,000.0
DSIP 2,000.0 2,000.0 2,000 6,000.0
NADP 1,000.0 1,000.0 2,000.0
Discretionary Funds 0.5 0.5 0.5 0.5 0.5 2,500.0TOTAL 10,500.010,500.0 4,500.04,500.0 3,500.03,500.0 3,500.03,500.0 2,500.02,500.0 24,500.024,500.0

Address Infrastructure Issues both Buildings and Roads- Teachers houses are conditions but are run down or
none and teachers leave due to no housing;- Public Servants houses are worse- Lack of houses for doctors and nurses- Classroom space for increased number of students- No road links to deliver services (medical supplies
and education materials) to schools and health centers in remote areas;
- Airlines closed down operations because too expensive.
- Airstrips are closed- Aid posts are closed
Health and Education Issues Address Infrastructure Issues both Buildings
and Roads- Teachers houses are conditions but are run down or
none and teachers leave due to no housing;- Public Servants houses are worse- Lack of houses for doctors and nurses- Classroom space for increased number of students- No road links to deliver services (medical supplies
and education materials) to schools and health centers in remote areas;
- Airlines closed down operations because too expensive.
- Airstrips are closed- Aid posts are closed

Human Resource Issues- No training program for public servants- In order for professional teachers to be promoted,
they attend training at In Service College at their own cost;
- Aging workforce, retire, retrenchment and recruitment is less than outgoing staff;
- Community Health Workers cannot be absorbed in the Hospitals and Health Centres because no positions ;
- Limited position in hospitals and health centres(establishment and funded ceiling)
Aging Equipment Need Replacement
Health and Education Issues Human Resource Issues
- No training program for public servants- In order for professional teachers to be promoted,
they attend training at In Service College at their own cost;
- Aging workforce, retire, retrenchment and recruitment is less than outgoing staff;
- Community Health Workers cannot be absorbed in the Hospitals and Health Centres because no positions ;
- Limited position in hospitals and health centres(establishment and funded ceiling)
Aging Equipment Need Replacement

Recommendation
Free Education and Health Service idea is good but require a Policy document for sustainability and not to be seen a commitment made for Political reasons.
A research to be carried out to establish what is required before imposing the policy so funds are distributed accordingly.
Address the above issues then you can expect improved quality services or outputs.
Health and Education Issues
Recommendation
Free Education and Health Service idea is good but require a Policy document for sustainability and not to be seen a commitment made for Political reasons.
A research to be carried out to establish what is required before imposing the policy so funds are distributed accordingly.
Address the above issues then you can expect improved quality services or outputs.

TENK YU TENK YU LONGLONGHARIMHARIM