fronde half year report 2017 · ... we are accelerating ... financing cash inflows - - ......
TRANSCRIPT


FRONDE HALF YEAR REPORT 2017
COPYRIGHT © 2017 FRONDE SYSTEMS GROUP LIMITED 2
Contents Chairman’s and Chief Executive’s Report ......................................................................................................................3
Statement of Comprehensive Income ...........................................................................................................................5
Statement of Financial Position ...................................................................................................................................6
Statement of Changes in Equity ...................................................................................................................................7
Cash Flow Statement ..................................................................................................................................................8
Notes to the Financial Statements ...............................................................................................................................9
FRONDE HALF YEAR REPORT 2017
COPYRIGHT © 2017 FRONDE SYSTEMS GROUP LIMITED 3
Chairman’s and Chief Executive’s Report On behalf of Fronde Systems Group, we are pleased to present another substantially improved result. Our half year result
for the period ended 30 September 2017 reflects the continued improvement in overall profitability of our business.
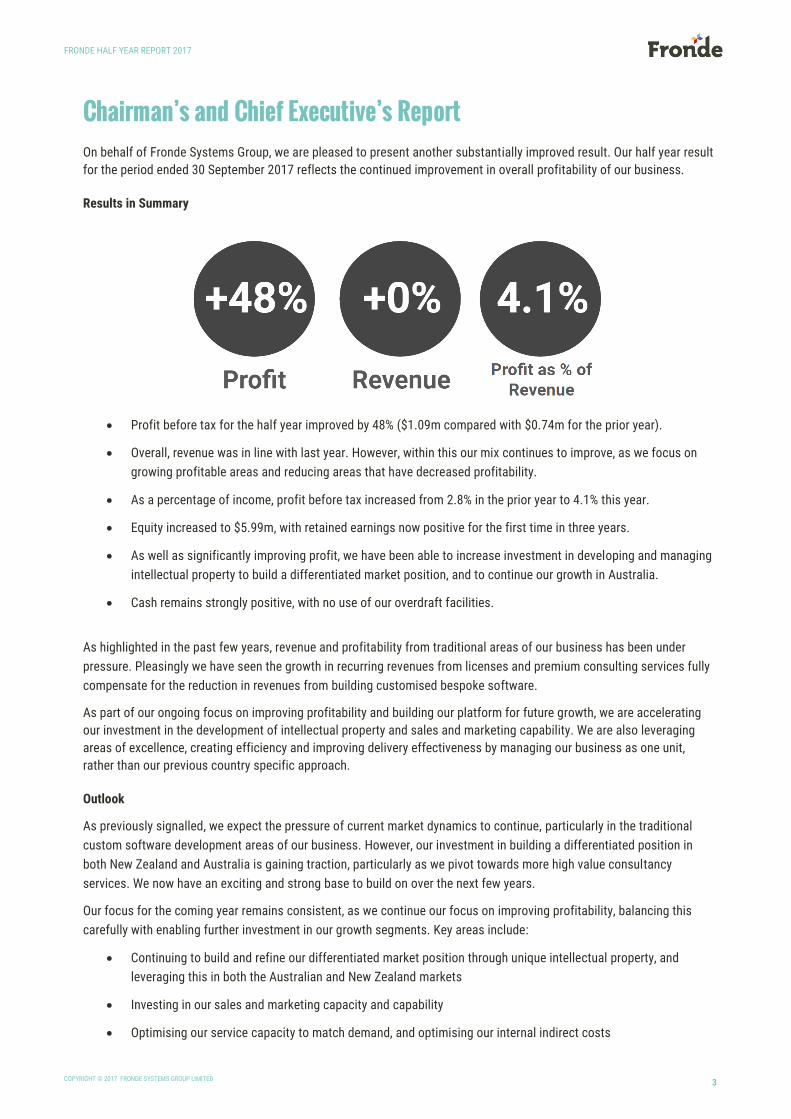
Results in Summary
• Profit before tax for the half year improved by 48% ($1.09m compared with $0.74m for the prior year).
• Overall, revenue was in line with last year. However, within this our mix continues to improve, as we focus on
growing profitable areas and reducing areas that have decreased profitability.
• As a percentage of income, profit before tax increased from 2.8% in the prior year to 4.1% this year.
• Equity increased to $5.99m, with retained earnings now positive for the first time in three years.
• As well as significantly improving profit, we have been able to increase investment in developing and managing
intellectual property to build a differentiated market position, and to continue our growth in Australia.
• Cash remains strongly positive, with no use of our overdraft facilities.
As highlighted in the past few years, revenue and profitability from traditional areas of our business has been under
pressure. Pleasingly we have seen the growth in recurring revenues from licenses and premium consulting services fully
compensate for the reduction in revenues from building customised bespoke software.
As part of our ongoing focus on improving profitability and building our platform for future growth, we are accelerating
our investment in the development of intellectual property and sales and marketing capability. We are also leveraging
areas of excellence, creating efficiency and improving delivery effectiveness by managing our business as one unit,
rather than our previous country specific approach.
Outlook
As previously signalled, we expect the pressure of current market dynamics to continue, particularly in the traditional
custom software development areas of our business. However, our investment in building a differentiated position in
both New Zealand and Australia is gaining traction, particularly as we pivot towards more high value consultancy
services. We now have an exciting and strong base to build on over the next few years.
Our focus for the coming year remains consistent, as we continue our focus on improving profitability, balancing this
carefully with enabling further investment in our growth segments. Key areas include:
• Continuing to build and refine our differentiated market position through unique intellectual property, and
leveraging this in both the Australian and New Zealand markets
• Investing in our sales and marketing capacity and capability
• Optimising our service capacity to match demand, and optimising our internal indirect costs

FRONDE HALF YEAR REPORT 2017
COPYRIGHT © 2017 FRONDE SYSTEMS GROUP LIMITED 4
Governance
It is with great sadness that the board acknowledges the passing of Director and Founder David Irving on 21 September
2017. David will be greatly missed. The board currently has no plans to appoint a new Director.
David Bartlett
Chairman
Anthony Belsham
CEO
FRONDE HALF YEAR REPORT 2017
COPYRIGHT © 2017 FRONDE SYSTEMS GROUP LIMITED 5
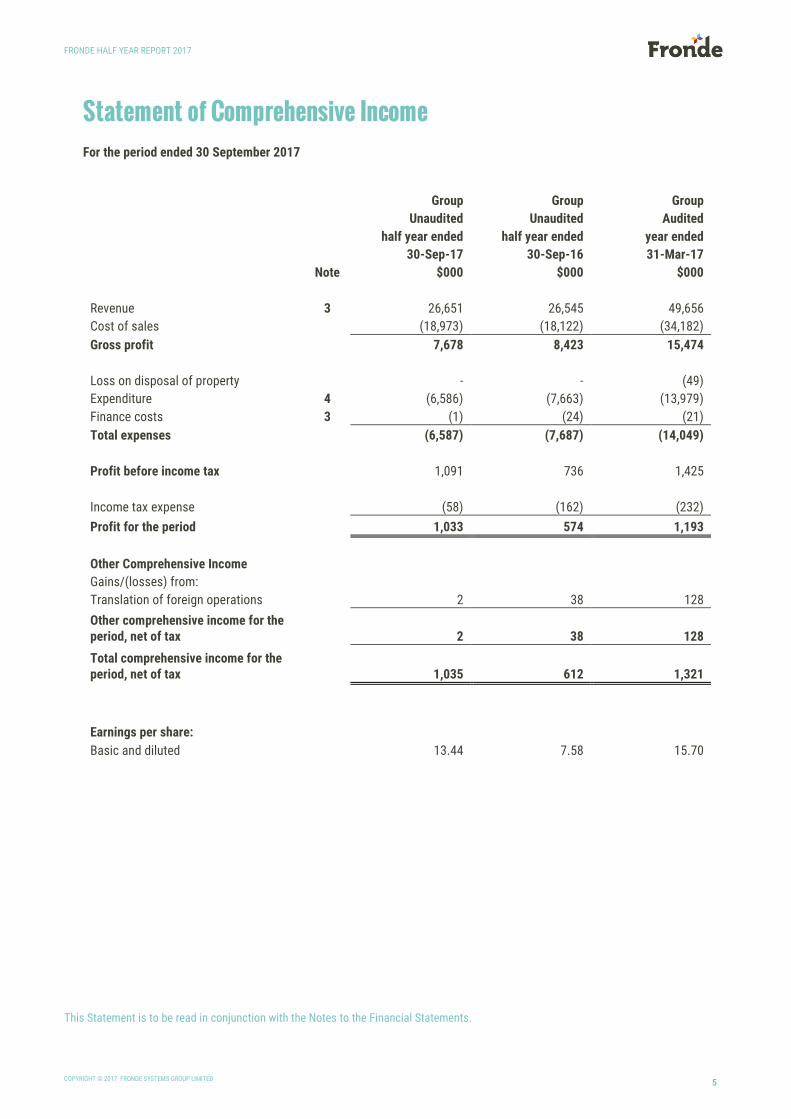
Statement of Comprehensive Income For the period ended 30 September 2017
Group Group Group
Unaudited Unaudited Audited
half year ended half year ended year ended
30-Sep-17 30-Sep-16 31-Mar-17
Note $000 $000 $000
Revenue 3 26,651 26,545 49,656
Cost of sales (18,973) (18,122) (34,182)
Gross profit 7,678 8,423 15,474
Loss on disposal of property - - (49)
Expenditure 4 (6,586) (7,663) (13,979)
Finance costs 3 (1) (24) (21)
Total expenses (6,587) (7,687) (14,049)
Profit before income tax 1,091 736 1,425
Income tax expense (58) (162) (232)
Profit for the period 1,033 574 1,193
Other Comprehensive Income Gains/(losses) from: Translation of foreign operations 2 38 128
Other comprehensive income for the period, net of tax 2 38 128
Total comprehensive income for the period, net of tax 1,035 612 1,321
Earnings per share: Basic and diluted 13.44 7.58 15.70
This Statement is to be read in conjunction with the Notes to the Financial Statements.
FRONDE HALF YEAR REPORT 2017
COPYRIGHT © 2017 FRONDE SYSTEMS GROUP LIMITED 6
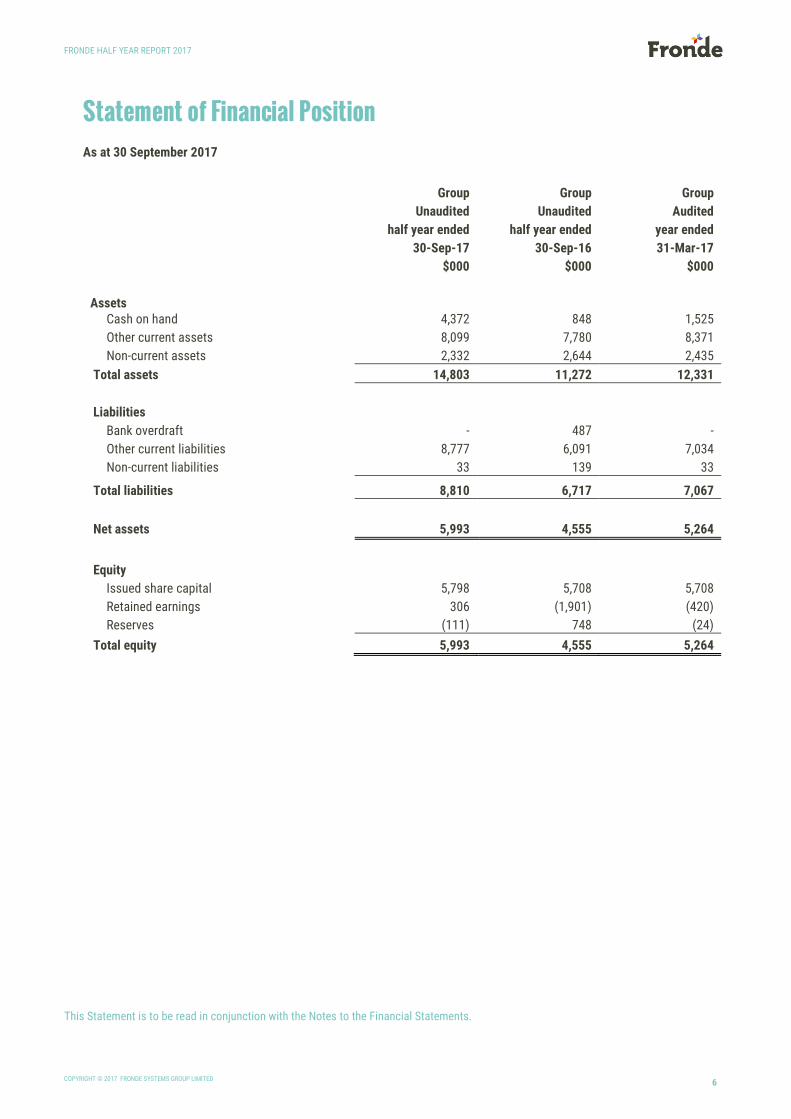
Statement of Financial Position As at 30 September 2017
Group Group Group
Unaudited Unaudited Audited
half year ended half year ended year ended
30-Sep-17 30-Sep-16 31-Mar-17
$000 $000 $000
Assets
Cash on hand 4,372 848 1,525
Other current assets 8,099 7,780 8,371
Non-current assets 2,332 2,644 2,435
Total assets 14,803 11,272 12,331
Liabilities
Bank overdraft - 487 -
Other current liabilities 8,777 6,091 7,034
Non-current liabilities 33 139 33
Total liabilities 8,810 6,717 7,067
Net assets 5,993 4,555 5,264
Equity
Issued share capital 5,798 5,708 5,708
Retained earnings 306 (1,901) (420)
Reserves (111) 748 (24)
Total equity 5,993 4,555 5,264
This Statement is to be read in conjunction with the Notes to the Financial Statements.

FRONDE HALF YEAR REPORT 2017
COPYRIGHT © 2017 FRONDE SYSTEMS GROUP LIMITED 7
Statement of Changes in Equity For the period ended 30 September 2017
Group Group Group
Unaudited Unaudited Audited
half year ended half year ended year ended
30-Sep-17 30-Sep-16 31-Mar-17
$000 $000 $000
Equity at the beginning of the period 5,264 3,575 3,575
Profit on ordinary activities after taxation 1,033 574 1,193 Movement in foreign currency translation reserve 2 38 128
Total comprehensive income for the period, net of tax
1,035 612 1,321
Dividend paid (307) - -
Ordinary shares issued 90 546 546
Provision for issue of ordinary shares (89) (178) (178)
Equity at the end of the period 5,993 4,555 5,264
This Statement is to be read in conjunction with the Notes to the Financial Statements.
FRONDE HALF YEAR REPORT 2017
COPYRIGHT © 2017 FRONDE SYSTEMS GROUP LIMITED 8
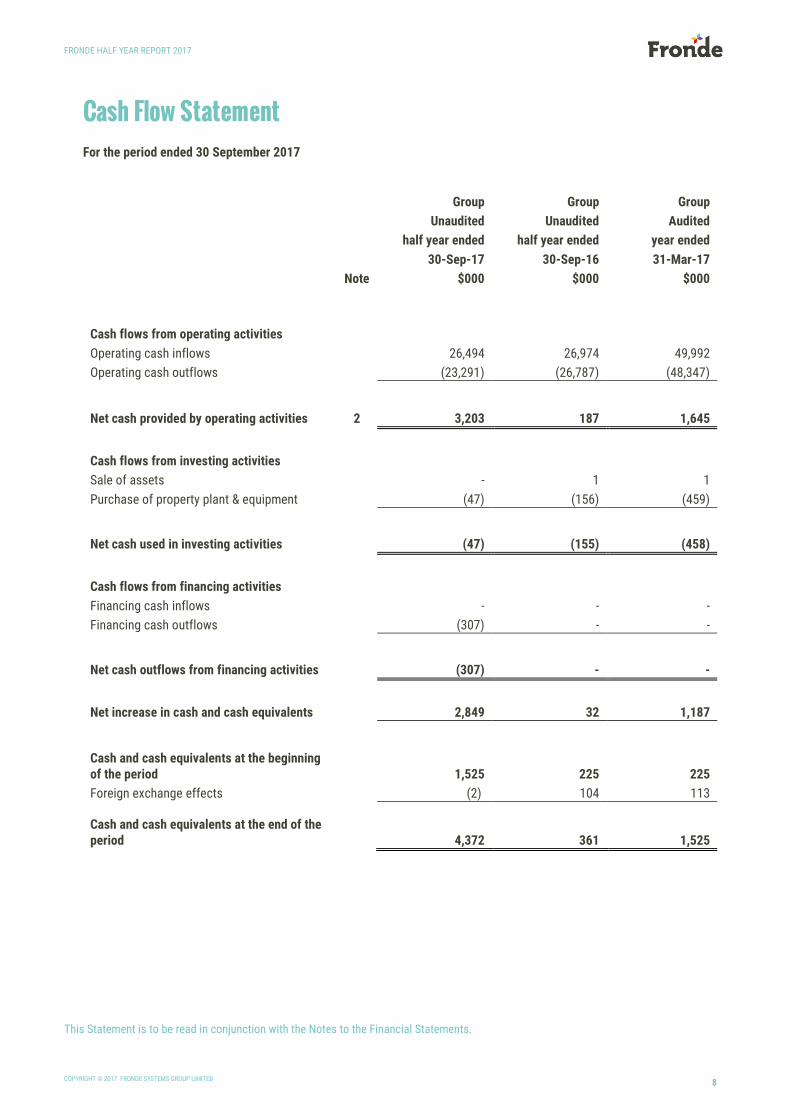
Cash Flow Statement For the period ended 30 September 2017
Group Group Group
Unaudited Unaudited Audited
half year ended half year ended year ended
30-Sep-17 30-Sep-16 31-Mar-17
Note $000 $000 $000
Cash flows from operating activities
Operating cash inflows 26,494 26,974 49,992
Operating cash outflows (23,291) (26,787) (48,347)
Net cash provided by operating activities 2 3,203 187 1,645
Cash flows from investing activities Sale of assets - 1 1
Purchase of property plant & equipment (47) (156) (459)
Net cash used in investing activities (47) (155) (458)
Cash flows from financing activities Financing cash inflows - - -
Financing cash outflows (307) - -
Net cash outflows from financing activities (307) - -
Net increase in cash and cash equivalents 2,849 32 1,187
Cash and cash equivalents at the beginning of the period 1,525 225 225
Foreign exchange effects (2) 104 113
Cash and cash equivalents at the end of the period 4,372 361 1,525
This Statement is to be read in conjunction with the Notes to the Financial Statements.

FRONDE HALF YEAR REPORT 2017
COPYRIGHT © 2017 FRONDE SYSTEMS GROUP LIMITED 9
Notes to the Financial Statements
1. Basis of Preparation
Fronde Systems Group Limited (the ‘Parent’) is registered under the Companies Act 1993 and is an issuer for the
purposes of the Financial Reporting Act 1993.
The Parent and its subsidiaries comprise the Fronde Group (the ‘Group’). The Parent is not an ‘exempt company’ under
the Companies Act 1993.
The Group is a profit-oriented entity and its consolidated financial statements have been prepared in accordance with NZ
IAS 34 ‘Interim Financial Reporting’ and other applicable reporting standards.
The accounting policies and methods of computation used in the preparation of these interim financial statements are
consistent with the accounting policies and methods of computation used in the preparation of the comparative figures.
These interim financial statements should be read in conjunction with the financial statements and related notes
contained in the Group’s audited Annual Report for the year ended 31 March 2017.
2. Reconciliation of profit for the period to net cash flows from operating activities
Group Group Group
Unaudited Unaudited Audited
half year ended half year ended year ended
30-Sep-17 30-Sep-16 31-Mar-17
$000 $000 $000
Profit/(loss) after tax for the period 1,033 574 1,193
Add/(less) non-cash items and non-operating items (Profit)/loss on disposal of non-current assets - (1) 49
Depreciation and amortisation of non-current assets 144 163 331
Share based payment expense - 369 368
Write-off bad debts not recoverable - - 4
Net foreign exchange differences 31 - 18
Increase in current tax balances 50 162 -
Decrease in deferred tax balances - - 236
Changes in net assets and liabilities: Decrease/(increase) in current receivables 259 1,306 764
Decrease/(increase) in other current assets (91) (113) 5
(Decrease)/increase in current payables 1,762 (333) (443)
(Decrease)/increase in other liabilities 15 (1,940) (880)
Net cash inflow from operating activities 3,203 187 1,645

FRONDE HALF YEAR REPORT 2017
COPYRIGHT © 2017 FRONDE SYSTEMS GROUP LIMITED 10
3. Interest
Group Group Group
Unaudited Unaudited Audited
half year ended half year ended year ended
30-Sep-17 30-Sep-16 31-Mar-17
$000 $000 $000
Included in revenue: Interest received 18 2 2
Included in finance costs: Interest paid 1 24 21
4. Unrealised foreign exchange gain / (loss)
Group Group Group
Unaudited Unaudited Audited
half year ended half year ended year ended
30-Sep-17 30-Sep-16 31-Mar-17
$000 $000 $000
Included in Expenditure: Unrealised Foreign Exchange (losses)/gains (31) (47) (21)
5. Segment Reporting
Operating Segments
The Group has determined its operating segments based on the reports reviewed by the Group’s Chief Operating decision
maker to assess performance, allocate resources and make strategic decisions. The reportable segments are based on
aggregating operating segments based on the similarity of the services provided.
The accounting policies of the reportable segments are the same as the Group’s accounting policies described in note 1.
These segment reports have changed from previous years’ reports to more accurately reflect how the business now
reports its Operating Segments internally during the year as one universal business.
The Group’s reportable segments are as follows:
Services
The Services segment represents revenue generated from the provision of consulting services, developing software
solutions and providing managed service support contracts.
Licenses
The Licenses segment represents revenue and commission received from the sale of licenses, including third party
licenses.
Other
The Other segment relates to rent received from sub leasing of office premises.

FRONDE HALF YEAR REPORT 2017
COPYRIGHT © 2017 FRONDE SYSTEMS GROUP LIMITED 11
Group Group Group
Unaudited Unaudited Audited
half year ended half year ended year ended
30-Sep-17 30-Sep-16 31-Mar-17
$000 $000 $000 Operating revenue segments Services 17,652 19,516 34,814 Licenses 8,916 6,914 14,487 Other 65 113 353
Segment revenue 26,633 26,543 49,654
Interest revenue 18 2 2
Total revenue 26,651 26,545 49,656
6. Significant events after reporting date
There are no other events subsequent to balance date requiring disclosure in the financial statements.
