sanlam sens dec 2012 final - investor relations shared documents... · net fund inflows r million...
TRANSCRIPT

SANLAM | ANNUAL RESULTS 2012 | PAGE 1
Sanlam Group
Incorporated in the Republic of South Africa JSE share code (primary listing): SLM Registered name: Sanlam Limited NSX share code: SLA (Registration number 1959/001562/06) ISIN: ZAE000070660 “Sanlam” or “the company”
Audited Results for the year ended 31 December 2012
Contents Overview
Key features Salient results Executive review Comments on the results
Financial statements
Accounting policies and basis of presentation External audit Shareholders’ information
Group Equity Value Shareholders’ fund income statement Notes to the shareholders’ information Embedded value of covered business
Group financial statements Statement of financial position Statement of comprehensive income Statement of changes in equity Cash flow statement Notes to the financial statements
Administration

SANLAM | ANNUAL RESULTS 2012 | PAGE 2
Sanlam Group Results December 2012
Key features
Earnings
• Net result from financial services per share increased by 6%
• Normalised headline earnings per share up 17%
Business volumes
• New business volumes up 18% to R136 billion
• Net value of new covered business up 23% to R1 176 million
• Net new covered business margin of 3,22%, up from 3,05%
• Net fund inflows of R23 billion
Group Equity Value
• Group Equity Value per share of R37,07
• Return on Group Equity Value per share of 22%
Capital management
• Unallocated discretionary capital of R4,2 billion at 31 December 2012
• Sanlam Life Insurance Limited CAR cover of 4,3 times
Dividend
• Normal dividend of 165 cents per share, up 27% • Special dividend of 50 cents per share

SANLAM | ANNUAL RESULTS 2012 | PAGE 3
SALIENT RESULTS
for the year ended 31 December 2012 2012 2011 �
SANLAM GROUP
Earnings
Net result from financial services per share (1) cents 198,9 187,1 6%
Normalised headline earnings per share (2) cents 292,1 248,7 17%
Diluted headline earnings per share cents 286,8 250,1 15%
Net result from financial services (1) R million 4 030 3 779 7%
Normalised headline earnings (2) R million 5 919 5 023 18%
Headline earnings R million 5 763 5 015 15%
Group administration cost ratio (3) % 30,6 29,9
Group operating margin (4) % 19,4 20,3
Business volumes
New business volumes R million 135 903 115 087 18%
Net fund inflows R million 22 989 25 480 -10%
Net new covered business
Value of new covered business R million 1 176 958 23%
Covered business PVNBP (5) R million 36 528 31 449 16%
New covered business margin (6) % 3,22 3,05
Group Equity Value
Group Equity Value R million 75 352 63 521 19%
Group Equity Value per share cents 3 707 3 146 18%
Return on Group Equity Value per share (7) % 22,0 15,7 SANLAM LIFE INSURANCE LIMITED
Shareholders’ fund R million 55 466 45 172
Capital Adequacy Requirements (CAR) R million 7 125 7 350
CAR covered by prudential capital Times 4,3 3,7 Notes (1) Comparative information has been restated as set out in the introduction to comments on the results. (2) Normalised headline earnings = headline earnings, excluding fund transfers. (3) Administration costs as a percentage of income after sales remuneration. (4) Result from financial services as a percentage of income after sales remuneration. (5) PVNBP = present value of new business premiums and is equal to the present value of new recurring premiums
plus single premiums. (6) New covered business margin = value of new covered business as a percentage of PVNBP. (7) Growth in Group Equity Value per share (with dividends paid, capital movements and cost of treasury shares
acquired reversed) as a percentage of Group Equity Value per share at the beginning of the year.

SANLAM | ANNUAL RESULTS 2012 | PAGE 4
EXECUTIVE REVIEW Sanlam’s 2012 financial result is another satisfactory addition to the Group’s performance history and further confirmation of our strategy to generate sustained growth in shareholder value. Sanlam achieved another important milestone in 2012, with the value of new life business net of minorities exceeding R1 billion for the first time, representing growth of 21% per annum since 2003; emphasising again the turnaround from a company that was viewed as ‘mature’ and ‘ex-growth’ by industry commentators at the time.
The 2012 results reflect a resilient performance in an overall challenging environment. Economic growth remained marginal in most of the territories where the Group operates, impacting on consumers’ disposable income. The South African general insurance industry also experienced one of its most difficult underwriting environments in many years. This was partly offset by strong equity and bond markets, which supported fees earned on assets under management.
The Return on Group Equity Value (RoGEV) per share for 2012 came in at 22%, exceeding the target of 12,2% by a comfortable margin. The adjusted RoGEV per share, which excludes the impact of investment markets and tax changes during the period, amounted to 15%, also well in excess of the target. Our primary performance target is to optimise shareholder value through maximising the RoGEV per share. Given the nature of the Group’s diversified business we consider this measure of performance the most appropriate since it incorporates the result of all the major value drivers in the business.
The net result from financial services grew by 6% on a per share basis. Other salient results are:
• New business volumes increased by 18% to R136 billion
• Net value of new covered business up 23%
• Net VNB margin of 3,22% compared to 3,05% in 2011
• Normal dividend per share increased by 27% to 165 cents
• Special dividend per share of 50 cents
2012 strategic initiatives Five strategic pillars underpin the Sanlam Group business model:
• Improving performance through top-line earnings growth;
• Achieve improved operating and cost efficiencies, including quality;
• Improving capital efficiency on an on-going basis;
• Prioritising Sanlam’s international positioning through diversification; and
• Embracing and accelerating transformation of the Group.
Earnings growth
The Sanlam Group delivered healthy earnings growth in 2012 despite the challenging operating environment, which provided support for the Group’s targeted diversification strategy.
Earnings growth was driven by solid contributions mainly from Sanlam Personal Finance (SPF) and Sanlam Emerging Markets (SEM), somewhat offset by a deterioration in the Santam underwriting results.
SPF achieved satisfactory organic growth of 6% in its entry-level market new business sales, middle income new business volumes increased by 16% and the affluent market segment recorded a 21% increase in new business. SEM delivered exceptional growth of 70% in its Rest of Africa operations as a result of its successful partnerships in Africa.
A strong focus on the quality of new business was maintained by providing clients with affordable and appropriate products for their specific needs and as a result persistency levels remain strong across all market segments. The fact that entry-level market persistency levels did not deteriorate

SANLAM | ANNUAL RESULTS 2012 | PAGE 5
from the 2011 levels was quite an achievement given the impact of the industrial action on this segment.
Operating and cost efficiencies
The Sanlam for Sanlam cooperation programme, introduced at the end of 2010 to increase profits through cooperation between businesses, is already making a significant contribution. The Blueprint for Success initiative, launched late in 2012, is aimed at enhancing the Sanlam for Sanlam programme by helping employees embrace the critical enabling factors that will help Sanlam achieve accelerated growth.
In 2012 SPF also completed the implementation of new IT systems at a cost of some R400 million, which will enable the cluster to improve efficiencies and design more innovative and competitive products.
As part of our drive to remain relevant into the future we have to recognise that future generations will engage differently with our products and services. It is imperative that our digital strategy is implemented by the time South Africa’s digital generation is old enough to engage with our offering. For this reason, we have intensified our focus on our digital strategy.
Sanlam Investments has also focused on improving margins through the effective use of technology to improve efficiency and to reduce costs. In addition, the Sanlam Investments website has been enhanced to facilitate a better client experience by providing more regular and easily accessible information to clients.
Capital efficiency
Our liquidity position remained robust in 2012 and all of the Group operations remain well capitalised. We started 2012 with a war chest of around R4 billion, which was bolstered by a strong initiative in 2012 to drive surplus capital out of the various businesses and allocate this money to growth initiatives. A total of R3,3 billion was redeployed during 2012.
The Sanlam Group held discretionary capital of R4,2 billion at the end of December 2012. We have identified a number of opportunities that fit in with our strategic focus of bulking up in the high-growth areas of Africa, India and South-East Asia, while we will also allocate some capital to strengthen our distribution capabilities in South Africa. These initiatives will be pursued during 2013. The Board fully supports the stated strategy not to hold excess capital that is unlikely to be utilised within a reasonable period. It therefore approved the return to shareholders of the approximately R1 billion added to discretionary capital in the second half of 2012 by way of a special dividend of 50 cents per share.
Diversification
Our successful diversification strategy has enabled us to deliver consistent robust business performance in recent years. Over the past ten years Sanlam has evolved from a traditional insurer to a diversified financial services provider with an extensive product offering catering for all market segments. We have also successfully grown our local and international footprint with the aim of further diversifying revenue streams.
Today we have a presence in ten African countries, excluding South Africa, as well as India. In 2012 we also confirmed two acquisitions that will see us expanding our presence in India and venturing into Malaysia in 2013. Furthermore we also have successful operations in the UK, Ireland, Switzerland and Australia.
In 2013 we will focus on extracting more value from our existing partnerships in Africa. We will also finalise our Malaysian acquisition and continue to identify other opportunities in South East Asia, which we believe offers tremendous growth opportunities. In South Africa our focus will be on growing our market share in the Gauteng market as well as in the entry-level market.
The Sanlam business is still predominantly intermediated and as part of our diversification strategy we are looking at alternative methods of distribution, especially in the entry-level market. Our joint ventures with affinity groups such as unions and church groups have proven successful alternative distribution channels and we will continue to expand on this approach.

SANLAM | ANNUAL RESULTS 2012 | PAGE 6
We have also made good progress with MiWay, a direct short-term insurance company owned by Santam. Our future goal is to add traditional Sanlam products to the MiWay online platform.
Transformation
In order to remain a relevant player in a constantly changing environment we need to maintain the agility to transform our business to meet new demands.
In the South African context transformation is traditionally seen as a company’s willingness to adapt the composition of its staff complement and its shareholding to more accurately reflect the demographics of the country. We are committed to achieving this and as a result we have made good progress. In 2011 we had set ourselves the target of increasing our black staff complement to 62% by the end of 2012. Not only did we achieve this, but we also exceeded this target by a small margin. At the end of 2012, 63% of our staff complement was black.
As far back as 1993, Sanlam concluded the country’s first major black economic empowerment transaction with the sale of Metropolitan to a black- owned consortium. In 2004 the Ubuntu-Botho deal resulted in a broad-based black empowerment consortium buying a 10% shareholding in Sanlam in what was to become one of the most far-reaching black empowerment transactions to date. With the gazetting of the Financial Sector Code late in 2012 we now have a clear roadmap on how to build on existing achievements in black economic empowerment to the benefit of all stakeholders.
We also believe our willingness to transform must extend to other areas of our business. We have therefore been transforming our offering to the entry-level market as well as our distribution model for this segment to ensure more people have access to financial services.
As one of the biggest financial services groups in the country, the transformation of the savings and investment landscape of South Africa is an additional priority and we continue working with the Association for Savings and Investment South Africa (ASISA) as well as National Treasury and the Financial Services Board (FSB) to achieve this.
Forward-looking statements In this report we make certain statements that are not historical facts and relate to analyses and other information based on forecasts of future results not yet determinable, relating, amongst others, to new business volumes, investment returns (including exchange rate fluctuations) and actuarial assumptions. These statements may also relate to our future prospects, developments and business strategies. These are forward-looking statements as defined in the United States Private Securities Litigation Reform Act of 1995. Words such as “believe”, “anticipate”, “intend”, “seek”, “will”, “plan”, “co uld”, “may”, “endeavour” and “project” and similar expressions are intended to identify such forward-looking statements, but are not the exclusive means of identifying such statements. Forward-looking statements involve inherent risks and uncertainties and, if one or more of these risks materialise, or should underlying assumptions prove incorrect, actual results may be very different from those anticipated. Forward-looking statements apply only as of the date on which they are made, and Sanlam does not undertake any obligation to update or revise any of them, whether as a result of new information, future events or otherwise.

SANLAM | ANNUAL RESULTS 2012 | PAGE 7
COMMENTS ON THE RESULTS
Introduction The Sanlam Group results for the year ended 31 December 2012 are presented based on and in compliance with International Financial Reporting Standards (IFRS). The basis of presentation and accounting policies for the IFRS financial statements and shareholders’ information are in all material respects consistent with those applied in the 2011 annual report, apart from the following changes to the shareholders’ information and segmental reporting:
• Corporate expenses relating to the SEM cluster that was included in the overall Group adjustment for holding company expenses has been reallocated to the SEM cluster. Comparative information has been restated accordingly (already implemented in the 2012 interim results).
• The establishment and growth of certain niche and specialised Group businesses are materially linked to and dependant on the continued involvement of a few key specialist staff members. To retain and appropriately incentivise these individuals, they are in exceptional cases granted participation schemes through which they effectively share in the value created within these businesses. The cost associated with the equity participation schemes is in substance similar to intangible assets recognised in a business combination and commensurately not part of the Group’s operational performance. The change in fair value of the equity participation schemes is therefore excluded from the net result from financial services and recognised as equity participation cost in the shareholder’s fund income statement. Comparative information has been restated accordingly.
• The Sanlam Investments cluster has been restructured, which affects the presentation of Group Equity Value, the Shareholders’ fund at fair value and the Shareholders’ fund at net asset value. Comparative information has been restated accordingly.
Group Equity Value As at 31 December 2012 the total GEV amounted to R75,4 billion or 3 707 cents per share. Taking into account the dividend of 130 cents per share paid in May 2012, this represents growth of 22,5% and 22,0% respectively on the R63,5 billion and 3 146 cents per share in December 2011, both well above the 2012 performance hurdle of 12,2%.
The Group has a significant exposure to investment markets, both in respect of the shareholder capital portfolio that is invested in financial instruments, as well as a significant portion of the fee income base that is linked to the level of assets under management. The strong investment market performance during 2012 had a marked positive impact on the RoGEV for the period. Excluding the favourable impact of investment returns in excess of the long-term expectations, lower long-term interest rates and certain other once-off effects, an adjusted RoGEV of 15% is still in excess of the return target.

SANLAM | ANNUAL RESULTS 2012 | PAGE 8
Group Equity Value at 31 December 2012
Group Equity Value RoGEV R million 2012 2011 2012 % Group operations 68 166 56 809 14 303 24,9
Sanlam Personal Finance 32 762 28 876 6 862 23,8
Sanlam Emerging Markets (1) 6 105 3 409 669 16,9
Sanlam Investments 16 424 14 909 2 539 16,9
Santam 12 875 9 615 4 233 44,0
Covered business 38 996 34 875 7 908 22,7
Value of in-force 24 050 20 322 6 433 31,7
Net worth 14 946 14 553 1 475 10,1
Other operations 29 170 21 934 6 395 28,2
68 166 56 809 14 303 24,9
Discretionary capital and other (1) 7 186 6 712 7 0,1
Group Equity Value 75 352 63 521 14 310 22,5
Per share (cents) 3 707 3 146 691 22,0 (1) Comparative information has been restated as set out in the introduction to comments on the results.
Group operations of R68 billion yielded an overall return of 24,9% in 2012. The embedded value of covered business (life operations) amounted to R39 billion, accounting for 52% of GEV in December 2012, marginally down from 55% in 2011. The capital allocated to the life operations increased marginally to R15 billion. In aggregate, a balanced after tax investment return of 10,1% was earned on the supporting capital portfolios in 2012. The in-force book of R24,1 billion yielded an exceptional return of 31,7%. Strong VNB growth and continued positive operating experience variances, substantially positive risk experience, supported this sound result. This was partly offset by negative tax changes of R168 million emanating largely from an increase in the effective capital gains tax rate in South Africa.
Other Group operations provided a return of 28,2%, assisted by a substantial contribution from the Group’s investment in Santam. The valuations of the other non-insurance operations were in general positively impacted by a higher level of assets under management, somewhat offset by a higher allowance for cluster level corporate expenses in SEM and Sanlam UK. Santam is valued at its listed share price. The Santam share price substantially outperformed general equity markets in South Africa, which supported the 44% return earned on this investment.
The low return on discretionary and other capital is essentially the combined effect of the investment return earned on surplus capital (substantially invested in low yielding liquid assets), offset by corporate costs and the Secondary Tax on Companies (STC) expense incurred in 2012. Refer to the Capital and solvency section below for information on the movement in discretionary capital during 2012. Earnings Normalised headline earnings of R5,9 billion or 292,1 cents per share are 17% higher than in 2011, largely attributable to a 50% increase in the net investment return earned on the capital portfolio, the result of the strong performance in the South African equity and bond markets in 2012 relative

SANLAM | ANNUAL RESULTS 2012 | PAGE 9
to a weak 2011. This was partly offset by an increase in the amortisation of intangible assets acquired, the mark-to-market of equity participation rights of staff members in selected start-up Group businesses (MiWay and certain SI international initiatives), as well as the final STC charge on the dividend paid in May 2012. This charge will in 2013 be replaced by a dividend withholding tax and will thus not be reflected in the Group’s results.
Shareholders’ fund income statement for the year en ded 31 December 2012
R million 2012 2011 � Net result from financial services 4 030 3 779 7%
Sanlam Personal Finance 2 351 1 990 18%
Sanlam Emerging Markets 428 309 39%
Sanlam Investments 975 945 3%
Corporate and other (129) (124) -4%
3 625 3 120 16%
Santam (1) 405 659 -39%
Net investment return 2 356 1 571 50%
Project costs and amortisation (178) (133) -34%
Equity participation costs (1) (56) (26) -115%
Secondary tax on companies (233) (168) -39%
Normalised headline earnings 5 919 5 023 18%
Per share (cents) 292,1 248,7 17% (1) Comparative information has been restated as set out in the introduction to comments on the results. Net operating profit (net result from financial services), of R4,0 billion, increased by 7%. A strong performance by Sanlam Personal Finance (SPF) and Sanlam Emerging Markets (SEM) was offset by marginal growth reported by Sanlam Investments (SI) and a significant deterioration in the underwriting results experienced by Santam during 2012. Excluding the Santam results, net operating profit increased by a satisfactory 16%.
SPF’s gross result from financial services increased by 18%. The entry-level market recorded gross operating earnings of R375 million, 27% up on 2011. Improved mortality and persistency experience supported individual life profit. Safrican also benefited from lower claims experience. Middle-income market profit increased by 17%, attributable to strong growth in risk profits, 33% growth in Sanlam Personal Loans’ contribution and a lower impact from actuarial basis changes due to the strengthening of the mortality basis in 2011 that was not repeated in 2012. Despite the negative impact of system development expenditure, administration profit increased by 7%, supported by a strong increase in fund fees from the higher average level of assets under management. Glacier also reported satisfactory profit growth of 11%.
SEM recorded a 30% increase in its gross result from financial services. A more than doubling in the Rest of Africa and India contributions was partly offset by lower growth in the more mature Namibia and Botswana markets as expected. The increased holding in Letshego from the second half of 2011 supported the Botswana results. The Nigeria operations managed to break even within two years of its launch, testimony to SEM’s low cost expansion model in Africa.
Sanlam Investments (SI) contributed R1,3 billion to the Group’s gross result from financial services, 7% up on the prior year. The Capital Management business had another good year and recorded growth of 18% on an already high base in 2011. The results include some once-off fees earned on large financing deals concluded during the year. Sanlam Employee Benefits increased its contribution by 9%, the combined effect of lower administration losses, strong earnings from Sanlam Structured Solutions and lower risk profits. The Investment management operations were

SANLAM | ANNUAL RESULTS 2012 | PAGE 10
negatively impacted by the following once-off items, which deflated operating earnings growth to 3%:
• A R55 million reduction from the R78 million in performance fees earned by the South African institutional asset manager in 2011. This is substantially due to Sanlam Investments’ value-based investment philosophy that underperformed relative to the strong overall market performance in 2012.
• The newly acquired Merchant Securities business recorded a loss of R35 million for the year, largely attributable to once-off costs relating to the integration, restructuring and reorganisation of the business.
• Start-up losses of R27 million in newly established distribution channels.
Excluding the South African performance fees as well as the above once-off losses, Investment management gross operating earnings increased by 24%, a very strong performance.
The South African general insurance industry experienced one of its most difficult underwriting environments in many years. Fire and storm related events contributed to an increase in Santam’s claims ratio from 64,2% in 2011 to 68,3% in 2012. The underwriting margin accordingly declined from 8,0% in 2011 to 3,8% in 2012, and Santam’s net result from financial services by 39%.
Business volumes The Group achieved overall growth of 13% in new business volumes (excluding white label), a solid performance in the difficult operating environment of 2012. SPF and SEM recorded strong new business growth with new life business, in particular, achieving growth of 19%. Investment and short-term insurance business increased by 12% and 7% respectively. The strategic focus on the quality of new business written is reflected in good retention levels and a continuance of strong net fund inflows. Net fund inflows achieved of R25 billion is commendable given the loss of a number of investment mandates during the year from clients restructuring their portfolios.
Business volumes for the year ended 31 December 201 2
R million New business Net inflows
2012 2011 � 2012 2011 � Sanlam Personal Finance 32 355 27 246 19% 8 974 5 898 52%
Sanlam Emerging Markets 12 952 10 995 18% 3 977 2 008 98%
Sanlam Investments 62 139 56 062 11% 7 103 11 444 -38%
Santam 15 626 14 653 7% 4 946 5 249 -6% Total (excluding white label) 123 072 108 956 13% 25 000 24 599 2%
Covered business 25 436 21 455 19% 8 532 6 685 28%
Investment business 81 716 72 679 12% 11 460 12 630 -9%
Short-term insurance 15 920 14 822 7% 5 008 5 284 -5% Total (excluding white label) 123 072 108 956 13% 25 000 24 599 2%
SPF’s new business sales increased by 19%, with single premium business the main contributor to the growth. An improvement in the entry-level market segment performance since the first half of

SANLAM | ANNUAL RESULTS 2012 | PAGE 11
2012 was particularly satisfactory. Single premiums previously reported as part of the entry-level market segment essentially comprised of roll-overs of discontinued single premium business in Sanlam Sky. As these relate more to middle-income clients, the business has been reclassified to the middle-income market segment.
New business volumes in the South African entry-level market increased by 6%. Growth was impacted by the closure of the Channel4Life distribution channel as well as the ZCC bi-annual premium adjustment that occurred in 2011 and increased the comparative base. Excluding these two distribution channels, new business sales grew by 12%. New individual life business increased by 13% (15% excluding Channel4Life), offset by a 9% decline in new group life sales (2% increase excluding the ZCC). The agency channel recorded strong growth in individual life business, but this was partly offset by lower broker sales attributable to some instability in the broker channel. Safrican experienced a difficult year after an exceptional 2011, also contributing to the lower group life sales.
SEM recorded 18% growth in its new business sales, with exceptional growth in Rest of Africa.
Namibia achieved 13% growth in new business volumes, a good result from this more mature market. The positive sales trend in the entry-level segment is continuing, with recent product launches in the middle-income and affluent segments also performing well, albeit lower margin business.
Sales trends in Botswana remained largely unchanged from the first half of 2012, with individual life recurring sales continuing to struggle (21% lower than in 2011), offset by a 29% increase in single premiums (largely annuities).
The Rest of Africa operations had a good year and increased new business volumes by 70% on 2011. All countries contributed to the growth.
Shriram General continued its strong growth trajectory and contributed to an overall 24% growth in new Indian business. The life business continues to struggle in the tough regulatory environment with overall new business volumes down 18% on 2011. This is attributable to much lower single premium volumes, somewhat compensated for by 79% growth in recurring premium sales. Single premium sales were negatively impacted by the attractive returns that are currently available on banking products in India.
New business volumes for the SI cluster were up 11% on 2011 (excluding white label). The asset management operations delivered solid growth of 11% in a very competitive environment, complemented by a more than doubling in Sanlam UK’s contribution, partly attributable to new acquisitions. The international investment management operations had a tough year with investor risk aversion not favouring the cluster’s niche operations. Sanlam Employee Benefits (SEB) won a large mandate in 2011 that did not repeat in 2012, contributing to an 18% decrease in its new business volumes. As anticipated, SEB’s VNB and margins declined commensurately from the high base in 2011 (refer below). Net fund flows decreased by 38% from R11 billion in 2011 to R7 billion in 2012. Sanlam Private Investments (SPI) experienced a R2,3 billion once-off outflow of low margin business from a single client, which impacted negatively on SPI and the cluster’s net fund flows. The South African investment management operations also lost a few mandates; this was however substantially due to portfolio restructuring by clients and not related to investment performance. Retail net fund flows remained strong.
Santam grew net earned premiums by 7%, above the industry average for the year.

SANLAM | ANNUAL RESULTS 2012 | PAGE 12
Value of new covered business The value of new life business (VNB) written during 2012 increased by 22% on 2011 to reach R1 278 million. After minorities, VNB increased by 23% to R1 176 million. Both SPF and SEM reported very satisfactory VNB growth, with only the VNB of SI (essentially group business) being down from a high 2011 base. The average margin achieved increased to 3,35%.
The reduction in long-term interest rates and consequently the risk discount rate applied, had a marked effect on the reported VNB and contributed R117 million to the increase on 2011. At a consistent 2011 discount rate VNB increased by 10% in 2012 and the average margin achieved was somewhat lower at 3,12%, essentially due to the reduction in margin in the employee benefits business from a high base in 2011, as expected. All businesses, apart from employee benefits and the Botswana operations, achieved strong VNB growth on the 2011 economic basis as well. Value of new covered business for the year ended 31 December 2012
R million 2012 economic basis 2011 economic basis
2012 2011 � 2012 2011 �
Value of new covered business 1 278 1 051 22% 1 161 1 051 10%
Sanlam Personal Finance 939 705 33% 829 705 18%
Sanlam Emerging Markets 267 223 20% 262 223 17%
Sanlam Investments 72 123 (41%) 70 123 -43%
Net of minorities 1 176 958 23% 1 061 958 11%
Present value of new business premiums 38 129 32 786 16% 37 229 32 786 14%
Sanlam Personal Finance 27 332 23 423 17% 26 634 23 423 14%
Sanlam Emerging Markets 4 537 3 642 25% 4 471 3 642 23%
Sanlam Investments 6 260 5 721 9% 6 124 5 721 7%
Net of minorities 36 528 31 449 16% 35 657 31 449 13%
New covered business margin 3,35% 3,21% 3,12% 3,21%
Sanlam Personal Finance 3,44% 3,01% 3,11% 3,01%
Sanlam Emerging Markets 5,88% 6,12% 5,86% 6,12%
Sanlam Investments 1,15% 2,15% 1,14% 2,15%
Net of minorities 3,22% 3,05% 2,98% 3,05%
Capital and solvency Optimal capital management remains a key strategic priority for the Group, with specific focus on the following:
� Optimising the capital allocated to Group operations, taking account of the applicable regulatory requirements. Continuous attention is given to businesses and individual products attracting suboptimal levels of capital and thus diluting RoGEV. Product design, pricing and new business targets are therefore linked to capital required and the meeting of return hurdles. The Financial Services Board’s implementation of a third country equivalent of the European Solvency II regime in South Africa (Solvency Assessment and Management (SAM)) is a major

SANLAM | ANNUAL RESULTS 2012 | PAGE 13
consideration. Sanlam is an active participant in this process with our own SAM implementation project running according to plan. The FSB conducted its second quantitative impact study in South Africa in 2012, which confirmed the Group’s view that the capital allocated to its life insurance operations is appropriate.
The mix of the Group’s in force life book is changing to less capital intensive products. This resulted in a largely unchanged capital requirement for the life insurance operations at the end of 2012 and a release to discretionary capital of some R1,1 billion from the investment return earned on the allocated capital. In addition, Santam paid a special dividend from its excess capital during 2012 that added R576 million to Sanlam’s discretionary capital.
� Releasing capital from illiquid investments. Some R750 million was released during 2012 through the disposal of illiquid investments, the majority of which comprised of properties.
� Optimal utilisation of discretionary capital. The Group’s preference remains to invest its discretionary capital in value-adding growth opportunities, with specific focus on the identified growth markets. Some R3,3 billion was utilised for this purpose in 2012:
o The acquisition of a 26% interest in Shriram Capital in India. The transaction that utilised some R2,1 billion was announced in the latter half of 2011 and concluded in September 2012.
o The acquisition of a 49% interest in Pacific & Orient (P&O), a short-term insurance operation in Malaysia. Final closing of the transaction is still subject to P&O shareholder approval. Some R780 million has been reserved for this transaction.
o The acquisition of the minority interests in Safrican and Satrix required an investment of R230 million.
o Approximately R100 million was used to expand the international operations of SI, essentially in respect of bolt-on acquisitions and the capitalisation of start-up businesses.
o Some R95 million was utilised to capitalise SEM’s operations in Nigeria and India and to increase its holding in its Kenyan business.
o Expenditure on the acquisition of Sanlam shares was limited to only R26 million.
At the end of December 2011 the Group held discretionary capital of R3,9 billion. Taking into account the movement set out above, as well as the investment income earned by the discretionary capital portfolio and the cash operating profit retained in the 2011 dividend earnings cover, the level of discretionary capital increased to R4,2 billion at the end of 2012. Progress made on potential transactions, the level of capital and its optimal utilisation are continuously evaluated given the suboptimal return earned on discretionary capital, which is largely invested in low yielding liquid assets. A number of potential opportunities are currently being considered which, if successful, should utilise some R3 billion of the available discretionary capital. The Group’s capital management philosophy dictates that any excess capital not likely to be applied within a reasonable timeframe must be returned to shareholders. The Board accordingly decided to distribute to shareholders the R1 billion added to discretionary capital since June 2012 by way of a special dividend of 50 cents per share. This special dividend will be declared and paid as part of the Group’s normal dividend.
All of the life insurance businesses within the Group were sufficiently capitalised at the end of December 2012. The total admissible regulatory capital (including identified discretionary capital) of Sanlam Life Insurance Limited, the holding company of the Group’s major life insurance subsidiaries, of R31 billion covered its capital adequacy requirements (CAR) 4,3 times. No policyholder portfolio had a negative bonus stabilisation reserve at the end of December 2012.

SANLAM | ANNUAL RESULTS 2012 | PAGE 14
FitchRatings has affirmed the credit ratings of the Group early in 2013 and the outlook remained stable. These include Sanlam Limited: National Long-term AA- (zaf); Sanlam Life Insurance Limited: National Insurer Financial Strength: AA+ (zaf), Subordinated debt: A+ (zaf).
Dividend Declarations The Group only declares an annual dividend due to the costs involved in distributing an interim dividend to our large shareholder base. Sustainable growth in dividend payments is an important consideration for the Board in determining the dividend for the year. The Board uses cash operating earnings as a guideline in setting the level of the normal dividend, subject to the Group’s liquidity and solvency requirements. The operational performance of the Group in the 2012 financial year, as well as the effect of abolishing STC, enabled the Board to increase the normal dividend per share by 27% from 130 cents to 165 cents. This will maintain a cash operating earnings cover of approximately 1,1 times. The Board fully supports the stated strategy not to hold excess capital that is unlikely to be utilised within a reasonable period. It therefore approved the return to shareholders of the approximately R1 billion added to discretionary capital in the second half of 2012 by declaring a special dividend of 50 cents per share. Including the special dividend of 50 cents per share, the total dividend, declared and payable to shareholders, amounts to 215 cents per share. The new South African dividend withholding tax regime will apply in respect of the total dividend of 215 cents per share. Shareholders will benefit from the remaining STC credits held by Sanlam in that 1,8 cents of the final dividend of 165 cents will still carry such credits. The final and special dividends will be subject to a 15% withholding tax, which will result in a net final dividend, to those shareholders who are not exempt from paying dividend tax, of 140.52 cents per ordinary share and a net special dividend of 42.5 cents per ordinary share. The number of ordinary shares in issue in the company’s share capital at the date of the declaration is 1,936,081,708 (excluding treasury shares of 163,918,292). The company’s tax reference number is 9536/346/84/5. Shareholders are advised that the total dividend of 215 cents per share for the year ended 31 December 2012 is payable on Monday, 29 April 2013 to ordinary shareholders recorded in the register of Sanlam at the close of business on Friday, 26 April 2013. The last date to trade to qualify for this dividend will be Friday, 19 April 2013, and Sanlam shares will trade ex-dividend from Monday, 22 April 2013. Dividend payment by way of electronic bank transfers will be effected on Monday, 29 April 2013. Share certificates may not be dematerialised or rematerialised between Monday, 22 April 2013 and Friday, 26 April 2013, both days inclusive.
Desmond Smith Johan van Zyl Chairman Group Chief Executive
Sanlam Limited Bellville 6 March 2013

SANLAM | ANNUAL RESULTS 2012 | PAGE 15
Sanlam Group
Financial statements for the year ended 31 December 2012
ACCOUNTING POLICIES AND BASIS OF PRESENTATION
The accounting policies adopted for purposes of the financial statements comply with International Financial Reporting Standards (IFRS), specifically IAS 34 on interim financial reporting, the AC 500 Standards as issued by the Accounting Practices Board or its successor, and with applicable legislation. The condensed financial statements are presented in terms of IAS 34, with additional disclosure where applicable. The policy liabilities and profit entitlement rules are determined in accordance with prevailing legislation, generally accepted actuarial practice and the stipulations contained in the demutualisation proposal. There have been no material changes in the financial soundness valuation basis since 31 December 2011, apart from changes in the economic assumptions.
The basis of presentation and accounting policies for the IFRS financial statements and shareholders’ information are in all material respects consistent with those applied in the 2011 annual report, apart from the changes to the shareholders’ information and segmental reporting indicated above.
The preparation of the Group’s audited annual results was supervised by the financial director, Kobus Möller CA(SA).
The following new or revised IFRSs and interpretati ons are applied in the Group’s 2012 financial year: • Amendments to IFRS 1 – Severe hyperinflation and removal of fixed dates for first-time
adopters (effective 1 July 2011) • Amendment to IFRS 7 – Disclosures – Transfers of Financial Assets (effective 1 July 2011) • Amendment to IAS 12 – Deferred tax: Recovery of underlying assets (effective 1 January
2012) The application of these standards and interpretations did not have a significant impact on the Group’s financial position, reported results and cash flows. The following new or revised IFRSs and interpretations have effective dates applicable to future financial years and have not been early adopted: • Amendment to IFRS 7 – Disclosures relating to offsetting of financial assets and liabilities
(effective 1 January 2013) • Amendment to IAS 32 – Clarification of the instances in which the set off of financial assets and
liabilities is allowed (effective 1 January 2014) • Amendment to IAS 1 – Financial statement presentation (effective 1 July 2012) • Amendment to IFRS 10 – Investment entities exemption (effective 1 January 2014) • IFRS 9 Financial Instruments (effective 1 January 2015) • IFRS 10 Consolidated Financial Statements (effective1 January 2013) • IFRS 11 Joint Arrangements (effective 1 January 2013) • IFRS 12 Disclosure of Interests in Other Entities (effective 1 January 2013) • IFRS 13 Fair Value Measurement (effective 1 January 2013) • IAS 19 Employee Benefits – Amendment regarding removal of corridor method and other
comprehensive income treatment (effective 1 January 2013)

SANLAM | ANNUAL RESULTS 2012 | PAGE 16
• IAS 27 Separate Financial Statements – Consequential amendments resulting from consolidation project (effective 1 January 2013)
• IAS 28 Investments in Associates and Joint Ventures – Consequential amendments resulting from consolidation project (effective 1 January 2013)
• IAS 19 Employee benefits (revised) – removal of corridor approach and changes to concept of expected return on plan assets (effective 1 January 2013)
• May 2012 Improvements to IFRS (mostly effective 1 January 2013) The application of these revised standards and interpretations in future financial reporting periods is not expected to have a significant impact on the Group’s reported results, financial position and cash flows. EXTERNAL AUDIT The Group financial statements have been extracted from the Group’s 2012 audited annual financial statements, which have been audited by Ernst & Young Inc. and their unqualified audit opinion is available for inspection at the company’s registered office. The Shareholders’ information has also been subject to external audit by Ernst & Young Inc. and the unqualified audit opinion is available for inspection at the registered office of Sanlam Limited.

SANLAM | ANNUAL RESULTS 2012 | PAGE 17
Shareholders’ information for the year ended 31 December 2012
Contents Group Equity Value Shareholders’ fund income statement Notes to the shareholders’ information Embedded value of covered business

SANLAM | ANNUAL RESULTS 2012 | PAGE 18
GROUP EQUITY VALUE at 31 December 2012
2012 2011(1) R million R million
Embedded value of covered business 38 996 34 875
Sanlam Personal Finance 30 144 26 687
Adjusted net worth 8 681 8 622
Value of in-force 21 463 18 065
Sanlam Emerging Markets 2 647 2 320
Adjusted net worth 1 145 1 012
Value of in-force 1 502 1 308
Sanlam Investments 6 205 5 868
Adjusted net worth 5 120 4 919
Value of in-force 1 085 949
Other Group operations 29 170 21 934
Sanlam Personal Finance 2 618 2 189
Sanlam Emerging Markets 3 458 1 089
Sanlam Investments 10 219 9 041 Santam
12 875 9 615
Other capital and net worth adjustments 2 986 2 812
71 152 59 621
Discretionary capital 4 200 3 900
Group equity value 75 352 63 521
Group equity value per share (cents) 3 707 3 146 (1) Restated as set out in the introduction to comments on the results.

SANLAM | ANNUAL RESULTS 2012 | PAGE 19
SHAREHOLDERS’ FUND INCOME STATEMENT for the year ended 31 December 2012
2012 2011(1)
R million R million
Result from financial services before tax 6 285 6 050
Sanlam Personal Finance 3 272 2 775
Sanlam Emerging Markets 850 656
Sanlam Investments 1 322 1 230
Santam 1 008 1 560
Corporate and other (167) (171)
Tax on financial services income (1 669) (1 544)
Minority shareholders’ interest (586) (727)
Net result from financial services 4 030 3 779
Net investment return 2 356 1 571
Net investment income 1 127 792
Net investment surpluses 1 171 715
Net equity-accounted headline earnings 58 64
Net project expenses (23) (25)
Equity participation costs (56) (26)
Amortisation of intangibles (155) (108)
Net secondary tax on companies (233) (168)
Normalised headline earnings 5 919 5 023
Profit on disposal of operations 66 186
Impairments (174) (35)
Normalised attributable earnings 5 811 5 174
Fund transfers (156) (8)
Attributable profit per Group statement of comprehe nsive income 5 655 5 166
(1) Restated as set out in the introduction to comments on the results.

SANLAM | ANNUAL RESULTS 2012 | PAGE 20
NOTES TO THE SHAREHOLDERS’ INFORMATION for the year ended 31 December 2012
2012 2011
R million R million
1. NEW BUSINESS
Analysed per licence:
Life Insurance 25 436 21 455
Sanlam Personal Finance 18 351 15 338
Sanlam Emerging Markets 2 922 2 205
Sanlam Investments 4 163 3 912
Investment business and other 97 636 87 501
Sanlam Personal Finance 14 004 11 908
Sanlam Emerging Markets 10 030 8 790
Sanlam Investments 57 976 52 150
Santam 15 626 14 653
New business excluding white label 123 072 108 956
White label 12 831 6 131
Total new business 135 903 115 087
2. NET FLOW OF FUNDS
Analysed per licence:
Life Insurance 8 532 6 685
Sanlam Personal Finance 5 771 4 143
Sanlam Emerging Markets 2 200 1 806
Sanlam Investments 561 736
Investment business and other 16 468 17 914
Sanlam Personal Finance 3 203 1 755
Sanlam Emerging Markets 1 777 202
Sanlam Investments 6 542 10 708
Santam 4 946 5 249
Net inflow excluding white label 25 000 24 599
White label (2 011) 881
Total net flow of funds 22 989 25 480

SANLAM | ANNUAL RESULTS 2012 | PAGE 21
NOTES TO THE SHAREHOLDERS’ INFORMATION (continued)
3. NORMALISED EARNINGS PER SHARE
In terms of IFRS, the policyholders’ fund’s investments in Sanlam shares and Group subsidiaries are not reflected as equity investments in the Sanlam statement of financial position, but deducted in full from equity on consolidation (in respect of Sanlam shares) or reflected at net asset value (in respect of subsidiaries). The valuation of the related policy liabilities however includes the fair value of these shares, resulting in a mismatch between policy liabilities and policyholder investments, with a consequential impact on the Group’s earnings. The number of shares in issue must also be reduced with the treasury shares held by the policyholders’ fund for the calculation of IFRS basic and diluted earnings per share. This is, in management’s view, not a true representation of the earnings attributable to the Group’s shareholders, specifically in instances where the share prices and/or the number of shares held by the policyholders’ fund varies significantly. The Group therefore calculates normalised earnings per share to eliminate the impact of investments in Sanlam shares and Group subsidiaries held by the policyholders’ fund.
2012
cents 2011
cents Normalised diluted earnings per share: Net result from financial services (1) 198,9 187,1 Headline earnings 292,1 248,7 Profit attributable to shareholders’ fund 286,8 256,2 R million R million Analysis of normalised earnings (refer shareholders ’ fund income statement):
Net result from financial services (1) 4 030 3 779 Headline earnings 5 919 5 023 Profit attributable to shareholders’ fund 5 811 5 174 million million Adjusted number of shares: Weighted average number of shares for diluted earnings per share 2 009,4 2 004,9 Add: Weighted average Sanlam shares held by policyholders 16,9 15,0 Adjusted weighted average number of shares for norm alised diluted earnings per share 2 026,3 2 019,9 Number of ordinary shares in issue 2 100,0 2 100,0 Shares held by subsidiaries in shareholders’ fund (150,9) (158,1) Outstanding shares and share options in respect of Sanlam Limited long-term incentive scheme
30,6 36,5
Number of shares under option that would have been issued at fair value - (1,0) Convertible deferred shares held by Ubuntu-Botho 53,0 41,5 Adjusted number of shares for value per share 2 032,7 2 018,9
(1) Restated as set out in the introduction to comments on the results.

SANLAM | ANNUAL RESULTS 2012 | PAGE 22
EMBEDDED VALUE OF COVERED BUSINESS at 31 December 2012 EMBEDDED VALUE OF COVERED BUSINESS at 31 DECEMBER 2 012 2012 2011 Note R million R million
Sanlam Personal Finance 30 144 26 687
Adjusted net worth 8 681 8 622
Net value of in-force covered business 21 463 18 065
Value of in-force covered business 23 168 19 813
Cost of capital (1 705) (1 721)
Minority shareholders’ interest - (27)
Sanlam Emerging Markets 2 647 2 320
Adjusted net worth 1 145 1 012
Net value of in-force covered business 1 502 1 308 Value of in-force covered business 2 534 2 181
Cost of capital (273) (226)
Minority shareholders’ interest (759) (647)
Sanlam UK 904 791
Adjusted net worth 295 250
Net value of in-force covered business 609 541 Value of in-force covered business 664 575
Cost of capital (55) (34)
Minority shareholders’ interest - -
Sanlam Employee Benefits 5 301 5 077
Adjusted net worth 4 825 4 669
Net value of in-force covered business 476 408
Value of in-force covered business 1 374 1 319
Cost of capital (898) (911)
Minority shareholders’ interest - -
Embedded value of covered business 38 996 34 875
Adjusted net worth (1) 14 946 14 553
Net value of in-force covered business 1 24 050 20 322
Embedded value of covered business 38 996 34 875
(1) Excludes subordinated debt funding of Sanlam Life.

SANLAM | ANNUAL RESULTS 2012 | PAGE 23
EMBEDDED VALUE OF COVERED BUSINESS at 31 December 2012 (continued) CHANGE IN EMBEDDED VALUE OF COVERED BUSINESS for th e year ended 31 December 2012
2012 2011
R million
Note Total Net Value of in-force
Adjusted net worth
Total
Embedded value of covered business at the beginning of the year 34 875 20 322 14 553 31 045
Value of new business 2 1 176 2 527 (1 351) 958
Net earnings from existing covered business 3 210 (788) 3 998 3 125
Expected return on value of in-force business 2 560 2 560 - 2 404
Expected transfer of profit to adjusted net worth - (3 134) 3 134 -
Operating experience variances 3 555 (334) 889 681
Operating assumption changes 4 95 120 (25) 40
Expected investment return on adjusted net worth 1 075 - 1 075 1 062
Embedded value earnings from operations 5 461 1 739 3 722 5 145
Economic assumption changes 5 874 969 (95) 132
Tax changes 6 (228) (168) (60) 1 244
Investment variances – value of in-force 1 344 1 159 185 (136)
Investment variances – investment return on adjusted net worth 460 - 460 (259)
Exchange rate movements (3) (3) - 151
Net project expenses 7 - - - (4)
Embedded value earnings from covered business 7 908 3 696 4 212 6 273
Acquired value of in-force 47 32 15 235
Transfer from/(to) other Group operations - - - 34
Net transfers from covered business (3 834) - (3 834) (2 712)
Embedded value of covered business at the end of
the year 38 996 24 050 14 946 34 875
Analysis of earnings from covered business
Sanlam Personal Finance 6 296 3 371 2 925 5 146
Sanlam Emerging Markets 628 189 439 571
Sanlam UK 162 68 94 229
Sanlam Employee Benefits 822 68 754 327
Embedded value earnings from covered business 7 908 3 696 4 212 6 273

SANLAM | ANNUAL RESULTS 2012 | PAGE 24
EMBEDDED VALUE OF COVERED BUSINESS at 31 December 2012 (continued) VALUE OF NEW BUSINESS for the year ended 31 Decembe r 2012
R million Note 2012 2011
Value of new business (at point of sale): Gross value of new business 1 443 1 193 Sanlam Personal Finance 1 003 755 Sanlam Emerging Markets 303 248 Sanlam UK 17 11 Sanlam Employee Benefits 120 179 Cost of capital (165) (142) Sanlam Personal Finance (64) (50) Sanlam Emerging Markets (36) (25)
Sanlam UK (3) (3) Sanlam Employee Benefits (62) (64) Value of new business 1 278 1 051 Sanlam Personal Finance 939 705 Sanlam Emerging Markets 267 223
Sanlam UK 14 8 Sanlam Employee Benefits 58 115 Value of new business attributable to: Shareholders’ fund 2 1 176 958 Sanlam Personal Finance 939 701 Sanlam Emerging Markets 165 134
Sanlam UK 14 8 Sanlam Employee Benefits 58 115 Minority shareholders’ interest 102 93 Sanlam Personal Finance - 4 Sanlam Emerging Markets 102 89
Sanlam UK - - Sanlam Employee Benefits - - Value of new business 1 278 1 051 Geographical analysis: South Africa 997 820 Africa 266 223 Other international 15 8 Value of new business 1 278 1 051 Analysis of new business profitability: Before minorities: Present value of new business premiums 38 129 32 786 Sanlam Personal Finance 27 332 23 423 Sanlam Emerging Markets 4 537 3 642
Sanlam UK 2 210 1 374 Sanlam Employee Benefits 4 050 4 347 New business margin 3,35% 3,21% Sanlam Personal Finance 3,44% 3,01% Sanlam Emerging Markets 5,88% 6,12%
Sanlam UK 0,63% 0,58% Sanlam Employee Benefits 1,43% 2,65%

SANLAM | ANNUAL RESULTS 2012 | PAGE 25
EMBEDDED VALUE OF COVERED BUSINESS at 31 December 2012 (continued) VALUE OF NEW BUSINESS for the year ended 31 Decembe r 2012 (continued)
R million Note 2012 2011 Analysis of new business profitability (continued): After minorities: Present value of new business premiums 36 528 31 449 Sanlam Personal Finance 27 321 23 353 Sanlam Emerging Markets 2 947 2 375
Sanlam UK 2 210 1 374 Sanlam Employee Benefits 4 050 4 347 New business margin 3,22% 3,05% Sanlam Personal Finance 3,44% 3,00% Sanlam Emerging Markets 5,60% 5,64%
Sanlam UK 0,63% 0,58% Sanlam Employee Benefits 1,43% 2,65%

SANLAM | ANNUAL RESULTS 2012 | PAGE 26
NOTES TO THE EMBEDDED VALUE OF COVERED BUSINESS for the year ended 31 December 2012
1. VALUE OF IN-FORCE SENSITIVITY ANALYSIS Gross value of in-force
business R million
Cost of capital
R million
Net value of in-force
business R million
Change from base value
% Base value 26 897 (2 847) 24 050
• Risk discount rate increase by 1% 25 604 (3 546) 22 058 (8)
2. VALUE OF NEW BUSINESS SENSITIVITY
ANALYSIS Gross value
of new business
R million
Cost of capital
R million
Net value of new
business
R million
Change from base value
%
Base value 1 329 (153) 1 176
• Risk discount rate increase by 1% 1 170 (192) 978 (17)
2012 2011
R million R million
3. OPERATING EXPERIENCE VARIANCES
Risk experience 559 431
Persistency 26 187
Working capital and other (30) 63
Total operating experience variances 555 681
4. OPERATING ASSUMPTION CHANGES
Risk experience 66 13
Persistency 52 (147)
Modelling improvements and other (23) 174
Total operating assumption changes 95 40
5. ECONOMIC ASSUMPTION CHANGES
Investment yields and other 876 130
Long-term asset mix assumptions, inflation gap change and other (2) 2
Total economic assumption changes 874 132
6. TAX CHANGES
Tax changes for 2012 are mostly due to the introduction of dividend withholding tax in South Africa and the change in the inclusion rate for capital gains tax.
7. NET PROJECT EXPENSES
Net project expenses relate to once-off expenditure on the Group’s distribution platform that has not been allowed for in the embedded value assumptions.
SANLAM | ANNUAL RESULTS 2012 | PAGE 27
NOTES TO THE EMBEDDED VALUE OF COVERED BUSINESS for the year ended 31 December 2012 (continued) 2012 2011
R million R million
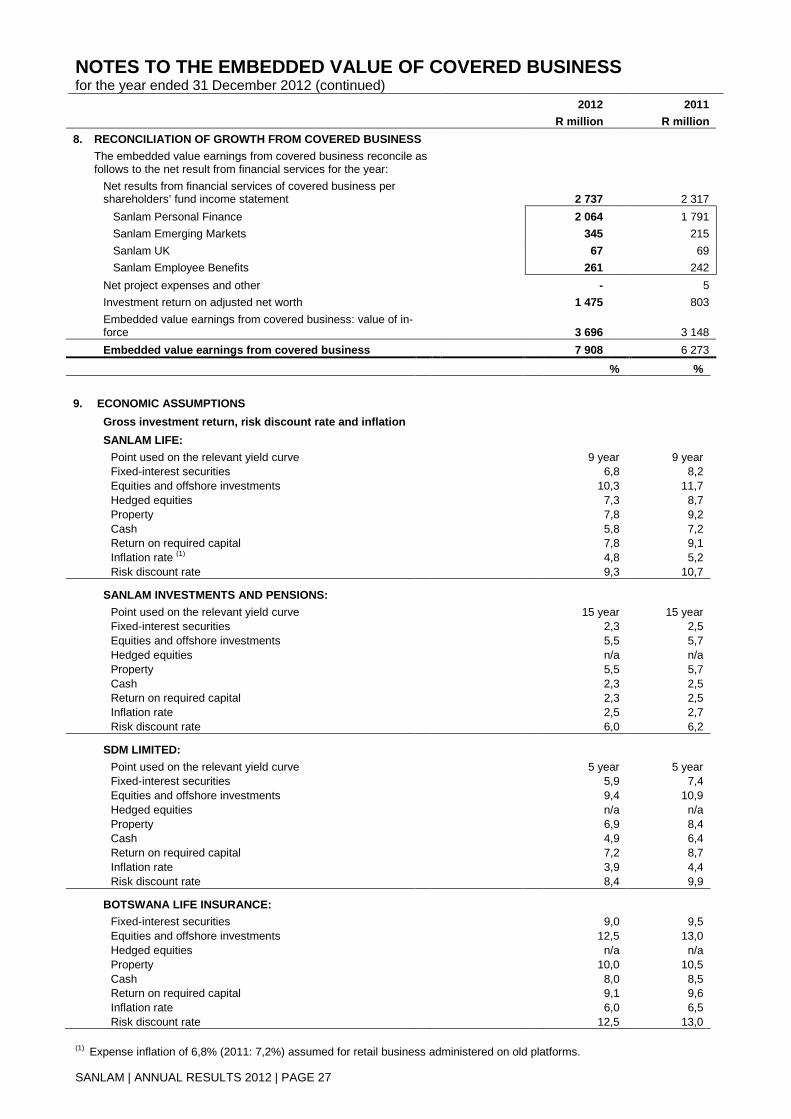
8. RECONCILIATION OF GROWTH FROM COVERED BUSINESS
The embedded value earnings from covered business reconcile as follows to the net result from financial services for the year:
Net results from financial services of covered business per shareholders’ fund income statement 2 737 2 317
Sanlam Personal Finance 2 064 1 791
Sanlam Emerging Markets 345 215
Sanlam UK 67 69
Sanlam Employee Benefits 261 242
Net project expenses and other - 5
Investment return on adjusted net worth 1 475 803
Embedded value earnings from covered business: value of in-force 3 696 3 148
Embedded value earnings from covered business 7 90 8 6 273
% %
9. ECONOMIC ASSUMPTIONS
Gross investment return, risk discount rate and inflation SANLAM LIFE:
Point used on the relevant yield curve 9 year 9 year Fixed-interest securities 6,8 8,2 Equities and offshore investments 10,3 11,7 Hedged equities 7,3 8,7 Property 7,8 9,2 Cash 5,8 7,2 Return on required capital 7,8 9,1 Inflation rate (1) 4,8 5,2 Risk discount rate 9,3 10,7
SANLAM INVESTMENTS AND PENSIONS:
Point used on the relevant yield curve 15 year 15 year Fixed-interest securities 2,3 2,5 Equities and offshore investments 5,5 5,7 Hedged equities n/a n/a Property 5,5 5,7 Cash 2,3 2,5 Return on required capital 2,3 2,5 Inflation rate 2,5 2,7 Risk discount rate 6,0 6,2
SDM LIMITED:
Point used on the relevant yield curve 5 year 5 year Fixed-interest securities 5,9 7,4 Equities and offshore investments 9,4 10,9 Hedged equities n/a n/a Property 6,9 8,4 Cash 4,9 6,4 Return on required capital 7,2 8,7 Inflation rate 3,9 4,4 Risk discount rate 8,4 9,9
BOTSWANA LIFE INSURANCE:
Fixed-interest securities 9,0 9,5 Equities and offshore investments 12,5 13,0 Hedged equities n/a n/a Property 10,0 10,5 Cash 8,0 8,5 Return on required capital 9,1 9,6 Inflation rate 6,0 6,5 Risk discount rate 12,5 13,0
(1) Expense inflation of 6,8% (2011: 7,2%) assumed for retail business administered on old platforms.

SANLAM | ANNUAL RESULTS 2012 | PAGE 28
NOTES TO THE EMBEDDED VALUE OF COVERED BUSINESS for the year ended 31 December 2012 (continued)
2012 2011
% % 9. ECONOMIC ASSUMPTIONS (continued)
Illiquidity premiums Investment returns on non-participating annuities and guarantee plans include assumed illiquidity premiums due to matching assets being held to maturity. Assumed illiquidity premiums generally amount to between 25bps and 50bps (2011: 25bps and 50bps) for non-participating annuities and between 25bps and 110bps (2011: 25bps and 110bps) for guarantee plans.
Asset mix for assets supporting the required capital SANLAM LIFE:
Equities 26 26 Offshore investments 10 10 Hedged equities 13 13 Fixed-interest securities 15 15 Cash 36 36 100 100
SANLAM INVESTMENTS AND PENSIONS:
Cash 100 100 100 100
SDM LIMITED:
Equities 50 50 Cash 50 50 100 100
BOTSWANA LIFE INSURANCE:
Equities 15 15 Property 10 10 Fixed-interest securities 25 25 Cash 50 50 100 100

SANLAM | ANNUAL RESULTS 2012 | PAGE 29
Group financial statements for the year ended 31 December 2012
Contents Statement of financial position Statement of comprehensive income Statement of changes in equity Cash flow statement Notes to the financial statements

SANLAM | ANNUAL RESULTS 2012 | PAGE 30
STATEMENT OF FINANCIAL POSITION at 31 December 2012
2012 2011
R million R million
ASSETS
Property and equipment 449 514
Owner-occupied properties 665 586
Goodwill 3 457 3 195
Other intangible assets 63 47
Value of business acquired 1 599 1 611
Deferred acquisition costs 2 717 2 427
Long-term reinsurance assets 746 674
Investments 384 821 329 150
Properties 17 678 15 310
Equity-accounted investments 5 412 2 938
Equities and similar securities 202 952 165 582
Public sector stocks and loans 64 617 58 831
Debentures, insurance policies, preference shares and other loans 37 726 35 002
Cash, deposits and similar securities 56 436 51 487
Deferred tax 450 640
Non-current assets held for sale 308 1 390
Short-term insurance technical assets 2 096 1 831
Working capital assets 46 193 40 138
Trade and other receivables 31 241 25 761
Cash, deposits and similar securities 14 952 14 377
Total assets 443 564 382 203
EQUITY AND LIABILITIES
Shareholders’ fund 36 919 33 822
Minority shareholders’ interest 2 970 3 046
Total equity 39 889 36 868
Long-term policy liabilities 328 584 282 421
Insurance contracts 148 427 135 742
Investment contracts 180 157 146 679
Term finance 5 463 6 295
Margin business 1 487 2 414
Other interest-bearing liabilities 3 976 3 881
Derivative liabilities 610 212
External investors in consolidated funds 19 596 11 592
Cell owners’ interest 688 603
Deferred tax 1 333 902
Short-term insurance technical provisions 9 877 8 682
Working capital liabilities 37 524 34 628
Trade and other payables 34 823 32 502
Provisions 396 423
Taxation 2 305 1 703
Total equity and liabilities 443 564 382 203

SANLAM | ANNUAL RESULTS 2012 | PAGE 31
STATEMENT OF COMPREHENSIVE INCOME for the year ended 31 December 2012
2012 2011
R million R million
Net income 88 580 54 278
Financial services income 40 416 36 663
Reinsurance premiums paid (4 611) (3 661)
Reinsurance commission received 583 392
Investment income 17 749 14 603
Investment surpluses 37 091 4 843
Finance cost – margin business (185) (203)
Change in fair value of external investors liability (2 463) 1 641
Net insurance and investment contract benefits and claims
(62 566) (31 437)
Long-term insurance contract benefits (27 977) (15 322)
Long-term investment contract benefits (24 690) (7 199)
Short-term insurance claims (12 185) (10 766)
Reinsurance claims received 2 286 1 850
Expenses (15 809) (14 187)
Sales remuneration (5 393) (4 959)
Administration costs (10 416) (9 228)
Impairments (206) (36)
Amortisation of intangibles (184) (128)
Net operating result 9 815 8 490
Equity-accounted earnings 584 421
Finance cost – other (315) (336) Profit before tax 10 084 8 575
Taxation (3 650) (2 510)
Shareholders’ fund (2 468) (1 903)
Policyholders’ fund (1 182) (607) Profit for the year 6 434 6 065
Other comprehensive income
Movement in foreign currency translation reserve 128 541
Comprehensive income for the year 6 562 6 606

SANLAM | ANNUAL RESULTS 2012 | PAGE 32
STATEMENT OF COMPREHENSIVE INCOME for the year ended 31 December 2012 (continued)
2012 2011
R million R million
Allocation of comprehensive income:
Profit for the year 6 434 6 065
Shareholders’ fund 5 655 5 166
Minority shareholders’ interest 779 899
Comprehensive income for the year 6 562 6 606
Shareholders’ fund 5 760 5 601
Minority shareholders’ interest 802 1 005
Earnings attributable to shareholders of the compan y (cents):
Basic earnings per share 293,3 266,9
Diluted earnings per share 281,4 257,7

SANLAM | ANNUAL RESULTS 2012 | PAGE 33
STATEMENT OF CHANGES IN EQUITY for the year ended 31 December 2012
2012 2011 R million R million
Shareholders’ fund:
Balance at beginning of the year 33 822 31 778
Comprehensive income 5 760 5 601
Profit for the year 5 655 5 166 Other comprehensive income: movement in foreign currency translation reserve
105 435
Net acquisition of treasury shares (1) (279) (1 144)
Share-based payments 235 239
Dividends paid (2) (2 556) (2 261)
Acquisitions, disposals and other movements in interests (63) (391)
Balance at end of the year 36 919 33 822
Minority shareholders’ interest: Balance at beginning of the year 3 046 2 608
Comprehensive income 802 1 005
Profit for the year 779 899
Other comprehensive income: movement in foreign currency translation reserve 23 106
Net disposal/(acquisition) of treasury shares(1) 2 (22)
Share-based payments 22 28
Dividends paid (2) (851) (455)
Acquisitions, disposals and other movements in interests (51) (118)
Balance at end of the year 2 970 3 046 Shareholders’ fund 33 822 31 778
Minority shareholders’ interest 3 046 2 608
Total equity at beginning of the year 36 868 34 386
Shareholders’ fund 36 919 33 822
Minority shareholders’ interest 2 970 3 046
Total equity at end of the year 39 889 36 868
(1) Includes movement in cost of shares held by subsidiaries and the share incentive trust.
(2) Dividend of 130 cents per share declared during 2012 (2011: 115 cents per share) in respect of the 2011 financial year.

SANLAM | ANNUAL RESULTS 2012 | PAGE 34
CASH FLOW STATEMENT for the year ended 31 December 2012
2012 2011
R million R million
Net cash flow from operating activities 11 002 18 929
Net cash flow from investment activities (4 134) (12 562)
Net cash flow from financing activities (1 337) (1 674)
Net increase in cash and cash equivalents 5 531 4 693
Cash, deposits and similar securities at beginning of the year 65 857 61 164
Cash, deposits and similar securities at end of the year 71 388 65 857

SANLAM | ANNUAL RESULTS 2012 | PAGE 35
NOTES TO THE FINANCIAL STATEMENTS for the year ended 31 December 2012
2012 2011 cents cents
1. EARNINGS PER SHARE
Basic earnings per share:
Headline earnings 298,9 259,1
Profit attributable to shareholders’ fund 293,3 266,9
Diluted earnings per share:
Headline earnings 286,8 250,1
Profit attributable to shareholders’ fund 281,4 257,7
R million R million
Analysis of earnings:
Profit attributable to shareholders’ fund 5 655 5 166
Less: Net profit on disposal of operations (66) (186)
Plus: Impairment of investments and goodwill 174 35
Headline earnings 5 763 5 015
million million
Number of shares:
Number of ordinary shares in issue at beginning of year 2 100,0 2 100,0 Less: Weighted Sanlam shares held by subsidiaries (including policyholders) (171,9) (164,8) Adjusted weighted average number of shares for basi c earnings per share 1 928,1 1 935,2 Add: Weighted conversion of deferred shares 50,7 34,2 Add: Total number of shares and options 30,6 36,5 Less: Number of shares (under option) that would have been issued at fair value - (1,0) Adjusted weighted average number of shares for dilu ted earnings per share 2 009,4 2 004,9

SANLAM | ANNUAL RESULTS 2012 | PAGE 36
NOTES TO THE FINANCIAL STATEMENTS (continued)
2. SEGMENTAL INFORMATION
2012 2011
R million R million
Segment financial services income (per shareholders’ fund information)
37 247 34 342
Sanlam Personal Finance 11 647 10 935
Sanlam Emerging Markets 2 838 2 279
Sanlam Investments 6 623 5 997
Santam 16 041 15 041
Corporate and other 98 90
IFRS adjustments 3 169 2 321
Total financial services income 40 416 36 663
Segment result (per shareholders’ fund information after tax and minorities)
5 811 5 174
Sanlam Personal Finance 5 420 2 911
Sanlam Emerging Markets 583 420
Sanlam Investments 1 368 1 041
Santam 613 801
Corporate and other (2 173) 1
Reverse minority shareholders’ interest included in segment result
779 899
Fund transfers (156) (8)
Total profit for the year 6 434 6 065
3. SHARE REPURCHASES
The Sanlam shareholders granted general authorities to the Group at the 2012 and 2011 annual general meetings to repurchase Sanlam shares in the market. The Group acquired 807 571 shares at an average price of R31,76 in terms of the general authorities. The total consideration paid of R26 million was funded from existing cash resources. All repurchases were effected through the JSE trading system without any prior understanding or arrangement between the Group and the counter parties. Authority to repurchase 419,2 million shares, or 19,96% of Sanlam’s issued share capital at the time, remain outstanding in terms of the general authority granted at the annual general meeting held on 6 June 2012.
The financial effect of the share repurchases during 2012 on the IFRS earnings and net asset value per share is not material.
4. CONTINGENT LIABILITIES
Shareholders are referred to the contingent liabilities disclosed in the 2011 annual report. The circumstances surrounding the contingent liabilities remain materially unchanged.

SANLAM | ANNUAL RESULTS 2012 | PAGE 37
5. SUBSEQUENT EVENTS
No material facts or circumstances have arisen between the dates of the statement of financial position and this report that affect the financial position of the Sanlam Group at 31 December 2012 as reflected in these financial statements. Subsequent to year end, Sanlam acquired a 3,7% direct interest in Shriram Transport Finance Company, part of the Shriram Capital Group, for some R1 billion.
Administration
Group secretary Sana-Ullah Bray Registered office 2 Strand Road, Bellville 7530, South Africa Telephone +27 (0)21 947-9111 Fax +27 (0)21 947-3670 Postal address PO Box 1, Sanlamhof 7532, South Africa
Registered name: Sanlam Limited (Registration number 1959/001562/06) JSE share code (primary listing): SLM NSX share code: SLA ISIN: ZAE000070660 Incorporated in South Africa Transfer secretaries: Computershare Investor Services (Proprietary) Limited (Registration number 2004/003647/07) 70 Marshall Street, Johannesburg 2001, South Africa PO Box 61051, Marshalltown 2107, South Africa Tel +27 (0)11 373-0000 Fax +27 (0)11 688-5200
www.sanlam.co.za Directors: DK Smith (Chairman), PT Motsepe (Deputy Chairman), J van Zyl (1) (Group Chief Executive), MMM Bakane-Tuoane, AD
Botha, P Buthelezi, FA du Plessis, MV Moosa, JP Möller (1), TI Mvusi (1), SA Nkosi, I Plenderleith (2), P Rademeyer, Y Ramiah (1), RV
Simelane, CG Swanepoel, ZB Swanepoel, PL Zim (1) Executive
(2) British
Bellville 6 March 2013 Sponsor Deutsche Securities (SA) (Proprietary) Limited