from thesis to trading: a trend detection strategystats.lse.ac.uk/kalogeropoulos/ld_1103.pdf ·...
TRANSCRIPT
From thesis to trading: a trend detection strategy
Caio NatividadeVivek AnandDaniel Brehon detection strategy
DB Quantitative Strategy – FX & CommoditiesMarch 2011
Kaifeng ChenGursahib NarulaFlorent RobertYiyi Wang
March 2011
Deutsche Bank AG/London
All prices are those current at the end of the previous trading session unless otherwise indicated. Prices are sourced from local exchanges via Reuters, Bloomberg and other vendors. Data issourced from Deutsche Bank and subject companies. Deutsche Bank does and seeks to do business with companies covered in its research reports. Thus, investors should be aware that the firmmay have a conflict of interest that could affect the objectivity of this report. Investors should consider this report as only a single factor in making their investment decision. Independent, third-partyresearch (IR) on certain companies covered by DBSI's research is available to customers of DBSI in the United States at no cost. Customers can access IR athttp://gm.db.com/IndependentResearch or by calling 1-877-208-6300. DISCLOSURES AND ANALYST CERTIFICATIONS ARE LOCATED IN APPENDIX 1. MICA(P) 106/05/2009

Agenda Introduction______________________________________________________________________________1
The theory _______________________________________________________________________________4
Agenda
Motivation, approach and MSc dissertation
From thesis to trading model _____________________________________________________10 Backtesting, validation, stability and slippageg, , y pp g
Results ___________________________________________________________________________________17 FX valuation and fundamental models
Wh t t ? 21 What next ?_____________________________________________________________________________21 Implementation, marketing, internships
H2 2010 – 1

Introduction (1)Introduction (1) Quantitative strategy is about applying mathematical techniques to understand
and predict financial market dynamicsand predict financial market dynamics.
Less macroeconomics, more statistics. Understanding the patterns in the information. Major focus on speed and dependency, not just direction.j p p y, j
Once we feel comfortable in our understanding, and in the stability of these patterns, we employ them in building systematic trading strategies in spot and derivatives accross different asset classes.
H2 2010 – 2
Introduction (2)Introduction (2) Most of the work is about building and implementing systematic trading models.
The clientelle is divided into 2 constituencies:
Internal: implement models at given proprietary books, supervised by trading deskstrading desks
External: educational roadshows with a variety of the bank's clients
We run an annual internship programme and the models often result from the We run an annual internship programme, and the models often result from the work of our interns.
When the intern is an MSc or PhD student, we try to link the topic with theWhen the intern is an MSc or PhD student, we try to link the topic with the intern's thesis.
Florent Robert: intern since July 2010. Idea: employ innovative techniques to identify regime switches in the data. Eventually settled for techniques that can be implemented in data other than just volatility. The work culminated in a fully-implementable momentum strategy
H2 2010 – 3
implementable momentum strategy.
Agenda Introduction______________________________________________________________________________1
The theory _______________________________________________________________________________4
Agenda
Motivation, approach and MSc dissertation
From thesis to trading model _____________________________________________________10 Backtesting, validation, stability and slippageg, , y pp g
Results ___________________________________________________________________________________17 FX valuation and fundamental models
Wh t t ? 21 What next ?_____________________________________________________________________________21 Implementation, marketing, internships
H2 2010 – 4

The theory (1)The theory (1)Motivation Markovian regime switching 20%
22%
24%
EURUSD Implied Vol
to model
Switches in volatility
C dit d f lt14%
16%
18%
Credit defaults
Bayesian disorder detection to model regime switches in
10%
12%
12-08 07-09 02-10 08-10 03-11gprices
More straightforward, no transition matrix 1.4
1.45
1.5
1.55
transition matrix
Fair assumption: FX prices can be modelled 1.25
1.3
1.35
locally as Brownian motions
1.1
1.15
1.2
01-09 07-09 02-10 08-10 03-11
EURUSD Spot
H2 2010 – 5

The theory (2)The theory (2)Thesis _
p
-
P
where
Detect as quickly as possible a change in the observable system’s behaviour. Time at which the change occurs: _, the change-point.
Here change in the system behaviour = change in the drift: from 0 to at Here change in the system behaviour change in the drift: from 0 to _ at _
_ is the stopping rule, the time of the alarm. We want to minimize the expected miss
Introducing, the a posteriori probability process _ : probability that regime change
H2 2010 – 6
has already occurred by time , given the observations available up to that time

The theory (3)The theory (3)Thesis Approach using Girsanov: from new measure to actual measurepp g
New measure :
_ is a Brownian motion independent from
Larger filtration
Change using
_
Exponential likelihood ratio process Exponential likelihood ratio process
In the newly defined measure , we have exactly the problem that we originally posited
H2 2010 – 7

The theory (4)The theory (4)Thesis Bayes rule:y
More interested in the dynamics of _ . Innovations process
Using Levy theorem, - is a Brownian motion in _
It ’ th Ito’s theorem,
H2 2010 – 8

The theory (5)The theory (5)Thesis
Finding the optimal stopping rule
If you can find such a function , then applying Ito to , you can show that
Finding the optimal stopping rule
Remember that . Is there a stopping ruleRemember that . Is there a stopping rule _ such that
We can achieve this by taking
Showing that _ exists, we get and then
H2 2010 – 9

Agenda Introduction______________________________________________________________________________1
The theory _______________________________________________________________________________4
Agenda
Motivation, approach and MSc dissertation
From thesis to trading model _____________________________________________________10 Backtesting, validation, stability and slippageg, , y pp g
Results ___________________________________________________________________________________17 FX valuation and fundamental models
Wh t t ? 21 What next ?_____________________________________________________________________________21 Implementation, marketing, internships
H2 2010 – 10
From thesis to trading model (1)From thesis to trading model (1)How can it be implemented?
The idea is novel: it employs unusual but powerful techniques to detect switches between 3 market states, a clear improvement from traditional price action models (which focus on 2 market states)
The clearest application is to a momentum strategy: to be long in an up-trend, short in a down-trend, and neutral in a sideways state
In adapting to a trading model a few assumptions must be made: In adapting to a trading model, a few assumptions must be made:
Exchange rate price changes can be locally normally distributed
The structure of the model does not alter much when evaluated in discrete The structure of the model does not alter much when evaluated in discrete time
H2 2010 – 11

From thesis to trading model (2)From thesis to trading model (2)Estimating parameters: a modified validation approach
What needs to be optimised?
The template distributions: first and second moments according to the slope (gradient) of the trend, and the variability around that slope through time. This underpins our assumption of local normality.
The switch mechanism: trend length, and thus the way that a trend switch becomes more likely through time We assume the length of each trendbecomes more likely through time. We assume the length of each trend follows a geometric distribution with an individual parameter. In other words, the likelihood of a trend switch rises with time in non-linear fashion.
H2 2010 – 12

From thesis to trading model (3)From thesis to trading model (3)Estimating parameters: a modified validation approach
H2 2010 – 13
From thesis to trading model (4)From thesis to trading model (4)Validation: a sequence of training vs out-of-sample windows
Backtest, not simulation
Simulation: estimate the future based on today. Popular among pricing models. Forward-looking information (option prices) is used in calibrating the parameters of a process under a pricing measure. These are then applied to simulate the likely paths of the process in the future and thus to calculate the present value of an exotic payoff.p p y
Backtest: evaluate the historical performance. The procedure will fit the required parameters to historical data to identify what best fits the purpose.
Simulation uses forward-looking data to estimate value: likely trajectory, then current price. Backtests use past information to estimate value:
tt t bilit d th t di d i i B kt t l t dpatterns, stability and then trading decisions. Backtests evaluate goodness of fit, a key component of trading strategies based on statistical convergence.In most of our models, we calibrate parameters based on
H2 2010 – 14
backtests.

From thesis to trading model (5)From thesis to trading model (5)Validation: a sequence of training vs out-of-sample windows
Overfitting: dangers of backtesting
In-sample vs out-of-sample treatment
Modified K-fold cross-validation: cut the data into smaller in-sample and out-of-sample windows, and use data to train and test.
Optimise parameters in-sample according to risk-adjusted performance.
Evaluate performance out of sample; in a2
3
4Out-of-sample Sharpe ratios
Out-of-sample = in-sample
Out-of-sample = 1/2 * in-
Evaluate performance out-of-sample; in a good model, the in-sample performance is generally a good predictor of out-of-sample
-2
-1
0
1sample
returns. -0.5 0 0.5 1 1.5 2 2.5 3 3.5In-sample Sharpe ratios
H2 2010 – 15

From thesis to trading model (6)From thesis to trading model (6)Stability and operational risks
K-fold window choice: robustness vs adaptability
Stability: what happens to your equity curve if you bump the data?
Operational reality: what happens to your equity curve if you bump transaction costsequity curve if you bump transaction costs and execution time?
H2 2010 – 16

Agenda Introduction______________________________________________________________________________1
The theory _______________________________________________________________________________4
Agenda
Motivation, approach and MSc dissertation
From thesis to trading model _____________________________________________________10 Backtesting, validation, stability and slippageg, , y pp g
Results ___________________________________________________________________________________17 FX valuation and fundamental models
Wh t t ? 20 What next ?_____________________________________________________________________________20 Implementation, marketing, internships
H2 2010 – 17

Results (1)Results (1)Positive aspects
The results for EUR/USD are positive and linear.
Intra-hour frequencies are noisier, and produce less trends; lower frequencies do better.
I di id l t h t i il t Individual returns are somewhat similar to traditional momentum: low hit ratios (~50%) but high positive-to-negative trade returns ratio.
More linearly consistent returns compared to a standard technical analysis strategy.
Combining individual frequencies gives better Combining individual frequencies gives better returns. The model addresses shorter and longer trends.
Positive and asymmetric correlation to EUR/USD implied volatility.
H2 2010 – 18

Results (2)Results (2)Positive aspects
H2 2010 – 19

Results (3)Results (3)Risks and future work
Are we capturing enough information by fitting a state into 2 parameters?
The model assumes trades can be executed at any time of the day. Is that realistic? What are the implications of execution delay?
Does it really perform better than a simpler MACD strategy?
Is this the best way to implement a i ti it h d l?price action switch model?
H2 2010 – 20
Agenda Introduction______________________________________________________________________________1
The theory _______________________________________________________________________________4
Agenda
Motivation, approach and MSc dissertation
From thesis to trading model _____________________________________________________10 Backtesting, validation, stability and slippageg, , y pp g
Results ___________________________________________________________________________________17 FX valuation and fundamental models
Wh t t ? 21 What next ?_____________________________________________________________________________21 Implementation, marketing, internships
H2 2010 – 21
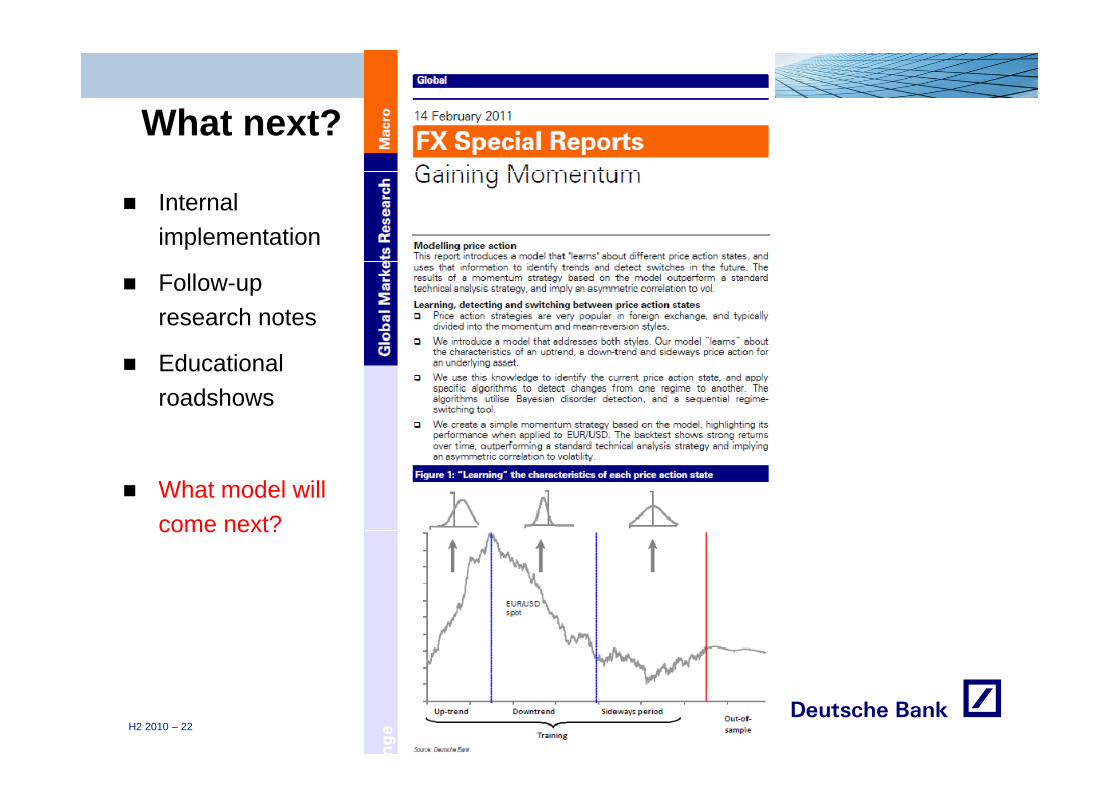
What next?What next?
Internal implementation
Follow-up research notes
Educational roadshowsroadshows
What model will What model will come next?
H2 2010 – 22

Internships in FX & Commodity QuantInternships in FX & Commodity Quant Strategy
Opportunity to join a team ranked as: Opportunity to join a team ranked as:
#1 in FX Quantitative Strategy by the Euromoney Survey (2009, 2010)
#1 in Derivatives Research by the Risk Awards Survey (2011)y y ( )
Top 3 Commodities Research team by Energy Risk (2011)
Opportunity to join a bank ranked as:
#1 in Foreign Exchange by the Euromoney Survey (past 6 years)
#1 in Commodity Derivatives by IFR (2011)
Looking to hire 1-2 interns
Preference for 1-year internships, but flexible duration and flexible start date
L ki f did i h i i d i kill Looking for candidates with strong quantitative and computing skills
H2 2010 – 23
H2 2010 – 24