from screening to compliance strategies: the case of ... · from screening to compliance...
TRANSCRIPT

Islamic Economic Studies
Vol. 25, No. Special Issue, April, 2017 (55-84) DOI: 10.12816/0036186
- 55 -
From Screening to Compliance Strategies: The Case of
Islamic Stock Indices with Application on “MASI”
ALI KAFOU
AHMED CHAKIR Abstract
The aim of this paper is to study the screening methodologies, as practiced by
the mainstream Islamic stock market indices (ISI), through their application
on the Moroccan All Shares Index (MASI). Thus, the possibility of providing
the Casablanca stock exchange with its own Sharī‘ah-compliant stock index
will be studied. First, the specific processing to construct ISI will be explained.
Then, the screening is performed based on the methodological rules set by the
mainstream ISI. The use of screens, as recommended by these indices’
Sharī‘ah committees, leads to different decisions about rejection or
acceptance of stocks in the constructed index. This leads, in turn, to a plurality
of ISI even when created using the same starting investable universe. Finally,
compliance strategies were presented and applied to the MASI.
JEL Classification: G11
KAUJIE Classification: L41
Keywords: Islamic stock indices, screening, compliance strategies, MASI.
Introduction
Though Islamic finance is a relatively new industry, it is growing rapidly and has
become a significant financial sector in many countries (see Ahmed et al., 2015).
Assets in the Islamic finance industry have grown 500% in the last five years,
Corresponding author, Laboratory of Research in Entrepreneurship Finance and Audit, National
School of Trade and Management, Agadir, Morocco; email: [email protected]. Laboratory of Research in Entrepreneurship Finance and Audit, National School of Trade and
Management, Agadir, Morocco.

- 56 - Islamic Economic Studies Vol. 25, No. Special Issue
reaching US$1.3 trillion in 2011 (Ajmi et al., 2014) and expected to reach US$1.8
trillion by 2016 (Walkshäusl and Lobe, 2012). According to IFSB (2014), the Islamic
Financial Services Industry is estimated to chart a compound annual growth rate of
17.04% between 2009 and 2013 with assets expected to surpass US$2 trillion in
2014. This growth is due to development of Gulf countries which continue to
advance rapidly with accumulation of oil wealth (Ho et al., 2013). On the other hand,
relaxing the constraints on interest-based activities by Sharī‘ah scholars led to the
growth of Islamic mutual fund industry (Binmahfouz, 2012). This industry is by far
the fastest-growing segment within the Islamic financial system (Hassan and Girard,
2010). Abul (2014) argued that most of the growth of the Islamic finance industry
originates from non-Muslim countries.
Among the aspects of this growth was the launch of the ISI. Indeed, after Rashid
Hussain Bank Islamic Index (RHBII), the first ISI, was launched in 1996, the
mainstream index providers (e.g., Dow Jones, FTSE, MSCI and S&P) have
expanded their offerings to include Sharī‘ah-compliant indices. A Sharī‘ah-
compliant stock index tracks the performance of listed companies that are deemed
compatible with the Sharī‘ah’s tenets. The Sharī‘ah compliance is set and monitored
by the index’s Sharia committee. It is worth noting the pressing need for a stock
market in Islamic finance industry because of prohibition on interest (Iqbal et
Molyneux, 2005); hence the importance of studying ISI.
The screening process is an essential step in constructing any ISI; it is a process
to move from conventional to ISI. The Islamic screening rules are interpretations of
Sharī‘ah rulings by the Sharī‘ah supervisory committee of the index. The peculiarity
of these interpretations is the fact they transform rules that are qualitative in essence
to quantitative measures that can be used for screening. Thus, diverging views
among the different Sharī‘ah committees is unavoidable. This divergence leads, even
when starting from the same universe (i.e., the conventional index), to different ISI
compositions depending on the screening methodology that is used (see Kafou and
Chakir, 2013 and 2014).
I. Stock Market Indices: a Theoretical Framework
General Background
A stock index tracks changes in the value of a hypothetical stock portfolio (Hull,
2009). Indeed, a stock market index can be viewed as a portfolio comprising all or
part of existing securities on a financial marketplace. This portfolio is representative
of one or more risk factors (Amenc, 2003). A sector index, such as industry, is

A Kafou & A Chakir: The Case of Islamic Stock Indices with Application on “MASI”- 57 -
representative of this sector’s risk. However, a stock index is not equivalent to a
portfolio; the value of a portfolio is expressed in monetary terms. Typically, the value
of the market portfolio (i.e., the market capitalization), can reach amounts of more
than ten digits which is not convenient for market participants. The stock indices, by
cons, are expressed in points that rarely exceed five digits. This is more convenient
and makes comparison, calculation and tracking easier.
The main feature of indices is the fact of not being affected by adding or delisting
of companies. This is not the case for a portfolio whose value changes for each
purchase or sale of constituent stocks. The stability1 and reducing of digits’ number
to handle for an index are achieved using the divisor2.
Equity indices can be classified according to several criteria and the same index
can simultaneously belong to several classes of indices. Thus, we can classify indices
using their geographical scope to local, regional or global indices. A classification
can also be performed based on the economic activities; this will result in sector
indices. The size of the index constituent stocks can also serve as a classification
criterion to distinguish indices of large, medium and small caps. There are also stock
indices for emerging markets and others for developed markets. One can classify the
stock indices according to weighting method into equal weighed, price weighted and
market cap weighted. The last category encompasses indices that consider the market
capitalization of each stock. Thus, the higher are the price and the number of
outstanding shares more the company is represented in the index. The MASI, which
is the starting universe to apply different screens, is a market cap weighted index.
Index Mathematics Methodology
A stock index level at time “t” can be written as follows:
it it
t
t
Q Pindex level
Divisor
(1)
The numerator on the right hand side of (1) is the price multiplied by the number
of each stock in the index. The weight of a stock in the portfolio equals the proportion
of the portfolio invested in the stock (Hull, 2009: p.59). The formula (1) is created
by an adjustment of a LasPeyres index, which uses base period quantities (share
1 Stability here does not mean that a stock index is frozen, but it is only fluctuations of stocks prices in
the index that will impact its level. 2 The divisor is a key concept to understand how stock market indices work. For more details (see S&P
Dow Jones Indices, 2012; Kafou and Chakir, 2013 and 2014).

- 58 - Islamic Economic Studies Vol. 25, No. Special Issue
counts) to calculate the price change (S&P Dow Jones Indices, 2012). The divisor
represents the initial market value and sets the base value for the index3.
Creating a stock market index involves a set of concepts such as floating, the
capped weights and the divisor adjustment. For more details about how to construct
stock indices, see S&P Dow Jones Indices (2012) and Kafou and Chakir (2013 and
2014).
II. Islamic Equity Indices: from the Benchmark to a Sharī‘ah-Compliant Index
Screening is the practice of including or excluding publicly traded securities from
investment portfolios or mutual funds based on the religious and ethical precepts of
the Sharī‘ah (Hassan, 2000). The ISI are constructed from benchmarks (that form
the starting universe) to which are applied financial screens (i.e., quantitative
screens) and activity-based screens (i.e., qualitative screens). The Islamic screening
is monitored by a Sharī‘ah committee that identifies eligible stocks to be part of the
ISI.
Activity-Based Screening
The Islamic investment has first to be in line with the Sharī‘ah rules which forbid
some activities. However, it is worth mentioning that most types of trade are
permitted in Islam, where prohibition is the notable exception (El-Gamal, 2000). The
first step in the screening process is qualitative. Nevertheless, it is necessary to
distinguish between main and secondary activity.
a) The Main Activity
When the screening is done, it is necessary to exclude companies operating in the
following sectors:
Alcohol;
Tobacco;
Pork-related products;
Conventional financial services (e.g., banking, insurance, etc.);
Weapons and defense; and
Entertainment (e.g., hotels4, casinos and gambling, cinema, music, etc.).
3 For the MASI, the base market capitalization is that of 31/12/1991. 4 Except income from hotels operating in Saudi Arabia (see MSCI, 2011).

A Kafou & A Chakir: The Case of Islamic Stock Indices with Application on “MASI”- 59 -
And all activities considered illegal by Sharī‘ah rulings. The ISI use
nomenclatures with the codes of different sectors to rank companies and decide their
compliance with Sharī‘ah (see El Khamlichi, 2012).
b) The Secondary Activity
Companies in sectors considered unlawful by the Islam are unanimously
considered ḥarām regarding the sale and buy of their shares. However, if a company
has exceptional income from ḥarām activities including the investment of cash
excess in interest bearing instruments, opinions are divergent. Some Sharī‘ah
scholars consider investment in these companies’ shares as ḥarām, while others
issued a legal opinion (i.e., fatwa) that allows this investment under two conditions:
Interest income and income from non-compliant activities must be less than
5 %5 of the total income; and
To purify dividend.
1) The Ratio-Based Screening
The ratio-based screening considers the financial structure of the issuing
companies. Therefore, a series of ratios has been established. In this section, we will
mainly focus on the ratios used by the mainstream ISI including: Dow Jones Islamic
(DJIMI), S&P Sharī‘ah, Islamic MSCI, FTSE Sharī‘ah and Islamic STOXX.
a) Debt Level
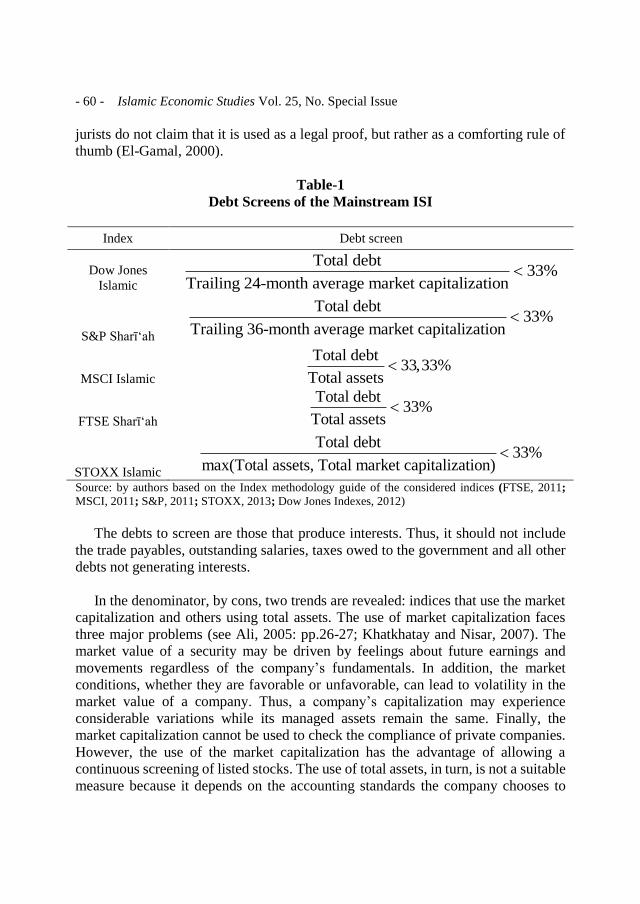
Table 1 resumes the ratios used by the mainstream ISI to screen the Indebtedness
of a company.
One can notice that, as numerator, all committees use total debt. Besides, the
threshold is almost the same for the five indices. The 33% threshold is not fixed
either by the Qur’ān or the Sunna, but set by the Muslim jurists. The 33% limit is a
questionable extension of the threshold from which shareholders have a veto at the
general meetings (Cekici, 2009), or of the Hadith: “One-third, and the one-third is
too much” (Binmahfouz, 2012: p. 89; El-Gamal, 2000; Obaidullah, 2005). Critics of
the one-third rule assert that it involves an out-of-context use of the above ḥadīth
(Obaidullah, 2005). Indeed, this is clearly an out-of-context use of the ḥadīth, and
5 Note that for the S&P and Dow Jones, any involvement in sectors that are excluded when screening
the main business results in screening out from these two indices.
- 60 - Islamic Economic Studies Vol. 25, No. Special Issue
jurists do not claim that it is used as a legal proof, but rather as a comforting rule of
thumb (El-Gamal, 2000).
Table-1
Debt Screens of the Mainstream ISI
Index Debt screen
Dow Jones
Islamic
Total debt33%
Trailing 24-month average market capitalization
S&P Sharī‘ah
Total debt33%
Trailing 36-month average market capitalization
MSCI Islamic
Total debt33,33%
Total assets
FTSE Sharī‘ah
Total debt33%
Total assets
STOXX Islamic
Total debt33%
max(Total assets, Total market capitalization)
Source: by authors based on the Index methodology guide of the considered indices (FTSE, 2011;
MSCI, 2011; S&P, 2011; STOXX, 2013; Dow Jones Indexes, 2012)
The debts to screen are those that produce interests. Thus, it should not include
the trade payables, outstanding salaries, taxes owed to the government and all other
debts not generating interests.
In the denominator, by cons, two trends are revealed: indices that use the market
capitalization and others using total assets. The use of market capitalization faces
three major problems (see Ali, 2005: pp.26-27; Khatkhatay and Nisar, 2007). The
market value of a security may be driven by feelings about future earnings and
movements regardless of the company’s fundamentals. In addition, the market
conditions, whether they are favorable or unfavorable, can lead to volatility in the
market value of a company. Thus, a company’s capitalization may experience
considerable variations while its managed assets remain the same. Finally, the
market capitalization cannot be used to check the compliance of private companies.
However, the use of the market capitalization has the advantage of allowing a
continuous screening of listed stocks. The use of total assets, in turn, is not a suitable
measure because it depends on the accounting standards the company chooses to

A Kafou & A Chakir: The Case of Islamic Stock Indices with Application on “MASI”- 61 -
evaluate its assets. It is worth mentioning that using the higher of either total assets
or market capitalization will broaden the investment universe.
Another approach proposed by Khatkhatay and Nisar (2007) is to use a
denominator based on the objective of the screen. Thus, the use of capitalization to
calculate the liquidity ratio is more suitable given its objective to ensure that liquid
assets are traded at par (i.e., the rule of ṣarf is observed) (Binmahfouz, 2012). For
the debt screen, using total assets is more suitable, since the objective is to control
the company’s main source of financing (Binmahfouz, 2012). However, in the
Moroccan case, the use of total assets is hindered by the frequency of the financial
statements’ publication. These statements are generally published yearly. This will
make the index review (see II.3) also annual which is not practical.
b) Liquidity Screen
Table 2 resumes the ratios used by the mainstream ISI to check the liquidity level of
a company.
Table-2
Liquidity Screens of the Mainstream ISI
Indices Liquidity screen
Dow Jones
Islamic
Cash and interest-bearing securities33%
Trailing 24-month average market capitalization
S&P Sharī‘ah Cash and interest-bearing securities
33%Trailing 36-month average market capitalization
MSCI Islamic Cash and interest-bearing securities
33,33%Total assets
FTSE Sharī‘ah Cash and interest-bearing securities
33%Total assets
STOXX
Islamic
Interest-bearing assets33%
max(Total assets, Total market capitalization)
Source: by authors based on the Index methodology guide of the considered indices
The liquidity screen removes companies with an overwhelming part of assets held
in cash and interest bearing securities. The stock of these companies would have a
quasi-monetary underlying assets and consequently eligible for application of the

- 62 - Islamic Economic Studies Vol. 25, No. Special Issue
ribā prohibition rules (Cekici, 2009). Indeed, negotiating such a company’s stock
equals an exchange of money for money. This exchange is only possible, within the
framework of Islamic finance, hand-to-hand and at par. Otherwise, the transaction
falls under the forbidden ribā.
c) Accounts receivable screen
Table 3 resumes the screens used by the mainstream ISI to control receivables
level of a company.
Table-3
Accounts Receivable Screen of the Mainstream ISI
Indices Receivables screen
Dow Jones
Islamic
Accounts receivable33%
Trailing 24-month average market capitalization
S&P Sharī‘ah
Accounts receivable49%
Trailing 36-month average market capitalization
MSCI Islamic
Accounts receivable33,33%
Total assets
FTSE Sharī‘ah
Accounts receivable cash 50%
Total assets
Source: by authors based on the Index methodology guide of the considered indices
The first observation is that the Sharī‘ah committee of STOXX does not use this
screen. The receivables screen is interpreted as a yardstick for characterizing “core
business” of the company in question. In this regard, if the majority (more than 50
percent) of a company’s assets are financial, rather than real, the main business of
the company is deemed to be financial dealings, and it is thus excluded (El-Gamal,
2006: p.127).
The FTSE Sharī‘ah is the only index using in the numerator, besides receivables,
available liquidity. This divergence in the ratio’s calculation components and the
tolerance threshold is mainly due to the need to consider the operational needs of
companies.
A Kafou & A Chakir: The Case of Islamic Stock Indices with Application on “MASI”- 63 -
2) Periodic Review6
The index composition is reviewed periodically by the managers of the index by
deciding the new companies to include and those to exclude from the index. Thus,
companies must consistently go through the screening. An audit of Sharī‘ah
compliance is performed quarterly in March, June, September and December for the
Dow Jones Islamic Indices, FTSE Sharī‘ah and Islamic STOXX. For the S&P
Sharī‘ah, the review is conducted every month.
3) Criticism Addressed to the Islamic Screening:
a) Financial Viability
One of the criticisms to the screening is to bring down the investors’ universe
which leads to low-performing indices. However, there is no consensus about the
relative performance of ISI. Thus, from the used overall period, Atta (2000), Hakim
and Rashidian (2002), Hussein (2005), Abul et al. (2005), Hussein and Omran
(2005), Hooi and Parsva (2012), Affaneh et al. (2013) and Ho et al. (2013) supported
the thesis of outperformance of ISI compared to their conventional benchmarks.
Nevertheless, Zamri and Haslindar (2002) and Al-Khazali et al. (2013) found that
ISI underperformed conventional ones. On the other hand, Hakim and Rashidian
(2004), Hussein (2004), Albaity and Rubi (2008), Guyot (2008), Girard and Hassan
(2008 and 2010) and Lobe et al. (2012) inferred that no significant difference in
performance exists between ISI and their conventional counterparts.
Another approach used to study the Islamic indices’ performance is reasoning
through market cycles and geographical localization. Thus, Zamri and Haslindar
(2002), Hussein (2004 and 20057), Hussein and Omran (2005) and Girard and
Hassan (2010) found that ISI underperform their conventional counterpart during the
bear market and outperform them during the bull market. The ISI underperforming
conventional ones during the bear market was an agreed characteristic of them.
Authors explained it by the exclusion of liquor companies (Hussein, 2004) and the
event of September 11th (Hussein and Omran, 2005). The subprime crisis was an
inflection point of this belief, the ISI performed better than conventional indices
(Lobe et al., 2012; Ho et al., 2013). Lobe et al. (2012) argued that “Islamic screens
6Note that here we consider the review on the grounds of Sharia compliance. Other events occurring at
different times during the year can raise the need to review an index; such as the delisting of a company,
bankruptcy and companies merge. 7 Note that in this study, during the second bull market period, the ISI underperformed their
conventional benchmarks.

- 64 - Islamic Economic Studies Vol. 25, No. Special Issue
might not affect unconditional performance through the cycle, but might well affect
performance conditional on the cycle. However, it is hard to tell ex ante [...]”. The
outperformance of ISI during the recent financial crisis may be explained by the
exclusion of financial sector, but this performance is not guaranteed for the next
downturn. Adding a geographical dimension to the analysis, Walkshäusl et Lobe
(2012) found that ISI outpaced their conventional counterparts in the developed
market but the inverse is true for emerging markets.
b) Social Responsibility
It is noticeable that screening rules applied by the Sharī‘ah committees do not
include social concerns and are exclusively based on exclusion (i.e., negative
screening). Thus, human rights violations and environmental damage are not
considered in deciding the Sharī‘ah compliance of a company. This raises reasonable
questions like how a company involved in violations of human rights and serious
environmental damage may be conform to Sharī‘ah? Isn’t it contrary to the principles
of Sharī‘ah to disrespect the human rights and cause environmental damage?
(Binmahfouz, 2012). This is surprising because it contradicts the fundamental
principles of Islamic finance and investment as a socio-economic and financial
system that requires the integration of ethics and morals in all economic activities
(Binmahfouz, 2012: p.98).
c) The Lack of Consensus and Stability of Screening Rules
As it can be noticed from tables 1 to 3, each index uses its own screening rules.
The calculation method and the thresholds differ from one index to another. In fact,
the tolerance threshold for receivables ranges between 100% and 33%, while the
debt and liquidity ones are less dispersed. It is worth noting that some Sharī‘ah
committees, such as the Sharī‘ah Advisory Council (SAC) in Malaysia, do not apply
any quantitative screens (see Azhar et al., 2010).
Furthermore, the screening ratios are not the same from one period to another for
the same index. This instability is another criticism to the screening process. For
example, during the subprime crisis, the DJIMI and the S&P Islamic indices
increased the moving average of the market capitalization divisor from trailing 12
months to 24 and 36 respectively (see Binmahfouz, 2012). This was done to further
smooth the ratio. Another example of evolving screening rules is the changing of
denominator from total assets to the market capitalization by DJIMI for the
receivables screen (Binmahfouz, 2012). These changes can render a Sharī‘ah-
compliant stock non-compliant and vice versa while the issuing company’s structure

A Kafou & A Chakir: The Case of Islamic Stock Indices with Application on “MASI”- 65 -
has remained the same. All these elements will create confusion among investors
guided by their faith.
d) An Automated Screening
Screening is usually performed automatically. Thus, based on an industry
classification, the screening excludes automatically companies whose activity code
corresponds to the sectors listed above without any other consideration. This
treatment will automatically exclude an Islamic bank or a Takaful insurance
company because they belong to the category of Banking and Insurance (Siddiqui,
2011). Therefore, many experts propose to conduct screening at the company’s level
not based on the sector (Alqahtani, 2009). In this perspective, Reuters and
IdealRatings launched in 2011 the Research-Based screening indices. Unlike the
automated screening, the Research-Based screening examines the various sources of
non-compliant income rather than a broad sector classification. Moreover, this
screening is based on research of financial data and does not count the Sharī‘ah-
compliant debt such as ṣukūk in calculating the debt screen (Ghoul, 2012).
III.Applying the Screening to the MASI
The MASI is a comprehensive index that includes all stocks listed on the
Casablanca Stock Exchange (BVMC). The MASI was calculated for first time in
1991 and the transition to floating was in December 2004. The MASI consists
currently of 768 companies spread across different industries. The last IPO, at the
time of writing this paper, concerns TOTAL MOROCCO which dated on
29/05/2015.
1) Research Questions and Methodology
a) Research Questions
This work is articulated around two main research questions:
Q1: the ISI of the BVMC, in case of existence, is it unique or depends on the used
screening rules?
8 Note that several changes occurred since the present study as the delisting of FERTIMA, SCE and
SOFAC and an IPO of TAQA MOROCCO. On the other hand, a Public Offer of Withdrawal by CGI
is expected.

- 66 - Islamic Economic Studies Vol. 25, No. Special Issue
The first question will allow confirming an existing result in the Islamic investing
literature, in the Moroccan context, which states that the composition of ISI depends
on the used screening rules. If ISI composition depends on the screening
methodology, it is important to know:
Q2: What are the most important areas of concordances and discrepancies in the
screening process?
This question seeks essentially to identify screens and sectors that have the
highest rate of discrepancies.
b) Methodology
To answer the research questions, we took a sample of 76 companies that
represents all companies listed on the BVMC. Data for these companies (i.e., sector,
summary statements, quotation and market capitalization) are collected from the
BVMC’s website.
The collected data are then combined to consider only information that is
necessary to perform the qualitative screening or to calculate the needed ratios. After
this step, the screens recommended by the Sharī‘ah committees of the mainstream
ISI are applied to get the Islamic version of the MASI.
2) Applying Screens
a) Sector-based Screening
The first step in constructing an ISI is to check whether the main activity of every
company is Sharī‘ah-compliant. Companies excluded because of their main business
are shown in table 4.
b) Quantitative Screening
The share of ḥarām revenues
Details on secondary activities are not available on the BMVC’s website. Thus,
screening based on secondary activity, belonging to the qualitative screening, is not
possible. In this section, we will rather focus on the portion of interest income in the
total turnover. This share must not exceed 5%. The application of this screen on the

A Kafou & A Chakir: The Case of Islamic Stock Indices with Application on “MASI”- 67 -
companies that passed the qualitative screening allowed detecting companies with
interest income exceeding that threshold.
Table-4
The BVMC’s Companies Screened out because of the Activity Sector
Source: by authors
At the end of the sector-based screening stage, 20 companies have been excluded
representing 44.11% of the free float market capitalization.
Table-5
The BVMC’s Companies Screened out because of Impure Income
Source: by authors
Company Sector Nbr. shares Price IWF Free Mar Cap Weight
WAFA ASSURANCE Insurance 3 500 000 2 925,00 0.25 2 559 375 000,00 2.66%
CNIA SAADA Insurance 4 116 874 1 000,00 0.25 1 029 218 500,00 1.07%
ATLANTA Insurance 60 190 436 63.36 0.20 762 733 204,99 0.79%
AGMA LAHLOU-TAZI Insurance 200 000 2 370,00 0.25 118 500 000,00 0.12%
ATTIJARIWAFA BANK Banking 201 243 086 319.50 0.25 16 074 291 494,25 16.69%
BCP Banking 173 141 923 192.00 0.25 8 310 812 304,00 8.63%
BMCE BANK Banking 179 463 390 197.50 0.20 7 088 803 905,00 7.36%
BMCI Banking 13 278 843 770.00 0.20 2 044 941 822,00 2.12%
CIH Banking 26 608 085 231.00 0.20 1 229 293 527,00 1.28%
CDM Banking 9 223 916 579.90 0.15 802 342 333,26 0.83%
BRASSERIES DU MAROC liquor 2 825 201 2 500,00 0.10 706 300 250,00 0.73%
RISMA Hotels 7 882 935 184.95 0.20 291 589 765,65 0.30%
EQDOM Conventional financial services 1 670 250 1 620,00 0.25 676 451 250,00 0.70%
SALAFIN Conventional financial services 2 394 497 560.00 0.25 335 229 580,00 0.35%
MAGHREBAIL Conventional financial services 1 025 320 858.90 0.20 176 129 469,60 0.18%
TASLIF Conventional financial services 21 472 500 36.00 0.15 115 951 500,00 0.12%
MAROC LEASING Conventional financial services 2 776 768 383.05 0.10 106 364 098,24 0.11%
AXA CREDIT Conventional financial services 600 000 328.80 0.15 29 592 000,00 0.03%
SOFAC Conventional financial services 1 416 664 350.00 0.05 24 791 620,00 0.03%
DIAC SALAF Conventional financial services 1 053 404 26.25 0.45 12 443 334,75 0.01%
20 44.11%N br. To ta l e xc lude d we ig ht
Company Interest revenue Total turnover % weight
ALLIANCES 103,784,740.74 266,546,007.10 39% 1.51%
MINIERE TOUISSIT 77,533,253.47 675,756,131.65 11% 0.72%
DELTA HOLDING S.A 4,450,641.35 73,265,400.38 6% 0.68%
ZELLIDJA S.A 4,615,867.76 8,844,601.30 52% 0.02%
Nbr. 4 2.93%Excluded weight :

- 68 - Islamic Economic Studies Vol. 25, No. Special Issue
Debt screening
The debts screening has detected three types of companies:
Companies accepted in the index composition, regardless of used screen
for debts;
Companies excluded, regardless of used screen for debts; and
Companies that may be excluded or accepted according to used screen for
debts.
Existing conflict (i.e., acceptance or rejection) is due to the fact that divisor is not
the same: some screens use the market capitalization whereas others use total assets
or the higher of the two as for STOXX. Thus, the first result of this work is that the
composition of the ISI depends on the used screens. From now, we will only exclude
companies that are screened out, regardless of the used ratio.
Table-6
The BVMC’s Companies Excluded Regardless of Used Debt Screen
Source: by authors
The following table summarizes the results of concordances and discrepancies
between different screens. The green areas show the number of companies being
accepted or rejected jointly by each pair of screens (i.e., consensus). The gray areas
display companies which raise mismatch between each pair of screens. Elements on
the diagonal are the number of companies that passed the debt screen of the index,
divided by the number of companies resulting from the previous step of screening.
Company Market Cap Total Assets T24MAMC T36MAMC Total Debt
Debt
screen
(DJIM)
Debt
screen
(S&P)
Debt screen
(MSCI/FSTE)
Debt
screen
(STOXX)
HO LCIM ( Maroc ) 6,378,150,000 4,648,797,110 6,179,184,966 5,823,926,144 2,243,951,561 0.36 0.39 0.48 0.35
ALUMINIUM DU MARO C 533,051,376 827,253,950 556,194,784 501,085,842 314,873,570 0.57 0.63 0.38 0.38
SNEP 420,600,000 1,179,564,936 404,934,579 396,806,061 450,497,942 1.11 1.14 0.38 0.38
LABEL VIE 3,817,915,500 361,804,730 3,806,776,015 3,807,386,414 1,893,547,141 0.50 0.50 5.23 0.50
STO KVIS NO RD AFRIQ UE 344,818,125 1,056,643,291 361,393,672 340,407,118 438,950,376 1.21 1.29 0.42 0.42
FERTIMA 165,600,000 629,808,368 161,519,112 146,452,789 315,803,318 1.96 2.16 0.50 0.50
DO UJA PRO M ADDO HA 15,781,500,000 34,243,196,450 15,427,137,944 14,471,051,397 11,405,205,935 0.74 0.79 0.33 0.33
SAMIR 3,316,436,636 35,086,143,700 3,470,777,215 3,470,429,087 20,521,711,950 5.91 5.91 0.58 0.58
MED PAPER 58,365,743 628,481,842 58,310,289 53,481,217 355,505,007 6.10 6.65 0.57 0.57
9 12.69%Nbr. Exluded weight:

A Kafou & A Chakir: The Case of Islamic Stock Indices with Application on “MASI”- 69 -
It is noticeable that the debt screen of DJIMI and S&P gives the same results. The
same thing is true for FTSE and MSCI. The greatest divergence, in terms of debt
screening, is recorded between DJIMI (and thus S&P) and FTSE (and thus MSCI).
This is due to the nature of divisor in both cases. Indeed, there is a crossing from the
average market capitalization to total assets. Using the higher of either total assets or
market capitalization may seem like a solution to ensure harmony between different
screening ratios. Thus, the Islamic STOXX would be in line with other ISI. However,
it is worth noting that even for indices using the market capitalization, the divisor
used is not the same. Some indices use the average capitalization over 24 months,
while others use the average over 36 months. Another case is the use of the calculated
market capitalization at the time of screening. The averaging of market capitalization
causes the smoothing of the ratio and thus leads to a greater stability of the index
composition. The STOXX has lower concordance with the indices using market
capitalization than those using total assets9.
Table-7
Results of the Debt Screening
DJIMI S&P FSTE MSCI STOXX
DJIMI 31/52 0 13 13 12
S&P 52 31/52 13 13 12
FSTE 39 39 42/52 0 1
MSCI 39 39 52 42/52 1
STOXX 40 40 51 51 43/52
Source: by authors
The following graph illustrates the concordances and discrepancies by activity
sector. A concordance means that the company is subject to consensus (retention or
rejection from the index), regardless of the used screen. The discrepancy is to
understand in the sense there is a case in which decision on a company (i.e., retention
or rejection) is not the same for a pair of screens.
Given the limited number of companies in the MASI before screening and thus
the limited number of companies by sector, it is difficult to rule definitively on the
sectors leading to divergence in debt screening. Arguably, firms in the
Construction and Building Materials, Consumer Goods, Distributors and
9 Note that 39 out of 52 companies in the screening universe had total assets greater than the market
capitalization.

- 70 - Islamic Economic Studies Vol. 25, No. Special Issue
Technology recorded the highest number of concordance cases. This is because
companies in these sectors have market capitalization that is close to total assets.
Liquidity Screen
For liquidity screen, the three previously met cases were found. The liquidity
screen allows to definitively excluding one company.
Graph-1
Concordances and Discrepancies for Debt Screen by Activity Sectors
Source: by authors
0
1
2
3
4
5
6
7
8
5
7
0
2
6
0
3
2
0
5
3
2
0
1 1
2
1
1
1
2
2
1
0
0
2
2
0
0
1
0 0
0
concordances discrepancies

A Kafou & A Chakir: The Case of Islamic Stock Indices with Application on “MASI”- 71 -
Table-8
The BVMC’s Companies Excluded Regardless of Used Liquidity Screen
* IBS are interest bearing securities Source: by authors
As for the debt screen, table 9 summarizes the concordances and discrepancies
detected when applying the liquidity screen.
Table-9
Results of Applying the Liquidity Screen
DJIMI S&P FSTE MSCI STOXX
DJIMI 39/43 0 3 3 3
S&P 43 39/43 3 3 3
FSTE 40 40 40/43 0 2
MSCI 40 40 43 40/43 2
STOXX 40 40 41 41 42/43
Source: by authors
As for debt screens, besides the DJIMI and S&P, FTSE and MSC give the same
results for liquidity screening. The highest divergence for liquidity screen is recorded
between DJIMI (and thus S&P) and FTSE, MSCI and STOXX on the other hand.
Yet, the number of discrepancies is relatively smaller than the one encountered when
screening debts10. This can be explained by the fact that IBS and cash represent, for
the BVMC’s companies, negligible amounts compared with market capitalization
and total assets. Graph 2 shows the concordances and discrepancies by activity
sectors.
10 Note that although the companies’ number was reduced by debts screening, this is true since the
previous universe was reduced only by companies that are excluded by all screening methodologies.
Thus, it is the number of concordance cases that was reduced.
Company Market Cap Total Assets T24MAMC T36MAMC IBS* cash
M2M Group 140,340,887 174,656,112 133,847,733 135,976,937 59,322,765 29,914,973.87
Liqu idity screen
(DJIM)
Liquidity screen
(S&P)
Liquidity screen
(MSCI/FSTE)
Liquidity screen
(STOXX)Nbr. 1
0.667 0.656 0.511 0.340 Weight 0.04%

- 72 - Islamic Economic Studies Vol. 25, No. Special Issue
Graph-2
Concordances and Discrepancies for Liquidity Screen by Activity Sectors
Source: by authors
It is noted that sectors of Construction and Building Materials, Consumer Goods,
Distributors and Technology continue to record the highest number of concordance
cases.
Receivables Screen
For receivables screen, the three cases met in screening debts and liquidity still
persist. However, receivables screen allowed screening out definitively five
companies.
The first finding is the absence of a pair of screens giving the same result. The
highest discrepancy is recorded between the DJIMI and STOXX; it is of 21 cases.
This difference is due to the absence of receivables screen for STOXX. Even for
indices using this screen, the discrepancy cases are of 14 companies between
DJIMI/S&P in one hand and MSCI on the other hand. This can be explained by
differences in calculation components and tolerance thresholds. In addition,
0
1
2
3
4
5
6
7
6 6
1
34
12
1 1
6
3
1 1 12
0 0
0
0
1
0
01 1
1
0
0 0 0
0
discrepancies concordances

A Kafou & A Chakir: The Case of Islamic Stock Indices with Application on “MASI”- 73 -
screening according to DJIMI and S&P shows some differences even though both
use the average market capitalization. Thus, we can notice that the period over which
the moving average is calculated causes some differences between the two indices.
The longer the duration is, the greater is the smoothing. This smoothing allows
including more companies in the index. The receivables screen is by far the one that
causes discrepancies. Graph 3 shows the concordances and discrepancies by activity
sectors.
Table-10
The BVMC’s Companies Excluded Regardless of Used Receivables Screen
Source: by authors.
As for debt and liquidity screens, table 11 summarizes the results of receivables
screens.
Table-11
Results of Applying Receivables Screen
DJIMI S&P FSTE MSCI STOXX
DJIMI 21/42 4 9 14 21
S&P 38 25/42 9 14 17
FSTE 33 33 28/42 7 14
MSCI 28 28 35 35/42 7
STOXX11 21 25 28 35 42/42 (N/A)
Source: by authors
11 The number of companies accepted in this index is the same as at the end of liquidity screening. The
concordance between STOXX and other indices is nothing but the number of companies included in
these latter. Similarly, the discrepancies are calculated as the companies rejected by a given screening
methodology.
Company Market cap Total Assets T24MAMC T36MAMC Receivables Cash
receivables
screen
(DJIM)
receivables
screen
(S&P)
receivables
screen
(MSCI)
receivables
screen (FSTE)
HPS 206,858,106 275,880,660 202,672,225 194,580,011 124,483,547 16,344,276 0.61 0.64 0.45 0.51
S.M MONETIQUE 151,400,000 168,411,082 150,981,378 141,230,986 97,219,750 4,982,352 0.64 0.69 0.58 0.61
MICRODATA 188,160,000 156,591,923 195,317,425 195,928,719 102,800,225 24,505,794 0.53 0.52 0.66 0.81
INVOLYS 47,839,500 83,050,098 45,872,228 42,464,693 40,090,925 16,581,614 0.87 0.94 0.48 0.68
IB MAROC.COM 45,923,460 334,511,895 46,416,397 47,190,597 228,138,244 701,522 4.92 4.83 0.68 0.68
0.29%Nbr. Excluded weight :5.00
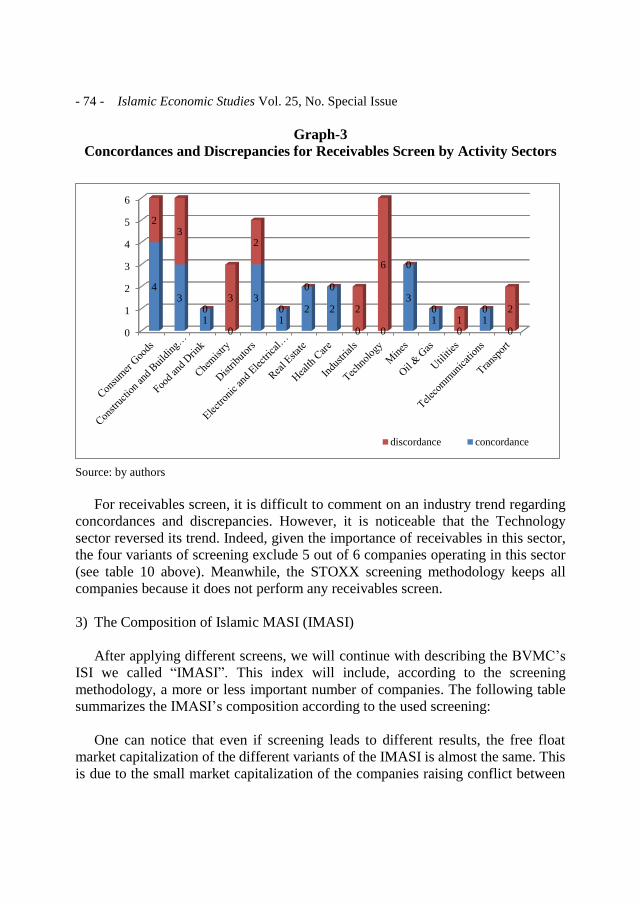
- 74 - Islamic Economic Studies Vol. 25, No. Special Issue
Graph-3
Concordances and Discrepancies for Receivables Screen by Activity Sectors
Source: by authors
For receivables screen, it is difficult to comment on an industry trend regarding
concordances and discrepancies. However, it is noticeable that the Technology
sector reversed its trend. Indeed, given the importance of receivables in this sector,
the four variants of screening exclude 5 out of 6 companies operating in this sector
(see table 10 above). Meanwhile, the STOXX screening methodology keeps all
companies because it does not perform any receivables screen.
3) The Composition of Islamic MASI (IMASI)
After applying different screens, we will continue with describing the BVMC’s
ISI we called “IMASI”. This index will include, according to the screening
methodology, a more or less important number of companies. The following table
summarizes the IMASI’s composition according to the used screening:
One can notice that even if screening leads to different results, the free float
market capitalization of the different variants of the IMASI is almost the same. This
is due to the small market capitalization of the companies raising conflict between
0
1
2
3
4
5
6
43
10
3
12 2
0 0
3
10
10
23
03
2
0
0 0
2
6 0
01
0 2
discordance concordance

A Kafou & A Chakir: The Case of Islamic Stock Indices with Application on “MASI”- 75 -
the different families of indices. For a comprehensive details about the IMASI see
Kafou and Chakir (2013 and 2014).
Table-12
The IMASI’s Composition According to the Screening Methodology
Screens Nbr. of Companies Weight to the MASI’s free
float market cap
DJIMI 21 38,69 %
S&P 25 39.02 %
FSTE 28 39.26 %
MSCI 35 39.70 %
STOXX 42 40.22 % Source: by authors
IV.Compliance Strategies
The compliance strategies are designed to combine the different basic screening
rules. Thus, from these basic rules, we define other strategies that meet specific
objectives. These latter may be related to portfolio management (i.e., performance),
the need to further refine the screening (i.e., to take a conservative approach) or other
objectives pursued by the organization or the investment funds.
1) Mathematical Notation:
Let “S” be the set of basic screening strategies and “G” the set of all financial
screens within these strategies. A basic strategy is defined as a set of guidelines
GGs . For the present study; noting s (a) the screening strategy adopted by the
index “a” we will have:
S={s (DJIMI), s (S&P), s (FSTE), s (MSCI) and s (STOXX)};
G= {GDJIMI, GS&P, GFSTE, GMSCI, GSTOXX};
GDJIMI= {Debt screen DJIMI, Receivables screen DJIMI, liquidities screen
DJIMI}; and
T (DJIMI)={ 33 %, 33 %, 33 %}.
We can see that “G” is nothing more than the combination of tables 1 through 3.
Let’s Gg be a screening rule, we have to calculate a financial ratios )(gri for
- 76 - Islamic Economic Studies Vol. 25, No. Special Issue
each asset “i”. The calculated ratio is then compared with the threshold value T (g).
Thus, we need to control a set of constraints as follows:
)()( gTgri
Thus the weight of each asset in the index (or the portfolio) will be equal to 0 if
IigTgri )()( , with I being the resulting investment universe from the
qualitative screening. Derigs et Marzban (2009) introduced four compliance
strategies; namely Ijmā‘, liberal, majority and “best of”. These strategies will be
discussed in the following sections.
2) The Consensus or Ijmā‘ Strategy
In this strategy, we choose the portfolio that fulfills all requirements of all basic
screening strategies. Thus, a stock is said to be complaint in the sense of ijmā‘
strategy if and only if:
GgIigTgri )()(
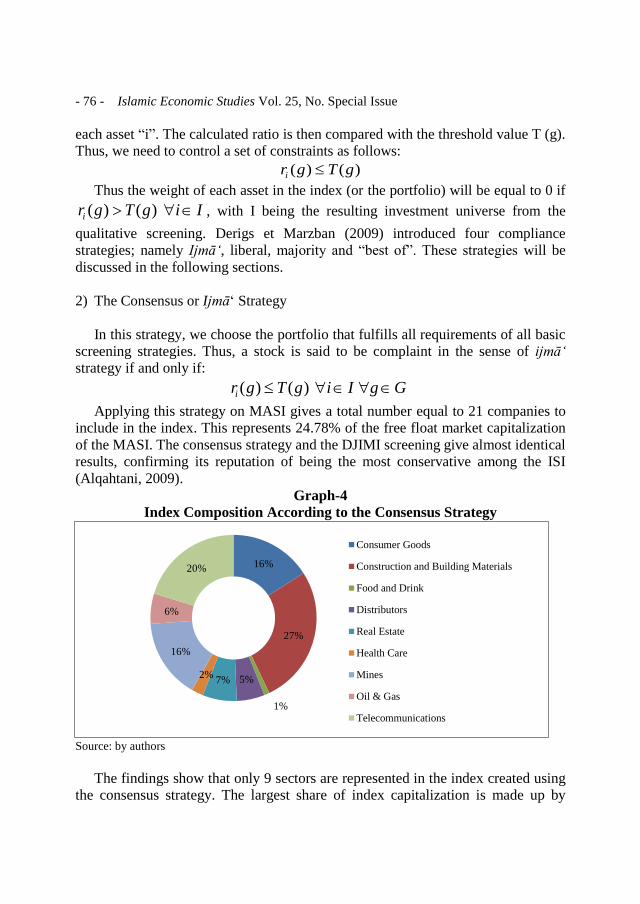
Applying this strategy on MASI gives a total number equal to 21 companies to
include in the index. This represents 24.78% of the free float market capitalization
of the MASI. The consensus strategy and the DJIMI screening give almost identical
results, confirming its reputation of being the most conservative among the ISI
(Alqahtani, 2009).
Graph-4
Index Composition According to the Consensus Strategy
Source: by authors
The findings show that only 9 sectors are represented in the index created using
the consensus strategy. The largest share of index capitalization is made up by
16%
27%
1%
5%7%2%
16%
6%
20%
Consumer Goods
Construction and Building Materials
Food and Drink
Distributors
Real Estate
Health Care
Mines
Oil & Gas
Telecommunications

A Kafou & A Chakir: The Case of Islamic Stock Indices with Application on “MASI”- 77 -
Construction and Building Materials (27%) followed by Telecommunications
(20%).
3) The Liberal Strategy
This strategy consists of reducing the investable universe of assets that are jointly
defined as non-compliant by all basic screening strategies. In this case, compliance
is defined as follows:
)()(:/ gTgrGgsIi is
Thus, “I” will be reduced by companies in tables 6 and 8. This strategy is very useful,
especially when the card(I)12 is too small. In this case, the liberal strategy will allow
including a number for stocks that permits a reasonable diversification.
This strategy, in this study, produces results identical to those got using the
STOXX screens. It allowed including 42 companies representing 40.22% of the free
float market capitalization of the BVMC. The sector allocation using the liberal
strategy is given by the following graph:
Graph-5
Index Composition According to the Liberal Strategy
Source: by authors
12 The cardinal number of a set is the number of distinct elements in this set.
15%
26%
1%1%
5%
0.20%
6%2%
0.20%
2%
14%
5%
1%
20%
0.30%Consumer Goods
Construction and Building Materials
Food and Drink
Chemistry
Distributors
Electronic and Electrical Equipment
Real Estate
Health Care
Industrials
Technology
Mines
Oil & Gas
Utilities
Telecommunications
Transport
- 78 - Islamic Economic Studies Vol. 25, No. Special Issue
We note a greater variety of sectors in the index constructed using the liberal
strategy. The Construction and Building Materials sector continues to grab the
largest share of the capitalization (26%) followed by Telecommunications (20%).
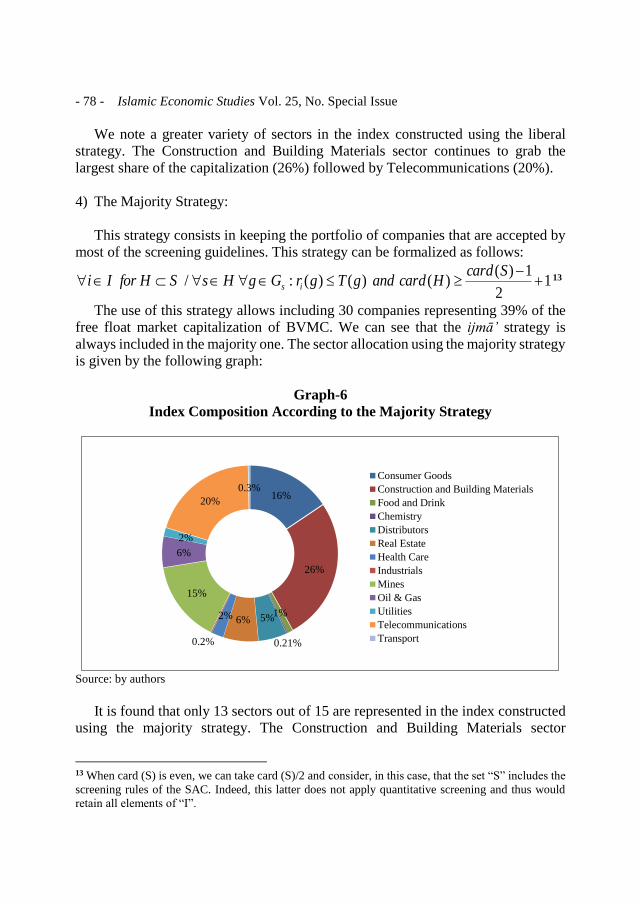
4) The Majority Strategy:
This strategy consists in keeping the portfolio of companies that are accepted by
most of the screening guidelines. This strategy can be formalized as follows:
12
1)()()()(:/
ScardHcardandgTgrGgHsSHforIi is
13
The use of this strategy allows including 30 companies representing 39% of the
free float market capitalization of BVMC. We can see that the ijmā’ strategy is
always included in the majority one. The sector allocation using the majority strategy
is given by the following graph:
Graph-6
Index Composition According to the Majority Strategy
Source: by authors
It is found that only 13 sectors out of 15 are represented in the index constructed
using the majority strategy. The Construction and Building Materials sector
13 When card (S) is even, we can take card (S)/2 and consider, in this case, that the set “S” includes the
screening rules of the SAC. Indeed, this latter does not apply quantitative screening and thus would
retain all elements of “I”.
16%
26%
1%
0.21%
5%6%2%
0.2%
15%
6%
2%
20%
0.3%
Consumer Goods
Construction and Building Materials
Food and Drink
Chemistry
Distributors
Real Estate
Health Care
Industrials
Mines
Oil & Gas
Utilities
Telecommunications
Transport

A Kafou & A Chakir: The Case of Islamic Stock Indices with Application on “MASI”- 79 -
continues to grab the largest share of the total free float market capitalization (26%)
followed by Telecommunications (20%).
5) The “Best of” Strategy:
In the “best of” strategy, we choose the basic screening strategy leading to the
portfolio with the best performance for chosen criteria. This strategy involves a
trade-off between different basic screening strategies.
Conclusion
Morocco is lagging behind his counterparts in the Gulf regarding Islamic finance.
On the eve of Islamic banks’ launch in Morocco under the label “participative
banks”, this paper tries to shed light on another important compartment for financing
the economy, namely the stock market.
Sharī‘ah’s experts have made many compromises to allow the existence of ISI.
The strict application of Sharī‘ah will lead to few compliant companies, making a
reasonable diversification impossible (El-Gamal, 2000). Thus, screening rules have
been set by indices’ Sharī‘ah committees. These rules rely heavily on ijtihād which
explains the divergence in rulings between committees.
In this paper, we focused on the screens used by Sharī‘ah committees of
mainstream ISI, the various criticisms to these screens and the possible ways to
harmonize the practice of screening globally.
The study focused on listed companies on the BVMC. While the activity-based
screening leads to the same results, financial screening produces different results
depending on the used ratio. This situation will lead to a plurality of the ISI even if
constructed from the same starting universe. This plurality can create confusion
among investors who are guided by their faith. In the case of Morocco, where the
financial statements are published yearly, financial ratios based on the market
capitalization are more suitable for screening. Indeed, these ratios will allow a
reasonable review frequency of the IMASI. On the other hand, the limited number
of companies listed on the BVMC will render easy the research-based screening.
The results of this study show that activity-based screening removed a total of 20
companies. This represents almost 44% of the free float market capitalization of the
BVMC. The financial screening, in turn, removed between 13% and 15% of this
floating capitalization and a number of companies ranging from 10 to 31. For
- 80 - Islamic Economic Studies Vol. 25, No. Special Issue
financial screening, the STOXX committee remains the most liberal. Indeed, its
screening methodology allowed to include in the index the highest number of
companies (42 in total), whereas the screens used by Dow Jones allowed only to
include 21 companies in the IMASI. This confirms that the screening of the Dow
Jones Islamic remains the most conservative among the ISI (Alqahtani, 2009). The
averaging of market capitalization causes the smoothing of the ratio and thus leads
to a greater stability of the index composition. This smoothing is important especially
in times of crisis and its effect is proportional to used period to calculate the moving
average.
In this paper, we also discussed the compliance strategies. The first finding is that
liberal strategy and the STOXX screening lead to the same results. The Ijmā‘
strategy, which is underpinned by conservative considerations, is close to screening
methodology of the DJIMI.
Nevertheless, the Islamic screening may be biased: an example is the breach of
the principle of profits and losses sharing because of the existence of preferred stock.
On the other hand, one must distinguish between the Islamic screening and trading
of securities on the stock market. Indeed, a stock can pass the screening process
successfully, but without any insurance that transactions on it are in line with the
Sharī‘ah. In fact, stocks are subject, for example, to short selling that is prohibited
by Sharī‘ah. Hence the need for an Islamic stock market not only ISI.
References
Abul, Hassan, Antoniou, Antonios and Paudyal, Krishna. (2005) ."Impact of Ethical
Screening on Investment Performance : the Case of the Dow Jones Islamic
Index", Islamic Economic Studies, 12(2), pp. 67–97.
Abul, Shamsuddin. (2014) ."Are Dow Jones Islamic equity indices exposed to
interest rate risk?", Economic Modelling. Elsevier B.V., 39, pp. 273–281.
Affaneh, Ibrahim, Albohali, Mohamed and Boldin, Robert J. (2013) ."Islamic
Market Indices : A Comparison with Conventional World Indices Based on the
Adjusted Sharpe Ratio", International Journal of Business, Accounting, and
Finance, 7(1), pp. 87–101.
Ahmed, Habib, Mohieldin, Mahmoud, Verbeek, Jos and Aboulmagd, Farida. (2015)
."On the Sustainable Development Goals and the Role of Islamic Finance". 7266.
Ajmi, Ahdi Noomen, Hammoudeh, Shawkat, Nguyen, Duc Khuong and Sarafrazi,
Soodabeh. (2014) ."How Strong Are the Causal Relationships between Islamic

A Kafou & A Chakir: The Case of Islamic Stock Indices with Application on “MASI”- 81 -
Stock Markets and Conventional Financial Systems? Evidence from Linear and
Nonlinear Tests", Journal of International Financial Markets, Institutions and
Money. Elsevier B.V., 28, pp. 213–227.
Albaity, Mohamed and Rubi, Ahmad. (2008) ."Performance of Syariah and
Composite Indices : Evidence from Bursa Malaysia", Asian Academy of
Management Journal of Accounting and Finance, 4(1), pp. 23–43.
Ali, Salman Syed. (2005) ."Islamic Capital Market Products: Developments and
Challenges". Jeddah: Islamic Research and Training Institute, IDB.
Al-Khazali, Osamah, Lean, Hooi Hooi and Samet, Anis. (2013) ."Do Islamic stock
indexes outperform conventional stock indexes? A stochastic dominance
approach", Pacific-Basin Finance Journal. Elsevier B.V.
Alqahtani, Dhafer Salih. (2009) ."Global Islamic Index Providers: The Wrong
Choice", The Journal of Investing, 18(4), pp. 79–81.
Amenc, Noël. (2003) ."Les confusions entre indice, benchmark, allocation
stratégique et passive", in Séminaire Edhec-Institut Europlace, pp. 1–40.
Atta, Hajara. (2000) ."Ethical rewards An Examination Of The Effect Of Islamic
Ethical Screens On Financial Performance and Of Conditioning Information On
Performance measures". Durham University.
Azhar, Abdul Rahman, Mohd, Yahya Azlan and Mohd, Nasir Mohd Herry. (2010)
."Islamic norms for stock screening: A comparison between the Kuala Lumpur
Stock Exchange Islamic Index and the Dow Jones Islamic Market Index",
International Journal of Islamic and Middle Eastern Finance and Management,
3(3), pp. 228–240.
Binmahfouz, Saeed Salem. (2012) ."Investment characteristics of Islamic
Investment Portfolios: Evidence from Saudi Mutual Funds and Global Indices".
Durham University.
Cekici, Ibrahim. (2009) ."Finance éthique et finance islamique : quelle
convergence ?", in Les Cahiers de la Finance Islamique N° 1. Ecole de
Management de Strasbourg, pp. 11–17.
Derigs, Ulrich and Marzban, Shehab. (2009) ."New strategies and a new paradigm
for Sharī‘ah-compliant portfolio optimization", Journal of Banking and Finance.
Elsevier B.V., 33(6), pp. 1166–1176.
Dow Jones Indexes. (2012) ."Guide to the Dow Jones Islamic Market Indexes".
Available at:
http://www.djindexes.com/mdsidx/downloads/meth_info/Dow_Jones_Islamic_Mar

- 82 - Islamic Economic Studies Vol. 25, No. Special Issue
ket_Indices_Methodology.pdf.
El-Gamal, Mahmoud Amin. (2000) ."A Basic Guide to Contemporary Islamic
Banking and Finance". Rice University.
El-Gamal, Mahmoud Amin. (2006) ."Islamic Finance Law, Economics, and
Practice". Cambridge: Cambridge University Press.
FTSE. (2011) ."FTSE Sharī‘ah Global Equity Index Series". Available at:
http://www.ftse.com/Indices/FTSE_Sharī‘ah_Global_Equity_Index_Series/Do
wnloads/FTSE_Sharī‘ah_Global_Equity_Index_ Series_Factsheet.pdf.
Ghoul, Wafica. (2012) ."Islamic Investing Goes Mainstream: A SWOT Analysis",
The Journal of Investing, 21(4), pp. 171–181.
Girard, Eric and Hassan, M. Kabir. (2008) ."Is There a Cost to Faith-Based
Investing : Evidence from FTSE", The journal of Investing, 17(4), pp. 112–121.
Guyot, Alexis. (2008) ."Les préceptes de la Shari’ah contribuent-ils à l‘efficience et
à la performance des marchés d‘actions? Une étude comparative des indices Dow
Jones Islamic", in Colloque international: Ouverture et émergence en
Méditerranée.
Hakim, Sam and Rashidian, Manochehr. (2002) ."Risk & Return of Islamic Stock
Market Indexes", in 9th Economic Research Forum Annual Meeting, 26-29
Octobre, Sharjah A.E.U.
Hakim, Sam and Rashidian, Manochehr. (2004) ."How Costly is Investors ’
Compliance to Sharia ? How Costly is Investors ’ Compliance to Sharia ?", in
11th Economic Research Forum Annual Conference. Sharjah, UAE., pp. 1–19.
Hassan, M. Kabir and Girard, Eric. (2010) ."Faith-Based Ethical Investing : The
Case of Dow Jones Islamic Indexes", Islamic Economic Studies, 17(2), pp. 1–31.
Hassan, M Kabir. (2000) ."Risk , Return and Volatility of Faith-Based Investing The
Case of the Dow Jones Islamic Index", in Fifth Harvard University Forum on
Islamic Finance: Islamic Finance: Dynamics and Development Cambridge,
Massachusetts. Center for Middle Eastern Studies, Harvard University. 2000., pp.
43–67.
Ho, Catherine Soke Fun, Abd Rahman, Nurul Afiqah, Yusuf, Noor Hafizha
Muhamad and Zamzamin, Zaminor. (2013) ."Performance of Global Islamic
Versus Conventional Share Indices: International evidence", Pacific-Basin
Finance Journal, pp. 1–12.
Hooi, Hooi Lean and Parsva, Parham. (2012) ."Performance of Islamic Indices in
A Kafou & A Chakir: The Case of Islamic Stock Indices with Application on “MASI”- 83 -
Malaysia FTSE Market: Empirical Evidence from CAPM", Journal of applied
Sciences, 12(12), pp. 1274–1281.
Hull, John. (2009) ."Options, Futures and Other Derivatives". 7th editio. Pearson
Education International.
Hussein, Khaled A. (2004) ."Ethical Investment: Empirical Evidence from FTSE
Islamic Index", Islamic Economic Studies, 12(1), pp. 21–40.
Hussein, Khaled A. (2005) ."Islamic Investment : Evidence From Dow Jones and
FTSE indices", in 6th International Conference on Islamic Banking and Finance,
November 21-24, Jakarta, Indonesia, pp. 1–14.
Hussein, Khalid and Omran, Mohammad. (2005) ."Ethical Investment Revisited :
Evidence from Dow Jones", The journal of Investing, 14(3), pp. 105–126.
IFSB. (2014) ."Islamic Financial Services Industry Stability Report".
Iqbal, Munawar and Molyneux, Philip. (2005) ."Thirty Years of Islamic Banking
History, Performance and Prospects". Palgrave Macmillan.
Kafou, Ali and Chakir, Ahmed. (2013) ."Les Indices Boursiers Islamiques : Guide
Methodologique et Application sur le MASI", in CIFIMA’2013, pp. 1–18.
Kafou, Ali and Chakir, Ahmed. (2014) ."Construction d’un indice boursier islamique
à la bourse des valeurs mobilières de Casablanca", Cahiers de Recherche en
Sciences de Gestion, 2, pp. 215–243.
El Khamlichi, Abdelbari. (2012) ."Éthique et performance: le cas des indices
boursiers et des fonds d’investissement en finance islamique". Université
d‘Auvergne et Université Mohamed V.
Khatkhatay, M. H. and Nisar, Shariq. (2007) ."Shari’ah Compliant Equity
Investments: An Assessment of Current Screening Norms", Islamic Economic
Studies, 15(1), pp. 47–76.
Lobe, Sebastian, Rößle, Felix and Walkshäusl, Christian. (2012) ."The Price of
Faith: Performance, Bull and Bear Markets, and Screening Effects of Islamic
Investing Around the Globe", The journal of Investing, 21(4), pp. 153–164.
MSCI. (2011) ."MSCI Islamic Index Series Methodology". Available at:
http://www.msci.com/eqb/methodology/meth_docs/MSCI_May11_Islamic_Met
hod.pdf.
Obaidullah, Mohammed. (2005) ."Islamic Financial Services", Islamic Economics
Research Center. Jeddah: King Abdulaziz University.
S&P. (2011) ."S&P Sharī‘ah Indices Methodology". Available at: URL :

- 84 - Islamic Economic Studies Vol. 25, No. Special Issue
http://www.tmx.com/en/pdf/TXSIDescription.pdf.
S&P Dow Jones Indices. (2012) ."S&P Dow Jones Indices: Index Mathematics
Methodology". Available at: URL : https://www.sp-
indexdata.com/idpfiles/emdb/prc/active/methodology/methodology-index-
math.pdf.
Siddiqui, Rushdi. (2011) ."Report card of Islamic indices". Available at:
http://demo.wordpresshelper.org/340/2011/07/13/report-card-of-islamic-indices.
STOXX. (2013) ."STOXX Index methodology Guide". Available at:
http://www.stoxx.com/download/indices/rulebooks/stoxx_indexguide.pdf.
Walkshäusl, Christian and Lobe, Sebastian. (2012) ."Islamic Equity Investing :
Alternative Performance Measures and Style Analysis", The journal of Investing,
21(4), pp. 182–189.
Zamri, Ahmed and Haslindar, Ibrahim. (2002) ."A study of performance of the
KLSE Syariah index", Malaysian Management Journal, 1&2(6), pp. 25–34.