from research to practice and back: the animation …jcnesbit/educ220/thinkpaper/reed2005.pdf ·...
TRANSCRIPT

Educational Psychology Review, Vol. 17, No. 1, March 2005 ( C© 2005)DOI: 10.1007/s10648-005-1636-3
Research Into Practice
From Research to Practice and Back:The Animation Tutor Project
Stephen K. Reed1,2
The Animation TutorTM is a curriculum project that uses software to sup-plement instruction in courses such as intermediate algebra. Its purpose isto ground mathematical reasoning in concrete experiences through the useof interactive animation and the virtual manipulation of objects. This arti-cle summarizes how the project has progressed from research to practice andback. The first section shows how research helped implement six instructionalobjectives: emphasize interactivity with reflection, integrate multiple represen-tations, reduce cognitive load, facilitate transfer, replace ineffective static im-ages with animated images, and provide domain-specific knowledge. The lastsection illustrates the reciprocal nature of research and practice by describinghow formative evaluations of the Animation TutorTM program led to labora-tory studies aimed at improving instructional materials and student strategies.
KEY WORDS: action; animation; mathematical reasoning; technology; tutor.
One of the challenges facing education is that many students lack themathematical knowledge to perform well in courses that require quantita-tive reasoning. Even the successful learning of quantitative skills in a math-ematics course does not guarantee transfer to other fields. As pointed outin the Benchmarks for Science Literacy:
Computation is the process of determining something by mathematical means. Itsvalue is acknowledged by the prominence accorded mathematics in school systemseverywhere. Unfortunately, that preferred status has not been matched by results.It turns out that being able to get correct answers to the problems at the end of thechapter or on a work sheet or test is no guarantee of problem-solving ability in real
1San Diego State University, San Diego, California.2Correspondence should be addressed to Stephen K. Reed, CRMSE, 6475 Alvarado Road,Ste 206, San Diego, California 92120; e-mail: [email protected].
55
1040-726X/05/0300-0055/0 C© 2005 Springer Science+Business Media, Inc.

56 Reed
situations. That ought not to be surprising, given that in traditional mathematicsteaching, problems lack interesting real-world contexts; that memorization of algo-rithms by drill is not matched by learning when to use them; that numbers are usedwithout units or attention to significance; and that students receive little, if any, helpin learning how to judge how good their answers are. (American Association for theAdvancement of Science, 1993, p. 288)
The concern with improving mathematics instruction is evident notonly in the Benchmarks but more recently in Project 2061, the reform ini-tiative of the American Association for the Advancement of Science. Anevaluation of 12 algebra textbooks by Project 2061 resulted in just 7 of the12 textbooks being rated as adequate, with the potential for helping stu-dents learn algebra (Project 2061, 2000). Five other textbooks, includingbest sellers, were rated as having little potential for helping students learnalgebra. Two of the recommendations resulting from the study were to usethe Project 2061 evaluations to identify a textbook’s strengths and weak-nesses and to draw on a variety of resources to compensate for a textbook’sweak areas.
The Animation TutorTM is a curriculum project that uses software tosupplement instruction in courses such as intermediate algebra. Its purposeis to ground mathematical reasoning in concrete experiences through theuse of interactive animation and the virtual manipulation of objects. It cur-rently consists of eight modules that each require about one hour of thestudent’s time. Table I describes the modules. As shown in Table I, manyof the modules apply mathematics to real-world content such as chemicalkinetics, finance, and population growth. Readers are encouraged to viewdemonstrations of the modules by visiting the Animation Tutor website athttp://www.sci.sdsu.edu/mathtutor/.
My initial interest in designing these modules stemmed from researchthat I conducted in the mid 1980s that was concerned with improving esti-mation skills (Reed, 1984, 1985; Reed and Evans, 1987; Reed and Saavedra,1986). This article is a case study of how these, and more recent, findingshave influenced the instructional design decisions. Although the emphasisis on how previous research influenced the initial design, I show how forma-tive evaluations of the modules have influenced our redesign of ineffectiveinstruction. I also discuss how the instructional design process has raisedresearch questions.
Although the focus of these modules is on algebra word problems,this review does not emphasize designing a problem-solving environmentfor word problems. A recent article in this journal provides an excellentdescription for readers interested in this topic (Jonassen, 2003). My goalis to show how research influenced the implementation of more general

From Research to Practice and Back: The Animation Tutor Project 57
Table I. Instructional Modules in the Animation Tutor Project
1. Animation Tutor: Average speed. Uses average speed as an example of aweighted average problem. Multiple representations illustrate the constraintthat average speed can not exceed twice the slower speed (Reed et al., 2000).
2. Animation Tutor: Chemical kinetics. Presents two ideas that are fundamental tocalculus (area under a curve and a tangent to a curve) within a scientific context.Introduces key ideas of chemical kinetics to provide the context (Tyner et al.,2000).
3. Animation Tutor: Catch up. Includes problems in which one person or vehiclecatches another by traveling at a constant speed or a constant acceleration.Applies ideas to determining a safe driving distance (Reed et al., 2001).
4. Animation Tutor: Personal finance. Emphasizes the distinction between simpleand compound interest as examples of linear and exponential growth.Application to annuities (Hoffman and Reed, 2001).
5. Animation Tutor: Population growth. Requires estimating and adjustingparameters to improve goodness-of-fit of linear and exponential models ofpopulation growth. Investigates extrapolation to predict future growth (Reedet al., 2002).
6. Animation Tutor: Dimensional thinking. Corrects students’ tendency throughobject manipulation to misapply proportional reasoning to areas and volumes.Generalizes ideas to irregular shapes (Greer et al., 2002).
7. Animation Tutor: Task completion. Illustrates how the same equation appliesacross a variety of problems that differ in story content. Shows differentmethods for solving the same problem (Reed and Phares, 2003).
8. Animation Tutor: Leaky Tanks. Demonstrates how a simple (no leak) solutioncan be adapted to solve more complex problems in which there is a bottom leakor a side leak. The side leak solution combines the no-leak and bottom-leaksolutions (Reed et al., 2003).
instructional objectives that could apply to many different types of learningenvironments. The first section (From Research to Practice) describes theseobjectives:
• Encourage interactivity with reflection. Interaction with the softwareshould encourage students to think deeply about the ideas in the in-struction.
• Make connections among problem solutions. Problem solutions pro-vide a basis for solving related problems if students can discoverthese relations.
• Integrate multiple representations. Students should see the intercon-nection among ideas that are expressed in different representationssuch as text, formulas, pictures, and graphs.
• Reduce cognitive load. Instructional material should not overwhelmthe limited capacity of short-term memory.
• Replace ineffective static images with dynamic images. Animatedimages may be necessary to understand ideas that involvemovement.

58 Reed
• Provide domain-specific knowledge. Instruction on general strate-gies often requires specific content knowledge for effective use ofthe strategies.
Although these objectives guided the design of all the instructionalmodules, I focus on particular modules to illustrate how research influencedtheir formulation and implementation.
The second section (From Formative Evaluations to Laboratory Re-search) describes the methodology used to evaluate the modules, comparesthe methodology to design experiments, and advocates the experimentalstudy of theoretical questions raised by the formative evaluations. The con-cluding section (From Practice to Research) illustrates the circular natureof research and practice by showing how questions raised by the curriculumdesign led to further laboratory investigations of both students’ strategiesand the developers’ design decisions.
FROM RESEARCH TO PRACTICE
Encourage Interactivity with Reflection
A potential advantage of software over noninteractive instructionalformats is that students can interact with the software. However, the op-portunity for interaction is wasted if the interaction does not cause studentsto think more deeply about the material. The modules in the Animation Tu-tor series are designed to promote interaction and reflection, as illustratedby the Task Completion module.
Task completion problems require estimating or calculating how longit will take to complete some task, such as filling a tank or painting a fence.The design of the Task Completion module followed directly from researchon estimation skills (Reed, 1984). My initial interest in instructional ani-mation was primarily driven by students’ unreasonable estimates to prob-lems like this asking for the amount of time it would take two pipes to filla tank:
A small pipe can fill an oil tank in 8 hours and a large pipe can fill it in 4 hours. Howlong will it take to fill the tank if both pipes are used at the same time?
One-third of the college students, half of whom had taken a collegealgebra class, estimated an arithmetic average (such as 6 hr) for these kindsof problems (Reed, 1984). I was alarmed by the large number of estimatesindicating that it would take more time for two pipes to fill a tank than thefaster pipe working alone. I thought that an easy way to improve estimates

From Research to Practice and Back: The Animation Tutor Project 59
would be to allow students to compare a simulation of the two pipes with asimulation of the faster pipe working alone. They could therefore judge theamount of time saved by adding a second pipe.
The attempt to improve students’ estimates through simulations turnedout to be more challenging than anticipated, and several iterations of theinstruction were needed (Reed, 1985). One modification of the initial designshowed students the two simulations at the same time so they would nothave to rely on memory for making comparisons. Another change requiredthem to estimate an answer after viewing each simulation, such as the timerequired to fill the tank when an 8-hr pipe and a 4-hr pipe are both used.These estimates were not scored for accuracy but encouraged students toattend closely to each pair of simulations. Estimation skill improved frompre- to posttesting following these modifications.
Although the instruction was successful, I took a more interactive ap-proach in designing the Task Completion module in line with research stud-ies that demonstrated the effectiveness of interactive animation. An earlyreview of 13 instructional animation studies by Rieber (1990) resulted in hisconcluding that animation’s greatest contributions may lie in its interactivegraphic applications. More recent reviews have also emphasized the posi-tive effects of interactivity (Tversky et al., 2002). The interactivity enablesstudents to control the animation rather than to simply observe simulationsthat are not responsive to student input.
Interactive animation in the Animation Tutor modules allows studentsto evaluate the accuracy of an estimated or calculated answer by testingit in a simulation. Figure 1 illustrates this approach for a task completionproblem. The instruction simulates an estimate by showing how much ofthe tank is filled, including the overflow tank if the estimate is too large.This visual feedback helped students improve their estimates on successivetrials for each problem by showing them the outcome of their estimates(Reed et al., 2002).
The findings, however, raised several questions about the instruction.One concern was whether students use this feedback in a reflective manner.Did students use sophisticated strategies in revising their estimates or didthey use trial and error? A second concern was whether animation con-tributes to successful revisions. Students watch a simulation of the tankfilling, but the key information is where it stops filling. If students saw astatic picture of where the tank stopped filling, would this information be aseffective as viewing the entire simulation? These questions are answeredlater in the article when examining how the evaluation of instructionalinterventions can lead to new research questions (Reed and Hoffman,2004).

60 Reed
Make Connections Among Problem Solutions
An important skill in becoming a good problem solver is the abil-ity to apply the solution of a problem to related problems (Barnett andCeci, 2002). Research on the transfer of solutions across word problemsby adapting and abstracting the solutions has also contributed to the de-sign of the instructional materials (Reed, 1993, 1999). The Animation Tutormodules allow students to practice both estimating and calculating answersto problems. For example, after estimating how long it would take to fillthe tank in Fig. 1, students are shown a method for calculating the exactanswer.
The initial version of the Task Completion module emphasized adapt-ing solutions by using the solution of a simple problem as the basis forestimating and calculating answers to more complex problems. The morecomplex problems required finding completion times for tanks that had (1)a leak in the bottom, (2) a leak in the side, and (3) two pipes that beganfilling at different times. However, there are many variations of task com-pletion problems besides filling tanks. The development of another module
Fig. 1. Example of a tank-filling estimation in which students receive feedback by observinghow much of the tank(s) fills.
From Research to Practice and Back: The Animation Tutor Project 61
therefore emphasizes abstracting solutions across isomorphic problems thathad the same solution but different story content.
The new Task Completion module (the original was renamed theLeaky Tanks module) demonstrates how problems with different story con-tent can be solved by the same equation:
Rate1 × Time1 + Rate2 × Time2 = Tasks,
in which Rate1 and Time1 are the rate and time of the first pipe (worker,traveler), Rate2 and Time2 are the rate and time of the second pipe (worker,traveler), and Tasks is the number of tasks to be completed. The three con-texts are two pipes filling a tank, two workers painting a fence, and twopeople traveling toward each other to meet as in the following problem:
Sally and Maria decide to exchange homework assignments. Sally can walk toMaria’s house in 4 minutes and Maria can walk to Sally’s house in 3 minutes. Howlong will it take them to meet if they both leave their houses at the same time andwalk toward each other?
The similarity of the traveler problem to the other two problems (pipe,worker) is particularly challenging because students tend to classify it asa distance-rate-time problem rather than as a “work” problem (Reed,1987). The Task Completion instruction therefore builds on perceptual ap-proaches to transfer (Greeno et al., 1993) that show the similarity betweenthe painter and walker problems. As illustrated in Fig. 2, the simulation ofthe painter problem shows two painters working toward each other to meet,as the walkers do to exchange homework. There is evidence that increasingthe similarity of static diagrams across problems facilitates transfer (Chen,1995), but there is a need for more research on whether increasing the simi-larity of simulations enhances transfer, as implied by the affordance-activityapproach proposed by Greeno et al. (1993).
Recent work by Goldstone and Sakamota (2002) indicates that design-ing animation to encourage transfer may be a challenging task. They foundthat using color to emphasize similarities across analogous simulations hin-dered transfer for participants who performed relatively poorly on the ini-tial simulation, perhaps because the color cue placed too great an emphasison superficial similarities. It is also possible that the convergence of paintersin Fig. 2 might create superficial similarity between problems. Studentsmight use convergence to transfer solutions across these particular prob-lems but fail to transfer across other isomorphic versions of work and dis-tance problems that do not involve convergence. As argued by Goldstoneand Sakamota (2002), there is a need for research on how to best designinstructional simulations because of their increasing importance in teachingdifficult, abstract concepts.

62 Reed
Fig. 2. Simulation of the painter problem shows a convergence of the two paintersto enhance its similarity to the convergence of two objects in a distance-rate-timeproblem.
The similarity among the three isomorphic versions of the task com-pletion problems is further developed in the Task Completion module byshowing how the delay in one of the pipes corresponds to the delay in thestart time of one of the walkers. Solving these delay problems provides an-other opportunity for students to compare problem solutions. Althoughmaking connections has been most extensively studied for the transfer ofsolutions across problems, it can also apply to alternative solutions to thesame problem. In response to the question of “What should connectionslook like in grades 9 through 12?,” the Principles and Standards for SchoolMathematics (NCTM, 2000) proposes that students should develop a deeperunderstanding that there is more than one method for solving a problem.
The Task Completion module provides two methods for solving de-lay problems. One approach is to construct a single algebraic equation thatrepresents the amount of time for each pipe (or walker). A second ap-proach is a decomposition method that calculates how much of the taskis completed by the beginning pipe (walker), and how much time it takesboth pipes (walkers) to complete the remainder of the task. As demon-strated by Koedinger and Tabachneck (1994), students who knew morethan one strategy and switched strategies when they reached an impasse

From Research to Practice and Back: The Animation Tutor Project 63
were more successful in solving word problems than students who used onlya single strategy. Providing alternative methods is therefore consistent withboth the NCTM recommendations and with the findings of Koedinger andTabachneck.
Integrate Multiple Representations
Providing alternative methods for solving problems can be supple-mented with providing alternative representations for thinking about prob-lems. Examples of alternative representations include equations, static pic-tures, animations, text, and graphs. The use of multiple representations isillustrated in the Average Speed module. Many algebra word problems, in-cluding task completion problems, can be solved by using a weighted av-erage in which two numbers are differentially weighted in calculating theanswer (Reed, 1984). Calculating the average speed of a round trip is a pro-totypical example of a weighted average problem, but most students givean unweighted (arithmetic) average to the following kinds of problems:
Flying east between two cities, a plane’s speed is 150 mph. On the return trip, it flies300 mph. Find the average speed for a round trip (Reed, 1984).
The correct answer is 200 mph and is found by weighting the twospeeds by the relative amount of time spent traveling at those speeds. Be-cause the pilot spends twice as much time traveling at 150 mph: AverageSpeed = 2/3 × 150 mph + 1/3 × 300 mph = 200 mph.
The design of the Average Speed module was influenced by researchthat demonstrated the effectiveness of providing animation-based feedbackfor helping students improve their estimates of average speed and learn thecounterintuitive constraint that the average speed can not exceed twice theslower speed (Reed and Saavedra, 1986). Its initial application is to revealthe common misconception that the average speed of a round trip is not thearithmetic average of the two speeds. As illustrated in Fig. 3, one car simu-lated the two speeds of a round trip and a second car (leaving at the sametime) simulated the estimated average speed. Students were told that if theirestimate were correct, both cars would return at the same time. None of the25 students in an intermediate algebra class gave a correct answer to thisproblem and the animation revealed their error (Reed and Jazo, 2002). Asecond function of animation is to provide visual feedback to allow studentsto improve their estimates. A third function is to allow students to checkthe correctness of their calculations to problems in the same way that theycheck the accuracy of their estimates. A fourth function is to demonstratethe consequences of providing an estimate that exceeds twice the slower

64 Reed
Fig. 3. Example of an average speed estimation in which students receive feedbackby comparing a simulation of the problem with a simulation of their estimate.
speed by showing that an object moving at this speed will complete the en-tire round trip before the object moving at the slower of the two speedsarrives at its initial destination. A fifth function is to provide concrete ex-amples to serve as data points for constructing a graph.
Although animation provided the foundation for the instruction, it wascombined with other representations to gain the advantages of multiplerepresentations. The three main advantages of multiple representations ac-cording to Ainsworth (1999) are to provide complementary roles, constraininterpretation, and construct a deeper understanding. Representations havecomplementary roles when there are differences in either the informationthat each contributes or in the processes that each supports. For example,the Average Speed module provides several different representations forexplaining why the average speed cannot exceed twice the slower speed.Learners can view the asymptote in the graph, use the conception of speedas the ratio of total distance to total time, or study the limit of an algebraicfunction. One of the advantages of providing representations that comple-ment each other is that learners may differ in their preferences for a certainrepresentation. When asked which of these approaches was the most help-ful for explaining the constraint on average speed, 10 students selected thealgebraic approach, 8 students selected the conceptual approach, and 6 stu-dents selected the graphic approach (Reed and Jazo, 2002). The diversity
From Research to Practice and Back: The Animation Tutor Project 65
of their preferences suggests that the complementary roles of these repre-sentations were helpful.
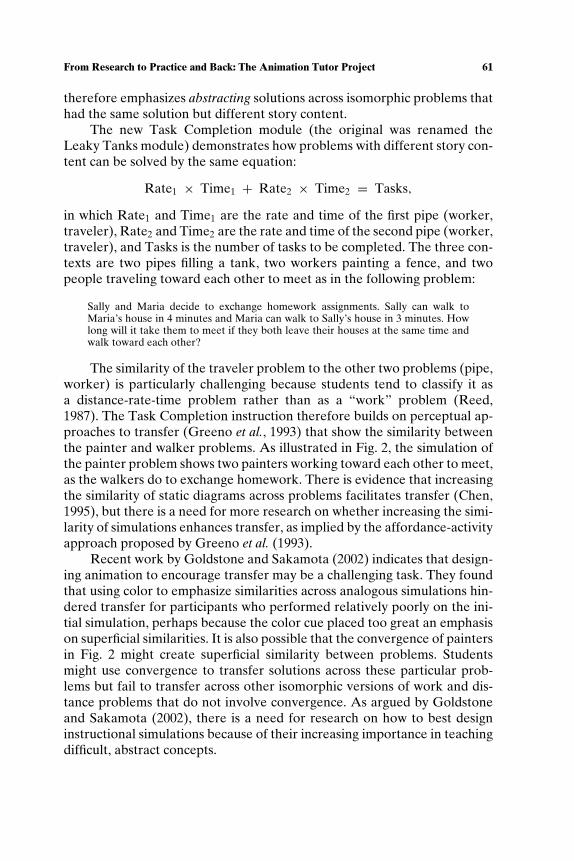
A second advantage of multiple representations is that one represen-tation can be used to constrain the interpretation of a second representa-tion. Graphs are able to show patterns in data but this advantage is lostif students have trouble interpreting graphs. Reed and Saavedra’s (1986)finding that simulations were more effective than graphs can be appliedto instruction by grounding the points on the graph in concrete examples.The examples consisted of four simulation problems in which students esti-mated the speed of the round trip when the initial speed was 5 mph andthe return speed was either (1) 2 mph, (2) 10 mph, (3) 20 mph, or (4)45 mph. After showing the accuracy of an estimate in the simulation, theestimate and correct answer were plotted on the graph, as illustrated inFig. 4 for the first three examples. The correct answers remained plottedon the graph and were connected by a curve after the last problem. Stu-dents were then asked to report the pattern illustrated by the curve and tomake inferences about how the slower speed of a round trip limits the av-erage speed. Combining animated and graphic representations constrainsthe interpretation of the graph by linking points on the graph to observedevents.
Fig. 4. A student’s answers to an ordered series of four problems are plotted with correctanswers to reveal an asymptote of a function.

66 Reed
The third advantage of multiple representations is to promote a deeperunderstanding of the instructional material. In addition to using animationand graphs to illustrate the concept of average speed as a weighted average,the Average Speed module uses a conceptual explanation based on the def-inition of speed as total distance divided by total time. This mathematicalrepresentation provides a rationale for why a car traveling at two differentspeeds would return from a round trip at the same time as a car traveling ata weighted (by time) average of the two speeds. The animation of this math-ematical relationship provides visual feedback for improving estimates andcalculations of average speed. It is, therefore, important that students un-derstand the reason behind it.
Reduce Cognitive Load
A potential problem in coordinating multiple representations is thatthe cognitive demands may overwhelm short-term memory capacity. Ac-cording to Sweller’s (1994) cognitive-load theory, good instructional designreduces cognitive load to a manageable level. For example, when studyinga geometrical proof, students often need to integrate information presentedin both a diagram and a text. Because it requires mental effort to integrateinformation presented in the two representations, cognitive load can be re-duced by designing worked examples that carefully relate the steps in theproof to the diagram. Physically integrating the text and diagram avoids asplit-attention effect caused by shifting attention between the text and di-agram. Another example of reducing the split-attention effect in multime-dia learning is to present a verbal narrative simultaneously with a diagramto reduce the cognitive effort required to integrate the two representations(Mayer, 2001). Learners can listen to an explanation of the diagram withouthaving to shift their attention between the diagram and written text.
Bob Hoffman and I used research on the split-attention effect to re-design the Personal Finance module when a formative evaluation revealedthat students were unable to identify the correct formulas for simple andcompound interest after studying graphic and tabular representations. Thegraphic representation consisted of two histograms that depict two accountswith $1000 in each, one earning simple interest and the other earning com-pound interest. A slider allows users to compare the total amount in theaccounts in increments of 1 year up to 30 years. Students use the slider tosee the relationships among the original deposit (the principle), time, andthe amount of interest earned in each account. As shown by the left his-togram in Fig. 5, simple interest does not earn interest on itself because itis not left in the account. In contrast, compound interest does earn interest

From Research to Practice and Back: The Animation Tutor Project 67
Fig. 5. A graphic representation of simple (left) and compound (right) interest.
on itself (as revealed by the larger slices in the right histogram) because itis left in the account.
Learners then viewed a pair of accounts—this time with $6000 startingprinciple at 6% interest—in tabular form covering the first 5 years (Fig. 6).One account shows the growth with simple interest and the other withcompound interest. The instructional objective was for students to link thegraphical representation with the tabular representation, and use both to se-lect a correct equation for representing how much money they would earnfrom each account after 5 years.
After making their selection for simple interest among the four equa-tions shown in Fig. 6, students received feedback that the first equation wascorrect. They then studied the pattern of data illustrating compound in-terest, selected an equation to represent this pattern of data, and receivedfeedback that Equation 4 was correct (as shown in Fig. 6). Only 7 of the26 students correctly identified the simple interest formula, and only 10 stu-dents correctly identified the compound interest formula, indicating closeto chance performance.
Reanalysis of the instruction revealed that there were insufficientlinks that would enable students to move across the graphic, tabular, and

68 Reed
Fig. 6. Selecting an equation to describe earnings from compound interest.
algebraic representations. Figure 7 shows the redesign that brings togetherthe three different representations to reduce the split-attention effect. Bothnumerical and algebraic representations are represented in the table, andstudents are required to enter numbers in the table to demonstrate compre-hension. They must also click on corresponding entries in the table and inthe histogram to establish this connection. The revised instruction thereforeprovides links that should enable students to make connections across thesethree different data representations. It also makes this integration manage-able by asking a series of questions that require students to attend to only afew elements on the screen at a time (Sweller, 1994).
Replace Ineffective Static Imageswith Dynamic Images
Static images can be an effective instructional supplement for text in-formation (Larkin and Simon, 1987). However, sometimes images that areanimated or manipulable are more informative. One example is providing

From Research to Practice and Back: The Animation Tutor Project 69
Fig. 7. Linking tabular, algebraic, and graphic representations of compound interest.
a diagram to help people discover the convergence solution to Duncker’sradiation problem. This solution requires splitting the radiation so its in-tensity converges at the site of the tumor. A static image that depictedarrows converging toward a circle was ineffective (Gick and Holyoak,1983), but animation of the arrows to show motion toward the targetgreatly increased discovery of the convergence solution (Pedone et al.,2001).
Instruction that uses dynamic images seems promising given that staticimages are ineffective. The ineffectiveness of static images was revealed ina study showing that students often use proportional reasoning inappropri-ately (Greer, 1993). For instance, students often estimate that it will take aperson three times as long to run three miles as it takes the person to runone mile, although fatigue will make that estimated time unlikely. This ten-dency to apply proportional reasoning uniformly has been found in manystudies throughout the world (Verschaffel et al., 2000).
The design of the Dimensional Analysis module attempts to correctstudents’ tendency to inappropriately apply proportional reasoning to areaand volume. Students often believe that doubling the length of a side willdouble the area of a square (which will be 4 times as large) and doublethe volume of a cube (which will be 8 times as large). Attempts to correctthis misconception with static diagrams were largely unsuccessful (De Bocket al., 2002). Brian Greer, Bob Hoffman, and I therefore designed the Di-mensional Analysis module so students can virtually manipulate dynamicdiagrams of circles, squares, cubes, and irregular figures to learn when pro-portional reasoning does and does not apply.
The instruction begins with a problem similar to one that students mayhave previously encountered: Is a 12-in pizza for $6.99 or 20-in pizza for
70 Reed
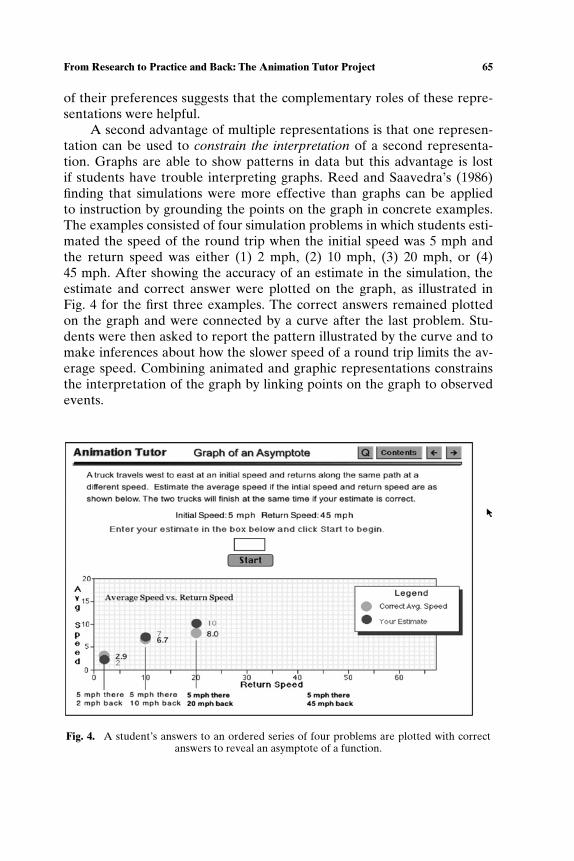
Fig. 8. Estimating how many small bowls will fill a large bowl with twice the radius.
$12.99 the better value? Dividing the price by the diameter would result inthe false conclusion that the 12-in pizza is the better buy. The DimensionalAnalysis module enables students to drag circles with a small diameter ontoa circle with a larger diameter so they can better estimate the relative areasof the circles. They can also evaluate their estimates of volume by fillingcontainers. The animation in Fig. 8 allows them to evaluate how much morea (hemispherical) bowl would hold if its radius were doubled. The estimatethat it would hold eight of the smaller bowls is correct in this example. Otherexercises aid reasoning about squares, cubes, and irregular shapes by ma-nipulating two- and three-dimensional objects.
Provide Domain-Specific Knowledge
This article began by referring to the American Association for theAdvancement of Science’s concern that most students in science courses donot possess adequate quantitative knowledge to do well in these courses. Apossible remedy is to include science examples among the problems solvedin a mathematics class so students can see how mathematics can be appliedto science.

From Research to Practice and Back: The Animation Tutor Project 71
A potential problem in showing the application of mathematical ideasto science is that the application may be meaningless if students do not havea rudimentary understanding of science. One of the conclusions from a re-view of research on teaching science problem solving is that focusing ongeneral problem solving heuristics, without the construction of an adequateknowledge base, was counterproductive (Taconis et al., 2001). This findingprovided a challenge when designing the Chemical Kinetics module to in-troduce, within a science context, two ideas that are fundamental to thestudy of calculus. The concept of area under a curve is fundamental to anunderstanding of integration, and the concept of a tangent to a curve is fun-damental to an understanding of differentiation.
Asking students to estimate the percentage of particles that will re-act by estimating an area under a distribution means little to students whohave no background in chemical kinetics. The instruction therefore beginswith an introduction to chemical kinetics. Figure 9 shows part of this intro-duction in which students view how temperature influences the speed (andkinetic energy) of 20 particles.
Fig. 9. Simulation of the movement of particles at a low and a high temperature.

72 Reed
Fig. 10. Distribution of kinetic energies for a low and a high temperature.
FROM RESEARCH TO PRACTICE
Students next view a histogram of the kinetic energies of the 20 parti-cles to see a simple distribution before studying a more abstract, complexdistribution. In order to illustrate the kinetic energy distribution of the mil-lions of atoms or molecules in a real chemical reaction, the instructionalprogram draws a continuous distribution over the histogram. Students arethen shown a continuous distribution for a low-temperature reaction andestimate the percentage of particles that exceed the minimum threshold fora reaction. After receiving simulation-based feedback, they make an esti-mate for a high-temperature reaction, as shown in Fig. 10. Students madeaccurate predictions. The research reviewed by Taconis et al. (2001) andthe importance of domain knowledge in interpreting complex graphs (Rothand Bowen, 2001) suggests that providing instruction on the principles ofchemical reactions likely helped students make these predictions.
The instruction on tangents as measures of instantaneous rates ofchange was less successful. Most students appeared competent in under-standing the concept of an average rate of change as represented by the
From Research to Practice and Back: The Animation Tutor Project 73
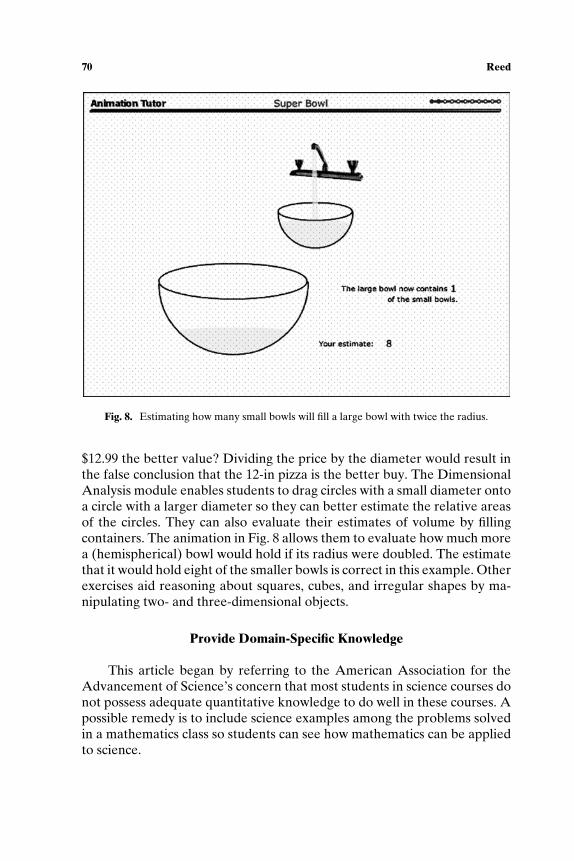
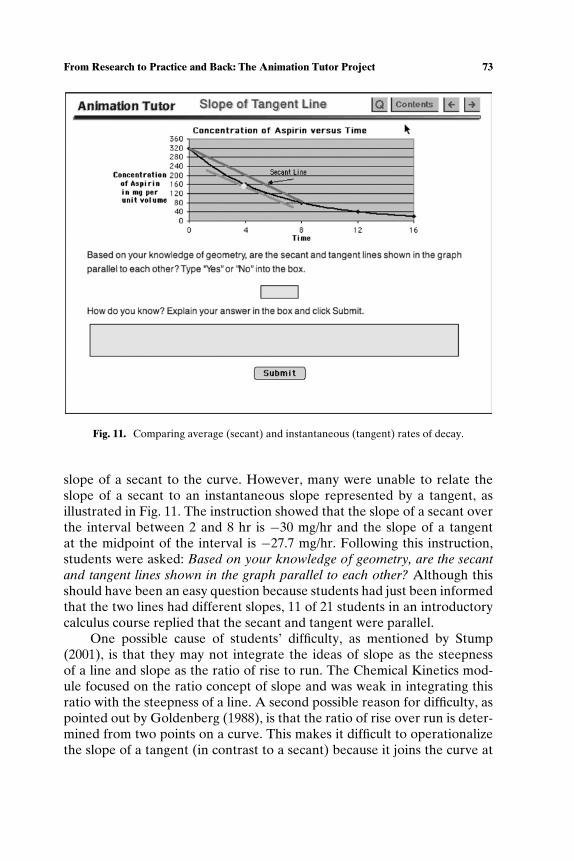
Fig. 11. Comparing average (secant) and instantaneous (tangent) rates of decay.
slope of a secant to the curve. However, many were unable to relate theslope of a secant to an instantaneous slope represented by a tangent, asillustrated in Fig. 11. The instruction showed that the slope of a secant overthe interval between 2 and 8 hr is −30 mg/hr and the slope of a tangentat the midpoint of the interval is −27.7 mg/hr. Following this instruction,students were asked: Based on your knowledge of geometry, are the secantand tangent lines shown in the graph parallel to each other? Although thisshould have been an easy question because students had just been informedthat the two lines had different slopes, 11 of 21 students in an introductorycalculus course replied that the secant and tangent were parallel.
One possible cause of students’ difficulty, as mentioned by Stump(2001), is that they may not integrate the ideas of slope as the steepnessof a line and slope as the ratio of rise to run. The Chemical Kinetics mod-ule focused on the ratio concept of slope and was weak in integrating thisratio with the steepness of a line. A second possible reason for difficulty, aspointed out by Goldenberg (1988), is that the ratio of rise over run is deter-mined from two points on a curve. This makes it difficult to operationalizethe slope of a tangent (in contrast to a secant) because it joins the curve at

74 Reed
only a single point. Both of these observations likely contributed to studentsinaccurately reporting that the two lines in Fig. 11 were parallel becausethey looked parallel. A third possible difficulty in deciding when a tangent isparallel to a secant is students’ tendency to overemphasize the importanceof the mean in representing data (Cobb, 1999). The formative evaluationindicated that many students have the misconception that a tangent locatedat the midpoint of the interval is parallel to a secant. We have used theresults of the formative evaluation and these potential causes of students’difficulties to redesign this section of the Chemical Kinetics module.
Formative Evaluations
Students’ answers to the questions in the Chemical Kinetics module il-lustrate the usefulness of formative evaluations to distinguish between suc-cessful and unsuccessful instruction. The formative evaluations were con-ducted at either San Diego State University (SDSU) or at SouthwesternCollege (SWC), a community college south of San Diego. The participantsconsisted of 25 intermediate algebra students at SWC for the AverageSpeed module, 35 intermediate algebra students at SWC for the LeakyTank module, 25 calculus students at SWC for the Kinetics module, 23introductory psychology students from SDSU for the Personal Financemodule, 21 intermediate algebra students at SWC for the Catch Up mod-ule, 42 trigonometry students at SWC for the Population Growth module,and 24 prospective elementary teachers at SDSU for the Task Completionmodule.
The students participated as a class but worked individually at theirown computer in a computer-equipped classroom. The session occurredwithin their standard class period and was related to the course curriculumbut was scheduled shortly after the completion of the module, rather than ata time when it would best fit into the course schedule. We plan to schedulefuture formative evaluations to correspond more closely to specific topicsin the curriculum.
The methodology of the formative evaluations shares many similari-ties with design experiments. Design experiments have emerged as a majortopic in the evaluation literature as revealed by special issues of the Educa-tional Researcher (January/February 2003) and the Journal of the LearningSciences (Issue 1, 2004). Collins (1999) has contrasted laboratory studieswith design experiments, respectively, along seven criteria:
• Laboratory setting versus messy situations• A single dependent variable versus multiple dependent variables• Controlling variables versus characterizing the situation
From Research to Practice and Back: The Animation Tutor Project 75
• Fixed procedures versus flexible design revision• Social isolation versus social interaction• Testing hypotheses versus developing a profile• Experimenter versus coparticipant design and analysis
The main goal of formative evaluations is to improve instructionby modifying those parts of the material that are ineffective. Formativeevaluations, as with design experiments, evaluate messy situations (the cur-riculum) that have multiple dependent variables such as the accuracy ofestimations, construction of equations, and computations. However, an ad-vantage of evaluating computer-based curricula is that the evaluation of sin-gle students interacting with a computer minimizes social interactions andprovides more experimenter control of instruction than is possible in moretypical classroom settings.
Some proponents of design experiments have argued that theoryshould play a major role in the design (diSessa and Cobb, 2004; Edelson,2002). However, in his commentary on the design experiments discussedin the Journal of the Learning Sciences, Dede (2004) argues that testinga modified design to refine theory is not the same as testing a modifieddesign to improve its usability. He therefore asks whether a successfuldesign-based research program should be split into a theory-driven compo-nent and a usability component. My answer is “yes.” I believe that Collins’(1999) contrast between laboratory studies and design experiments shouldbe taken as an argument for the experimental control of the laboratoryin evaluating theory. The following sections show how theoretical ques-tions raised during formative evaluations can be examined in laboratorystudies.
Laboratory Studies
The flow of ideas between research and practice ideally moves in bothdirections. The work described in the previous sections on curriculum de-velopment has raised a number of research questions such as:
• Which strategies do students use to improve their estimates?• When are animated images more effective than static images?• How do actions influence algebraic constructions?
Two experiments were conducted on estimating event completion timeand address the first two questions (Reed and Hoffman, 2004). Plans foraddressing the third question are underway and also described.

76 Reed
Which Strategies do Students use to Improve Their Estimates?
One of the objectives of the Animation Tutor project is to improveestimation skills by providing visual feedback on students’ estimates. Forexample, if a student estimated that it would take 5 hr to fill a tank and thetank appeared 70% full after a simulation of 5 hr, she could use this feed-back to improve her estimate. Reed et al.’s (2002) formative evaluation ofthe Task Completion module revealed that students did improve their es-timates over three trials. It is unknown, however, which strategies studentsused and whether the inclusion of a digital clock and an overflow tank (asin Fig. 1) improved their estimates.
In order to experimentally control the initial simulation used as thebasis for revision, students were shown 3-sec simulations that filled either.5, .6, .7, .8, .9, 1.1, 1.2, 1.3, 1.4, or 1.5 tanks for a simulated time of 6 hr(Reed and Hoffman, 2004). Students viewed simulations with the presenceor absence of a digital clock and with the presence or absence of an overflowtank. They then estimated how long it would take to fill 1.0 tank. Figure 12shows the screen at the end of a simulation when (A) both the clock andoverflow tank are present and when (B) both the clock and overflow tankare absent.
Students’ estimates and verbal reports revealed that they used a varietyof sophisticated estimation strategies. Table II displays these strategies. Theproportional volume strategy divides the time to fill part of the tank by theproportion of the tank filled. If it takes 6 hr to fill .8 tanks, it will take 7.5 hrto fill 1.0 tank. In contrast, the temporal extrapolation strategy uses temporalinformation (fill rate) to infer how much more time is required to completethe task. It will take 2 more hours to fill a tank if the water rises at a rate of.15 tanks per hour and the tank is 70% full. The fill time strategy is simplyto check the clock when the tank is exactly full on those trials in whichthere is an overflow. Reed and Hoffman (2004) investigated the use of afourth (mental simulation) strategy in a second experiment. Table II shows
Fig. 12. Example of a display showing 1.2 tanks filled for the Clock & Tank condition (A) andthe No Aids (B) condition.

From Research to Practice and Back: The Animation Tutor Project 77
Table II. Alternative Strategies for Estimating Event Completion Times (Reed andHoffman, 2004)
Strategy Perceptual demands Arithmetic demands Helpful aids
Proportionalvolume
Estimate theproportion oftank(s) filledincluding theoverflow tank
Divide the time bythe proportion oftank(s) filled
Overflow tank onoverfill problems
Temporalextrapolation
Estimate the rate offill and theunfilled volume
Divide unfilledvolume by therate to determineadditional timerequired to fill thetank
Clock on underfillproblems
Fill time Check clock for timewhen tank isexactly full
None Clock on overfillproblems
Mentalsimulation
Mentally simulatethe current fillrate until the tankis full
Add the mentalsimulation time tothe time topartially fill tank
Clock on underfillproblems
the perceptual demands, arithmetic demands, and predicted facilitation oftwo visual aids for each of the strategies.
The results of the first experiment revealed that both the digital clockand overflow tank improved estimates, confirming the decision to includeboth in the Task Completion module. The facilitating effect of both a digitalclock to calibrate time and an overflow tank to calibrate volume supportsthe use of both temporal and spatial strategies. In addition, students’ verbalreports of strategies indicated that they were fairly evenly divided in theirchoice of a spatial strategy or a temporal strategy.
The most surprising aspect of the results was the pattern of correlationsbetween the estimation task and three other tasks that measured arithmetic,temporal, and spatial abilities. The arithmetic task contained problems thatwere identical to the ones used in the estimation task except that they werestated verbally: If it takes 6 hr to fill 0.8 tanks, how long will it take to fill1.0 tank. The spatial task required estimating how much liquid was in thetank (such as 0.8 tanks), and the temporal task required judging the time onthe clock when the tank was exactly full. We expected the arithmetic taskto produce the highest correlation because of the similarity of the prob-lems and because we thought mental calculation was the limiting factor inproducing accurate estimates. Although this correlation (r = 0.34) was re-liable, it was less predictive than the spatial estimates (r = 0.51). This find-ing confirms that perceptual abilities play a major role in many reasoningtasks (Ackerman and Cianciolo, 2000). This distinction between numericaland spatial skills is important because principle components analysis of a

78 Reed
variety of mathematical reasoning (psychometric) tests found two principlecomponents: one related to computational estimation and the other relatedto numerosity and measurement estimation that could be based on spatialability (Hogan and Brezinski, 2003).
When Are Animated Images More Effective Than Static Images?
One of the primary instructional objectives of the Animation Tutorproject is to replace static images with animated images when necessary.The challenge, of course, is identifying when it is necessary. Animated im-ages, for instance, are not necessary for using the proportional volume strat-egy because this strategy does not use temporal information. It only uses theproportion of the tank filled at the end of the simulation.
The proportional volume strategy should be effective when there is nochange in the rate of fill as in Experiment 1 but should be less effective ifthere is a change in fill rate. Animated images should therefore be moreeffective when a leak in the side of the tank decreases the rate of fill orwhen a delay in one of the pipes later increases the rate of fill. Reed andHoffman (2004) tested this prediction in a second experiment by using twotypes of problems (no-leak and bottom-leak) in which there was no changein fill rate, and two types of problems (side-leak and delay) in which therewas a change in fill rate.
The sequence of animated images was accompanied by instruction touse the mental simulation strategy shown in Table II. Students were told tomentally simulate the filling of the tank at the current rate when the physicalsimulation stopped (there were no overflow problems in this experiment).When their mental simulation reached the top of the tank, students presseda response key that timed the accuracy of their simulations. Reed andHoffman’s (2004) finding that estimates of task completion times were moreaccurate than the mental simulation times indicates that the mental simula-tions were not the only source of information used to make the estimates.
An encouraging aspect of these findings is that most students showedgood judgment in how they used the three information sources (problemstatement, static diagram, animated diagram) to produce fairly accurate es-timates of event completion time. Students’ ratings of how they used thisinformation across the four types of problems indicated that they relied lesson the static diagram and more on the problem text or the animation whenthere were rate changes. An analysis of the estimates revealed a Sequence ×Problem interaction in which students gave more accurate estimates if theysaw the animated problems first, but the degree of improvement dependedon the problem type. These data support the notion that people use multiplecues to derive an estimate, and weight each cue according to its predictiveaccuracy relative to alternative cues (Brown and Siegler, 1993).

From Research to Practice and Back: The Animation Tutor Project 79
How Do Actions Influence Algebraic Constructions?
Attempts to improve the linking of graphics, tables, and equations inthe simple and compound interest examples led Bob Hoffman and me toexamine whether the representations could be better coordinated for otherexamples in the Personal Finance module. We incorporated the followingproblem that required investing $10,000:
You can put your money in a 5-year Certificate of Deposit (CD) that pays 6% inter-est, but you also want to keep some money in a regular savings account in case youneed cash for an emergency. The savings account pays 3.5% interest. Estimate howmuch money you should invest in the CD in order to earn $500 interest between thetwo accounts during the first year.
Figure 13 shows the initial iconic representation of the problem inwhich students were asked to drag money from one $5000 stack to the other$5000 stack to estimate the amount of money in each account that wouldearn $500 in total interest. Students had three attempts to improve their es-timates by clicking on “Check Your Estimate” to receive feedback on theiraccuracy.
The next part of the instruction showed students how they could usealgebra to construct an equation for solving the problem. The instruction
Fig. 13. Distributing money between a 3.5% checking account and a 6% CD accountto earn $500 in interest.
80 Reed
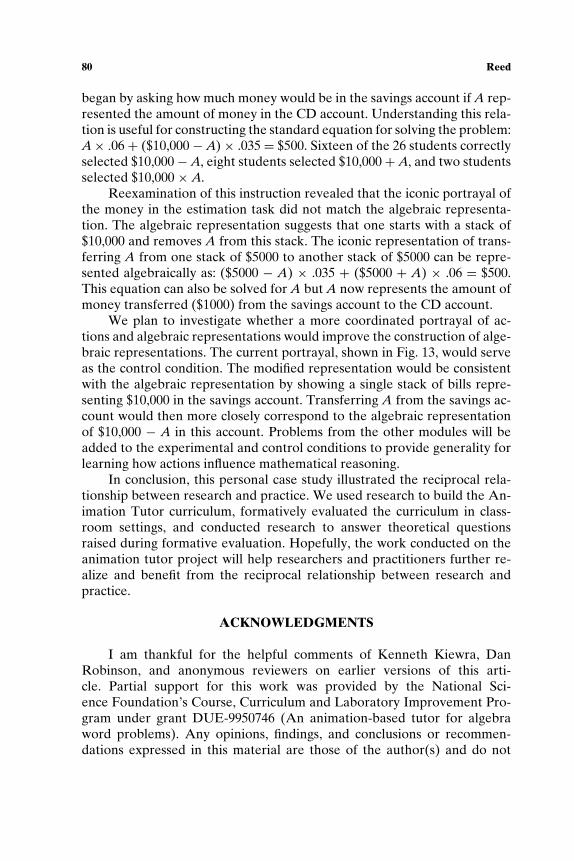
began by asking how much money would be in the savings account if A rep-resented the amount of money in the CD account. Understanding this rela-tion is useful for constructing the standard equation for solving the problem:A × .06 + ($10,000 − A) × .035 = $500. Sixteen of the 26 students correctlyselected $10,000 − A, eight students selected $10,000 + A, and two studentsselected $10,000 × A.
Reexamination of this instruction revealed that the iconic portrayal ofthe money in the estimation task did not match the algebraic representa-tion. The algebraic representation suggests that one starts with a stack of$10,000 and removes A from this stack. The iconic representation of trans-ferring A from one stack of $5000 to another stack of $5000 can be repre-sented algebraically as: ($5000 − A) × .035 + ($5000 + A) × .06 = $500.This equation can also be solved for A but A now represents the amount ofmoney transferred ($1000) from the savings account to the CD account.
We plan to investigate whether a more coordinated portrayal of ac-tions and algebraic representations would improve the construction of alge-braic representations. The current portrayal, shown in Fig. 13, would serveas the control condition. The modified representation would be consistentwith the algebraic representation by showing a single stack of bills repre-senting $10,000 in the savings account. Transferring A from the savings ac-count would then more closely correspond to the algebraic representationof $10,000 − A in this account. Problems from the other modules will beadded to the experimental and control conditions to provide generality forlearning how actions influence mathematical reasoning.
In conclusion, this personal case study illustrated the reciprocal rela-tionship between research and practice. We used research to build the An-imation Tutor curriculum, formatively evaluated the curriculum in class-room settings, and conducted research to answer theoretical questionsraised during formative evaluation. Hopefully, the work conducted on theanimation tutor project will help researchers and practitioners further re-alize and benefit from the reciprocal relationship between research andpractice.
ACKNOWLEDGMENTS
I am thankful for the helpful comments of Kenneth Kiewra, DanRobinson, and anonymous reviewers on earlier versions of this arti-cle. Partial support for this work was provided by the National Sci-ence Foundation’s Course, Curriculum and Laboratory Improvement Pro-gram under grant DUE-9950746 (An animation-based tutor for algebraword problems). Any opinions, findings, and conclusions or recommen-dations expressed in this material are those of the author(s) and do not

From Research to Practice and Back: The Animation Tutor Project 81
necessarily reflect the views of the National Science Foundation. Theproject web site, including demonstrations and experiments, can be ac-cessed at http://www.sci.sdsu.edu/mathtutor/.
REFERENCES
Ackerman, P. L., and Cianciolo, A. T. (2000). Cognitive, perceptual-speed, and psychomotordeterminants of individual differences during skill acquisition. J. Exp. Psychol.: Appl. 6:259–290.
Ainsworth, S. (1999). The functions of multiple representations. Comp. Educ. 33: 131–152.Barnett, S. M., and Ceci, S. J. (2002). When and where do we apply what we learn? A taxonomy
of far transfer. Psychol. Bull. 128: 612–637.Brown, N. R., and Siegler, R. S. (1993). Metrics and mappings: A framework for understanding
real-world quantitative estimation. Psychol. Rev. 100: 511–534.Chen, Z. (1995). Analogical transfer: From schematic pictures to problem solving. Memory
Cogn. 23: 255–269.Cobb, P. (1999). Individual and collective mathematical development: The case of statistical
data analysis. Math. Think. Learn. 1: 5–43.Collins, A. (1999). The changing infrastructure of education research. In Lagemann, L., and
Shulman, L. (eds.), Issues in education research, Josey-Bass, San Francisco.De Bock, D., Verschaffel, L., and Janssens, D. (2002). The effects of different problem presen-
tations and formulations on the illusion of linearity in secondary school students. Math.Think. Learn. 4: 65–89.
Dede, C. (2004). If design-based research is the answer, what is the question? J. Learn. Sci. 13:105–114.
diSessa, A. A., and Cobb, P. (2004). Ontological innovation and the role of theory in designexperiments. J. Learn. Sci. 13: 77–103.
Edelson, D. C. (2002). Design research: What we learn when we engage in design. J. Learn.Sci. 11: 105–121.
Gick, M., and Holyoak, K. J. (1983). Schema induction and analogical transfer. Cogn. Psychol.15: 1–38.
Goldenberg, E. P. (1988). Mathematics, metaphors, and human factors: Mathematical, tech-nical, and pedagogical challenges in the educational use of graphical representation offunctions. J. Math. Behav. 7: 135–173.
Goldstone, R. L., and Sakamota, Y. (2002). The transfer of abstract principles governing com-plex adaptive systems. Cogn. Psychol. 46: 414–466.
Greer, B. (1993). The mathematical modeling perspective on wor(l)d problems. J. Math. Be-hav. 12: 239–250.
Greer, B., Hoffman, B., and Reed, S. K. (2002). Animation Tutor: Dimensional thinking. [Com-puter software]. San Diego State University, San Diego, CA.
Greeno, J. G., Smith, D. R., and Moore, J. L. (1993). Transfer of situated learning. InDetterman, D. K., and Sternberg, R. J. (eds.), Transfer on Trial: Intelligence, Cognition,and Instruction, Ablex, Norwood, NJ, pp. 99–167.
Hoffman, B., and Reed, S. K. (2001). Animation Tutor: Personal finance. [Computer software].San Diego State University, San Diego, CA.
Hogan, T. P., and Brezinski, K. L. (2003). Quantitative estimation: One, two, or three abilities?Math. Think. Learn. 5: 259–280.
Jonassen, D. H. (2003). Designing reseach-based instruction for story problems. Educ.Psychol. Rev. 15: 267–296.
Koedinger, K. R., and Tabachneck, H. J. (1994). Two strategies are better than one: Multi-ple strategy use in word problem solving. Paper presented at the Annual Meeting of theAmerican Educational Research Association, New Orleans, LA.
82 Reed
Larkin, J. H., and Simon, H. A. (1987). Why a diagram is (sometimes) worth ten thousandwords. Cognitive Science 11: 65–99.
Mayer, R. E. (2001). Multimedia Learning, Cambridge University Press, Cambridge, UK.NCTM. (2000). Principles and standards for school mathematics, National Council of the
Teacher of Mathematics, Reston, VA.Pedone, R., Hummel, J. E., and Holyoak, K. J. (2001). The use of diagrams in analogical prob-
lem solving. Memory Cogn. 19: 214–221.Project 2061. (2000). Algebra for all—Not with today’s textbooks, says AAAS (Retrieved April
16, 2002, from www.project2061.org/newsinfo/press/rl000426.htm): American Associationfor the Advancement of Science.
Reed, S. K. (1984). Estimating answers to algebra word problems. J. Exper. Psychol. Learn.Memory Cogn. 10: 778–790.
Reed, S. K. (1985). Effect of computer graphics on improving estimates to algebra word prob-lems. J. Educ. Psychol. 77: 285–298.
Reed, S. K. (1987). A structure-mapping model for word problems. J. Exp. Psychol. Learn.Memory Cogn. 13: 124–139.
Reed, S. K. (1993). A schema-based theory of transfer. In Detterman, D. K., and Sternberg, R.J. (eds.), Transfer on trial: Intelligence, Cognition, and Instruction, Ablex, Norwood, NJ,pp. 39–67.
Reed, S. K. (1999). Word Problems: Research and Curriculum Reform, Erlbaum, Mahwah, NJ.Reed, S. K., Cooke, J., and Jazo, L. (2002). Building complex solutions from simple solutions
in the Animation Tutor: Task Completion. Math. Think. Learn. 4: 315–336.Reed, S. K., and Evans, A. C. (1987). Learning functional relations: A theoretical and instruc-
tional analysis. J. Exp. Psychol. Gen. 116: 106–118.Reed, S. K., and Hoffman, B. (2004). Use of temporal and spatial information in estimating
event completion time. Memory Cogn. 32: 271–282.Reed, S. K., and Jazo, L. (2002). Using multiple representations to improve conceptions of
average speed. J. Educ. Comput. Res. 27: 147–166.Reed, S. K., Hoffman, B., and Phares, S. (2001). Animation Tutor: Catch up. [Computer soft-
ware]. San Diego State University, San Diego, CA.Reed, S. K., Hoffman, B., and Short, D. (2002). Animation Tutor: Population growth. [Com-
puter software]. San Diego State University, San Diego, CA.Reed, S. K., and Phares, S. (2003). Animation Tutor: Task completion. [Computer software].
San Diego State University, San Diego, CA.Reed, S. K., Phares, S., and Sale, J. (2003). Animation Tutor: Leaky tanks. [Computer soft-
ware]. San Diego State University, San Diego, CA.Reed, S. K., and Saavedra, N. C. (1986). A comparison of computation, discovery, and graph
procedures for improving students’ conception of average speed. Cogn. Instruct. 3: 31–62.Reed, S. K., Sale, J., and Phares, S. (2000). Animation Tutor: Average speed. [Computer soft-
ware]. San Diego State University, San Diego, CA.Rieber, L. P. (1990). Animation in computer-based instruction. Educ. Technol. Res. Dev. 38:
77–86.Roth, W.-M., and Bowen, G. M. (2001). Professionals read graphs: A semiotic analysis. J. Res.
Math. Educ. 32: 159–194.Stump, S. L. (2001). High school precalculus students’ understanding of slope as measure.
School Sci. Math. 10: 81–89.Sweller, J. (1994). Cognitive load theory, learning difficulty, and instructional design. Learn.
Instruct. 4: 295–312.Taconis, R., Ferguson-Hessler, M. G. M., and Broekkamp, H. (2001). Teaching science prob-
lem solving: An overview of experimental work. J. Res. Sci. Teach. 38: 442–468.Tyner, K., Reed, S. K., and Phares, S. (2000). Animation Tutor: Chemical kinetics. [Computer
software]. San Diego State University, San Diego, CA.Tversky, B., Morrison, J. B., and Betrancourt, M. (2002). Animation: Can it facilitate? Int. J.
Hum.-Comp. Stud. 57: 1–16.Verschaffel, L., Greer, B., and de Corte, E. (Eds.). (2000). Making Sense of Word Problems,
Swets & Zeitlinger, Heereweg, The Netherlands.