from reality to virtuality: large scale ... - beta cae
TRANSCRIPT

7 BEFORE REALITY CONFERENCE
FROM REALITY TO VIRTUALITY: LARGE SCALE COMPUTED TOMOGRAPHY DATA FOR THE CAD-CAE EVALUATION OF A MINI© 1Dipl.-Ing., Michael Tryfonidis, 1Dr.-Ing., Petros Michailidis 1BETA CAE Systems S.A., Greece KEYWORDS – Computed tomography (CT), RETOMO, ANSA, 3D-Image processing, Non-destructive evaluation (NDE) ABSTRACT – The credibility of CAE, as an engineering domain, depends upon the precision with which Reality is simulated. In order for this to be assured, a high quality FE-model that resembles the manufactured car has to be build, which is quite a challenging task in itself. But accuracy becomes even more critical if simulation results need to be compared to the hardware test, especially if it is a destructive one. Even though deviations of the abstract FE model from the CAD model are relatively easy to detect with powerful pre-processors, the engineer has no information about the deviations introduced in the real model during the manufacturing process. The OEM should assure that the simulated model is truly the one that has been manufactured, preferably before any physical testing takes place. Ideally, the two models, virtual and real one, should be able to be handled in such a way, that they are able to be compared. The expected comparison has to fulfil the basics: such as to point out any geometrical differences of interest from an engineering point of view, depending on the examined discipline. In this paper, the results of such a comparison attempt will be presented. Reality is represented by a CT-Scan of a MINI©, courtesy of BMW Group, and the virtual model is represented by the respective CAD/CAE model, as it is used for CAE-purposes. TECHNICAL PAPER -
1. INTRODUCTION Redefining the state of the art in structural design from vehicle generation to generation requires a constant development of existing tools as well as the introduction of new generations of processes. With BMW I3 and I8, BMW entered the mass production in vehicle development of carbon fibre reinforced plastics in primary structures. The difficulty of interpreting simulation results and hardware results accordingly is a well-known issue. The exponentially increased technical complexity of a multi material structural design and the required joining techniques as well as entire new vehicle architectures in conjunction with a short development time required to look for new techniques to improve the correlation methods between virtual and physical design(1). From the point of view of CAE, the quality assurance of the FE-models that are simulated is of critical importance. So, when a hardware test takes place, then any possible differences during this comparison can only be explained and eventually resolved, if this correlation analysis can be performed between physical and virtual model before and even after the hardware test took place. BMW started to add computed tomography (CT) to this correlation process, covering domains that span from micro-CT up to scanning of complete vehicle structures. As

7 BEFORE REALITY CONFERENCE
hardware was recently developed to cover these targets, the crucial task became the capability of comparing CT data with CAD or CAE data.
2. COMPUTED TOMOGRAPHY AS A NON-DESTRUCTIVE EVALUATION METHODOLOGY
Computed Tomography (CT) is a powerful nondestructive evaluation (NDE) technique for producing 2-D and 3-D cross-sectional images of an object from flat X-ray images. Characteristics of the internal structure of an object such as dimensions, shape, internal defects, and density are readily available from CT images. Shown below is a schematic of a CT system(2).
Figure 1 – Principle of a CT-System for industrial use(2) The test component is placed on a turntable stage that is between a radiation source and an imaging system. The turntable and the imaging system are connected to a computer so that x-ray images collected can be correlated to the position of the test component. The imaging system produces a 2-dimensional shadowgraph image of the specimen just like a film radiograph. Specialized computer software makes it possible to produce cross-sectional images of the test component as if it was being sliced (2).
3. SETTING THE TARGETS
The target is to examine real-model and virtual model (CAD or CAE), and look for any possible errors that would be of diagnostically conclusive value: 1) First of all, it must be possible to check for any important parts missing between the two
models. That would clarify, if the same vehicle configuration is used for both, and will help any further comparison in leading to fair conclusions.
2) Possible errors on the virtual side, such as wrong abstraction level used in representing the part with FE-elements, mistakes during the load case setup or even the simulation faults (such as in numerical instable simulations).
3) Possible errors on the real-model, such as simply bad manufacturing, damages on the hardware, difference in materials used or in the different welding characteristics (amount, position, diameter etc.)
7 BEFORE REALITY CONFERENCE
In order to achieve this we need to compare the finally built hardware on full vehicle size in pre-test configuration in geometrical details with the comparable FE-model. The comparison must include the size and geometry of parts, joining such as spot-welds, seam welds and gluing, as well as the detail of non-structural but package relevant parts. Also the comparison of the final test result must not be limited to for instance accelerations and displacement points, but instead the whole collective of the geometry must be available for an efficient inspection. For instance, in the case in which the behaviour of the front structure of the car shows significant discrepancies, this constitutes a difference in the fundamental behaviour of the model, making it irrelevant to look for further details such as a different in acceleration values of dummy models. A key role during the progress of the works for this project was played by
the XXL-CT Scanning facility that made the whole scanning process possible,
the software RETOMO responsible for the reconstruction of the CT-Image data into FE-data,
the software ANSA, that made it able to compare the virtual and the CT-model
3.1 XXL-CT Scanning
The generation of a digitalized model that resembles the hardware is essential. Since the BiW, the bearing structure of the car, is dominated by shell parts with minimum thickness at ~ 0.7mm, the demands of such a CT-model is quite high, in order to achieve an accuracy in millimeter level. The scanning of the MINI car, that has been used in this work, has been conducted in the Entwicklungszentrum Röntgentechnik EZRT located in Furth Germany (3).
3.2 RETOMO
RETOMO is a tool capable of 3d-Geometry Reconstruction, starting from various tomography dataset formats (.dcm, .raw etc.) and produces FE-models for their further post processing in pre-processing software (4). The core feature of RETOMO is the automation capability of the segmentation process. This was the key feature for this project, since this is necessary for large data sets like the ones for the MINI-car, as well as its interoperability with the ANSA pre-processor.
3.3 ANSA
ANSA is an advanced multidisciplinary CAE pre-processing tool that provides all the necessary functionality for full-model build up, from CAD data to ready-to-run solver input file, in a single integrated environment (5). Its wide range of features and tools meet the needs of this project, in order to perform advanced mesh manipulation actions as well as do the actual comparisons while both data sets are loaded at the same time.
4. 3D-IMAGE RECONSTRUCTION PROCESS USING RETOMO The CT-data set was delivered in form of dicom-images, which represents tomographic image data of the MINI and is the starting point for the works related to this project. These were the result of the application of multiple mathematical filters to the raw X-ray-data.
Amount of images: 1246
Image Resolution: 2052 x 3325 16-bit
Number of Voxels: ~8.5 e9
Voxel-size: 0.989 x 0.989 x 1.2 [mm]

7 BEFORE REALITY CONFERENCE
Total Size: 15.8 GB
The process of reconstructing the data using RETOMO software requires some important input values that need to be chosen by the user with care, since they can affect drastically the quality of the reconstructed surfaces. These parameters are mainly the materials included in the ct-images, expressed in threshold values in terms of grayscale per voxel, and parameters for the seeding process which is the mathematical approach for deciding the material values that are in between threshold ranges.
Figure 2 – Mini loaded in RETOMO, one material set, front view. Courtesy of BMW Group
Figure 3 – Mini loaded in RETOMO, one material set, front view, semi transparent mode. Courtesy of BMW Group
7 BEFORE REALITY CONFERENCE
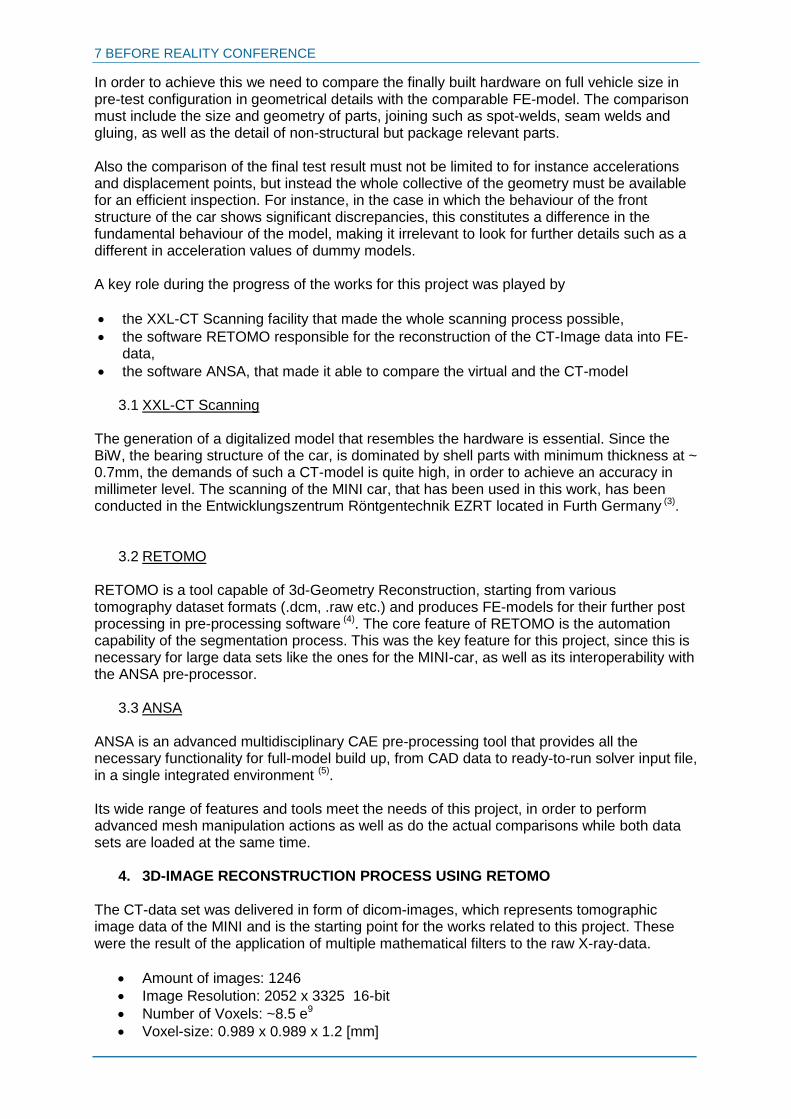
Figure 4 – Mini loaded in RETOMO, one material set, side view. Courtesy of BMW Group
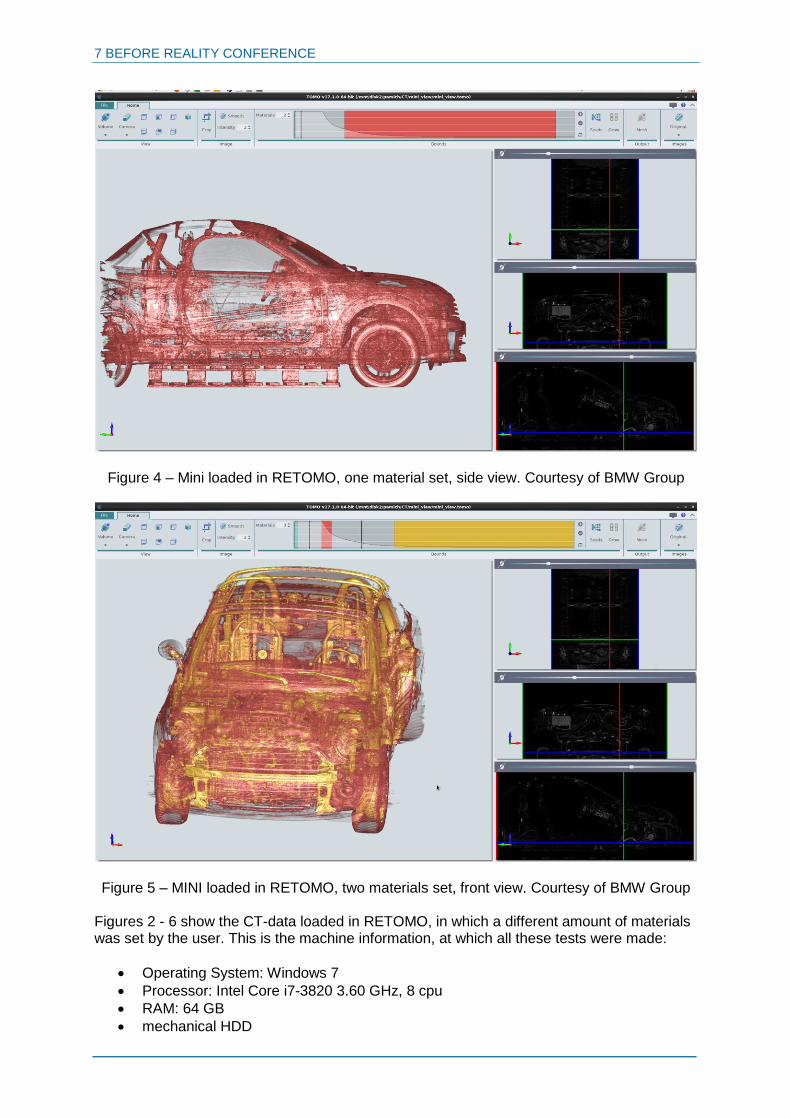
Figure 5 – MINI loaded in RETOMO, two materials set, front view. Courtesy of BMW Group
Figures 2 - 6 show the CT-data loaded in RETOMO, in which a different amount of materials was set by the user. This is the machine information, at which all these tests were made:
Operating System: Windows 7
Processor: Intel Core i7-3820 3.60 GHz, 8 cpu
RAM: 64 GB
mechanical HDD

7 BEFORE REALITY CONFERENCE
Figure 6 – Mini loaded in RETOMO, two materials set, side view. Courtesy of BMW Group
The handling of the full data set to be loaded at once in to the software proved counterproductive in terms of performance. The setup of the above mentioned set of parameters requires repetitive attempts made by the user to fine tune their values, something that is resulting in high calculation timings. So, although, all 8 processors of the machine where used, it was decided to isolate the region of interested (ROI), which would be representative of the car in terms of the ct-data processing. For the purposes of this project the final reconstruction was made executing a session file in RETOMO as a batch operation. This session file was generated by processing the ROI and therefore includes all required parameters for the processing of the CT-data towards generated the MINI’s in form of a surface mesh, on which a smoothing/simplification mesh algorithm was applied to reduce noise and number of final shell elements. The result of this operation was the production of a series of 84 wavefront *.obj – files. These files include an unequal number of shell elements but each represented roughly the same number of Dicom-image slices.
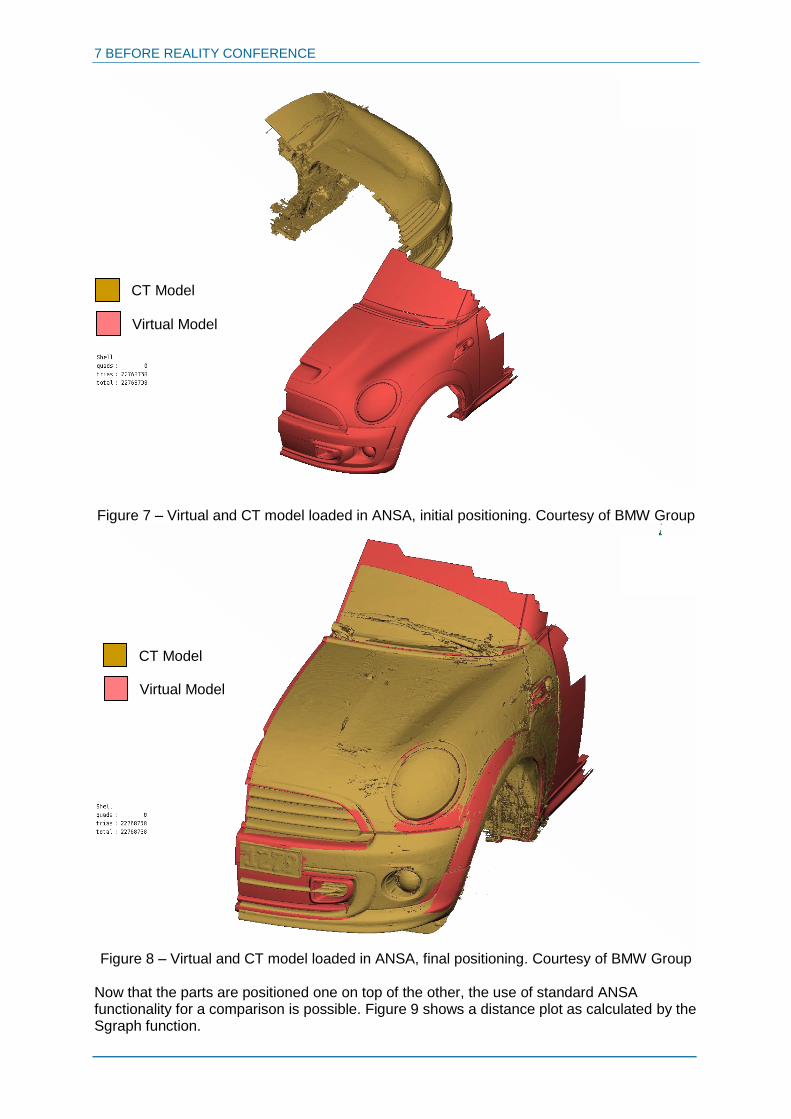
5. POST PROCESSING OF CT-DATA IN ANSA In order to proceed with the post-processing of the CT-Data in ANSA, in order to prepare them for a comparison. The virtual model was represented by the use of Catia V5 *.CATPart files, that were converted into ANSA geometries by just directly importing them into ANSA. The first attempt of importing the CT and virtual model in ANSA, showed a difference in the positioning. In order to make a comparison feasible, the CT-model has to be positioned so that it matches the position of the Virtual model. For that purpose the function Match Parts was used, which computed, applied and exported the transformation matrix for future use, see Figure 7 and 8 for initial and final positioning.
7 BEFORE REALITY CONFERENCE
Figure 7 – Virtual and CT model loaded in ANSA, initial positioning. Courtesy of BMW Group
Figure 8 – Virtual and CT model loaded in ANSA, final positioning. Courtesy of BMW Group
Now that the parts are positioned one on top of the other, the use of standard ANSA functionality for a comparison is possible. Figure 9 shows a distance plot as calculated by the Sgraph function.
CT Model
Virtual Model
CT Model
Virtual Model

7 BEFORE REALITY CONFERENCE
Figure 9 – Distance plot between the surface mesh of Virtual and CT.
Courtesy of BMW Group For an in depth analysis of the geometrical differences of the 2 models, it proves essential to be able to compare the individual parts with each other. In order to make that feasible, a segmentation step is required, that would lead into separating the CT-model into smaller areas that corresponds to parts. For that purpose there exists a variety of features to make use of in ANSA (such as the Isolate function), but for this particular case we made extensive use of the existence of the virtual model. The virtual model is comprised by a part structure, reflecting the original CAD-structure, and will therefore be used for separating the Virtual model into the corresponding per part regions.
Figure 10 – Segmentation of the Virtual model based on the CT model.
Courtesy of BMW Group
CT Model Virtual Model

7 BEFORE REALITY CONFERENCE
This segmentation was achieved by using the generic entities set builders, and the result can be seen in Figure 10. This allows a per part analysis like shown in Figure 11 in which now the geometric differences can be assessed with more controlling and in further detail.
Figure 11 – Per part segmentation of the hood compartment. Courtesy of BMW Group
Furthermore, the removal of artifacts proves to be a regular meshing action in ansa, for the purpose of which several meshing tools exist, with various degree of automation level.
Figure 13 – Example of removal of artifacts at mesh level
6. CONCLUSION The target of this project was to be able to conduct a comparison between Virtual and CT model at full vehicle level. This paper analysed in depth the procedure that was followed in order to achieve that target successfully. It also proved that a comparison of this size is possible, which relies on the combination of high-end CT-data reconstruction tools like RETOMO and extremely powerful pre-processor like ANSA.
7 BEFORE REALITY CONFERENCE
The high level of automated reconstruction capabilities allows for multiple runs of surface reconstruction RETOMO-sessions on the ROI, with different tunings in terms of parameters, so that the best result can be chosen to reconstruct the final full amount of the vehicle data. And then once the data are imported in ANSA, the powerful meshing engine can be exploited in order to reduce the mesh size to a minimum and eventually even removing artifacts, if the process requires so. Special tools such as the Isolate and Separation graph help in a per part segmentation procedure as well as the identification of geometrical differences. REFERENCES (1) New Approach on processing large scale Computed Tomography data in conjunction
with high end CAE Pre-Processing, D. Heiserer, M.Tryfonidis, 2015
(2) Computed Tomography, https://www.nde-ed.org/EducationResources/CommunityCollege/Radiography/AdvancedTechniques/computedtomography.htm, Iowa State University, 2001-2012
(3) High energy CT or XXL-CT, https://www.iis.fraunhofer.de/en/ff/zfp/tech/hochenergie-computertomographie.html, Fraunhofer-Institut für Integrierte Schaltungen IIS, 2017
(4) Retomo User’s Guide, BETA CAE Systems, 2017
(5) ANSA User’s Guide, BETA CAE Systems, 2017