from boat to plate - wwfawsassets.wwf.org.za/downloads/wwfsassi_boattoplate_web.pdf · from boat to...
TRANSCRIPT

2014RE PORT
FROM BOAT TO PLATE: LINKING THE SEAFOOD CONSUMER AND SUPPLY CHAIN
WWW.WWFSASSI.CO.ZA
Linking the seafood consumer and supply chain
FROM BOAT TO PLATE

© Text WWF 2014
All rights reserved.
WWF is one of the world’s largest and most experienced independent conservation organisations, with over 6 million supporters and a global network active in more than 100 countries.
WWF’s mission is to stop the degradation of the planet’s natural environment and to build a future in which humans live in harmony with nature, by conserving the world’s biological diversity, ensuring that the use of renewable natural resources is sustainable, and promoting the reduction of pollution and wasteful consumption.
Report compiled by: Chris Kastern, Markus Burgener, John Duncan and Jaco Barendse.
Based on research conducted by: Chris Kastern, Markus Burgener, Bernice Mclean, Donna Cawthorn, Jaco Barendse and Nicola Okes. Reviewer: Jorisna Bonthuys. Text Editor: Deborah Cooper. Design: Design for development.
September 2014.

1FROM BOAT TO PLATE: LINKING THE SEAFOOD CONSUMER AND SUPPLY CHAIN
HOW BIG IS THE OCEAN? 71% OF THE EARTH’S SURFACE
ARE THERE PLENTY MORE FISH IN THE SEA? WHY SHOULD WE CARE?
“Seafood is a global rather than a local resource. Do you know what seafood species you’re eating? Have you asked where it comes from and how it was caught?”
WE SHOULD BE CONSUMING FISH FROM WELL-MANAGED FISHERIES OR AQUACULTURE OPERATIONS:sustainable, legal, healthy fish stocks, with minimal impact on the ecosystem.
THE MORE WE KNOW, THE MORE WE ARE ABLE TO MAKE INFORMED DECISIONS:about what we source, supply, sell or buy, as a link in the consumer and supply chain.
South Africa’s fishery sector is of significant commercial importance and many of its seafood products are valued on the international market.
Complementary to this we have a wealth of resources, both along our coast and inshore, that are critical to the livelihoods and food security of local communities.
The pressure that many fish stocks are currently under and the increasing importance of marine resources in supplying a source of protein world-wide is evident. We need to know more than ever how everything is connected, from boat to plate: the status of the species, how our seafood is caught, where, and the path it has travelled to reach the end consumer.
Ecological impact is one thing, but without transparency and adequate data to track trade throughout the seafood chain, WWF are not fully able to prioritise their work with industry. It is difficult to empower change when the roleplayers may not even know the species they’re eating, or to implement procurement policies while not knowing what seafood it is they’re trading. In order to better advise government, business and the consumer, there is a need for better trade data.
Twelve years ago, seafood sustainability was not a conscious consideration for most South African consumers, seafood suppliers or even conservation practitioners. Fishers and fisheries managers were concerned about the continuity of seafood supply, but many broader sustainability concerns, such as the conservation status of individual species, fisheries impacts on marine ecosystems and poor management of bycatch, were neglected. No-sale and threatened species were sold openly and consumers had no information to guide seafood choices. Retailers had few resources to understand seafood legalities, identify potential sustainability concerns or guide procurement.
Founded in response, the South African Sustainable Seafood Initiative (WWF-SASSI) has been engaging with the seafood industry for over ten years and has now reached a threshold at which the programme is perceived to have gained significant traction both with South African consumers and major players in the seafood industry.
To date there has not been a comprehensive analysis of the trade dynamics of the South African seafood sector. This report highlights the major species traded, provides information on the sustainability of their origins and tracks the seafood’s route to market. It also attempts to assess the extent of WWF-SASSI’s impact in influencing seafood purchasing decisions, and in reducing illegal trade in the South African seafood industry.
FOREWORDby Markus Burgener
Senior Programme Officer, TRAFFIC East/Southern Africa
SeafoodFor the purpose of this report, seafood denotes any species of edible fish or shellfish sold for human consumption.

EXECUTIVE SUMMARY 4
What is it? Where is it from? How was it caught or farmed?
CATCH TO PRODUCTION 8
AquacultureSeafood origins and production methods
910
34How do we positively transform seafood trade?
SUSTAINABILITY
Compliance and illegal seafood tradeData collection and analysis: Challenges and conclusions
3545
CONTENTSFROM BOAT TO PLATELinking the seafood consumer and supply chain
What are we trading? What are we eating?
THE SOUTH AFRICAN SEAFOOD MARKET 12
SuppliersSouth African catchCatch and international tradeMarket trendsSeafood consumption in South Africa
1314 152630

4 FROM BOAT TO PLATE: LINKING THE SEAFOOD CONSUMER AND SUPPLY CHAIN
Tracking the movement of seafood products from “boat to plate” is a key requirement for achieving sustainable fisheries, securing a viable and legal seafood industry, and safeguarding the livelihoods of communities dependent on fisheries.
Without adequate traceability systems to monitor trade it is challenging for seafood companies, consumers and governments to obtain reliable information about the catch and origins of fish products and their movement along supply chains. WWF-SA and TRAFFIC compiled this report to better understand the context within which seafood is bought and sold in South Africa.
Conducting the research underpinning this report revealed that the globalised nature of seafood trade and the resultant complexity of supply chains remain a global challenge when compiling accurate trade data. Seafood frequently travels vast distances, visits multiple countries and changes hands often, between traders, processors and distributors. During this process much product information is lost and the systems designed to track the movement of these products are not always adequate in terms of capturing relevant species data.
The relevance of the discussion on challenges analysing trade dynamics of products originating from beyond South African borders is highlighted by the finding that of the 312,753,261 kilograms of seafood consumed in South Africa in 2010, just over 50% was imported. Understanding the trade routes of these imported seafood products is critical to ensure that destination markets can reward legal and responsible fishers, consumers can make informed choices, and governments can successfully combat trade in illegal, unreported and unregulated (IUU) fish products and properly regulate trade.
The top five species identified as the key commercial species or species groups by volume for the retailers, fish shops, markets and restaurants interviewed were hake, prawns, calamari, kingklip and sole. Interestingly, the vast majority of calamari consumed in South Africa is imported, and the local catch is almost entirely exported due to the premium pricing that it attracts in foreign markets. Similarly, much of the hake consumed by South Africans between 2000 and 2010 was imported, with more than 95% of the imported volume coming from Namibia. In terms of prawns consumed in South Africa, 62% originated from India in 2010, with notable volumes also from Mozambique and Thailand.
The report indicates furthermore that the South African market is generally poorly equipped to meaningfully address seafood sustainability challenges. Of outlets interviewed, 57% indicated that they were not familiar with the laws applicable to seafood trade in South Africa and 46% had never been inspected by compliance officials. Interestingly, a quarter of the respondents stated that they used the WWF-SASSI consumer guide to determine which species were illegal to sell. This illustrates the impact that WWF-SASSI has in influencing seafood purchasing decisions of seafood vendors, and in particular in reducing the amount of trade in illegal species on the South African seafood market; one of the original objectives of WWF-SASSI when it was developed in 2004.
EXECUTIVE SUMMARY
5FROM BOAT TO PLATE: LINKING THE SEAFOOD CONSUMER AND SUPPLY CHAIN
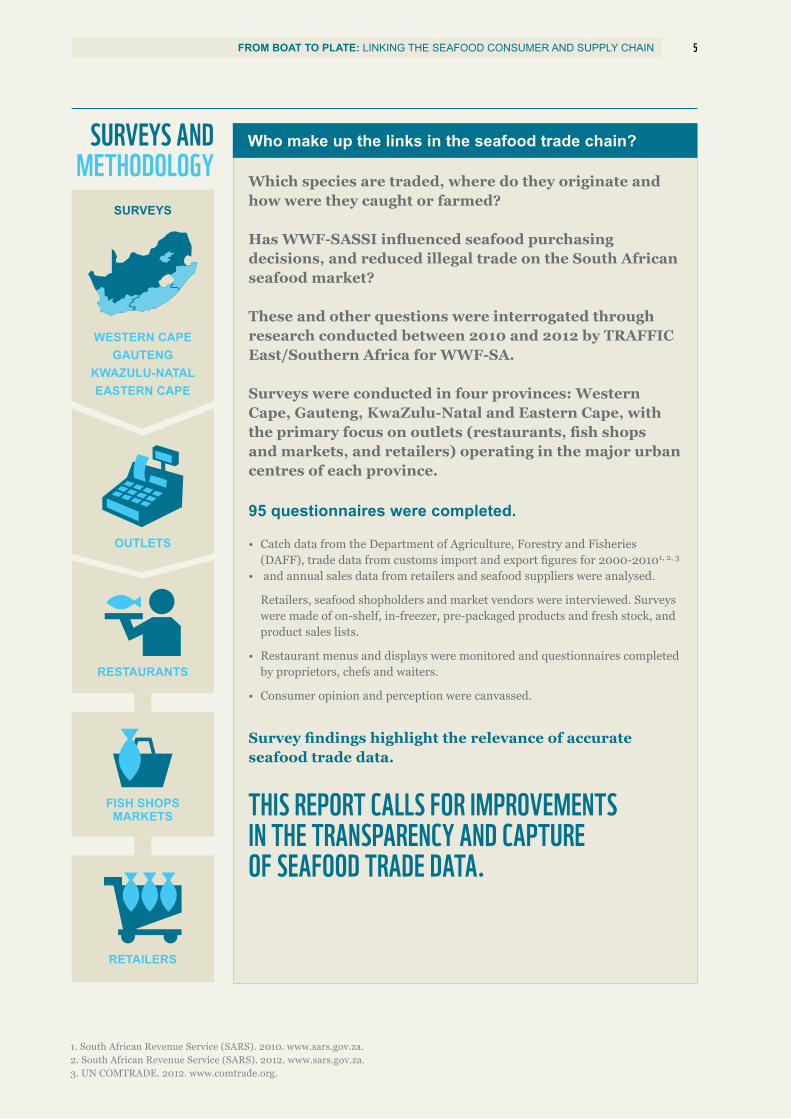
SURVEYS AND METHODOLOGY
Who make up the links in the seafood trade chain?
Which species are traded, where do they originate and how were they caught or farmed?
Has WWF-SASSI influenced seafood purchasing decisions, and reduced illegal trade on the South African seafood market?
These and other questions were interrogated through research conducted between 2010 and 2012 by TRAFFIC East/Southern Africa for WWF-SA.
Surveys were conducted in four provinces: Western Cape, Gauteng, KwaZulu-Natal and Eastern Cape, with the primary focus on outlets (restaurants, fish shops and markets, and retailers) operating in the major urban centres of each province.
95 questionnaires were completed.
• Catch data from the Department of Agriculture, Forestry and Fisheries (DAFF), trade data from customs import and export figures for 2000-20101, 2, 3
• and annual sales data from retailers and seafood suppliers were analysed.
Retailers, seafood shopholders and market vendors were interviewed. Surveys were made of on-shelf, in-freezer, pre-packaged products and fresh stock, and product sales lists.
• Restaurant menus and displays were monitored and questionnaires completed by proprietors, chefs and waiters.
• Consumer opinion and perception were canvassed.
Survey findings highlight the relevance of accurate seafood trade data.
THIS REPORT CALLS FOR IMPROVEMENTS IN THE TRANSPARENCY AND CAPTURE OF SEAFOOD TRADE DATA.
WESTERN CAPE GAUTENG
KWAZULU-NATAL EASTERN CAPE
SURVEYS
OUTLETS
RESTAURANTS
FISH SHOPSMARKETS
RETAILERS
1. South African Revenue Service (SARS). 2010. www.sars.gov.za.2. South African Revenue Service (SARS). 2012. www.sars.gov.za.3. UN COMTRADE. 2012. www.comtrade.org.

6 FROM BOAT TO PLATE: LINKING THE SEAFOOD CONSUMER AND SUPPLY CHAIN
“More people than ever before rely on fisheries and aquaculture for food and as a source of income, but harmful practices and poor management threaten the sector’s sustainability.
The rapid expansion of aquaculture, including the activities of small-scale farmers, is driving this growth in production. Fish farming holds tremendous promise in responding to surging demand for food which is taking place due to global population growth. At the same time, the planet’s oceans – if sustainably managed – have an important role to play in providing jobs and feeding the world.”
- FAO4
THE STATE OF OUR OCEANS
Global perspective:
growing role of fish in feeding the world
Fish remains among the most traded food commodities worldwide, worth almost US$130 billion in 2012 and pointing to an increase for 2013. The aggregate FAO Fish Price Index reached a record high in October 2013.
The fisheries and aquaculture sector is also a source of employment and income, supporting the livelihoods of 10-12% of the world’s population. In 2012, employment in the sector grew faster than the world’s population, with almost 60 million people engaged in the primary sector, 90% small-scale fishers and 15% of them women. In post-harvest activities such as processing, women can account for up to 90% of workers.
Rising demand for fish and fish products, coupled with a growing human population, has placed increasing pressure on fish resources and the fisheries themselves (i.e., meeting market demand in the face of declining economically valuable fish stocks).
THE RANDS AND CENTS OF
THE GLOBAL FISHERY
Fish trade is governed by complex multilateral and bilateral trade agreements, and negotiations at regional, national and international levels, in conjunction with consumer demand, determine the amounts of fish exported and imported. Following the change of government in 1994 and the lifting of international sanctions, the South African market opened considerably. In 2009 South Africa exported US$75,547,408 of fish and fishery products worldwide. Imports of fish and fishery products into South Africa for 2009 were valued at US$69,932,024 (TRAFFIC 2010).
4. FAO. 2014. State of the World Fisheries and Aquaculture. Opportunities and challenges. Available at:http://www.fao.org/3/a-i3720e/index.html.
SEAFOOD TRADE IN
SOUTH AFRICA
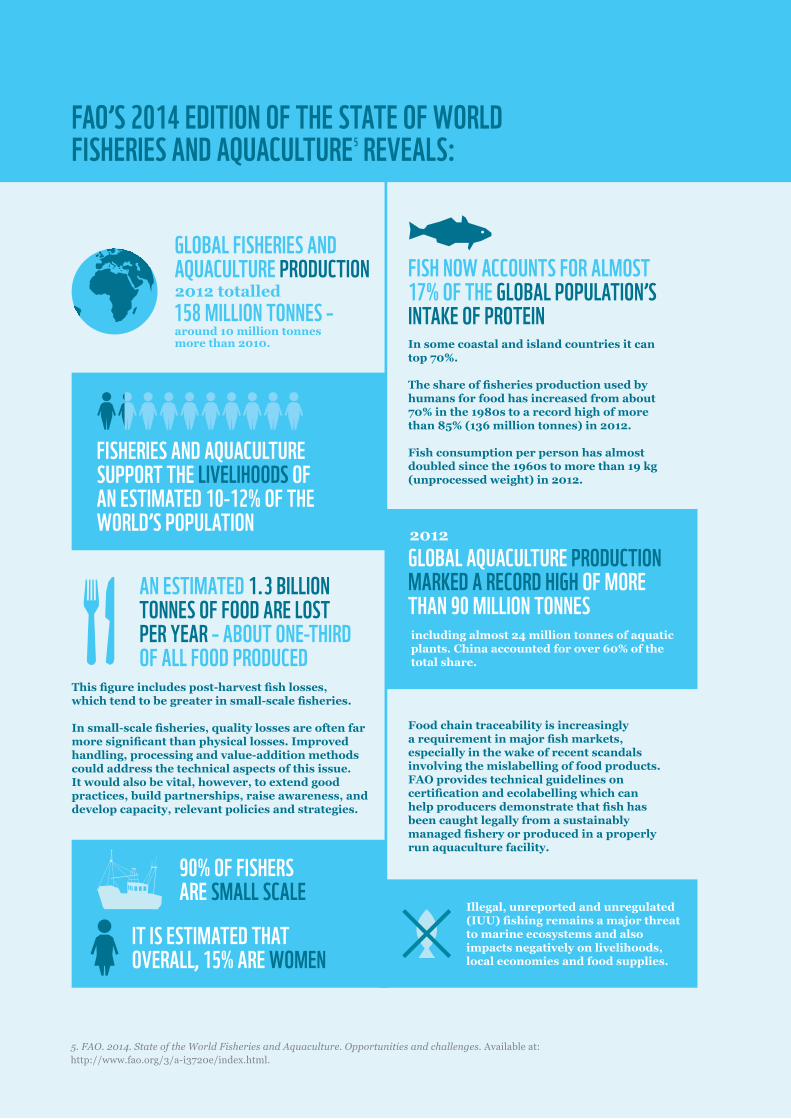
GLOBAL FISHERIES AND AQUACULTURE PRODUCTION
158 MILLION TONNES –2012 totalled
around 10 million tonnes more than 2010.
FISH NOW ACCOUNTS FOR ALMOST 17% OF THE GLOBAL POPULATION’S INTAKE OF PROTEINIn some coastal and island countries it can top 70%.
The share of fisheries production used by humans for food has increased from about 70% in the 1980s to a record high of more than 85% (136 million tonnes) in 2012. Fish consumption per person has almost doubled since the 1960s to more than 19 kg (unprocessed weight) in 2012.
FISHERIES AND AQUACULTURE SUPPORT THE LIVELIHOODS OF AN ESTIMATED 10-12% OF THE WORLD’S POPULATION 2012
GLOBAL AQUACULTURE PRODUCTION MARKED A RECORD HIGH OF MORE THAN 90 MILLION TONNESincluding almost 24 million tonnes of aquatic plants. China accounted for over 60% of the total share.
This figure includes post-harvest fish losses, which tend to be greater in small-scale fisheries.
In small-scale fisheries, quality losses are often far more significant than physical losses. Improved handling, processing and value-addition methods could address the technical aspects of this issue. It would also be vital, however, to extend good practices, build partnerships, raise awareness, and develop capacity, relevant policies and strategies.
AN ESTIMATED 1.3 BILLION TONNES OF FOOD ARE LOST PER YEAR – ABOUT ONE-THIRD OF ALL FOOD PRODUCED
Food chain traceability is increasingly a requirement in major fish markets, especially in the wake of recent scandals involving the mislabelling of food products. FAO provides technical guidelines on certification and ecolabelling which can help producers demonstrate that fish has been caught legally from a sustainably managed fishery or produced in a properly run aquaculture facility.
90% OF FISHERS ARE SMALL SCALE
IT IS ESTIMATED THAT OVERALL, 15% ARE WOMEN
Illegal, unreported and unregulated (IUU) fishing remains a major threat to marine ecosystems and also impacts negatively on livelihoods, local economies and food supplies.
FAO’S 2014 EDITION OF THE STATE OF WORLD FISHERIES AND AQUACULTURE5 REVEALS:
5. FAO. 2014. State of the World Fisheries and Aquaculture. Opportunities and challenges. Available at:http://www.fao.org/3/a-i3720e/index.html.

CATCH TO PRODUCTIONWhat is it? Where is it from? How was it caught or farmed?
GLOBAL FISH PRODUCTION GROWTH CONTINUES TO OUTPACE WORLD POPULATION GROWTH
HAKE IS BY FAR THE MOST VALUABLE FISH RESOURCE IN SOUTH AFRICA
624,078 TONNES OF FISH WERE CAUGHT IN ALL SOUTH AFRICAN FISHERIES IN 2010
THE WEST COAST ROCK LOBSTER FISHERY PROVIDESTHOUSANDS WITH EMPLOYMENT
MANY LINEFISH SPECIES ARE IN DIRE STRAITS ECOLOGICALLY
THE SMALL PELAGIC FISHERY (PILCHARD (SARDINE) AND ANCHOVY) IS THE LARGEST FISHERY IN SOUTH AFRICA IN TERMS OF VOLUME LANDED

FROM BOAT TO PLATE: LINKING THE SEAFOOD CONSUMER AND SUPPLY CHAIN 9
The aquaculture industry will undoubtedly experience substantial regional growth in the coming years, thus the challenges and lessons learnt globally about sustainable and responsible6 aquaculture should be applied to any new aquaculture ventures in Southern Africa.
Historically focused on high value species such as abalone, mussels and oysters, the South African government has identified aquaculture as an area for expansion.
“Aquaculture’s expansion helps improve the diets of many people, especially in poor rural areas where the presence of essential nutrients in food is often scarce. However, the [State of World Fisheries and Aquaculture] report warns that to continue to grow sustainably, aquaculture needs to become less dependent on wild fish for feeds and introduce greater diversity in farmed culture species and practices.
“For example, small-sized species can be an excellent source of essential minerals when consumed whole. However, consumer preferences and other factors have seen a switch towards larger farmed species whose bones and heads are often discarded”.7
AQUACULTUREWhat is aquaculture?Aquaculture or farming in water is the aquatic equivalent of agriculture or farming on land. Defined broadly, agriculture includes farming both animals (animal husbandry) and plants (agronomy, horticulture and forestry in part). Similarly, aquaculture covers the farming of both animals (including crustaceans, finfish and molluscs) and plants (including seaweeds and freshwater macrophytes). While agriculture is predominantly based on use of freshwater, aquaculture occurs in both inland (freshwater) and coastal (brackish water, seawater) areas.8
6. 2008 Aquaculture production data: Aquaculture production data for 2008 was sourced from the South African department of Agriculture, Forestry and Fisheries (DAFF), the agency responsible for the management of the South African aquaculture industry. 7. FAO. 2014. State of the World Fisheries and Aquaculture. Opportunities and challenges.Available at: http://www.fao.org/3/a-i3720e/index.html.8. FAO. 2014. Aquaculture. Available at: www.fao.org/aquaculture/en.
It is estimated that South Africa contributes about 21% to global abalone production.
1,037 TONNES
11 TONNES
227 TONNES
3 TONNES
737 TONNES
1,834 TONNES
ABALONE
PRAWN
OYSTERS
FINFISH
MUSSELS
SEAWEEDS
In 2008, South African mariculture (the farming of marine species) was comprised of:6

FROM BOAT TO PLATE: LINKING THE SEAFOOD CONSUMER AND SUPPLY CHAIN 10
SEAFOOD ORIGINS AND PRODUCTION
METHODS
Survey respondents were asked if information on the country of origin – or province, in the case of fresh South African fish – and production method of their seafood was available to them. They were also asked whether they ever requested information of this nature.
Provision of information by suppliers on the origin and production methods farmed or wild capture) of the seafood they trade in
Question posed in survey: Are you provided with information on the origin (country, or for fresh fish, South African province) of the fish and the method of production (farmed or wild capture)?
Requests for information by vendors on the origin and production methods (farmed or wild-capture) of the seafood they trade in
Question posed in survey: Where such information is not provided, do you ever request information on the origin of the fish and the method of production (farmed or wild-capture)?
SEAFOOD VENDORS
ALWAYS (80-100%)
MOSTLY (50-80%)
RARELY (0-20%)
N/AOCCASIONALLY (20-50%)
19% 30% 33%15%
3%
ALWAYS (80-100%)
MOSTLY (50-80%)
RARELY (0-20%)
N/AOCCASIONALLY (20-50%)
36%8%
34%19%3%

FROM BOAT TO PLATE: LINKING THE SEAFOOD CONSUMER AND SUPPLY CHAIN 11
Awareness by vendors of capture methods (e.g. trawl, longline) for wild-caught fish
Question posed in survey: For wild-caught fish, are you aware of the capture method used (trawl, long-line etc.)?
ALWAYS (80-100%)
MOSTLY (50-80%)
RARELY (0-20%)
N/AOCCASIONALLY (20-50%)
27%12%
37%11% 13%
were noted to be better informed about origin and capture method, especially those trading in fresh fish.
FISH SHOPS
These results indicate that for the majority of vendors, information on seafood origins, production and capture methods is not considered an important factor in their seafood marketing. It can also be assumed that this is because consumers in the main are not requesting this information.
CONCLUSION
Respondents relied predominantly on the information available on the packaging.
IMPORTED PRODUCTS

THE SOUTH AFRICAN SEAFOOD MARKETWhat are we trading? What are we eating?
IMPORTS FROM NAMIBIA AMOUNT TO 60% OF THE VALUE FOR LIVE, FRESH AND FROZEN FISH, FROM THE TOP TEN IMPORT COUNTRIES
THE BULK OF OUR IMPORTED HAKE IS FROM NAMIBIA AND PRAWNS FROM INDIA
SOUTH AFRICA IMPORTED AN AVERAGE OF 10,300 TONNES
OF SQUID PER YEAR BETWEEN 2000 AND 2010, MAINLY FROM THE FALKLAND ISLANDS, SPAIN, CHINA, TAIWAN AND PERU
ALMOST 50% OF THE SEAFOOD CONSUMED COMES FROM SOUTH AFRICAN FISHERIES, WITH THE REST BEING IMPORTED
2010
SEAFOOD CONSUMED IN SOUTH AFRICA IS DOMINATED BY PILCHARD (SARDINE) AND HAKE, MAKING UP AN ESTIMATED 70%

13FROM BOAT TO PLATE: LINKING THE SEAFOOD CONSUMER AND SUPPLY CHAIN
SUPPLIERS 95 vendors participated in the seafood outlet survey.
SEAFOOD SUPPLY
SOURCES
All commercial rights holders were grouped together, as were non-commercial fishers (including subsistence, recreational, or unknown). Smaller traders who could not be categorised were tallied as “unknown”. “Other fishers” included non-commercial (i.e. subsistence and recreational) fishers. “Specialists” supply a specific type of seafood, e.g. lobsters or oysters. “Independent buyers” include regional “depots” that buy up linefish. Wholesalers and local fish shops are assumed to sell directly to the public, or have thier own retail outlets, as opposed to importers/distributors.
Categories of seafood supply sources for vendors interviewed
WHOLESALERSIMPORTERS/DISTRIBUTORSLOCAL FISH SHOPSFISHING AND WHOLESALERRIGHTS HOLDERSSPECIALISTSUNKNOWNINDEPENDENT BUYERSVENDORS WITH LICENSED BOATSOTHER FISHERS
30%
19%13%
13%
6%
6%6%
3% 2% 2%
SEAFOOD SUPPLIER
DYNAMICS IN THE FOUR
TARGET PROVINCES
GAUTENG1. WHOLESALERS 2. LOCAL FISH SHOPS
Local fish shops ranked highest in Gauteng.
CAPE TOWN METRO1. IMPORTERS/DISTRIBUTORS 2. FISHING AND WHOLESALER (Vertically integrated companies)
The greatest number of independent buyers were recorded in Cape Town Metro.
KWAZULU-NATAL1. WHOLESALERS2. RIGHTS HOLDERS
Rights holders ranked highest in KwaZulu-Natal.
EASTERN CAPE1. FISHING AND WHOLESALER (Vertically integrated companies) 2. WHOLESALERS
In the Eastern Cape, the supply source is dominated by a small number of vertically integrated companies.
SEAFOOD SUPPLIERS IDENTIFIED NATIONALLY
SOURCE OF SEAFOOD MOST FREQUENTLY DESCRIBED BY VENDORS PER PROVINCE
WHOLESALERS30%
IMPORTERS AND DISTRIBUTORS
19%LOCAL FISH SHOPS, AND FISHING AND WHOLESALER COMPANIES
13%
14 FROM BOAT TO PLATE: LINKING THE SEAFOOD CONSUMER AND SUPPLY CHAIN
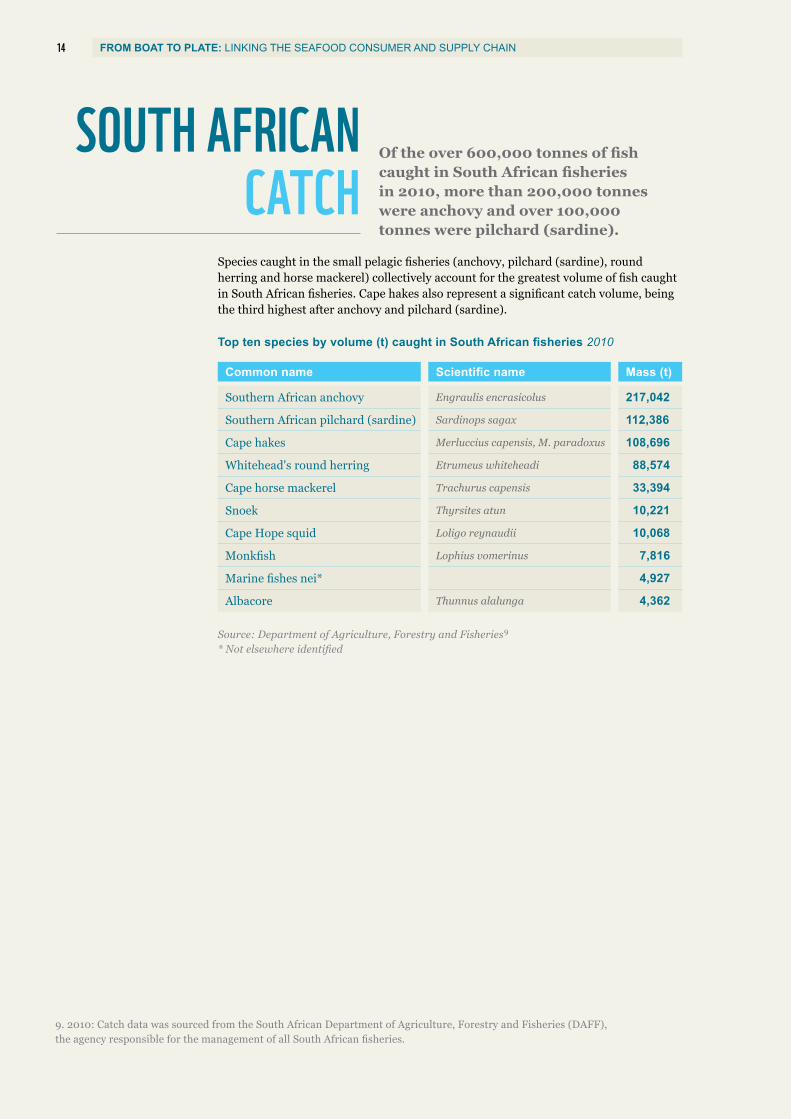
SOUTH AFRICAN CATCH
Of the over 600,000 tonnes of fish caught in South African fisheries in 2010, more than 200,000 tonnes were anchovy and over 100,000 tonnes were pilchard (sardine).
Common name Scientific name Mass (t)
Southern African anchovy Engraulis encrasicolus 217,042
Southern African pilchard (sardine) Sardinops sagax 112,386
Cape hakes Merluccius capensis, M. paradoxus 108,696
Whitehead's round herring Etrumeus whiteheadi 88,574
Cape horse mackerel Trachurus capensis 33,394
Snoek Thyrsites atun 10,221
Cape Hope squid Loligo reynaudii 10,068
Monkfish Lophius vomerinus 7,816
Marine fishes nei* 4,927
Albacore Thunnus alalunga 4,362
Top ten species by volume (t) caught in South African fisheries 2010
Source: Department of Agriculture, Forestry and Fisheries9
* Not elsewhere identified
Species caught in the small pelagic fisheries (anchovy, pilchard (sardine), round herring and horse mackerel) collectively account for the greatest volume of fish caught in South African fisheries. Cape hakes also represent a significant catch volume, being the third highest after anchovy and pilchard (sardine).
9. 2010: Catch data was sourced from the South African Department of Agriculture, Forestry and Fisheries (DAFF), the agency responsible for the management of all South African fisheries.

15FROM BOAT TO PLATE: LINKING THE SEAFOOD CONSUMER AND SUPPLY CHAIN
CATCH AND INTERNATIONAL
TRADE
International trade has a dynamic impact on the amount and value of marine resources available on the local market. In 2010, 624,078 tonnes of fish were caught in all South African fisheries. 1,991 tonnes were produced through marine aquaculture operations.
prawns, rock lobster, crabs
CRUSTACEANShake, snoek, tuna, kingklip, anchovy, pilchard (sardine), horse mackerel
FISHsea cucumbers, jellyfish, sea urchins
OTHER MARINE INVERTEBRATESabalone, mussels,
oysters
MOLLUSCS
South African seafood exports by value (ZAR): live, fresh and frozen fish, crustaceans, molluscs and other aquatic invertebrates 2010 – top ten importing countries
Source: UN COMTRADE. 2012. www.comtrade.un.org* Hong Kong Special Administrative Region of the People’s Republic of China
EXPORTVALUE
3%
27%
19%19%
7%
6%
6%5%
4% 4% SPAINITALYHONG KONG*USAAUSTRALIAPORTUGALJAPANCHINAFRANCEUNITED KINGDOM
R3,312,577,303 R279,812,5652010 2010
live, fresh and frozen fish, crustaceans, molluscs and other aquatic invertebrates
prepared or preserved fish, crustaceans, molluscs and other aquatic invertebrates
Trade data: South African export and import data was sourced from South African Revenue Service (SARS) for the period 2000-2010. SARS is the revenue and customs agency for South Africa, and among other revenue duties, SARS performs an important role in the regulation and monitoring of international and local trade. Part of their mandate is to police trade, collect duties and taxes, and to regulate the import and export of commodities.
16 FROM BOAT TO PLATE: LINKING THE SEAFOOD CONSUMER AND SUPPLY CHAIN
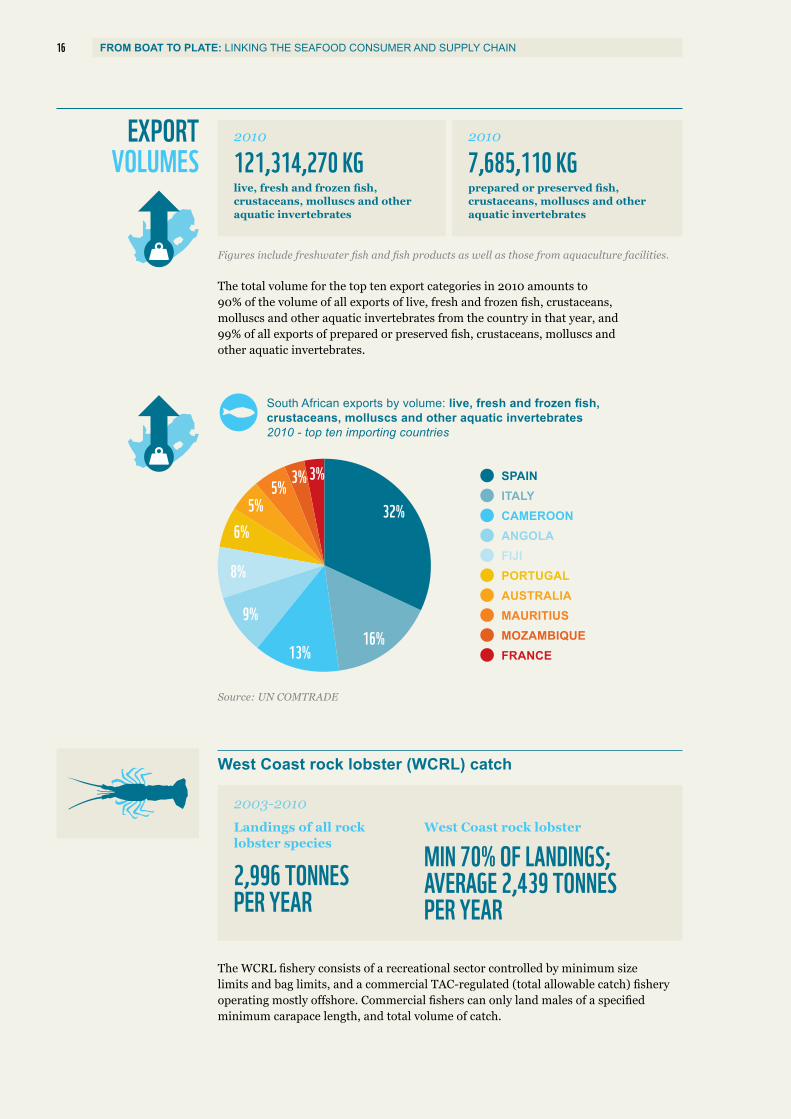
EXPORT VOLUMES 121,314,270 KG 7,685,110 KG
2010 2010
live, fresh and frozen fish, crustaceans, molluscs and other aquatic invertebrates
Figures include freshwater fish and fish products as well as those from aquaculture facilities.
The total volume for the top ten export categories in 2010 amounts to 90% of the volume of all exports of live, fresh and frozen fish, crustaceans, molluscs and other aquatic invertebrates from the country in that year, and 99% of all exports of prepared or preserved fish, crustaceans, molluscs and other aquatic invertebrates.
prepared or preserved fish, crustaceans, molluscs and other aquatic invertebrates
South African exports by volume: live, fresh and frozen fish, crustaceans, molluscs and other aquatic invertebrates 2010 - top ten importing countries
Source: UN COMTRADE
32%
16%13%
9%
8%
6%5%
5% 3% 3% SPAINITALYCAMEROONANGOLAFIJIPORTUGALAUSTRALIAMAURITIUSMOZAMBIQUEFRANCE
MIN 70% OF LANDINGS;AVERAGE 2,439 TONNES PER YEAR
West Coast rock lobster
2,996 TONNES PER YEAR
Landings of all rock lobster species
2003-2010
West Coast rock lobster (WCRL) catch
The WCRL fishery consists of a recreational sector controlled by minimum size limits and bag limits, and a commercial TAC-regulated (total allowable catch) fishery operating mostly offshore. Commercial fishers can only land males of a specified minimum carapace length, and total volume of catch.

17FROM BOAT TO PLATE: LINKING THE SEAFOOD CONSUMER AND SUPPLY CHAIN
Frozen rock lobster exports 2000-2010
Source: South African Revenue Service
Rock lobster exports
1,600
1,400
1,200
1,000
800
600
400
200
0
700
600
500
400
300
200
100
0
2000
2001
2002
2003
2004
2005
2006
2007
2008
2009
2010
Tonnes R/kg
EXPORT QUANTITY (KG) VALUE (R/KG)
Values rose substantially to just under R600 per kg (almost double the 2008 value) but dropped dramatically in 2010. The reason for the significant price increase in 2009 is not known.
2008 and 2009
Fresh or live rock lobster
Products show an overall, though not consistent, increase in export quantity and value since 2000, and since 2008, have exceeded the volume of frozen rock lobster exports.
Frozen rock lobster: Market destinations 2000-2010
Fresh rock lobster: Market destinations 2000-2010
Source: South African Revenue Service Source: South African Revenue Service
JAPAN
ITALY
CHINA
FRANCESPAIN
TAIWANPORTUGAL
OTHER
19%
10%
10%
6%2% 2% 1%2%
HONG KONG48%
JAPAN
OTHER
HONG KONG
CHINAITALY
FRANCE
UNITED STATES
46%
6%3%
3% 2%
37%
3%

18 FROM BOAT TO PLATE: LINKING THE SEAFOOD CONSUMER AND SUPPLY CHAIN
NOTABLE
Some, but not all hake available on the local market, has been certified by the Marine Stewardship Council (MSC). South African trawled hake is MSC certified, which automatically places it on the WWF-SASSI Green-list.
Main export markets for South African trawled hake: Spain (frozen fish and fillets); France, Portugal, Italy, Australia and the USA (frozen fillets); and Germany, Spain and France (chilled, fresh hake). In the USA, South African hake is often marketed as “Cape capensis”.
Catch data was sourced from the South African Department of Agriculture, Forestry and Fisheries (DAFF), the agency responsible for the man-agement of all South African fisheries. For the majority of fisheries, catch data was only available for the period 2003-2010.
Pilchard (sardine) exports
16,049 TONNES FROZEN
Exports are less than 20% of the total pilchard (sardine) catch. Export average:
603 TONNES FRESH
9,454 TONNES PRESERVED
Export destinations: Malaysia, Mauritius
2000-2010
Source: South African Revenue Services and UN COMTRADE (2010)
Hake catchAn average of 130,000 tonnes of hake is landed annually in South Africa from the trawl, longline and handline fisheries combined, with more than 90% of this catch coming from the hake trawl fishery. Within the trawl fisheries, the offshore fishery accounts for the majority of catches.
Hake exports
Exports by mass 2000-2010
60,000,000
50,000,000
40,000,000
30,000,000
20,000,000
10,000,000
0
Mass (kg)
Top five EU importers by volume 2000-2010
FRESH FROZEN FROZEN FILLETS FROZEN MEAT
64%
4%
13%
15%
4%
TOP IMPORTER: SPAIN
SPAINITALYPORTUGALFRANCEGERMANY
2000
2001
2002
2003
2004
2005
2006
2007
2008
2009
2010

19FROM BOAT TO PLATE: LINKING THE SEAFOOD CONSUMER AND SUPPLY CHAIN
Anchovy exports
90 TONNES Export average per year:
86% OF ALL ANCHOVY EXPORTSANCHOVY BLOCKS AND DRIED ANCHOVY MAKE UP
2000-2010
Top Ten South African exports by volume (kg): live, fresh and frozen fish, crustaceans, molluscs and other aquatic invertebrates 2010
Source: South African Revenue Service
Description Mass (kg)
Fish, frozen, other 26,145,479
Fish fillets, frozen, other 17,476,362
Pilchard (sardine), frozen 16,017,645
Cuttlefish, squid, other 13,993,888
Fish, fresh or chilled, other 10,711,500
Hake, frozen 10,183,550
Albacore, frozen 6,651,520
Octopus, other 3,041,157
Fish flours, meals, pellets, fit for human consumption 2,751,804
Mackerel, frozen 2,023,534
TOTAL 108,996,439
Top ten South African exports by volume (kg): prepared or preserved fish, crustaceans, molluscs and other aquatic invertebrates 2010
Source: UN COMTRADE* Not elsewhere specified
Description Mass (kg)
Fish nes*, prepared or preserved, not minced 2,517,908
Pilchard (sardine), brisling, sprat prepared or preserved, not minced 2,023,518
Herring, prepared or preserved, not minced 1,212,434
Fish prepared or preserved, except whole, in pieces 886,806
Molluscs and shellfish nes*, prepared or preserved 427,375
Mackerel, prepared or preserved, not minced 324,514
Tuna, skipjack, bonito, prepared or preserved, not minced 205,899
Shrimps and prawns, prepared or preserved 53,222
Salmon prepared or preserved, not minced 13,921
Anchovy, prepared or preserved, not minced 11,326
TOTAL 7,676,923

20 FROM BOAT TO PLATE: LINKING THE SEAFOOD CONSUMER AND SUPPLY CHAIN
IMPORTVALUE R1,616,973,540 R987,252,428
2010 2010
live, fresh and frozen fish, crustaceans, molluscs and other aquatic invertebrates
prepared or preserved fish, crustaceans, molluscs and other aquatic invertebrates
Top ten South African imports by value (ZAR): live, fresh and frozen fish, crustaceans, molluscs and other aquatic invertebrates 2010
Source: South African Revenue Service
Description Value (ZAR)
Fish, frozen, other 352,341,913
Shrimps, prawns 260,571,078
Hake, frozen 175,520,044
Mackerel, frozen 150,288,320
Fish fillets, frozen, other 146,654,590
Cuttlefish, squid, other 123,686,953
Fish meat, frozen 104,190,603
Salmon, fresh or chilled 47,999,321
Anchovy blocks 32,581,159
Fish, fresh or chilled 28,031,328
TOTAL 1,421,865,309
Source: UN COMTRADE
South African seafood imports by value (ZAR): live, fresh and frozen fish, crustaceans, molluscs and other aquatic invertebrates 2010 – top ten source countries
NAMIBIAINDIANEW ZEALANDNORWAYCHINATHAILANDARGENTINASPAINMOZAMBIQUEPERU
3% 3% 2%1%
60%
10%
6%
6%
5%4%
21FROM BOAT TO PLATE: LINKING THE SEAFOOD CONSUMER AND SUPPLY CHAIN
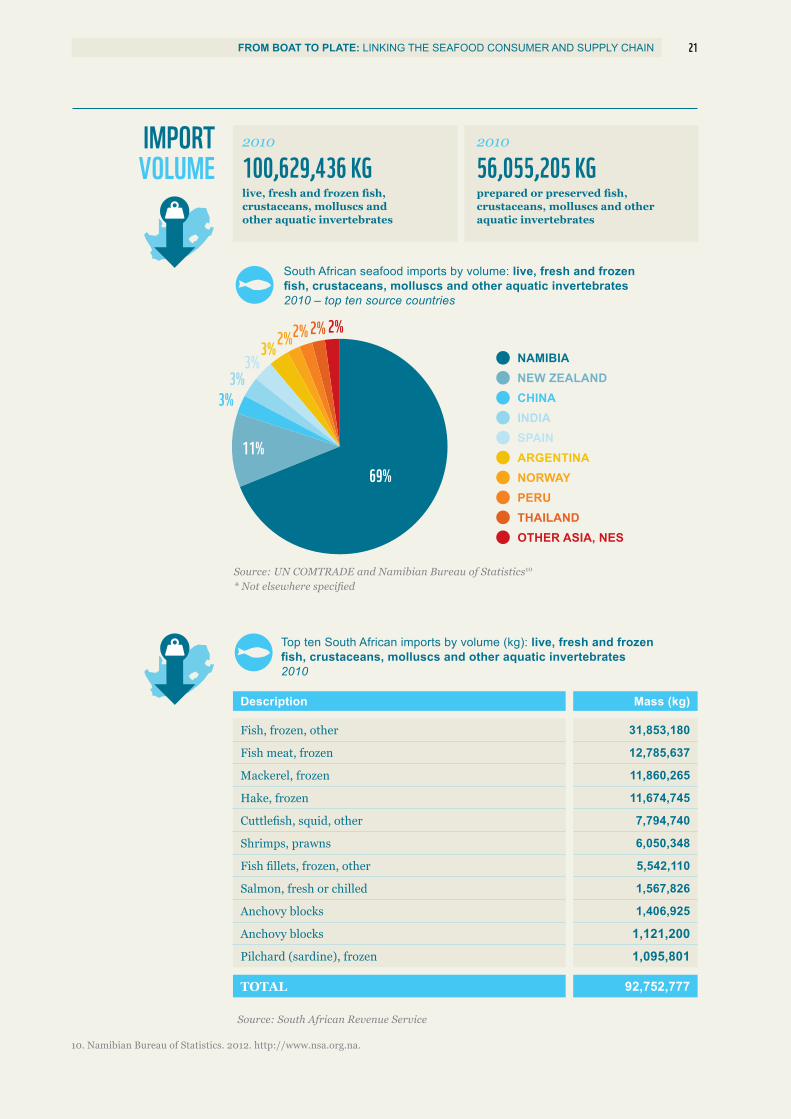
IMPORTVOLUME
Top ten South African imports by volume (kg): live, fresh and frozen fish, crustaceans, molluscs and other aquatic invertebrates 2010
Source: South African Revenue Service
Description Mass (kg)
Fish, frozen, other 31,853,180
Fish meat, frozen 12,785,637
Mackerel, frozen 11,860,265
Hake, frozen 11,674,745
Cuttlefish, squid, other 7,794,740
Shrimps, prawns 6,050,348
Fish fillets, frozen, other 5,542,110
Salmon, fresh or chilled 1,567,826
Anchovy blocks 1,406,925
Anchovy blocks 1,121,200
Pilchard (sardine), frozen 1,095,801
TOTAL 92,752,777
10. Namibian Bureau of Statistics. 2012. http://www.nsa.org.na.
South African seafood imports by volume: live, fresh and frozen fish, crustaceans, molluscs and other aquatic invertebrates 2010 – top ten source countries
Source: UN COMTRADE and Namibian Bureau of Statistics10
* Not elsewhere specified
NAMIBIANEW ZEALANDCHINAINDIASPAINARGENTINANORWAYPERUTHAILANDOTHER ASIA, NES
69%11%
3%3%
3%3%
2%2%2%2%
100,629,436 KG 56,055,205 KG2010 2010
live, fresh and frozen fish, crustaceans, molluscs and other aquatic invertebrates
prepared or preserved fish, crustaceans, molluscs and other aquatic invertebrates

22 FROM BOAT TO PLATE: LINKING THE SEAFOOD CONSUMER AND SUPPLY CHAIN
South African seafood imports
69%NAMIBIA
11%NEW-ZEALAND
3% EACHCHINA, INDIA, SPAIN, ARGENTINA
South African seafood imports by volume: live, fresh and frozen fish, crustaceans, molluscs and other aquatic invertebrates 2010 – top ranking source countries (89% of total volume)
Anchovy imports
2,000 TONNES Import average:
Import origins: US, Argentina, Norway
2007-2010
FROZEN ANCHOVY BLOCKS
15 TONNES Import origins: Chile, Argentina
DRIED ANCHOVY
South Africa imported hake from more than 15 countries:
2000-2010
MORE THAN 95% OF HAKE IMPORTS CAME FROM NAMIBIA2007 ONWARD
Imports of hake from countries other than Namibia appear to be increasing:
ARGENTINA2002 201010 KGS ALMOST 1,000 TONNES
Hake imports

23FROM BOAT TO PLATE: LINKING THE SEAFOOD CONSUMER AND SUPPLY CHAIN
Pilchard (sardine) imports
Source: South African Revenue Service
796 TONNESImport average:
Import origins: Spain and Taiwan
2000-2010
FRESH AND FROZEN
22,925 TONNES Import origins: Thailand
PRESERVED (CANNED)
Squid importsSquid imports have remained fairly stable over the last decade.
10,300 TONNES
Import average per year
2000-2010
R13 PER KG
Average value
2000-2010
11,300 TONNES
Import average per year
2003-2010
Source: South African Revenue Service
South African imports of frozen squid 2000-2010
TAIWANSPAINCHINAPERUFALKLAND ISLANDS
28%
25%17%
16%
14%
Source: UN COMTRADE and South African Revenue Service

24 FROM BOAT TO PLATE: LINKING THE SEAFOOD CONSUMER AND SUPPLY CHAIN
Prawn imports
Import average per year
4,700 TONNES FROZEN
2000-2010
37 TONNES LIVE
2003-2010
1,900 TONNES PRESERVED
2003-2010
Imports of frozen prawns, the largest by volume of the three traded forms, have increased more than three-fold from 2003 to 2010.
South African imports of frozen prawns 2000-2010
INDIAMOZAMBIQUETHAILANDCHINAMALAYSIATANZANIASINGAPOREHONDURASARGENTINA
South African imports of canned tuna 2000-2010
Tuna, canned imports
5,500 TONNES 12,300 TONNES
Approximately Approximately2000 2010
Imports increase of
MORE THAN 100%
Source: UN COMTRADE* Not elsewhere specified
THAILANDPHILIPPINESINDONESIAASIA, NES*
1% 1%
75%
23%
Source: South African Revenue Service
3%3% 1% 1% 1% 1%
62%16%
12%

25FROM BOAT TO PLATE: LINKING THE SEAFOOD CONSUMER AND SUPPLY CHAIN
South African imports of canned salmon 2000-2010
Source: UN COMTRADE
Canned salmon imports into South Africa have experienced some fluctuations over the 2000-2010 period with an apparent trend toward increased import volumes.
Salmon, canned imports
USACANADAREPUBLIC OF KOREACHINATHAILANDCHILEUNITED KINGDOMNORWAYOTHER
76%
8%
5%4%
2%2% 1%1%1%
11. Markus Burgener, in litt. to Deborah Cooper. 2014.
2003-2010 average = 13,000 tonnes
Italy, Spain, Greece, Japan, Portugal account for 88%Average value: R34 per kg
9,700 TONNES PER YEAR
2003-2010, DAFF9,200 TONNES LANDED PER YEAR
Approximately
Exports
2000-2010
2003-2010 average = 11,300 tonnes
Falkland Islands, Spain, China, Taiwan, Peru account for 76%Average value: R13 per kg
10,300 TONNES PER YEAR
Imports
2000-2010
THE KEY FACTOR IS PROFITWhere the value that a seafood species attracts in an offshore market is far greater than its value on the local market, the species is exported as the return is proportionally greater. To meet the local demand, a lower value substitute is then imported.
EXPORT VOLUMES SOMETIMES EXCEED CATCHIn South Africa, some of the squid that is imported is subsequently exported. In the case of squid, the price for importing is much lower than what we can get from exporting, as the species of squid that we catch for export is highly valued in Spain and Italy. The squid (locally called calamari) that we eat in South Africa is almost all imported, coming predominantly from fisheries based in the Falkland Islands.
SQUID TRADE BASICS11
Why are we importing the same seafood that we export?

26 FROM BOAT TO PLATE: LINKING THE SEAFOOD CONSUMER AND SUPPLY CHAIN
MARKET TRENDSDRIVERS OF
SEAFOOD TRADE
Both seafood supply and demand appear to be driving seafood trade trends. Fish and seafood market trends in South Africa are largely influenced by market price, species availability, and ease of accessibility for consumers. Increasingly, market trends are influenced by consumer awareness programmes like WWF-SASSI, and eco-labels like the Marine Stewardship Council (MSC).
Seafood demandDemand for seafood in general appears to be stable or increasing for the majority of seafood vendors, with only a small number reporting a decline in demand. Some of the most traded species in our market are imported and from aquaculture operations. As such there is consistency in price and availability, facilitating stock and menu planning compared with local species that are often very inconsistent when it comes to price, availability and quality.
Seafood availabilityFeedback from restaurants and fish outlets indicates that most vendors are experiencing decreased availability of seafood. The increased supply of seafood, with specific mention of hake, was noted by some outlets. This appears to be attributed to the collapse of the hake export market as a result of the global economic downturn.
Sustainable procurementKey South African seafood supply chain role players (retailers, restaurants, markets, suppliers and fish shops), the media and consumers have the buying power and influence to uphold sustainability in what is caught and distributed on the local market. The recovery of our fish stocks needn’t be at the expense of fishers’ livelihoods. Healthy fish stocks mean a better deal for both marine ecosystems and those who rely on them. Supporting fisheries/farms that are engaged in credible time-bound improvement projects helps to drive positive change globally.
RETAILERS
SHOPS AND MARKETS
RESTAURANTS

27FROM BOAT TO PLATE: LINKING THE SEAFOOD CONSUMER AND SUPPLY CHAIN
SPECIES COMPOSITION
Surveys were conducted among 147 restaurants, fish shops and markets, and retailers, to determine species composition.
The majority of the outlets participated, with 95 responding in full.
For retailers, only fresh seafood was considered due to the large number of frozen, canned, and value-added products from the same producers.
Respondents: Eastern Cape, Gauteng, KwaZulu-Natal, Western Cape Note: Figures represent responses from 95 seafood vendors
Ranking of seafood species traded
LINEFISH, VARIOUS 10
OYSTERS 11
DORADO 21
CALAMARI 48
YELLOWTAIL 9
GEELBEK 10
CRAYFISH 11
TUNA 17
PRAWNS 54
KOB 21
SOLE 26
KINGKLIP 44
NORWEIGIAN SALMON 24
MUSSELS 35
HAKE 59
ANGELFISH 3SWORDFISH 3
GURNARD 11
OF THE TOP TWO SPECIES TRADED ON OUR MARKETS IN SOUTH AFRICA, PRAWNS ARE MOSTLY IMPORTED, AND A LARGE AMOUNT OF THE HAKE.Much of our imported hake is from Namibia and some of our prawns are from Mozambique. Our importance as an import destination for these commodities is an opportunity for us to influence the environmental sustainability performance of the source fisheries.
95RESPONDENTS

28 FROM BOAT TO PLATE: LINKING THE SEAFOOD CONSUMER AND SUPPLY CHAIN
Comparison of number of outlets stocking the highest ranking species traded, per outlet category
Please note: The majority of surveys conducted for retailers were specific to their fish counters and did not necessarily incorporate their frozen and canned ranges. Statistics based on the 147 surveys conducted.
FOUND IN ALL THREE CATEGORIES, NAMELY RESTAURANTS, SHOPS AND MARKETS, AND RETAILERS Hake, squid (calamari), kingklip, prawns, salmon, sole, kob, red roman, butterfish, yellowtail
FOUND IN RESTAURANTS ONLY Dorado, geelbek (Cape salmon), oysters
FOUND IN SHOPS AND MARKETS ONLY Shrimp, monk, silver fish (silvers), crab, scallops, herring, mackerel
FOUND IN RETAILERS ONLY White stumpnose, deep water grunter,12 trout
Trade dynamics are closely linked to product price, and the socio-economic profiles of the different consumer groups.
Why is the picture so different for restaurants, shops and markets, and retailers?
OYSTERS
GEELBEK
TROUT
DORADO
DEEP WATER GRUNTER
WHITE STUMPNOSE
YELLOWTAIL
MACKEREL
HERRING
BUTTERFISH
SCALLOPS
CRAB
SILVER FISH
RED ROMAN
MONK
SHRIMP
ROCK LOBSTER
ANGELFISH
KOB
TUNA
SNOEK
SOLE
SALMON
PRAWNS
KINGKLIP
MUSSELS
SQUID
HAKE
SHOPS AND MARKETS
39 surveys conducted
RETAILERS35 surveys conducted
RESTAURANTS73 surveys conducted
0 20 40 60 80 100
12. Species not certain, however there is a high probability of this being one of various species of gurnard (Chelidonichthys sp.). The Afrikaans common fish name “knorhaan” is often used to describe both spotted grunter (caught predominantly in estuaries) and various species of gurnard (caught predominantly in deep-sea fisheries); therefore the definition of “deep water grunter” may be the result of a direct translation of “diepwater knorhaan”.

Seafood outlets (%)0 20 40 60 80 100
29FROM BOAT TO PLATE: LINKING THE SEAFOOD CONSUMER AND SUPPLY CHAIN
Breakdown of estimated volume of seafood traded by 62 restaurants in South Africa on a monthly basis – top ten products (representing 86% of total estimated volume traded)
Breakdown of estimated volume of seafood traded by 10 small independent fish shops (including seafood markets surveyed) in South Africa on a monthly basis – top ten products (representing 95% of total estimated volume traded)
Menu composition: three (prawns, squid and Norwegian salmon) of these top four species and species groups (collectively making up 72% of the top ten), are comprised almost entirely of imported products and for the fourth (hake) there are known imports from Namibia and other countries.
Fish shop dynamics are very different from those for restaurants. Hake comprises more than half (55%) of estimated volume, followed by kob and kingklip. Squid only comprises 5% and prawns 2% of estimated volume.
55%
15%
12%
5%4%
3%
1%1%2%2%
13%
15%
21%
23%
6%
3%4%4%5%
6%
PRAWNSSQUIDHAKESALMON, NORWEIGIANKINGKLIPDORADOTUNA, YELLOWFINMUSSELSKOBSOLE
HAKEKOBKINGKLIPSQUID, CALAMARICAPE SALMONSOLEPRAWNSSALMON, NORWEGIAN AND SCOTTISHYELLOWTAILMUSSELS
Restaurants
Fish shops
Volume and value figures for seafood products imported from Namibia are based on export figures for these products from Namibia as reported by the Namibian Bureau of Statistics. All other import figures are as reported by the South African Revenue Service or UN COMTRADE.
30 FROM BOAT TO PLATE: LINKING THE SEAFOOD CONSUMER AND SUPPLY CHAIN
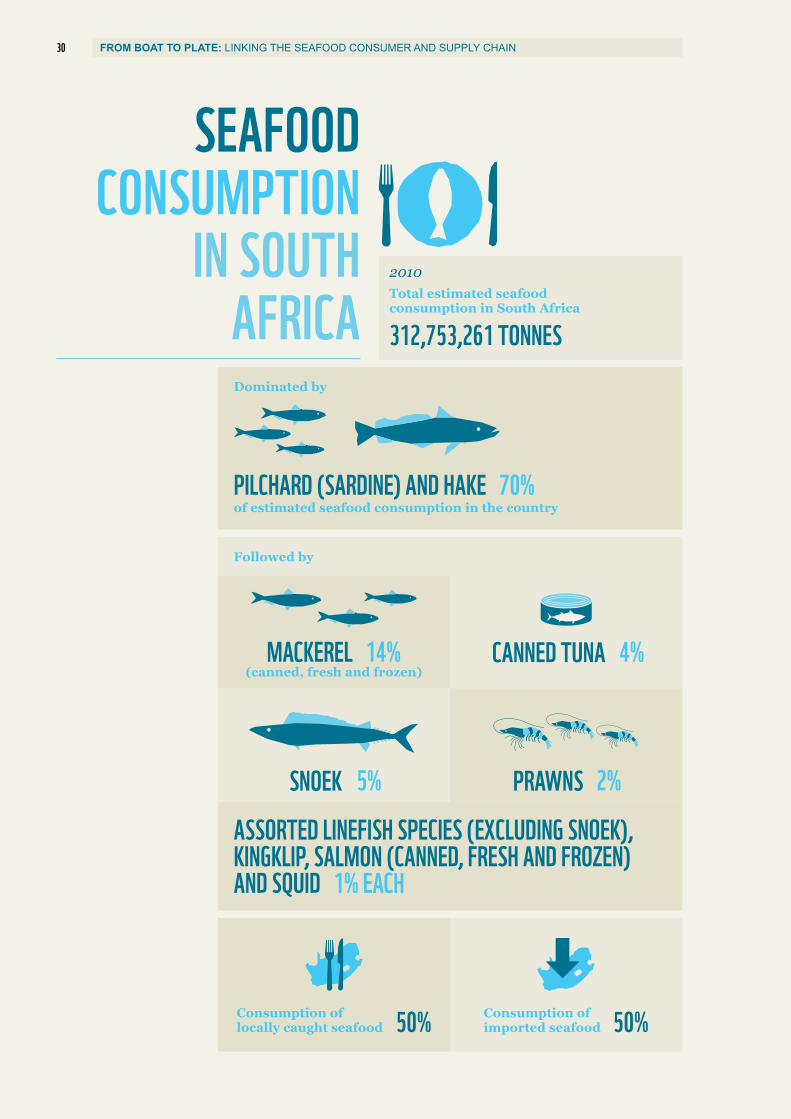
SEAFOOD CONSUMPTION
IN SOUTH AFRICA 312,753,261 TONNES
Total estimated seafood consumption in South Africa
2010
Dominated by
PILCHARD (SARDINE) AND HAKE 70%of estimated seafood consumption in the country
ASSORTED LINEFISH SPECIES (EXCLUDING SNOEK), KINGKLIP, SALMON (CANNED, FRESH AND FROZEN) AND SQUID 1% EACH
Followed by
CANNED TUNA 4%MACKEREL 14% (canned, fresh and frozen)
PRAWNS 2%SNOEK 5%
50%Consumption of imported seafood50%Consumption of
locally caught seafood

31FROM BOAT TO PLATE: LINKING THE SEAFOOD CONSUMER AND SUPPLY CHAIN
Estimated seafood consumption (kg) in South Africa – top ten products 2010
Catch data – Department of Agriculture, Forestry and Fisheries Imports and exports – South African Revenue Service, UN COMTRADE, Eurostat and Namibian Bureau of Statistics* This figure is an estimate based on the following: Reported catch of barracouta in 2010 was 28,450,694 kg (New Zealand Ministry of Fisheries, 2012). Statistics New Zealand notes that 25% of barracouta go to South Africa. There is limited domestic consumption. Until further information on exports is obtained, South African imports of New Zealand snoek have been estimated at 20% of catch in 2010: 5,690,139 kg. ** Exports of squid from South Africa exceeded catches of squid in South Africa for this period; this either indicates the possibility of IUU fishing or that a component of the imported squid product is being re-exported.
PILCHARD (SARDINE)
HAKE
MACKEREL (FRESH, FROZEN AND CANNED)
SNOEK (LOCAL AND NEW ZEALAND)
TUNA (CANNED)
PRAWNS
LINEFISH (EXCLUDING SNOEK)
SQUID
SALMON (FRESH, FROZEN AND CANNED)
KINGKLIP
112,386,000 18,041,163 36,681,223
108,696,000 31,322,900 11,674,745
33,394,000 2,348,048 11,860,265
10,221,000 5,690,139*
12,355,641
66,190 145,833 6,050,348
4,410,545
10,068,000 13,993,888** 7,794,740
13,921 3,591,344
2,685,297
Catch (kg)
Export (kg)
Import (kg)
131,026,060
89,047,845
15,911,139
2,685,297
3,577,423
4,410,545
5,970,705
3,868,852
12,355,641
Seafood consumption
(kg)
42,906,217
PILCHARD (SARDINE)
HAKE
MACKEREL (FRESH, FROZEN AND CANNED)
SNOEK (LOCAL AND NEW ZEALAND)
TUNA (CANNED)
PRAWNS
LINEFISH (EXCLUDING SNOEK)
SQUID
SALMON (FRESH, FROZEN AND CANNED)
KINGKLIP
32 FROM BOAT TO PLATE: LINKING THE SEAFOOD CONSUMER AND SUPPLY CHAIN
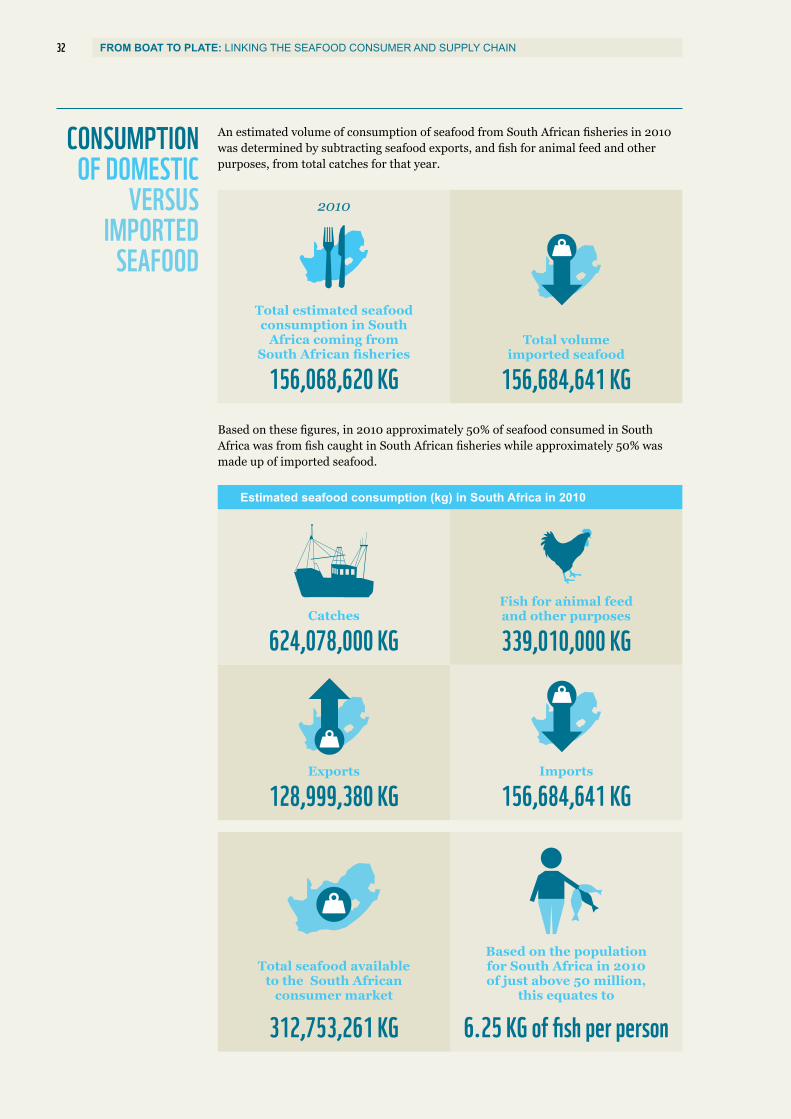
CONSUMPTION OF DOMESTIC
VERSUS IMPORTED
SEAFOOD
An estimated volume of consumption of seafood from South African fisheries in 2010 was determined by subtracting seafood exports, and fish for animal feed and other purposes, from total catches for that year.
Based on these figures, in 2010 approximately 50% of seafood consumed in South Africa was from fish caught in South African fisheries while approximately 50% was made up of imported seafood.
Estimated seafood consumption (kg) in South Africa in 2010
624,078,000 KG
156,068,620 KG
Catches
Total estimated seafood consumption in South
Africa coming from South African fisheries
339,010,000 KGFish for animal feed and other purposes
156,684,641 KGTotal volume
imported seafood
128,999,380 KGExports
156,684,641 KGImports
312,753,261 KG
Total seafood available to the South African
consumer market
6.25 KG of fish per person
Based on the population for South Africa in 2010 of just above 50 million,
this equates to
2010

33FROM BOAT TO PLATE: LINKING THE SEAFOOD CONSUMER AND SUPPLY CHAIN
Estimated seafood supply per person (kg/year)
13. FAO. 2014. State of the World Fisheries and Aquaculture. Opportunities and challenges. Available at:http://www.fao.org/3/a-i3720e/index.html.
Average annual consumption of fish per person globally
5.2 KG (PROCESSED WEIGHT)13
Capture fisheries and aquaculture supplied the world with about
158 MILLION TONNES OF FISH
2012
Of this, 120 million tonnes was used as human food, providing an estimated supply per person of about 19 kg (live weight equivalent).
Seychelles 61Japan 61Spain 45France 34United States 27China 26Italy 25Australia 22
Indonesia 21Mauritius 20United Kingdom 16Namibia 13Tanzania 7Mozambique 5India 5
SUSTAINABILITYHow do we positively transform seafood trade?
TO ENSURE ABUNDANT FISH STOCKS FOR THE FUTURE IT IS VITAL TO KEEP ECOSYSTEMS BALANCED AND HEALTHY
VENDORS CAN IDENTIFY SEAFOOD SUSTAINABILITY RISKS IN PROCUREMENT AND PASS ON PRODUCT KNOWLEDGE TO THEIR CUSTOMERS
CONSUMERS CAN ASK QUESTIONS WHEN ORDERING AND PURCHASING SEAFOOD

FROM BOAT TO PLATE: LINKING THE SEAFOOD CONSUMER AND SUPPLY CHAIN 35
COMPLIANCE AND ILLEGAL
SEAFOOD TRADE“Fish is among the most traded food commodities worldwide … fisheries and fish farming are playing an increasingly critical role for many local economies”.14
WHAT ARE WE DOING IN
SOUTH AFRICA?
FAO advocates the responsible use of aquatic resources and habitat conservation to help boost the sector’s contribution to food security, poverty alleviation and human well-being.
A Code of Conduct for responsible SA fisheries has recently been developed to help with promoting conservation in the local fishing industry. Based on the principles for a responsible fishery as espoused by FAO, this code of conduct serves as a generic template for local fisheries by outlining the approach to various issues such as pollution, habitat loss, bycatch, discarding of waste, and overfishing. Steering the seafood industry toward responsible fishing practises will, in turn, ensure the sustainable harvesting of marine resources in harmony with the environment.
DRIVERS OF CHANGE IN THE
SOUTH AFRICAN SEAFOOD
SECTOR
Survey respondents indicated that improved monitoring and regulation of landings, suppliers and traders was the key driver for positive change in the South African seafood sector. Awareness by consumers, suppliers and restaurants was given as a driver of improved compliance. Socio-economic factors were ventured as the major driver behind negative changes, i.e. decreasing compliance, with particular reference being made to money or greed.
The most prevalent recommendation made for reducing illegal trade was increased or stricter monitoring of suppliers and restaurants by inspectors. Also noted were the need for stricter regulations and penalties and increased consumer awareness.
14. FAO. 2014. State of the World Fisheries and Aquaculture. Opportunities and challenges. Available at:http://www.fao.org/3/a-i3720e/index.html.

FROM BOAT TO PLATE: LINKING THE SEAFOOD CONSUMER AND SUPPLY CHAIN 36
Familiarity with the South African Marine Living Resources Act 18 of 1998 (MLRA)
Awareness of the laws applicable to seafood trade in South Africa appears to be low. It is encouraging that, based on comparisons with surveys conducted in 2002 and 2005 in Durban and Cape Town respectively, knowledge of the MLRA appears to have increased in Cape Town but it is a concern that the opposite is true of Durban. With regard to awareness of no-sale species, on the other hand, Cape Town results are worrying as they indicate the possibility of an increase in trade with recreational fishers, while results from Durban indicate a marked change for the better.
NOTABLE
While declared knowledge of the MLRA and possession of the Regulations to the Act are poor, the relatively improved awareness of no-sale species indicates at least some knowledge of the reasons for the regulations, and the provisions of the MLRA.
What is the MLRA?
FOR SEAFOOD DEALERSThe Marine Living Resources Act (MLRA) and its amendments determine how we utilise our seafood resources. Key points relating to seafood dealers include the following:
• Permits are needed for the harvesting, selling, importing or exporting of marine resources (Section 13(1)).
• Recreational fishers may not sell their catch (Section 20(1)).• Specific regulations are in place for the management of certain species and
fisheries, such as size and bag limits, closed seasons and no-sale species.• The act allows for penalties of up to R2 million or five years’ imprisonment
for infringements.• It is necessary to be in possession of the correct import permits for seafood
from other countries. These are issued by the Department of Agriculture, Forestry and Fisheries (DAFF, Fisheries Division) and the International Trade Administration Commission of South Africa (ITAC).
57% NOT FAMILIARRespondents expect their suppliers to have knowledge of the relevant legislation.
35% FAMILIARRespondents aware of the act but not of the specific provisions.
8% NO CLEAR INDICATION
Restaurants and seafood outlets were asked about their knowledge of South African legislation applicable to the trade in fish and fish products; their past, current and possible future trade practises with regard to no-sale species or purchases from recreational fishers; and their impressions of compliance within the South African seafood trade sector.
RETAILERS
SHOPS AND MARKETS
RESTAURANTS

FROM BOAT TO PLATE: LINKING THE SEAFOOD CONSUMER AND SUPPLY CHAIN 37
Ease of interpreting the MLRA by seafood buyers, sellers and importers
16% EASY21% UNSURE
63% UNABLE TO RESPONDRespondents did not have a copy of the act.
Possession of the MLRA regulations
6%of respondents had a copy of the regulations applicable to seafood dealers.
94%of respondents stated that they either didn’t have the regulations, or felt that the question was not applicable.
NOTABLE
Eight of the ninety five respondents answering ‘“No” to this question appeared to confuse the MLRA Regulations with WWF-SASSI.
64%Aware of why the restrictions on the sale of recreationally-caught and no-sale species exist.
11% Not aware.
23% Felt the question was not applicable.
Reasons for no-sale and recreational fisher provisions
What constitutes illegal trade?
The MLRA outlines utilisation of seafood resources for legal trade and recreational fishing.
No-sale species are (1) species designated as non-commercial and thus reserved for recreational fishing, subject to the possession of a valid recreational angling permit, and daily bag limits, size limits and closed seasons. These species may not be sold; and (2) specially protected or prohibited species that may not be captured by anyone.
FROM BOAT TO PLATE: LINKING THE SEAFOOD CONSUMER AND SUPPLY CHAIN 38
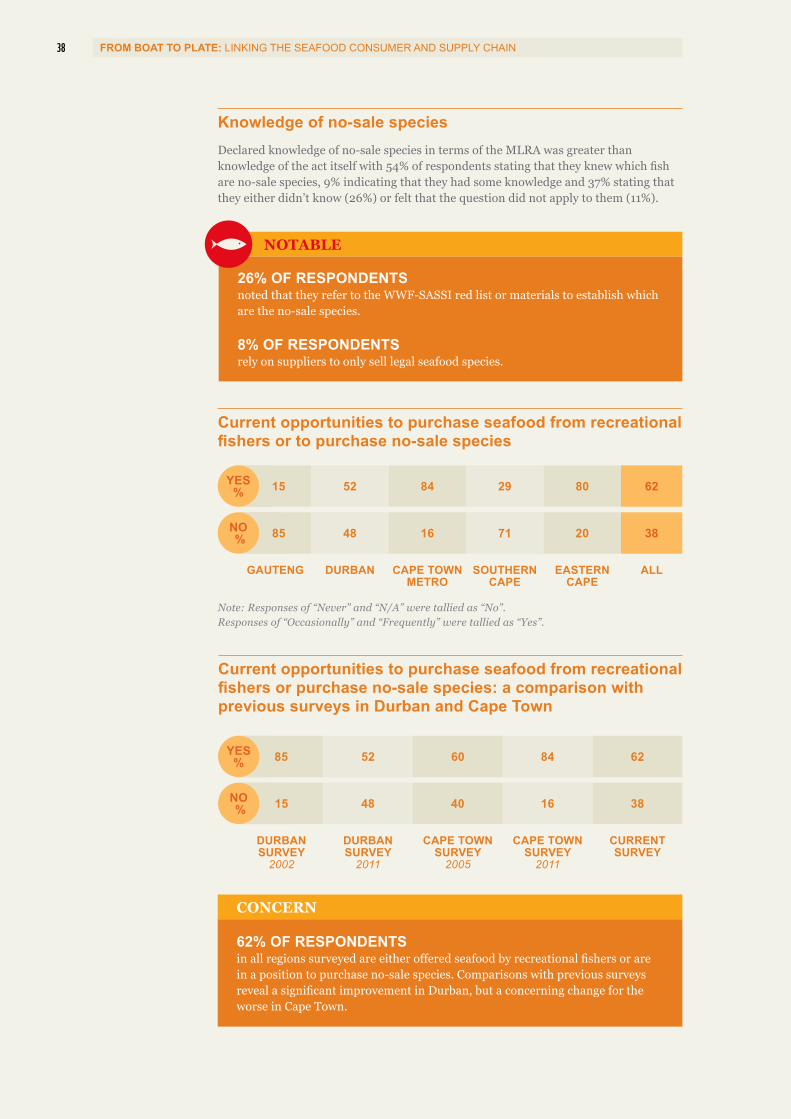
Current opportunities to purchase seafood from recreational fishers or to purchase no-sale species
Note: Responses of “Never” and “N/A” were tallied as “No”. Responses of “Occasionally” and “Frequently” were tallied as “Yes”.
15
85
52
48
84
16
29
71
80
20
GAUTENG DURBAN CAPE TOWN METRO
SOUTHERN CAPE
EASTERN CAPE
ALL
62YES %
NO % 38
NOTABLE
26% OF RESPONDENTS noted that they refer to the WWF-SASSI red list or materials to establish which are the no-sale species.
8% OF RESPONDENTS rely on suppliers to only sell legal seafood species.
Knowledge of no-sale speciesDeclared knowledge of no-sale species in terms of the MLRA was greater than knowledge of the act itself with 54% of respondents stating that they knew which fish are no-sale species, 9% indicating that they had some knowledge and 37% stating that they either didn’t know (26%) or felt that the question did not apply to them (11%).
Current opportunities to purchase seafood from recreational fishers or purchase no-sale species: a comparison with previous surveys in Durban and Cape Town
CONCERN
62% OF RESPONDENTS in all regions surveyed are either offered seafood by recreational fishers or are in a position to purchase no-sale species. Comparisons with previous surveys reveal a significant improvement in Durban, but a concerning change for the worse in Cape Town.
85
15
52
48
60
40
84
16
62
38
DURBAN SURVEY
2002
DURBAN SURVEY
2011
CAPE TOWN SURVEY
2005
CAPE TOWN SURVEY
2011
CURRENT SURVEY
YES %
NO %

FROM BOAT TO PLATE: LINKING THE SEAFOOD CONSUMER AND SUPPLY CHAIN 39
Willingness to purchase seafood from recreational fishers or to purchase no-sale species
22% OF RESPONDENTSindicated that they would consider purchasing seafood from recreational fishers, or purchasing no-sale species. The majority of these respondents linked their decision to situations where they were unable to obtain the desired fish legally.
78% OF RESPONDENTSstated that they would not buy no-sale species or purchase seafood from recreational fishers.
273 44 26 28 47
OCCASIONALLY %
Visits by compliance officials
24 68 28 13 270
FREQUENTLY %
NEVER %
97 32 6 44 40 46
GAUTENG DURBAN CAPE TOWN METRO
SOUTHERN CAPE
EASTERN CAPE
ALL
CONCERN
Inspection levels are low, and in some instances the seafood vendor respondents surveyed recorded no inspections by compliance officials.
46% OF RESPONDENTShad never been inspected although a small number (in Gauteng) reported visits by officials from, among others, the Society for the Prevention of Cruelty to Animals (SPCA) and Council for Scientific and Industrial Research (CSIR). A 2006 survey of ten restaurants in Gauteng recorded no visits by compliance officials.
27% OF RESPONDENTSnoted occasional visits by compliance officials with approximately half of these occurring at a frequency of once or twice a year. The balance noted either visits varying between every two to nine years, or unspecified visits.
27% OF RESPONDENTSreported frequent visits by compliance officials, with 8% noting one or more visits per month. 19% noted visits once every four months, or an unspecified number of “frequent” visits.
FROM BOAT TO PLATE: LINKING THE SEAFOOD CONSUMER AND SUPPLY CHAIN 40
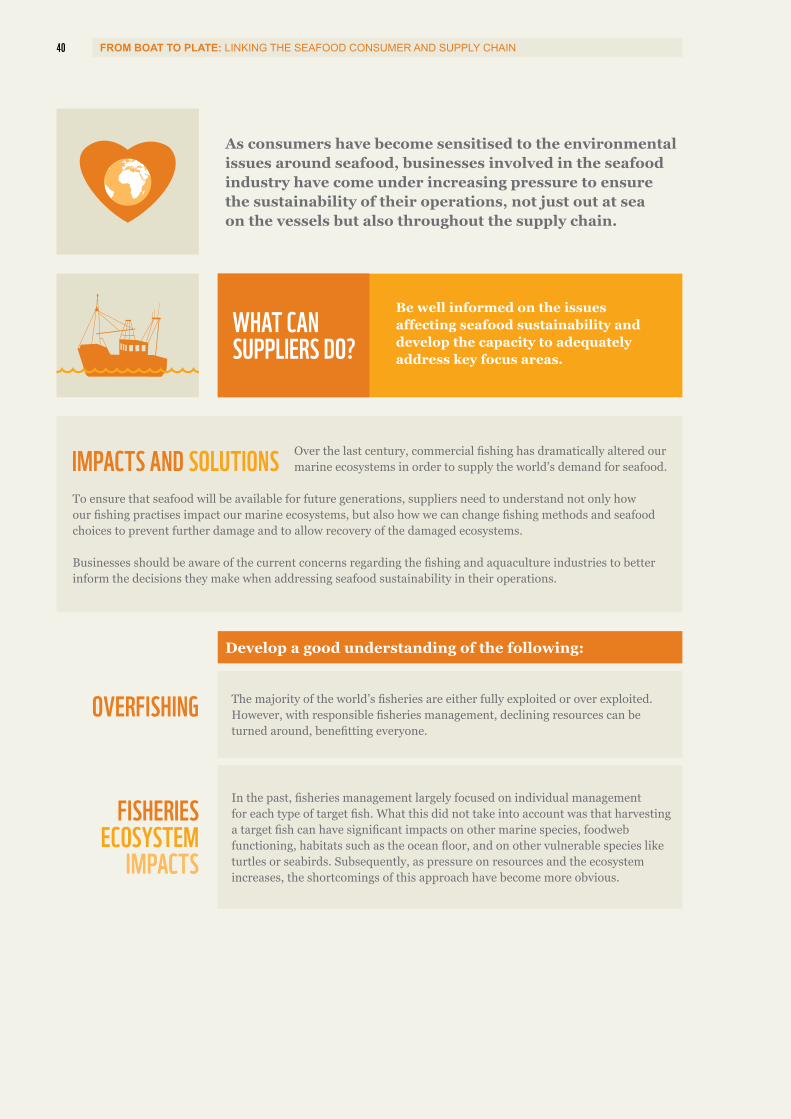
Over the last century, commercial fishing has dramatically altered our marine ecosystems in order to supply the world’s demand for seafood.
To ensure that seafood will be available for future generations, suppliers need to understand not only how our fishing practises impact our marine ecosystems, but also how we can change fishing methods and seafood choices to prevent further damage and to allow recovery of the damaged ecosystems.
Businesses should be aware of the current concerns regarding the fishing and aquaculture industries to better inform the decisions they make when addressing seafood sustainability in their operations.
IMPACTS AND SOLUTIONS
Develop a good understanding of the following:
The majority of the world’s fisheries are either fully exploited or over exploited. However, with responsible fisheries management, declining resources can be turned around, benefitting everyone.
OVERFISHING
In the past, fisheries management largely focused on individual management for each type of target fish. What this did not take into account was that harvesting a target fish can have significant impacts on other marine species, foodweb functioning, habitats such as the ocean floor, and on other vulnerable species like turtles or seabirds. Subsequently, as pressure on resources and the ecosystem increases, the shortcomings of this approach have become more obvious.
FISHERIES ECOSYSTEM
IMPACTS
WHAT CAN SUPPLIERS DO?
Be well informed on the issues affecting seafood sustainability and develop the capacity to adequately address key focus areas.
As consumers have become sensitised to the environmental issues around seafood, businesses involved in the seafood industry have come under increasing pressure to ensure the sustainability of their operations, not just out at sea on the vessels but also throughout the supply chain.

FROM BOAT TO PLATE: LINKING THE SEAFOOD CONSUMER AND SUPPLY CHAIN 41
Key aquaculture impacts include:
Excessive use of chemicals, such as antibiotics, anti-foulants and pesticides.CHEMICAL
INPUTS
Viruses and parasites can transfer between farmed and wild species.DISEASE AND
PARASITES
Escaped farmed species can compete with wild fish and interbreed with local wild stocks.ESCAPES
Aquaculture must responsibly source and reduce its dependency upon fishmeal and fish oil – a primary ingredient in feed – so as not to put additional pressure on the world’s fisheries.
FEED
Excess food and fish waste increase the levels of nutrients in the water and have the potential to lead to oxygen-deprived waters that stress aquatic life.
NUTRIENT POLLUTION
AND CARRYING CAPACITY
Clearing of land for agriculture feed sources and facility establishment affects high conservation-value areas.
LAND CONVERSION AND
DEGRADATION
To ensure abundant fish stocks for the future it is vital to keep ecosystems balanced and healthy. It is therefore necessary to manage fishing activities within ecological limits, which means making sure that we only take out the volume of fish that will not jeopardise the delicate balance of a healthy ecosystem.
ECOLOGICAL BALANCE
Aquaculture is often touted as the solution to overfishing, however aquaculture operations are not without their environmental impacts.
Some aquaculture methods are better than others, for example the farming of mussels and oysters is seen as a good environmental seafood choice, as these animals are filter feeders and need no nutritional input.
Unless properly managed, farming of carnivorous finfish such as salmon, especially under intensive conditions (somewhat like cattle in a feedlot), can have impacts that are undesirable. This method of aquaculture can be associated with issues such as pollution, the escape of farmed fish, disease and parasite transfer to wild salmon populations.
ENVIRONMENTAL IMPACTS OF
AQUACULTURE

FROM BOAT TO PLATE: LINKING THE SEAFOOD CONSUMER AND SUPPLY CHAIN 42
Vendors need to continually familiarise themselves with the scientific and market names, and verify the origin, capture method and sustainability status of the seafood species they trade in. This also applies to the species used in processed seafood products. Vendors are then empowered to accurately identify seafood sustainability risks in procurement. They can take pro-active steps to reduce their exposure to these risks by changing their buying practises.
PROCUREMENT AND LABELLING
A greater understanding of seafood products and where they come from enables businesses to measure changes in their seafood supply and to take action to improve the long-term sustainability of their procurement streams.
RETAILERS
SHOPS AND MARKETS
RESTAURANTS
WHAT CAN VENDORS DO?
Seafood sustainability status can inform procurement criteria for environmentally responsible operations, taking into consideration the following:
• Ensuring that all seafood on offer is legal.• Offering seafood that is traceable to its origins.• Not procuring unsustainable seafood species (a good start would be to avoid
all WWF-SASSI Red-listed species).• Phasing out unsustainable seafood products and replacing them with
sustainable alternatives.• Preferentially procuring sustainable seafood species or products.
WWF-SASSI recognises the Marine Stewardship Council (MSC eco-label) and the Aquaculture Stewardship Council (ASC) logo as the most credible on-package assurances of sustainable fisheries and responsible aquaculture practises. Look for these eco-labels on products as an assurance that you are buying fully traceable and sustainable seafood.
To find out more please visit www.msc.org and www.asc-aqua.org.
As most seafood products on the South African market do not currently carry either of the above-mentioned eco-labels, it is important that seafood vendors verify seafood species information and then clearly label the seafood products that they are selling. This will enable consumers to effectively use the WWF-SASSI consumer seafood guide to make informed and environmentally responsible seafood choices.
WWF-SASSI strongly advises seafood vendors to make sure that seafood product labels clearly indicate the following:
• Market or common name for the species.• Full scientific name of the species.• Fishing method (e.g. trawl, longline, line-caught) or farming method used
(e.g. pond culture, sea cages, rope and raft).• Catch or production country of origin.
FROM BOAT TO PLATE: LINKING THE SEAFOOD CONSUMER AND SUPPLY CHAIN 43
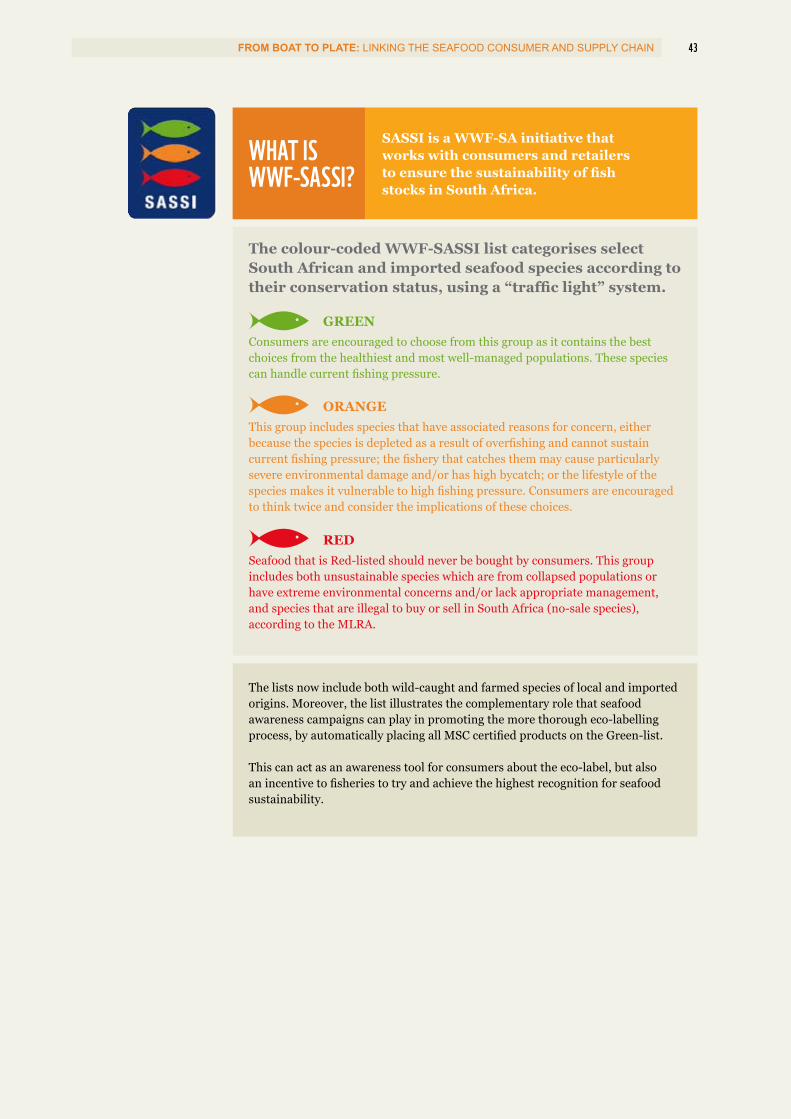
WHAT IS WWF-SASSI?
SASSI is a WWF-SA initiative that works with consumers and retailers to ensure the sustainability of fish stocks in South Africa.
The lists now include both wild-caught and farmed species of local and imported origins. Moreover, the list illustrates the complementary role that seafood awareness campaigns can play in promoting the more thorough eco-labelling process, by automatically placing all MSC certified products on the Green-list.
This can act as an awareness tool for consumers about the eco-label, but also an incentive to fisheries to try and achieve the highest recognition for seafood sustainability.
The colour-coded WWF-SASSI list categorises select South African and imported seafood species according to their conservation status, using a “traffic light” system.
GREENConsumers are encouraged to choose from this group as it contains the best choices from the healthiest and most well-managed populations. These species can handle current fishing pressure.
ORANGEThis group includes species that have associated reasons for concern, eitherbecause the species is depleted as a result of overfishing and cannot sustaincurrent fishing pressure; the fishery that catches them may cause particularlysevere environmental damage and/or has high bycatch; or the lifestyle of thespecies makes it vulnerable to high fishing pressure. Consumers are encouragedto think twice and consider the implications of these choices.
REDSeafood that is Red-listed should never be bought by consumers. This group includes both unsustainable species which are from collapsed populations or have extreme environmental concerns and/or lack appropriate management, and species that are illegal to buy or sell in South Africa (no-sale species), according to the MLRA.

44 FROM BOAT TO PLATE: LINKING THE SEAFOOD CONSUMER AND SUPPLY CHAIN
Some of our much-loved linefish species are showing signs of recovery, aided by consumer awareness and choices.
REDUCE THE IMPACT ON OVEREXPLOITED AND HIGH IMPACT SPECIES.
PROMOTE MORE RESPONSIBLY AND SUSTAINABLY HARVESTED PRODUCTS.
WHAT CAN CONSUMERS DO?
Seafood consumers can use their buying power to influence key retailers. Buying “green” at each link in the supply chain can:
1 2
Ask questions when ordering and
purchasing seafood: What is it? Where is it from? How was it caught or farmed? You have a choice.
Make it green.
NOT AWARE OF WWF-SASSIAWARE OF WWF-SASSI
89 76 60
11 24 40
2010 2012 2014
Percentage awareness of WWF-SASSI recorded within South African metropoles (Cape Town, Durban and Johannesburg) from research conducted between 2010 and 2014:
AWARENESS OF WWF-SASSI

FROM BOAT TO PLATE: LINKING THE SEAFOOD CONSUMER AND SUPPLY CHAIN 5
DATA COLLECTION
AND ANALYSISCHALLENGES AND CONCLUSIONSThere is a need for greater traceability of seafood products: from boat to plate.
For suppliers, retailers, restaurant owners and those in the trade wanting to provide customers with information on the provenance of seafood products and the manner in which they were caught or farmed, information is often either hard or impossible to come by.
Consumer pressure combined with regulatory provisions on standard seafood labelling and more detailed information on imported seafood will lead to improved traceability. This, in turn, will empower consumers to make informed choices that favour products sourced from sustainable, well-managed fisheries.
To build mechanisms that incentivise improved practise in capture fisheries and aquaculture operations, it is important to be able to determine which stakeholders or stakeholder groups in the supply chain should be engaged to create a market pull. This can only be achieved through a better understanding of the seafood market trade dynamics: these, in turn, are underpinned by improved data collection.
Importance and relevance of data
The biggest challenge compiling a detailed and comprehensive report stemmed from the absence of appropriate systems to provide this sort of data. The import and export data on seafood products entering and leaving the South African market does not, in many instances, adequately capture species or origin data, making it difficult to analyse and interpret the information generated.
The current tracking of imports of seafood is simply inadequate and more detailed descriptions need to be developed by SARS.
Challenges
It is important for the retail sector in South Africa to accurately track the volumes and seafood species types that they trade in. This will greatly improve the researcher’s ability to compile a comprehensive analysis of the seafood retail market. Improved labelling practises can assist retailers in identifying which seafood species are contained in the seafood products that they sell. Greater understanding of the supply chain through a more detailed interaction with their suppliers will aid them in determining the origin of their seafood products from sometimes complex global seafood supply chains.
Need for accurate data and improvements in seafood trade data capture
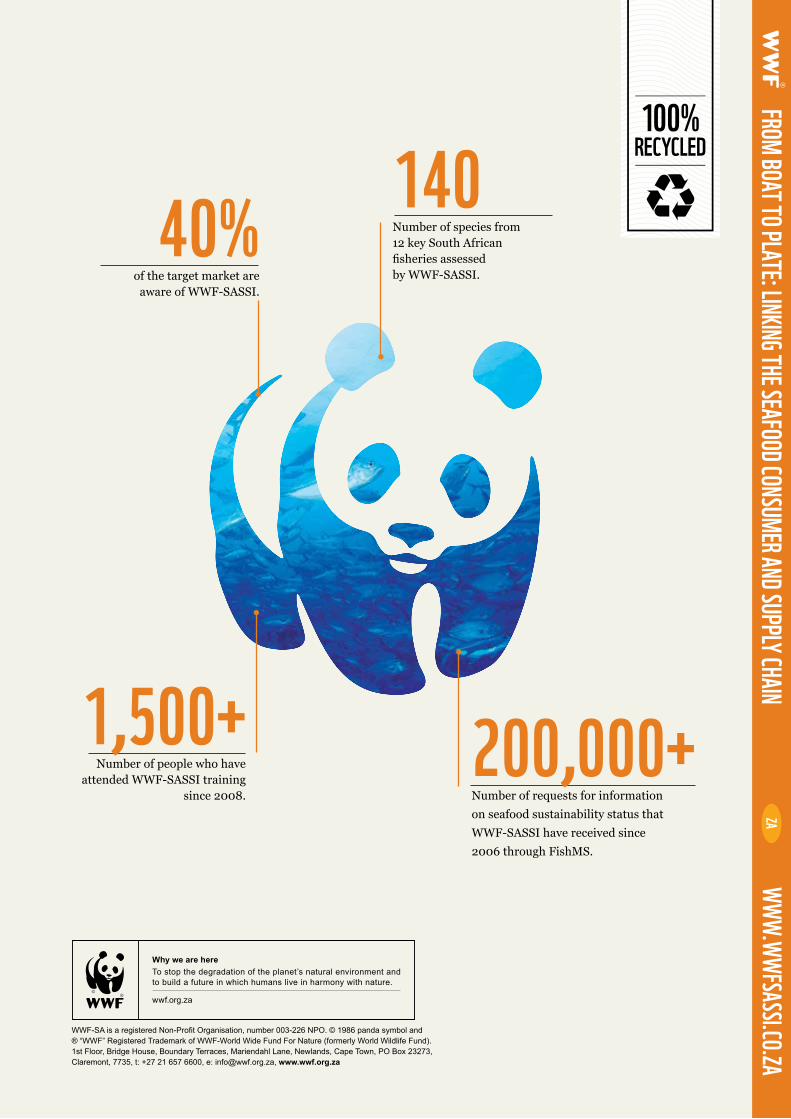
40% of the target market are
aware of WWF-SASSI.
140Number of species from 12 key South African fisheries assessed by WWF-SASSI.
100%RECYCLED
WWF-SA is a registered Non-Profit Organisation, number 003-226 NPO. © 1986 panda symbol and ® “WWF” Registered Trademark of WWF-World Wide Fund For Nature (formerly World Wildlife Fund). 1st Floor, Bridge House, Boundary Terraces, Mariendahl Lane, Newlands, Cape Town, PO Box 23273, Claremont, 7735, t: +27 21 657 6600, e: [email protected], www.wwf.org.za
FROM BOAT TO PLATE: LINKING THE SEAFOOD CONSUMER AND SUPPLY CHAIN
WWW.WWFSASSI.CO.ZAZA
1,500+Number of people who have
attended WWF-SASSI training since 2008.
200,000+Number of requests for information on seafood sustainability status that WWF-SASSI have received since 2006 through FishMS.