fresno general plan recirculated public review draft
TRANSCRIPT

March 2021
PUBLIC REVIEW DRAFT
F R E S N O G E N E R A L P L A N R E C I R C U L A T E D P U B L I C R E V I E W D R A F T
P R O G R A M E N V I R O N M E N T A L I M P A C T R E P O R T
STATE CLEARINGHOUSE NUMBER: 2019050005

This page intentionally left blank
March 2021
PUBLIC REVIEW DRAFT
F R E S N O G E N E R A L P L A N R E C I R C U L A T E D P U B L I C R E V I E W D R A F T
P R O G R A M E N V I R O N M E N T A L I M P A C T R E P O R T
STATE CLEARINGHOUSE NUMBER: 2019050005
City of Fresno Planning and Development Department
2600 Fresno Street Fresno, California 93721
Prepared by:
LSA 2565 Alluvial Avenue, Suite 172
Clovis, California 93611
Project No. CFO1802

This page intentionally left blank

R E C I R C U L A T E D P R O G R A M E N V I R O N M E N T A L I M P A C T R E P O R T
P U B L I C R E V I E W D R A F T M A R C H 2 0 2 1
G E N E R A L P L A N F R E S N O , C A L I F O R N I A
i
TABLE OF CONTENTS
FIGURES AND TABLES ............................................................................................................................. ii LIST OF ABBREVIATIONS AND ACRONYMS ............................................................................................ iii
1.0 INTRODUCTION ................................................................................................ 1-1 1.1 SUMMARY OF REVISIONS TO THE Draft PEIR ................................................................... 1-1 1.2 FORMAT FOR THE RECIRCULATED DRAFT PEIR ................................................................. 1-3 1.3 COMMENTING ON THE RECIRCULATED DRAFT PEIR ........................................................ 1-4
2.0 EXECUTIVE SUMMARY ..................................................................................... 2-1
3.0 PROJECT DESCRIPTION ..................................................................................... 3-1 3.1 PROJECT LOCATION ........................................................................................................... 3-1 3.2 PROJECT CHARACTERISTICS .............................................................................................. 3-2 3.3 PROJECT OBJECTIVES ...................................................................................................... 3-23 3.4 DISCRETIONARY ACTIONS AND USES OF THIS EIR .......................................................... 3-27
4.0 EVALUATION OF ENVIRONMENTAL IMPACTS ................................................... 4-1 4.3 AIR QUALITY ................................................................................................................... 4.3-1 4.8 GREENHOUSE GAS EMISSIONS ....................................................................................... 4.8-1 4.16 TRANSPORTATION ........................................................................................................ 4.16-1
APPENDICES (Appendices C, G, and J are provided on a USB drive located on the inside back cover of paper copies of this report. The lettering of each appendix is consistent with the lettering included in the Draft PEIR.) C: AIR QUALITY – CALEEMOD OUTPUT FILES G: GREENHOUSE GAS REDUCTION PLAN UPDATE J: TRAFFIC IMPACT ANALYSIS

G E N E R A L P L A N F R E S N O , C A L I F O R N I A
R E C I R C U L A T E D P R O G R A M E N V I R O N M E N T A L I M P A C T R E P O R T P U B L I C R E V I E W D R A F T
M A R C H 2 0 2 1
ii
FIGURES AND TABLES
FIGURES
Figure 3-1: Regional Location and Local Vicinity Map ........................................................................ 3-3 Figure 3-2: Planning Area .................................................................................................................... 3-4 Figure 3-3: Planned Land Use ........................................................................................................... 3-13 Figure 3-4: Infill Areas ....................................................................................................................... 3-21 Figure 3-5: Growth Areas .................................................................................................................. 3-22 Figure 3-6: Development Areas ........................................................................................................ 3-25 Figure 4.3-1: San Joaquin Valley Inversion ...................................................................................... 4.3-5
TABLES
Table 1-1: Executive Summary Matrix ................................................................................................ 2-3 Table 3.2.A: Text Changes to General Plan Policies related to Level of Service ................................. 3-9 Table 3.2.B: Existing 2019 Baseline and General Plan Update Comparison ..................................... 3-19 Table 3.2.C: Population Estimate for City of Fresno Planning Area .................................................. 3-20 Table 4.3.A: Ambient Air Quality Monitoring Summary .................................................................. 4.3-7 Table 4.3.B: Fresno County Emissions ............................................................................................. 4.3-9 Table 4.3.C: SJVAB Air Quality Attainment Status ......................................................................... 4.3-10 Table 4.3.D: Sources and Health Effects of Air Pollutants ............................................................. 4.3-12 Table 4.3.E: Federal and State Ambient Air Quality Standards ..................................................... 4.3-13 Table 4.3.F: Recommendations on Siting New Sensitive Land Uses Near Toxic Air
Contaminant Sources ............................................................................................................ 4.3-22 Table 4.3.G: Screening Levels for Potential Odor Sources ............................................................. 4.3-27 Table 4.3.H: City of Fresno Planning Area Annual Average Air Pollutant Emissions ..................... 4.3-56 Table 4.3. I: City of Fresno Planning Area Daily Air Pollutant Emissions ....................................... 4.3-56 Table 4.3.J: Top Three Stationary/Area Source Emitters in City of Fresno Planning Area
(2015) .................................................................................................................................... 4.3-57 Table 4.8.A: Global Warming Potentials .......................................................................................... 4.8-6 Table 4.8.B: City of Fresno GHG Emissions by Sector for 2016 ....................................................... 4.8-9 Table 4.8.C: City of Fresno 2016 Inventory Update and Business-as-Usual Projections ............... 4.8-34 Table 4.8.D: Reductions from Statewide Measures ...................................................................... 4.8-37 Table 4.8.E: City of Fresno Adjusted Business-as-Usual Emissions ................................................ 4.8-38 Table 4.8.F: State-Aligned GHG Emission Reduction Targets By Year ........................................... 4.8-38 Table 4.8.G: Strategies for Existing Development ......................................................................... 4.8-40 Table 4.8.H: Reductions from Local Measures .............................................................................. 4.8-46 Table 4.8.I: GHG Emissions and Targets Comparison .................................................................... 4.8-47 Table 4.16.A: Level of Service Definitions ...................................................................................... 4.16-4 Table 4.16.B: County and City of Fresno VMT ............................................................................. 4.16-43
R E C I R C U L A T E D P R O G R A M E N V I R O N M E N T A L I M P A C T R E P O R T P U B L I C R E V I E W D R A F T M A R C H 2 0 2 1
G E N E R A L P L A N F R E S N O , C A L I F O R N I A
iii
LIST OF ABBREVIATIONS AND ACRONYMS
°C Celsius
°F Fahrenheit
ABAG Association of Bay Area Governments
ACMs asbestos-containing materials
AIA American Institute of Architects
AIAs Airport Influence Areas
ALUC Airport Land Use Committee
ALUCP Airport Land Use Compatibility Plan
AP Act Alquist-Priolo Earthquake Fault Zoning Act
BAAQMD Bay Area Air Quality Management District
BART Bay Area Rapid Transit
bgs below ground surface
BMPs Best Management Practices
building
C/CAG City/County Association of Governments
CA MUTCD California Manual of Uniform Traffic Control Devices
CAAQS California Ambient Air Quality Standards
CAG County Association of Governments
CAL Fire California Department of Forestry and Fire Protection
Cal/OSHA California Occupational Safety and Health Administration
CalEEMod California Emissions Estimator Model
CalEPA California Environmental Protection Agency
CALGreen California Green Building Standards Code
G E N E R A L P L A N F R E S N O , C A L I F O R N I A
R E C I R C U L A T E D P R O G R A M E N V I R O N M E N T A L I M P A C T R E P O R T P U B L I C R E V I E W D R A F T
M A R C H 2 0 2 1
iv
Caltrans California Department of Transportation
CARB California Air Resources Board
CARE Community Air Risk Evaluation
CBC California Building Code
CCAA California Clean Air Act
CCR California Code of Regulations
CDFW California Department of Fish and Wildlife
CEC California Energy Commission
CEQA California Environmental Quality Act
CESA California Endangered Species Act
CFR Code of Federal Regulations
CGS California Geological Survey
City City of San Bruno
CMA Congestion Management Agency
CMP Congestion Management Program
CNDDB California Natural Diversity Database
CNEL Community Noise Equivalent Level
CNPS California Native Plant Society
CO carbon monoxide
Corps U.S. Army Corps of Engineers
CPTs cone penetrometer tests
CRHR California Register of Historical Resources
CTC California Transportation Commission
CTR California Toxics Rule

R E C I R C U L A T E D P R O G R A M E N V I R O N M E N T A L I M P A C T R E P O R T P U B L I C R E V I E W D R A F T M A R C H 2 0 2 1
G E N E R A L P L A N F R E S N O , C A L I F O R N I A
v
dB decibel
dBA A-weighted decibels
DDT dichlorodiphenyltrichloroethane
DOT U.S. Department of Transportation
DTSC Department of Toxic Substance Control
DWR California Department of Water Resources
EIR Environmental Impact Report
EOP Emergency Operations Plan
EPA Environmental Protection Agency
ESA Federal Endangered Species Act
ESCP Erosion and Sediment Control Plan
ESLs Environmental Screening Levels
FAA Federal Aviation Administration
FCAA Federal Clean Air Act
FEMA Federal Emergency Management Agency
FHWA Federal Highway Administration
FIP Federal Implementation Plan
FIRM Flood Insurance Rate Map
FTA Federal Transit Administration
GHG greenhouse gas
GSAs groundwater sustainability agencies
GWMP Groundwater Management Plan
HABS Historic American Building Survey
HAER Historic American Engineering Record
G E N E R A L P L A N F R E S N O , C A L I F O R N I A
R E C I R C U L A T E D P R O G R A M E N V I R O N M E N T A L I M P A C T R E P O R T P U B L I C R E V I E W D R A F T
M A R C H 2 0 2 1
vi
HALS Historic American Landscapes Survey
HBMS Hazardous Building Materials Survey
HCM Highway Capacity Manual
HMBPs Hazardous Materials Business Plans
HRA Health Risk Assessment
HRE Historical Resource Evaluation
HVAC heating, ventilation, and air conditioning
I-280 Interstate 280
I-380 Interstate 380
ITE Institute of Transportation Engineers
LBP lead-based paints
LCP lead-containing paint
Ldn Day-night equivalent noise level
Leq continuous sound level
LID low impact development
Lmax maximum noise level
LTS less-than-significant impact
MEI maximally exposed individual
MLD Most Likely Descendent
MPO Metropolitan Planning Organization
MRP Municipal Regional Permit
MS4 Municipal Separate Storm Sewer System
MTC Metropolitan Transportation Commission
MUTCD Manual on Uniform Traffic Control Devices

R E C I R C U L A T E D P R O G R A M E N V I R O N M E N T A L I M P A C T R E P O R T P U B L I C R E V I E W D R A F T M A R C H 2 0 2 1
G E N E R A L P L A N F R E S N O , C A L I F O R N I A
vii
MW moment magnitude
NAAQS National Ambient Air Quality Standards
NAHC Native American Heritage Commission
NEHRP National Earthquake Hazards Reduction Program
NFIP National Flood Insurance Program
NO2 nitrogen dioxide
NOI Notice of Intent
NOP Notice of Preparation
NOx nitrogen oxide
NPDES National Pollutant Discharge Elimination System
NRHP National Register of Historic Places
NWIC Northwest Information Center
O3 ozone
OSHA Occupational Health and Safety Administration
pavilion Rotary Pavilion
Pb lead
PCBs polychlorinated biphenyls
PG&E Pacific Gas and Electric
PM afternoon peak hour (related to traffic)
PM10 respirable particulate matter
PM2.5 fine particulate matter
pool San Bruno Park Pool
POTWs publicly owned treatment works
PPV peak particle velocity

G E N E R A L P L A N F R E S N O , C A L I F O R N I A
R E C I R C U L A T E D P R O G R A M E N V I R O N M E N T A L I M P A C T R E P O R T P U B L I C R E V I E W D R A F T
M A R C H 2 0 2 1
viii
project San Bruno Recreation and Aquatic Center Project
RCRA Resource Conservation and Recovery Act of 1976
Regional Water Board San Francisco Bay Regional Water Quality Control Board
rms root mean square
ROG reactive organic gases
RTP Regional Transportation Plan
S significant impact
SamTrans San Mateo County Transit District
SBCC San Bruno Community Center
SBCF San Bruno Community Foundation
SBRAC San Bruno Recreation and Aquatic Center (proposed project)
SDSs Safety Data Sheets
SFO San Francisco International Airport
SGMA Sustainable Groundwater Management Act
SHMA Seismic Hazards Mapping Act
SIP State Implementation Plan
SMCEHS San Mateo County Environmental Health Services
SMCWPPP San Mateo County Water Pollution Prevention Program
SO2 sulfur dioxide
Sox sulfur oxides
SR-35 State Route 35
SR-82 State Route 82
SRA State responsibility areas
SU significant and unavoidable impact
R E C I R C U L A T E D P R O G R A M E N V I R O N M E N T A L I M P A C T R E P O R T P U B L I C R E V I E W D R A F T M A R C H 2 0 2 1
G E N E R A L P L A N F R E S N O , C A L I F O R N I A
ix
SWPPP Stormwater Pollution Prevention Plan
SWRCB State Water Resources Board
TACs toxic air contaminants
TDM Transportation Demand Management
TIA Transportation Impact Analysis
TMDL Total Maximum Daily Load
TPZ tree protection zone
UCMP University of California Museum of Paleontology
US 101 U.S. Route 101
USEPA U.S. Environmental Protection Agency
USFWS U.S. Fish and Wildlife Service
USGS U.S. Geological Survey
UST underground storage tanks
Veterans Memorial San Bruno Veteran Memorial Recreation Center VMT vehicle miles traveled
WDRs Waste Discharge Requirements
WHO World Health Organization
WOB West-of-Bayshore
WTP water treatment plant
ZORI Zones of Required Investigation

G E N E R A L P L A N F R E S N O , C A L I F O R N I A
R E C I R C U L A T E D P R O G R A M E N V I R O N M E N T A L I M P A C T R E P O R T P U B L I C R E V I E W D R A F T
M A R C H 2 0 2 1
x
This page intentionally left blank

R E C I R C U L A T E D P R O G R A M E N V I R O N M E N T A L I M P A C T R E P O R T P U B L I C R E V I E W D R A F T M A R C H 2 0 2 1
G E N E R A L P L A N F R E S N O , C A L I F O R N I A
1-1
1.0 INTRODUCTION
The City of Fresno prepared and publicly circulated for review a Draft Program Environmental Impact Report (Draft PEIR) for the Fresno General Plan on March 6, 2020. The 45-day public comment period was scheduled to end on April 20, 2020. However, due to closures of public facilities in response to the Coronavirus disease 2019 (COVID-19), the City extended the public comment period to May 5, 2020, to allow public agencies and interested parties a total of 61 days to review and submit comments on the Draft PEIR.
Pursuant to the Guidelines for California Environmental Quality Act (CEQA Guidelines) Section 15088.5 (a), a lead agency is required to recirculate an EIR when significant new information is added to the EIR after public notice is given of the availability of the EIR for public review under Section 15087 but before certification of the EIR. New “information” can include changes in the project or environmental setting as well as additional data or other information. New information added to an EIR is not “significant” unless the EIR is changed in a way that deprives the public of a meaningful opportunity to comment upon a substantial adverse environmental effect of the project or a feasible way to mitigate or avoid such an effect (including a feasible project alternative) that the project’s proponents have declined to implement. As identified in Section 15088 (a) of the CEQA Guidelines, “Significant new information” requiring recirculation is defined to include disclosures of any of the following:
(1) A new significant environmental impact would result from the project or from a new mitigation measure proposed to be implemented.
(2) A substantial increase in the severity of an environmental impact would result unless mitigation measures are adopted that reduce the impact to a level of insignificance.
(3) A feasible project alternative or mitigation measure considerably different from others previously analyzed would clearly lessen the environmental impacts of the project, but the project’s proponents decline to adopt it.
(4) The draft EIR was so fundamentally and basically inadequate and conclusory in nature that meaningful public review and comment were precluded.
The City has decided to revise portions of the Draft PEIR to address new information and comments received from the public on the Draft PEIR, as described below.
1.1 SUMMARY OF REVISIONS TO THE DRAFT PEIR
The following text provides a summary of the issues and revisions that are included in this Recirculated Draft PEIR.
1.1.1 Revisions to Draft PEIR Requiring Recirculation
The Draft PEIR was completed and circulated for public review before the City adopted Vehicle Miles Traveled (VMT) thresholds and guidelines. As such, consistent with sections 15064.3(c) and 15007 of

G E N E R A L P L A N F R E S N O , C A L I F O R N I A
R E C I R C U L A T E D P R O G R A M E N V I R O N M E N T A L I M P A C T R E P O R T P U B L I C R E V I E W D R A F T
M A R C H 2 0 2 1
1-2
the CEQA Guidelines, no determination regarding VMT was made when the Draft PEIR was circulated for public review on March 6, 2020. In June 2020, following the close of the public comment period for the Draft PEIR on May 5, 2020, but before the PEIR was certified by the City, the City adopted VMT guidelines and thresholds to be effective on July 1, 2020. The thresholds and guidelines adopted by the City include standardized screening methods for VMT threshold compliance data, and VMT significance thresholds for development projects, transportation projects, and plans. In addition, the VMT guidelines also include feasible mitigation strategies applicable for development projects, transportation projects, and plans. The City has decided that the discussion and determination in the PEIR related to VMT impacts should be updated to account for the City’s adopted VMT guidelines and thresholds. This change constitutes new significant information, thus triggering recirculation of the Draft PEIR. Section 4.16, Transportation, of the Draft PEIR has been revised accordingly.
1.1.2 Revisions to the Draft PEIR Not Requiring Recirculation
Additional revisions have been made to Chapter 3.0, Project Description, Section 4.3, Air Quality, and Section 4.8, Greenhouse Gas Emissions. Revisions to the chapter and sections, as shown in this Recirculated Draft PEIR, do not meet the requirements warranting recirculation of the Draft PEIR. However, the revisions were made to clarify the content and address comments raised during the public review of the Draft PEIR and to assure that public review opportunities are afforded.
Chapter 3.0, Project Description
• Baseline of Analysis. Consistent with the requirements of CEQA Guidelines Section 15125(a)(1), the baseline of the analysis in the Draft PEIR was identified as the date of issuance of the Notice of Preparation (NOP) on May 16, 2019. CEQA Guidelines Section 15125(a)(1) states that, "generally, the lead agency should describe physical environmental conditions as they exist at the time the notice of preparation is published, or if no notice of preparation is published, at the time environmental analysis is commenced, from both a local and regional perspective." The Project Description has been updated to state that the 2019 baseline presents the most accurate and understandable picture possible of expected impacts on current physical conditions of the General Plan as amended.
• Master EIR versus Program EIR. The Project Description has been updated to provide a comparison of a Master EIR and a Program EIR, and how tiering from the Program EIR will require additional CEQA analysis for future projects proposed under the approved General Plan.
Chapter 4.0, Evaluation of Environmental Impacts
Minor text revisions were made to this chapter in order to provide an introduction to Sections 4.3, 4.8, and 4.16.
Section 4.3, Air Quality
• Coronavirus Disease 19 (COVID-19) Pandemic. The Air Quality section of the Draft PEIR has been updated to address the COVID-19 pandemic. In March 2020, the Governor of the State of California declared a state of emergency relative to the Novel Coronavirus/COVID-19 pandemic. Subsequent orders from the State set forth new requirements for public noticing, as well as
R E C I R C U L A T E D P R O G R A M E N V I R O N M E N T A L I M P A C T R E P O R T P U B L I C R E V I E W D R A F T M A R C H 2 0 2 1
G E N E R A L P L A N F R E S N O , C A L I F O R N I A
1-3
public engagement with respect to documents prepared pursuant to the California Environ-mental Quality Act (CEQA). The City of Fresno has conducted noticing and circulation in compliance with CEQA Guidelines Section 15087 and Executive Order N-80-20. While COVID-19 is a highly communicable respiratory disease, the severity of which can vary for each infected person, its status as a pandemic is not expected to continue throughout the duration of the project. In addition, the potential risk of any future pandemics is not an environmental impact for CEQA purposes; instead, it is an impact of the environment on the Project, which is not required to be addressed in a CEQA analysis. The CEQA guidelines do not include any criteria or thresholds for evaluating communicable diseases, including COVID-19, and do not provide guidance or thresholds for evaluating the impact of criteria pollutants on susceptibility to communicable disease, beyond what is set forth in existing guidance. Moreover, the timing, nature, and scope of any future pandemics are unknown at this time. The extent to which residents of the plan area would be vulnerable to a future mass illness or pandemic would depend upon the nature of the illness and the primary means by which it spreads, both of which cannot be predicted at this time.
• Community Emissions Reductions Program: Assembly Bill 617. An expanded discussion regarding the applicability and implementation of the City’s Community Emission Reduction Plan (CERP) has been included. The discussion includes a description of the contents of the CERP, including the technical analysis, implementation strategies, incentive funding measures, public engagement strategies, enforcement strategies, regulatory strategies, implementation schedule and metrics for tracking emission reductions.
Section 4.8, Greenhouse Gas Emissions
The Greenhouse Gas (GHG) Reduction Plan Update, included in Appendix G of this Recirculated Draft PEIR, has been updated to account for the City’s adopted VMT guidelines and thresholds, the Fresno Council of Governments (COG) Electric Vehicle Readiness Plan,1 and requirements related to implementation of GHG reduction measures. As such, changes to Section 4.8, Greenhouse Gas Emissions, have been made to reflect the changes to GHG Reduction Plan Update.
1.2 FORMAT FOR THE RECIRCULATED DRAFT PEIR
In accordance with CEQA Guidelines Section 15088.5 (c), if the revision is limited to a few chapters or portions of the EIR, the lead agency need only recirculate the chapters or portions that have been modified. Therefore, this Recirculated Draft PEIR includes the following chapters, sections and appendices:
Chapter 1.0 Introduction
Chapter 2.0 Table 1-1, Executive Summary Matrix
Chapter 3.0 Project Description
Chapter 4.0 Evaluation of Environmental Impacts
1 Fresno Council of Governments, Electric Vehicle Readiness Plan, January 2021.

G E N E R A L P L A N F R E S N O , C A L I F O R N I A
R E C I R C U L A T E D P R O G R A M E N V I R O N M E N T A L I M P A C T R E P O R T P U B L I C R E V I E W D R A F T
M A R C H 2 0 2 1
1-4
Section 4.3 Air Quality
Section 4.8 Greenhouse Gas Emissions
Section 4.16 Transportation
Appendix C Air Quality – CALEEMOD Output Files (No changes have been made to this appendix and it is included to facilitate public review of the Section 4.3, Air Quality)
Appendix G Greenhouse Gas Reduction Plan Update
Appendix J Traffic Impact Analysis (No changes have been made to this appendix and it is included to facilitate public review of the Section 4.16, Transportation)
With the exception of this introduction chapter, which is new text in its entirety, all chapters and sections of this Recirculated Draft PEIR indicate changes to the original Draft PEIR. For clarity, the text changes shown in the Response to Comments Document related to Chapter 3.0, Project Description, and Section 4.16, Transportation, have been incorporated into this Recirculated Draft PEIR, but those edits are not specifically identified. Only text edits made since the Response to Comments Document was published are shown in this Recirculated Draft PEIR.
As mentioned above, this Recirculated Draft PEIR shows text that has been changed. Text that has been modified and deleted is shown in strikethrough and new text is shown as double-underlined. This format is intended to provide clear identification of the changes since the circulation of the Draft PEIR and the Response to Comments Document and will simplify the reader’s review of the revisions.
1.3 COMMENTING ON THE RECIRCULATED DRAFT PEIR
This Recirculated Draft PEIR will be circulated for public comment for a period of 45 days. Pursuant to CEQA guidelines Section 15088.5(f)(2), reviewers of this document are requested to limit their comments to the new material that has been included in the revised chapters or portions of the Recirculated Draft PEIR. The City of Fresno need only respond to 1) comments received during the initial circulation period for the Draft EIR that relate to chapters or portions of the document that were not revised and recirculated; and 2) comments received during the recirculation period that relate to the chapters or portions of the PEIR that were revised and recirculated. Therefore, agencies, organizations, and individuals who wish to comment on this document should limit their comments to the revised chapters or portions of this Recirculated Draft PEIR and the analysis contained herein.

R E C I R C U L A T E D P R O G R A M E N V I R O N M E N T A L I M P A C T R E P O R T P U B L I C R E V I E W D R A F T M A R C H 2 0 2 1
G E N E R A L P L A N F R E S N O , C A L I F O R N I A
2-1
2.0 EXECUTIVE SUMMARY
Table 1-1 below summarizes the impacts, mitigation measures, and resulting level of significance after mitigation for the relevant environmental issue areas evaluated for the proposed changes to the approved General Plan. Table 1-1 is intended to provide an overview; narrative discussions for the issue areas are included in the corresponding sections of this Draft Recirculated Draft PEIR. Table 1-1 was included in the Draft PEIR pursuant to CEQA Guidelines Section 15123(b)(1). Table 1-1 includes all impacts identified in the Draft PEIR with applicable text revisions as included in this Recirculated Draft PEIR. In order to provide clear identification of the changes in text, text that has been eliminated is shown in strikethrough and new text is shown as double-underlined.

G E N E R A L P L A N F R E S N O , C A L I F O R N I A
R E C I R C U L A T E D P R O G R A M E N V I R O N M E N T A L I M P A C T R E P O R T P U B L I C R E V I E W D R A F T
M A R C H 2 0 2 1
2-2
This page intentional left blank

R E C I R C U L A T E D D R A F T P R O G R A M E N V I R O N M E N T A L I M P A C T R E P O R T P U B L I C R E V I E W D R A F T M A R C H 2 0 2 1
G E N E R A L P L A N F R E S N O , C A L I F O R N I A
2-3
Table 1-1: Executive Summary Matrix
Potential Environmental Impact Level of Significance Before Mitigation Mitigation Measures Level of Significance
After Mitigation AESTHETICS AES-1: The proposed project would not have a substantial adverse effect on a scenic vista.
Less than Significant Impact. No mitigation is required. Less than Significant Impact.
AES-2: The proposed project would not substantially damage scenic resources, including, but not limited to, trees, rock outcroppings, and historic buildings within a state scenic highway.
Less than Significant Impact. No mitigation is required. Less than Significant Impact.
AES-3: The proposed project would substantially degrade the existing visual character or quality of public views of the site and its surroundings (public views are those that are experienced from publicly accessible vantage point), and due to the location of the project in an urbanized area, the project would conflict with applicable zoning and other regulations governing scenic quality.
Potentially Significant Impact. No feasible mitigation measures are available. Significant and Unavoidable Impact.
AES-4: Continued implementation of the approved General Plan would increase the amount of light and glare within the Planning Area.
Potentially Significant Impact. Mitigation Measure AES-4.1: Lighting for Street and Parking Areas. Lighting systems for street and parking areas shall include shields to direct light to the roadway surfaces and parking areas. Vertical shields on the light fixtures shall also be used to direct light away from adjacent light sensitive land uses such as residences.
Mitigation Measure AES-4.2: Lighting for Public Facilities. Lighting systems for public facilities such as active play areas shall provide adequate illumination for the activity; however, low intensity light fixtures and shields shall be used to minimize spillover light onto adjacent properties.
Mitigation Measure AES-4.3: Lighting for Non-Residential Uses. Lighting systems for non-residential uses, not including public facilities, shall provide shields on the light fixtures and orient the lighting system away from adjacent properties. Low intensity light fixtures shall also be used if excessive spillover light onto adjacent properties will occur.
Mitigation Measure AES-4.4: Signage Lighting. Lighting systems for freestanding signs shall not exceed 100-foot Lamberts (FT-L) when adjacent to streets which have an average light intensity of less than 2.0 horizontal footcandles and shall not exceed 500 FT-L when adjacent to streets which have an average light intensity of 2.0 horizontal footcandles or greater.
Mitigation Measure AES-4.5: Use of Non-Reflective Materials. Materials used on building facades shall be non-reflective.
Significant and Unavoidable Impact.
G E N E R A L P L A N F R E S N O , C A L I F O R N I A
R E C I R C U L A T E D D R A F T P R O G R A M E N V I R O N M E N T A L I M P A C T R E P O R T P U B L I C R E V I E W D R A F T
M A R C H 2 0 2 1
2-4
Table 1-1: Executive Summary Matrix
Potential Environmental Impact Level of Significance Before Mitigation Mitigation Measures Level of Significance
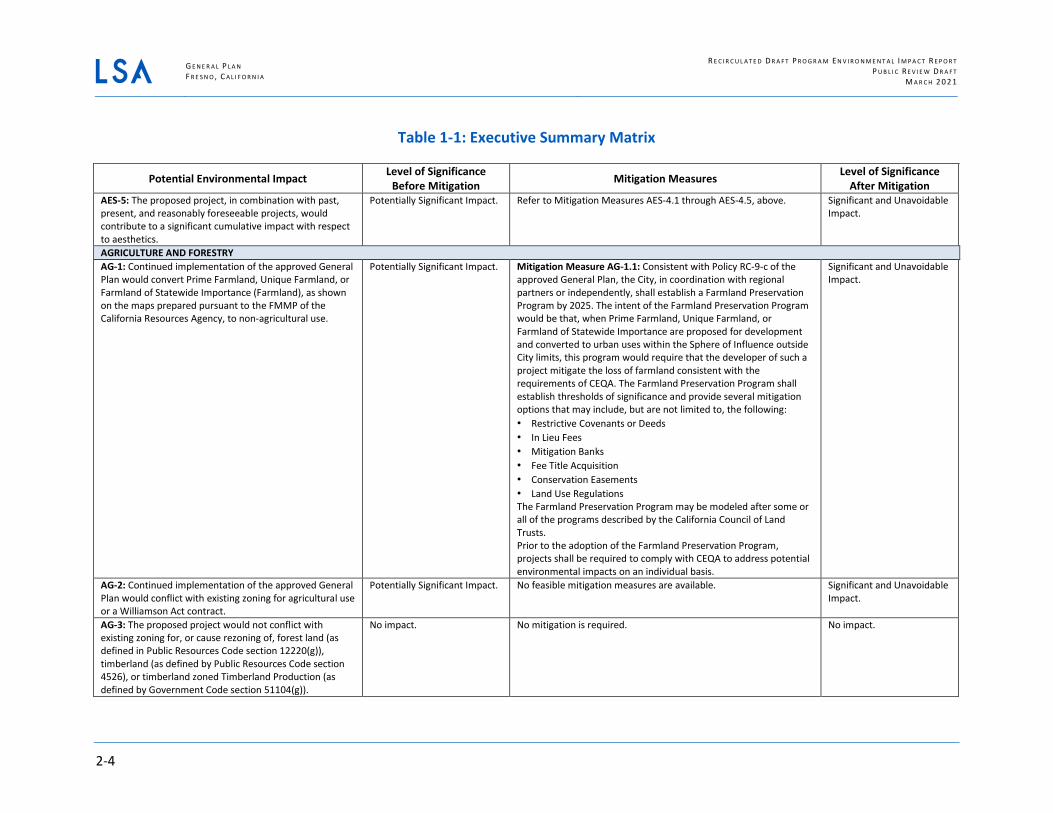
After Mitigation AES-5: The proposed project, in combination with past, present, and reasonably foreseeable projects, would contribute to a significant cumulative impact with respect to aesthetics.
Potentially Significant Impact. Refer to Mitigation Measures AES-4.1 through AES-4.5, above. Significant and Unavoidable Impact.
AGRICULTURE AND FORESTRY AG-1: Continued implementation of the approved General Plan would convert Prime Farmland, Unique Farmland, or Farmland of Statewide Importance (Farmland), as shown on the maps prepared pursuant to the FMMP of the California Resources Agency, to non-agricultural use.
Potentially Significant Impact. Mitigation Measure AG-1.1: Consistent with Policy RC-9-c of the approved General Plan, the City, in coordination with regional partners or independently, shall establish a Farmland Preservation Program by 2025. The intent of the Farmland Preservation Program would be that, when Prime Farmland, Unique Farmland, or Farmland of Statewide Importance are proposed for development and converted to urban uses within the Sphere of Influence outside City limits, this program would require that the developer of such a project mitigate the loss of farmland consistent with the requirements of CEQA. The Farmland Preservation Program shall establish thresholds of significance and provide several mitigation options that may include, but are not limited to, the following: • Restrictive Covenants or Deeds • In Lieu Fees • Mitigation Banks • Fee Title Acquisition • Conservation Easements • Land Use Regulations The Farmland Preservation Program may be modeled after some or all of the programs described by the California Council of Land Trusts. Prior to the adoption of the Farmland Preservation Program, projects shall be required to comply with CEQA to address potential environmental impacts on an individual basis.
Significant and Unavoidable Impact.
AG-2: Continued implementation of the approved General Plan would conflict with existing zoning for agricultural use or a Williamson Act contract.
Potentially Significant Impact. No feasible mitigation measures are available. Significant and Unavoidable Impact.
AG-3: The proposed project would not conflict with existing zoning for, or cause rezoning of, forest land (as defined in Public Resources Code section 12220(g)), timberland (as defined by Public Resources Code section 4526), or timberland zoned Timberland Production (as defined by Government Code section 51104(g)).
No impact. No mitigation is required. No impact.
R E C I R C U L A T E D D R A F T P R O G R A M E N V I R O N M E N T A L I M P A C T R E P O R T P U B L I C R E V I E W D R A F T M A R C H 2 0 2 1
G E N E R A L P L A N F R E S N O , C A L I F O R N I A
2-5
Table 1-1: Executive Summary Matrix
Potential Environmental Impact Level of Significance Before Mitigation Mitigation Measures Level of Significance
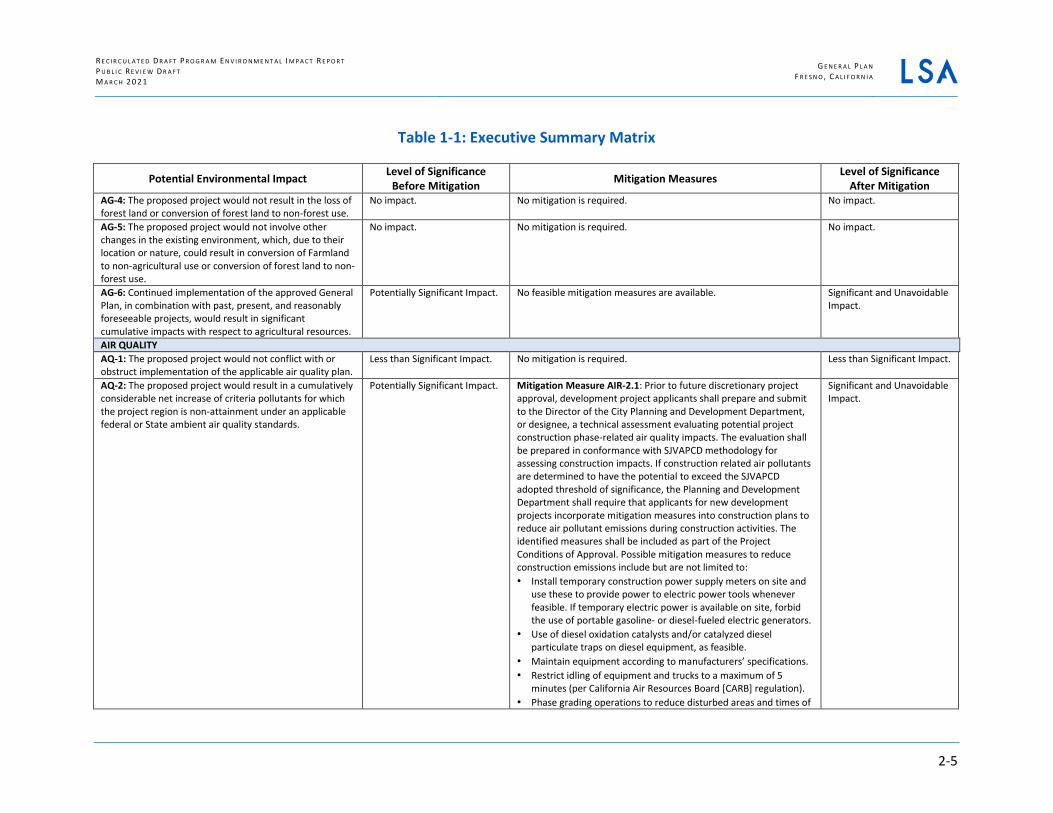
After Mitigation AG-4: The proposed project would not result in the loss of forest land or conversion of forest land to non-forest use.
No impact. No mitigation is required. No impact.
AG-5: The proposed project would not involve other changes in the existing environment, which, due to their location or nature, could result in conversion of Farmland to non-agricultural use or conversion of forest land to non-forest use.
No impact. No mitigation is required. No impact.
AG-6: Continued implementation of the approved General Plan, in combination with past, present, and reasonably foreseeable projects, would result in significant cumulative impacts with respect to agricultural resources.
Potentially Significant Impact. No feasible mitigation measures are available. Significant and Unavoidable Impact.
AIR QUALITY AQ-1: The proposed project would not conflict with or obstruct implementation of the applicable air quality plan.
Less than Significant Impact. No mitigation is required. Less than Significant Impact.
AQ-2: The proposed project would result in a cumulatively considerable net increase of criteria pollutants for which the project region is non-attainment under an applicable federal or State ambient air quality standards.
Potentially Significant Impact. Mitigation Measure AIR-2.1: Prior to future discretionary project approval, development project applicants shall prepare and submit to the Director of the City Planning and Development Department, or designee, a technical assessment evaluating potential project construction phase-related air quality impacts. The evaluation shall be prepared in conformance with SJVAPCD methodology for assessing construction impacts. If construction related air pollutants are determined to have the potential to exceed the SJVAPCD adopted threshold of significance, the Planning and Development Department shall require that applicants for new development projects incorporate mitigation measures into construction plans to reduce air pollutant emissions during construction activities. The identified measures shall be included as part of the Project Conditions of Approval. Possible mitigation measures to reduce construction emissions include but are not limited to: • Install temporary construction power supply meters on site and
use these to provide power to electric power tools whenever feasible. If temporary electric power is available on site, forbid the use of portable gasoline- or diesel-fueled electric generators.
• Use of diesel oxidation catalysts and/or catalyzed diesel particulate traps on diesel equipment, as feasible.
• Maintain equipment according to manufacturers’ specifications. • Restrict idling of equipment and trucks to a maximum of 5
minutes (per California Air Resources Board [CARB] regulation). • Phase grading operations to reduce disturbed areas and times of
Significant and Unavoidable Impact.

G E N E R A L P L A N F R E S N O , C A L I F O R N I A
R E C I R C U L A T E D D R A F T P R O G R A M E N V I R O N M E N T A L I M P A C T R E P O R T P U B L I C R E V I E W D R A F T
M A R C H 2 0 2 1
2-6
Table 1-1: Executive Summary Matrix
Potential Environmental Impact Level of Significance Before Mitigation Mitigation Measures Level of Significance
After Mitigation exposure.
• Avoid excavation and grading during wet weather. • Limit on-site construction routes and stabilize construction
entrance(s). • Remove existing vegetation only when absolutely necessary. • Sweep up spilled dry materials (e.g., cement, mortar, or dirt
track-out) immediately. Never attempt to wash them away with water. Use only minimal water for dust control.
• Store stockpiled materials and wastes under a temporary roof or secured plastic sheeting or tarp.
Mitigation Measure AIR-2.2: Prior to future discretionary project approval, development project applicants shall prepare and submit to the Director of the City Planning and Development Department, or designee, a technical assessment evaluating potential project operation-related air quality impacts. The evaluation shall be prepared in conformance with SJVAPCD methodology in assessing air quality impacts. If operation-related air pollutants are determined to have the potential to exceed the SJVAPCD-adopted thresholds of significance, the Planning and Development Department shall require that applicants for new development projects incorporate mitigation measures to reduce air pollutant emissions during operational activities. The identified measures shall be included as part of the Project Conditions of Approval. Possible mitigation measures to reduce long-term emissions include but are not limited to: • For site-specific development that requires refrigerated vehicles,
the construction documents shall demonstrate an adequate number of electrical service connections at loading docks for plugging in the anticipated number of refrigerated trailers to reduce idling time and emissions.
• Applicants for manufacturing and light industrial uses shall consider energy storage (i.e., battery) and combined heat and power (CHP, also known as cogeneration) in appropriate applications to optimize renewable energy generation systems and avoid peak energy use.
• Site-specific developments with truck delivery and loading areas and truck parking spaces shall include signage as a reminder to limit idling of vehicles while parked for loading/unloading in accordance with CARB Rule 2845 (13 California Code of

R E C I R C U L A T E D D R A F T P R O G R A M E N V I R O N M E N T A L I M P A C T R E P O R T P U B L I C R E V I E W D R A F T M A R C H 2 0 2 1
G E N E R A L P L A N F R E S N O , C A L I F O R N I A
2-7
Table 1-1: Executive Summary Matrix
Potential Environmental Impact Level of Significance Before Mitigation Mitigation Measures Level of Significance
After Mitigation Regulations [CCR] Chapter 10, Section 2485).
• Require that 240-volt electrical outlets or Level 3 chargers be installed in parking lots that would enable charging of neighborhood electric vehicles (NEVs) and/or battery powered vehicles.
• Maximize use of solar energy including solar panels; installing the maximum possible number of solar energy arrays on building roofs throughout the city to generate solar energy.
• Maximize the planting of trees in landscaping and parking lots. • Use light-colored paving and roofing materials. • Require use of electric or alternatively fueled street-sweepers
with HEPA filters. • Require use of electric lawn mowers and leaf blowers. • Utilize only Energy Star heating, cooling, and lighting devices,
and appliances. • Use of water-based or low volatile organic compound (VOC)
cleaning products. AQ-3: Development projects associated with the continued implementation of the approved General Plan could expose sensitive receptors to substantial pollutant concentrations.
Potentially significant impact. Mitigation Measure AIR-3.1: Prior to future discretionary approval for projects that require environmental evaluation under CEQA, the City of Fresno shall evaluate new development proposals for new industrial or warehousing land uses that: (1) have the potential to generate 100 or more truck trips per day or have 40 or more trucks with operating diesel-powered transport refrigeration units, and (2) are within 1,000 feet of a sensitive land use (e.g., residential, schools, hospitals, or nursing homes), as measured from the property line of the project to the property line of the nearest sensitive use. Such projects shall submit a Health Risk Assessment (HRA) to the City Planning and Development Department. The HRA shall be prepared in accordance with policies and procedures of the most current State Office of Environmental Health Hazard Assessment (OEHHA) and the SJVAPCD. If the HRA shows that the incremental health risks exceed their respective thresholds, as established by the SJVAPCD at the time a project is considered, the Applicant will be required to identify and demonstrate that best available control technologies for toxics (T-BACTs), including appropriate enforcement mechanisms to reduce risks to an acceptable level. T-BACTs may include, but are not limited to: • Restricting idling on site or electrifying warehousing docks to
reduce diesel particulate matter;
Significant and Unavoidable Impact.
G E N E R A L P L A N F R E S N O , C A L I F O R N I A
R E C I R C U L A T E D D R A F T P R O G R A M E N V I R O N M E N T A L I M P A C T R E P O R T P U B L I C R E V I E W D R A F T
M A R C H 2 0 2 1
2-8
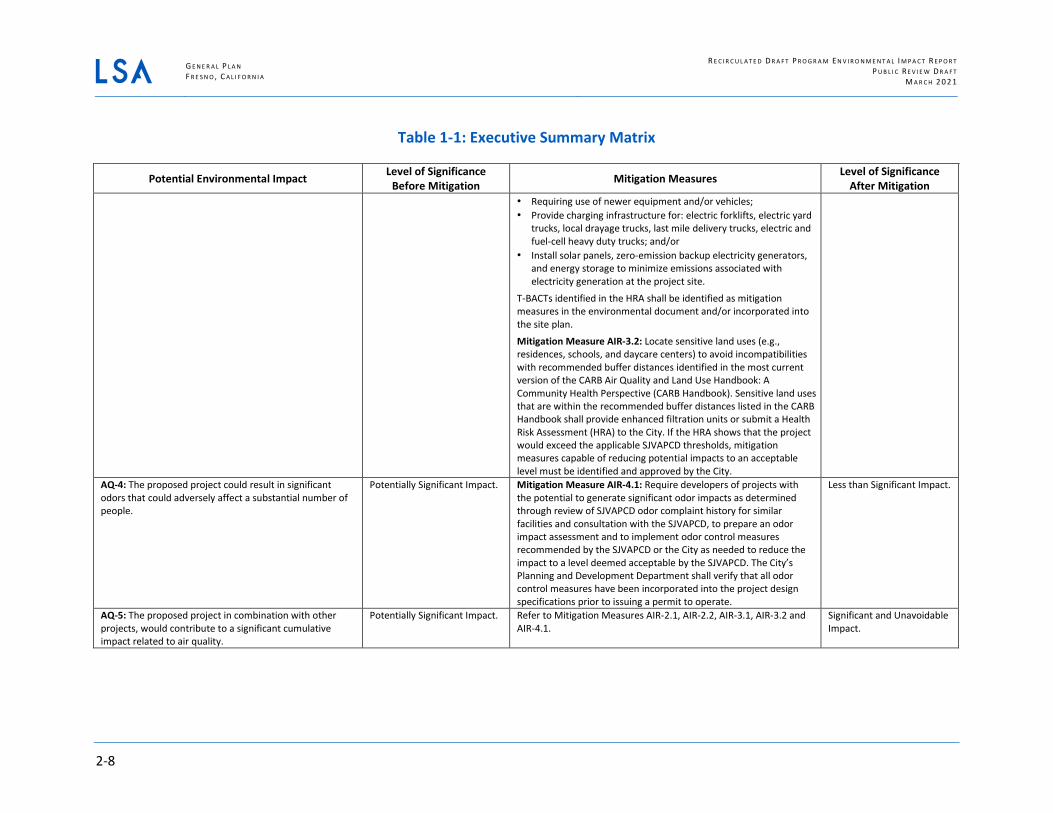
Table 1-1: Executive Summary Matrix
Potential Environmental Impact Level of Significance Before Mitigation Mitigation Measures Level of Significance
After Mitigation • Requiring use of newer equipment and/or vehicles; • Provide charging infrastructure for: electric forklifts, electric yard
trucks, local drayage trucks, last mile delivery trucks, electric and fuel-cell heavy duty trucks; and/or
• Install solar panels, zero-emission backup electricity generators, and energy storage to minimize emissions associated with electricity generation at the project site.
T-BACTs identified in the HRA shall be identified as mitigation measures in the environmental document and/or incorporated into the site plan.
Mitigation Measure AIR-3.2: Locate sensitive land uses (e.g., residences, schools, and daycare centers) to avoid incompatibilities with recommended buffer distances identified in the most current version of the CARB Air Quality and Land Use Handbook: A Community Health Perspective (CARB Handbook). Sensitive land uses that are within the recommended buffer distances listed in the CARB Handbook shall provide enhanced filtration units or submit a Health Risk Assessment (HRA) to the City. If the HRA shows that the project would exceed the applicable SJVAPCD thresholds, mitigation measures capable of reducing potential impacts to an acceptable level must be identified and approved by the City.
AQ-4: The proposed project could result in significant odors that could adversely affect a substantial number of people.
Potentially Significant Impact. Mitigation Measure AIR-4.1: Require developers of projects with the potential to generate significant odor impacts as determined through review of SJVAPCD odor complaint history for similar facilities and consultation with the SJVAPCD, to prepare an odor impact assessment and to implement odor control measures recommended by the SJVAPCD or the City as needed to reduce the impact to a level deemed acceptable by the SJVAPCD. The City’s Planning and Development Department shall verify that all odor control measures have been incorporated into the project design specifications prior to issuing a permit to operate.
Less than Significant Impact.
AQ-5: The proposed project in combination with other projects, would contribute to a significant cumulative impact related to air quality.
Potentially Significant Impact. Refer to Mitigation Measures AIR-2.1, AIR-2.2, AIR-3.1, AIR-3.2 and AIR-4.1.
Significant and Unavoidable Impact.
R E C I R C U L A T E D D R A F T P R O G R A M E N V I R O N M E N T A L I M P A C T R E P O R T P U B L I C R E V I E W D R A F T M A R C H 2 0 2 1
G E N E R A L P L A N F R E S N O , C A L I F O R N I A
2-9
Table 1-1: Executive Summary Matrix
Potential Environmental Impact Level of Significance Before Mitigation Mitigation Measures Level of Significance
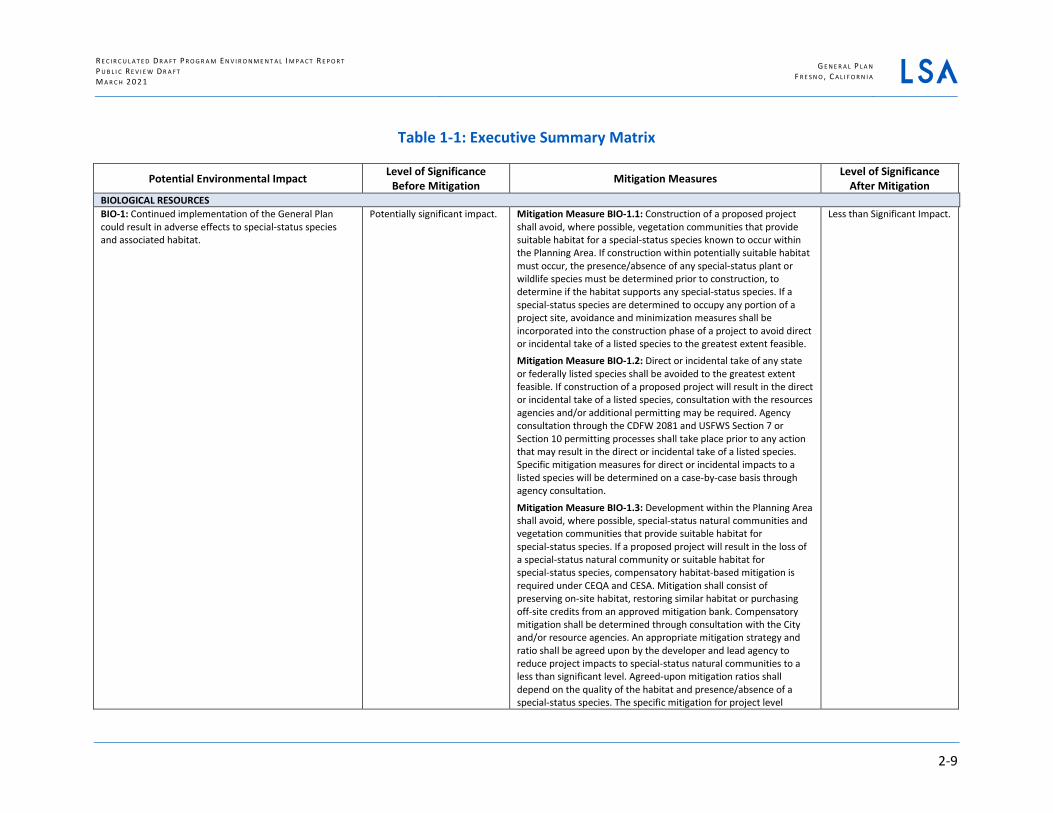
After Mitigation BIOLOGICAL RESOURCES BIO-1: Continued implementation of the General Plan could result in adverse effects to special-status species and associated habitat.
Potentially significant impact. Mitigation Measure BIO-1.1: Construction of a proposed project shall avoid, where possible, vegetation communities that provide suitable habitat for a special-status species known to occur within the Planning Area. If construction within potentially suitable habitat must occur, the presence/absence of any special-status plant or wildlife species must be determined prior to construction, to determine if the habitat supports any special-status species. If a special-status species are determined to occupy any portion of a project site, avoidance and minimization measures shall be incorporated into the construction phase of a project to avoid direct or incidental take of a listed species to the greatest extent feasible.
Mitigation Measure BIO-1.2: Direct or incidental take of any state or federally listed species shall be avoided to the greatest extent feasible. If construction of a proposed project will result in the direct or incidental take of a listed species, consultation with the resources agencies and/or additional permitting may be required. Agency consultation through the CDFW 2081 and USFWS Section 7 or Section 10 permitting processes shall take place prior to any action that may result in the direct or incidental take of a listed species. Specific mitigation measures for direct or incidental impacts to a listed species will be determined on a case-by-case basis through agency consultation.
Mitigation Measure BIO-1.3: Development within the Planning Area shall avoid, where possible, special-status natural communities and vegetation communities that provide suitable habitat for special-status species. If a proposed project will result in the loss of a special-status natural community or suitable habitat for special-status species, compensatory habitat-based mitigation is required under CEQA and CESA. Mitigation shall consist of preserving on-site habitat, restoring similar habitat or purchasing off-site credits from an approved mitigation bank. Compensatory mitigation shall be determined through consultation with the City and/or resource agencies. An appropriate mitigation strategy and ratio shall be agreed upon by the developer and lead agency to reduce project impacts to special-status natural communities to a less than significant level. Agreed-upon mitigation ratios shall depend on the quality of the habitat and presence/absence of a special-status species. The specific mitigation for project level
Less than Significant Impact.

G E N E R A L P L A N F R E S N O , C A L I F O R N I A
R E C I R C U L A T E D D R A F T P R O G R A M E N V I R O N M E N T A L I M P A C T R E P O R T P U B L I C R E V I E W D R A F T
M A R C H 2 0 2 1
2-10
Table 1-1: Executive Summary Matrix
Potential Environmental Impact Level of Significance Before Mitigation Mitigation Measures Level of Significance
After Mitigation impacts shall be determined on a case-by-case basis.
Mitigation Measure BIO-1.4: Proposed projects within the Planning Area should avoid, if possible, construction within the general nesting season of February through August for avian species protected under Fish and Game Code 3500 and the Migratory Bird Treaty Act (MBTA), if it is determined that suitable nesting habitat occurs on a project site. If construction cannot avoid the nesting season, a pre-construction clearance survey shall be conducted by a qualified biologist to determine if any nesting birds or nesting activity is observed on or within 500-feet of a project site. If an active nest is observed during the survey, a biological monitor shall be on site to ensure that no proposed project activities would impact the active nest. A suitable buffer shall be established around the active nest until the nestlings have fledged and the nest is no longer active. Project activities may continue in the vicinity of the nest only at the discretion of the biological monitor. Prior to commencement of grading activities and issuance of any building permits, the Director of the City of Fresno Planning and Development Department, or designee, shall verify that all proposed project grading and construction plans include specific documentation regarding the requirements of the Migratory Bird Treaty Act (MBTA) and California Fish and Game Code Section 3503, that preconstruction surveys have been completed and the results reviewed by staff, and that the appropriate buffers (if needed) are noted on the plans and established in the field.
BIO-2: The project would have a substantial adverse effect on any riparian habitat or other sensitive natural community.
Potentially Significant Impact. Mitigation Measure BIO-2.1: A pre-construction clearance survey shall be conducted by a qualified biologist to determine if a proposed project will result in the removal or impact to any riparian habitat and/or a special-status natural community with potential to occur in the Planning Area, compensatory habitat-based mitigation shall be required to reduce project impacts. Compensatory mitigation must involve the preservation or restoration or the purchase of off-site mitigation credits for impacts to riparian habitat and/or a special-status natural community. Mitigation must be conducted in-kind or within an approved mitigation bank in the region. The specific mitigation ratio for habitat-based mitigation shall be determined through consultation with the appropriate agency (i.e., CDFW or USFWS) on a case-by-case basis. The project applicant/developer for a proposed project shall develop and
Less Than Significant Impact.

R E C I R C U L A T E D D R A F T P R O G R A M E N V I R O N M E N T A L I M P A C T R E P O R T P U B L I C R E V I E W D R A F T M A R C H 2 0 2 1
G E N E R A L P L A N F R E S N O , C A L I F O R N I A
2-11
Table 1-1: Executive Summary Matrix
Potential Environmental Impact Level of Significance Before Mitigation Mitigation Measures Level of Significance
After Mitigation implement appropriate mitigation regarding impacts on their respective jurisdictions.
Mitigation Measure BIO-2.2: A pre-construction clearance survey shall be conducted by a qualified biologist to determine if a proposed project will result in significant impacts to streambeds or waterways protected under Section 1600 of Fish and Wildlife Code and Section 404 of the CWA. The project applicant/developer for a proposed project shall consult with partner agencies such as CDFW and/or USACE to develop and implement appropriate mitigation regarding impacts on their respective jurisdictions, determination of mitigation strategy, and regulatory permitting to reduce impacts, as required for projects that remove riparian habitat and/or alter a streambed or waterway. The project applicant/developer shall implement mitigation as directed by the agency with jurisdiction over the particular impact identified.
Mitigation Measure BIO-2.3: Prior to project approval, a pre-construction clearance survey shall be conducted by a qualified biologist to determine if a proposed project will result in project-related impacts to riparian habitat or a special-status natural community or if it may result in direct or incidental impacts to special-status species associated with riparian or wetland habitats. The project applicant/developer for a proposed project shall be obligated to address project-specific impacts to special-status species associated with riparian habitat through agency consultation, development of a mitigation strategy, and/or issuing incidental take permits for the specific special-status species, as determined by the CDFW and/or USFWS.
BIO-3: Implementation of the project would have a substantial adverse effect on state or federally protected wetlands.
Potentially Significant Impact. Mitigation Measure BIO-3.1: If a proposed project will result in the significant alteration or fill of a federally protected wetland, a formal wetland delineation conducted according to USACE accepted methodology is required for each project to determine the extent of wetlands on a project site. The delineation shall be used to determine if federal permitting and mitigation strategy are required to reduce project impacts. Acquisition of permits from USACE for the fill of wetlands and USACE approval of a wetland mitigation plan would ensure a “no net loss” of wetland habitat within the Planning Area. Appropriate wetland mitigation/creation shall be implemented in a ratio according to the size of the impacted wetland.
Less Than Significant Impact.

G E N E R A L P L A N F R E S N O , C A L I F O R N I A
R E C I R C U L A T E D D R A F T P R O G R A M E N V I R O N M E N T A L I M P A C T R E P O R T P U B L I C R E V I E W D R A F T
M A R C H 2 0 2 1
2-12
Table 1-1: Executive Summary Matrix
Potential Environmental Impact Level of Significance Before Mitigation Mitigation Measures Level of Significance
After Mitigation Mitigation Measure BIO-3.2: In addition to regulatory agency permitting, Best Management Practices identified from a list provided by the USACE shall be incorporated into the design and construction phase of the project to ensure that no pollutants or siltation drain into a federally protected wetland. Project design features such as fencing, appropriate drainage and incorporating detention basins shall assist in ensuring project-related impacts to wetland habitat are minimized to the greatest extent feasible.
BIO-4: The project would not interfere substantially with the movement of any native resident or migratory fish or wildlife species or with established native resident or migratory wildlife corridors or impede the use of native wildlife nursery sites.
Less than Significant Impact.
No mitigation is required. Less than Significant Impact.
BIO-5: The project would not conflict with any local policies or ordinances protecting biological resources, such as a tree preservation policy or ordinance.
Less than Significant Impact.
No mitigation is required. Less than Significant Impact.
BIO-6: The project would not conflict with the provisions of an adopted Habitat Conservation Plan, Natural Community Conservation Plan, or other approved local, regional, or state habitat conservation plan
No Impact.
No mitigation is required. No Impact.
BIO-7: Implementation of the project would have a substantial adverse cumulative effect on state or federally protected wetlands.
Potentially Significant Impact. Refer to Mitigation Measures BIO-1.1 through BIO-1.4, Mitigation Measures BIO-2.1 through BIO-2.3, and Mitigation Measures BIO-3.1 through BIO-3.2.
Less Than Significant Impact.
CULTURAL RESOURCES CUL-1: The project could cause a substantial adverse change in the significance of a historical resource as defined in Section 15064.5 of the CEQA Guidelines.
Potentially Significant Impact. Mitigation Measure CUL-1.1: If previously unknown resources are encountered before or during grading activities, construction shall stop in the immediate vicinity of the find and a qualified historical resources specialist shall be consulted to determine whether the resource requires further study. The qualified historical resources specialist shall make recommendations to the City on the measures that shall be implemented to protect the discovered resources, including but not limited to excavation of the finds and evaluation of the finds in accordance with Section 15064.5 of the CEQA Guidelines and the City’s Historic Preservation Ordinance. If the resources are determined to be unique historical resources as defined under Section 15064.5 of the CEQA Guidelines, measures shall be identified by the monitor and recommended to the Lead Agency. Appropriate measures for significant resources could include avoidance or capping, incorporation of the site in green space,
Less Than Significant Impact.

R E C I R C U L A T E D D R A F T P R O G R A M E N V I R O N M E N T A L I M P A C T R E P O R T P U B L I C R E V I E W D R A F T M A R C H 2 0 2 1
G E N E R A L P L A N F R E S N O , C A L I F O R N I A
2-13
Table 1-1: Executive Summary Matrix
Potential Environmental Impact Level of Significance Before Mitigation Mitigation Measures Level of Significance
After Mitigation parks, or open space, or data recovery excavations of the finds.
No further grading shall occur in the area of the discovery until the Lead Agency approves the measures to protect these resources. Any historical artifacts recovered as a result of mitigation shall be provided to a City-approved institution or person who is capable of providing long-term preservation to allow future scientific study.
Mitigation Measure CUL-1.2: Prior to approval of any discretionary project that could result in an adverse change to a potential historic and/or cultural resource, the City shall require a site-specific evaluation of historic and/or cultural resources by a professional who meets the Secretary of Interior’s Qualifications. The evaluation shall provide recommendations to mitigate potential impacts to historic and/or cultural resources and shall be approved by the Directory of Planning and Development.
CUL-2: The project could cause a substantial adverse change in the significance of an archaeological resource as defined in Section 15064.5 of the CEQA Guidelines.
Potentially Significant Impact. Mitigation Measure CUL-2: Subsequent to a preliminary City review of the project grading plans, if there is evidence that a project will include excavation or construction activities within previously undisturbed soils, a field survey and literature search for prehistoric archaeological resources shall be conducted. The following procedures shall be followed. • If prehistoric resources are not found during either the field
survey or literature search, excavation and/or construction activities can commence. In the event that buried prehistoric archaeological resources are discovered during excavation and/or construction activities, construction shall stop in the immediate vicinity of the find and a qualified archaeologist shall be consulted to determine whether the resource requires further study. The qualified archaeologist shall make recommendations to the City on the measures that shall be implemented to protect the discovered resources, including but not limited to excavation of the finds and evaluation of the finds in accordance with Section 15064.5 of the CEQA Guidelines. If the resources are determined to be unique prehistoric archaeological resources as defined under Section 15064.5 of the CEQA Guidelines, mitigation measures shall be identified by the monitor and recommended to the Lead Agency. Appropriate measures for significant resources could include avoidance or capping, incorporation of the site in green space, parks, or open space, or data recovery excavations of the finds. No further grading shall
Less Than Significant Impact.

G E N E R A L P L A N F R E S N O , C A L I F O R N I A
R E C I R C U L A T E D D R A F T P R O G R A M E N V I R O N M E N T A L I M P A C T R E P O R T P U B L I C R E V I E W D R A F T
M A R C H 2 0 2 1
2-14
Table 1-1: Executive Summary Matrix
Potential Environmental Impact Level of Significance Before Mitigation Mitigation Measures Level of Significance
After Mitigation occur in the area of the discovery until the Lead Agency approves the measures to protect these resources. Any prehistoric archaeological artifacts recovered as a result of mitigation shall be provided to a City-approved institution or person who is capable of providing long-term preservation to allow future scientific study.
• If prehistoric resources are found during the field survey or literature review, the resources shall be inventoried using appropriate State record forms and submit the forms to the Southern San Joaquin Valley Information Center. The resources shall be evaluated for significance. If the resources are found to be significant, measures shall be identified by the qualified archaeologist. Similar to above, appropriate mitigation measures for significant resources could include avoidance or capping, incorporation of the site in green space, parks, or open space, or data recovery excavations of the finds. In addition, appropriate mitigation for excavation and construction activities in the vicinity of the resources found during the field survey or literature review shall include an archaeological monitor. The monitoring period shall be determined by the qualified archaeologist. If additional prehistoric archaeological resources are found during excavation and/or construction activities, the procedure identified above for the discovery of unknown resources shall be followed.
CUL-3: The project could disturb human remains, including those interred outside of formal cemeteries.
Potentially Significant Impact. Mitigation Measure CUL-3: In the event that human remains are unearthed during excavation and grading activities of any future development project, all activity shall cease immediately. Pursuant to Health and Safety Code (HSC) Section 7050.5, no further disturbance shall occur until the County Coroner has made the necessary findings as to origin and disposition pursuant to PRC Section 5097.98(a). If the remains are determined to be of Native American descent, the coroner shall within 24 hours notify the Native American Heritage Commission (NAHC). The NAHC shall then contact the most likely descendent of the deceased Native American, who shall then serve as the consultant on how to proceed with the remains. Pursuant to PRC Section 5097.98(b), upon the discovery of Native American remains, the landowner shall ensure that the immediate vicinity, according to generally accepted cultural or archaeological standards or practices, where the Native American human remains are located is not damaged or disturbed by further development activity until the landowner has discussed and
Less Than Significant Impact.

R E C I R C U L A T E D D R A F T P R O G R A M E N V I R O N M E N T A L I M P A C T R E P O R T P U B L I C R E V I E W D R A F T M A R C H 2 0 2 1
G E N E R A L P L A N F R E S N O , C A L I F O R N I A
2-15
Table 1-1: Executive Summary Matrix
Potential Environmental Impact Level of Significance Before Mitigation Mitigation Measures Level of Significance
After Mitigation conferred with the most likely descendants regarding their recommendations, if applicable, taking into account the possibility of multiple human remains. The landowner shall discuss and confer with the descendants all reasonable options regarding the descendants' preferences for treatment.
CUL-4: Implementation of the proposed project would have the potential to impact TCRs, the disturbance of which could result in a significant impact under CEQA.
Potentially Significant Impact. Refer to Mitigation Measures CUL-1, CUL-2 and CUL-3. Less Than Significant Impact.
CUL-5: Continued implementation of the approved General Plan could result in cumulative impacts to cultural resources.
Potentially Significant Impact. Refer to Mitigation Measures CUL-1.1 and CUL-1.2, Mitigation Measure CUL-2, and Mitigation Measure CUL-3.
Less Than Significant Impact.
ENERGY ENG-1: The proposed project would not result in potentially significant environmental impact due to wasteful, inefficient, or unnecessary consumption of energy resources during project construction or operation.
Less Than Significant Impact. No mitigation is required. Less Than Significant Impact.
ENG-2: The proposed project would not conflict with or obstruct a state or local plan for renewable energy or energy efficiency.
Less Than Significant Impact. No mitigation is required. Less Than Significant Impact.
ENG-3: The proposed project, in combination with past, present, and reasonably foreseeable projects, would result in less than significant cumulative impacts with respect to energy.
Less Than Significant Impact. No mitigation is required. Less Than Significant Impact.
GEOLOGY AND SOILS GEO-1: The project would not directly or indirectly cause potential substantial adverse effects, including the risk of loss, injury, or death involving: a. Rupture of a known earthquake fault, as delineated on the most recent Alquist-Priolo Earthquake Fault Zoning Map issued by the State Geologist for the area or based on other substantial evidence of a known fault? (Refer to California Geological Survey Special Publication 42.); b. Strong seismic ground shaking; c. Seismic-related ground failure, including liquefaction; d. Landslides
Less Than Significant Impact. No mitigation is required. Less Than Significant Impact.
GEO-2: The project would not result in substantial soil erosion or the loss of topsoil.
Less Than Significant Impact. No mitigation is required. Less Than Significant Impact.

G E N E R A L P L A N F R E S N O , C A L I F O R N I A
R E C I R C U L A T E D D R A F T P R O G R A M E N V I R O N M E N T A L I M P A C T R E P O R T P U B L I C R E V I E W D R A F T
M A R C H 2 0 2 1
2-16
Table 1-1: Executive Summary Matrix
Potential Environmental Impact Level of Significance Before Mitigation Mitigation Measures Level of Significance
After Mitigation GEO-3: The project would not be located on a geologic unit or soil that is unstable, or that would become unstable as a result of the project, and potentially result in on- or off-site landslide, lateral spreading, subsidence, liquefaction, or collapse.
Less Than Significant Impact. No mitigation is required. Less Than Significant Impact.
GEO-4: The project would not be located on expansive soil, as defined in Table 18-1-B of the Uniform Building Code (1994, as updated), creating substantial direct or indirect risks to life or property.
Less Than Significant Impact. No mitigation is required. Less Than Significant Impact.
GEO-5: The project does not contain soils incapable of adequately supporting the use of septic tanks or alternative wastewater disposal systems where sewers are not available for the disposal of waste water.
No impact. No mitigation is required. No Impact.
GEO-6: Implementation of the project may directly or indirectly destroy a unique paleontological resource or site or unique geologic feature.
Potentially Significant Impact. Mitigation Measure GEO-6.1: Subsequent to a preliminary City review of the project grading plans, if there is evidence that a project will include excavation or construction activities within previously undisturbed soils, a field survey and literature search for unique paleontological/geological resources shall be conducted. The following procedures shall be followed: • If unique paleontological/geological resources are not found
during either the field survey or literature search, excavation and/or construction activities can commence. In the event that unique paleontological/geological resources are discovered during excavation and/or construction activities, construction shall stop in the immediate vicinity of the find and a qualified paleontologist shall be consulted to determine whether the resource requires further study. The qualified paleontologist shall make recommendations to the City on the measures that shall be implemented to protect the discovered resources, including but not limited to, excavation of the finds and evalua-tion of the finds. If the resources are determined to be significant, mitigation measures shall be identified by the monitor and recommended to the Lead Agency. Appropriate mitigation measures for significant resources could include avoidance or capping, incorporation of the site in green space, parks, or open space, or data recovery excavations of the finds. No further grading shall occur in the area of the discovery until the Lead Agency approves the measures to protect these resources. Any paleontological/geological resources recovered as a result of mitigation shall be provided to a City-approved
Less Than Significant Impact.

R E C I R C U L A T E D D R A F T P R O G R A M E N V I R O N M E N T A L I M P A C T R E P O R T P U B L I C R E V I E W D R A F T M A R C H 2 0 2 1
G E N E R A L P L A N F R E S N O , C A L I F O R N I A
2-17
Table 1-1: Executive Summary Matrix
Potential Environmental Impact Level of Significance Before Mitigation Mitigation Measures Level of Significance
After Mitigation institution or person who is capable of providing long-term preservation to allow future scientific study.
• If unique paleontological/geological resources are found during the field survey or literature review, the resources shall be inventoried and evaluated for significance. If the resources are found to be significant, mitigation measures shall be identified by the qualified paleontologist. Similar to above, appropriate mitigation measures for significant resources could include avoidance or capping, incorporation of the site in green space, parks, or open space, or data recovery excavations of the finds. In addition, appropriate mitigation for excavation and construction activities in the vicinity of the resources found during the field survey or literature review shall include a paleontological monitor. The monitoring period shall be determined by the qualified paleontologist. If additional paleontological/geological resources are found during excavation and/or construction activities, the procedure identified above for the discovery of unknown resources shall be followed.
GEO-7: Continued implementation of the approved General Plan, in combination with past, present, and reasonably foreseeable projects, would result in significant cumulative impacts with respect to paleontological resources.
Potentially Significant Impact. Refer to Mitigation Measures GEO-6.1. Less than Significant Impact
GREENHOUSE GAS EMISSIONS GHG-1: The project would generate greenhouse gas emissions, either directly or indirectly, that may have a significant impact on the environment
Potentially Significant Impact. Mitigation Measure GHG-1.1: Prior to the City’s approval of subsequent discretionary projects, the Director of the City Planning and Development Department, or designee, shall confirm that Ddevelopment projects that require discretionary approval shall beare consistent with the Recirculated GHG Reduction Plan Update (20212020) and shall implement all measures deemed applicable to the project through the GHG Reduction Plan Update-Project Consistency Checklist (Appendix B to the GHG Reduction Plan Update).
Less than Significant Impact.
GHG-2: The proposed project would conflict with an applicable plan, policy or regulation adopted for the purpose of reducing the emissions of greenhouse gases.
Less Than Significant Impact. No mitigation is required. Less Than Significant Impact.

G E N E R A L P L A N F R E S N O , C A L I F O R N I A
R E C I R C U L A T E D D R A F T P R O G R A M E N V I R O N M E N T A L I M P A C T R E P O R T P U B L I C R E V I E W D R A F T
M A R C H 2 0 2 1
2-18
Table 1-1: Executive Summary Matrix
Potential Environmental Impact Level of Significance Before Mitigation Mitigation Measures Level of Significance
After Mitigation GHG-3: The proposed project, in combination with past, present, and reasonably foreseeable projects, would result in significant cumulative impacts with respect to greenhouse gas emissions.
Potentially Significant Impact. Refer to Mitigation Measure GHG-1.1. Less Than Significant Impact.
HAZARDS AND HAZARDOUS MATERIALS HAZ-1: The project would not create a significant hazard to the public or the environment through the routine transport, use, or disposal of hazardous materials.
Less Than Significant Impact. No mitigation is required. Less Than Significant Impact.
HAZ-2: The project would not create a significant hazard to the public or the environment through reasonably foreseeable upset and/or accident conditions involving the release of hazardous materials into the environment.
Less Than Significant Impact. No mitigation is required. Less Than Significant Impact.
HAZ-3: The project would not emit hazardous emissions or handle hazardous or acutely hazardous materials, substances, or waste within one-quarter mile of an existing or proposed school.
Less Than Significant Impact. No mitigation is required. Less Than Significant Impact.
HAZ-4: The project could be located on a site which is included on a list of hazardous materials sites compiled pursuant to Government Code Section 65962.5 and, as a result, would create a significant hazard to the public or the environment.
Less Than Significant Impact. No mitigation is required. Less Than Significant Impact.
HAZ-5: The project would be located within an airport land use plan or, where such a plan has not been adopted, within two miles of a public airport or public use airport and would not result in a safety hazard for people residing or working in the project area.
Less Than Significant Impact. No mitigation is required. Less Than Significant Impact.
HAZ-6: Implementation of the project could impair implementation of or physically interfere with an adopted emergency response plan or emergency evacuation plan.
Potentially Significant Impact. Mitigation Measure HAZ-6.1: The City shall establish an alternative Emergency Operations Center in the event the current Emergency Operations Center is under redevelopment or inaccessible.
Less Than Significant Impact.
HAZ-7: The project would not expose people or structures, either directly or indirectly, to a significant risk of loss, injury, or death involving wildland fires.
Less Than Significant Impact. No mitigation is required. Less Than Significant Impact.
HAZ-8: Continued implementation of the approved General Plan, in combination with past, present, and reasonably foreseeable projects, would result in significant cumulative impacts with respect to implementation of adopted emergency response plan or emergency evacuation.
Potentially Significant Impact. Refer to Mitigation Measure HAZ-6.1. Less Than Significant Impact.

R E C I R C U L A T E D D R A F T P R O G R A M E N V I R O N M E N T A L I M P A C T R E P O R T P U B L I C R E V I E W D R A F T M A R C H 2 0 2 1
G E N E R A L P L A N F R E S N O , C A L I F O R N I A
2-19
Table 1-1: Executive Summary Matrix
Potential Environmental Impact Level of Significance Before Mitigation Mitigation Measures Level of Significance
After Mitigation HYDROLOGY AND WATER QUALITY HYD-1: The project would not violate any water quality standards or waste discharge requirements or otherwise substantially degrade surface or groundwater quality
Less Than Significant Impact. No mitigation is required. Less Than Significant Impact.
HYD-2: Implementation of the project would substantially decrease groundwater supplies or interfere substantially with groundwater recharge such that the project may impede sustainable groundwater management of the basin.
Potentially Significant Impact. Mitigation Measure HYD-2.1: The City shall continue to be an active participant in the North Kings Groundwater Sustainability Agency and the implementation of the North Kings Groundwater Sustainability Plan in order to ensure that the Kings Subbasin has balanced levels of pumping and recharge.
Less Than Significant Impact.
HYD-3: The project could create or contribute runoff water which would exceed the capacity of existing or planned stormwater drainage systems or provide substantial additional sources of polluted runoff.
Potentially Significant Impact. Mitigation Measure HYD-3.1: The City shall implement the following measures to reduce the impacts on the capacity of existing or planned SDFCMP collection systems: • Coordinate with FMFCD to implement the existing Storm
Drainage and Flood Control Master Plan (SDFCMP) for collection systems in drainage areas where the amount of imperviousness is unaffected by the change in land uses.
• Coordinate with FMFCD to update the SDFCMP in those drainage areas where the amount of imperviousness increased due to the change in land uses to determine the changes in the collection systems that would need to occur to provide adequate capacity for the stormwater runoff from the increased imperviousness.
• As development is proposed, implement current SDFCMP to provide stormwater collection systems that have sufficient capacity to convey the peak runoff rates from the areas of increased imperviousness.
• Require developments that increase site imperviousness to install, operate, and maintain FMFCD approved on-site detention systems to reduce the peak runoff rates resulting from the increased imperviousness to the peak runoff rates that will not exceed the capacity of the existing stormwater collection systems.
Mitigation Measure HYD-3.2: The City shall implement the following measures to reduce the impacts on the capacity of existing or planned SDFCMP retention basins:
Prior to approval of development projects, coordinate with FCMFCD to analyze the impacts to existing and planned retention basins to determine remedial measures required to reduce the impact on retention basin capacity to less than significant. Remedial measures would include:
Less Than Significant Impact.

G E N E R A L P L A N F R E S N O , C A L I F O R N I A
R E C I R C U L A T E D D R A F T P R O G R A M E N V I R O N M E N T A L I M P A C T R E P O R T P U B L I C R E V I E W D R A F T
M A R C H 2 0 2 1
2-20
Table 1-1: Executive Summary Matrix
Potential Environmental Impact Level of Significance Before Mitigation Mitigation Measures Level of Significance
After Mitigation 1. Increase the size of the retention basin through the purchase of
more land or deepening the basin or a combination for planned retention basins.
2. Increase the size of the emergency relief pump capacity required to pump excess runoff volume out of the basin and into adjacent canal that convey the stormwater to a disposal facility for existing retention basins.
3. Require developments that increase runoff volume to install, operate, and maintain, Low Impact Development (LID) measures to reduce runoff volume to the runoff volume that will not exceed the capacity of the existing retention basins.
Mitigation Measure HYD-3.3: The City shall implement the following measures to reduce the impacts on the capacity of existing or planned SDFCMP urban detention (stormwater quality) basins:
Prior to approval of development projects, coordinate with FCMFCD to determine the impacts to the urban detention basin weir overflow rates and determine remedial measures required to reduce the impact on the detention basin capacity to less than significant. Remedial measures would include: 1. Modify overflow weir to maintain the suspended solids removal
rates adopted by the FMFCD Board of Directors. 2. Increase the size of the urban detention basin to increase
residence time by purchasing more land. The existing detention basins are already at the adopted design depth.
3. Require developments that increase runoff volume to install, operate, and maintain, Low Impact Development (LID) measures to reduce peak runoff rates and runoff volume to the runoff rates and volumes that will not exceed the weir overflow rates of the existing urban detention basins.
Mitigation Measure HYD-3.4: The City shall implement the following measures to reduce the impacts on the capacity of existing or planned SDFCMP pump disposal systems: 1. Prior to approval of development projects, coordinate with
FCMFCD to determine the extent and degree to which the capacity of the existing pump system will be exceeded.
2. Require new developments to install, operate, and maintain on-site detention facilities, consistent with FMFCD design standards, to reduce peak stormwater runoff rates to existing planned peak runoff rates.

R E C I R C U L A T E D D R A F T P R O G R A M E N V I R O N M E N T A L I M P A C T R E P O R T P U B L I C R E V I E W D R A F T M A R C H 2 0 2 1
G E N E R A L P L A N F R E S N O , C A L I F O R N I A
2-21
Table 1-1: Executive Summary Matrix
Potential Environmental Impact Level of Significance Before Mitigation Mitigation Measures Level of Significance
After Mitigation 3. Provide additional pump system capacity to maximum allowed
by existing permitting to increase the capacity to match or exceed the peak runoff rates determined by the SDFCMP.
Mitigation Measure HYD-3.5: The City shall coordinate with FCMFCD to develop and adopt a storm drainage update to the SDFCMP for the Southeast Development Area that is designed to collect, convey and dispose of runoff rates and volumes based on the planned land uses of the approved General Plan.
HYD-4: The project would not conflict with or obstruct implementation of a water quality control plan or sustainable groundwater management plan.
Less than Significant Impact. No mitigation is required. Less than Significant Impact.
HYD-5: Continued implementation of the approved General Plan could result in cumulative impacts to water supply and hydrology.
Potentially Significant Impact. Refer to Mitigation Measures HYD-2.1, HYD-3.1, HYD-3.2, HYD-3.3, HYD-3.4, and HYD-3.5.
Less than Significant Impact.
LAND USE AND PLANNING LU-1: The proposed project would not physically divide an established community.
Less than Significant Impact. No mitigation is required. Less than Significant Impact.
LU-2: The proposed project would not cause a significant environmental impact due to a conflict with any land use plan, policy, or regulation adopted for the purpose of avoiding or mitigating an environmental effect.
Less than Significant Impact. No mitigation is required. Less than Significant Impact.
LU-3: The proposed project, in combination with past, present, and reasonably foreseeable projects, would result in less than significant cumulative impacts with respect to land use and planning.
Less than Significant Impact. No mitigation is required. Less than Significant Impact.
MINERAL RESOURCES MIN-1: The proposed project would not result in the loss of availability of a known mineral resource that would be of value to the region and the residents of the state.
Less than Significant Impact. No mitigation is required. Less than Significant Impact.
MIN-2: The proposed project would not result in the loss of availability of a locally important mineral resource recovery site delineated on a local general plan, specific plan, or other land use plan.
Less than Significant Impact. No mitigation is required. Less than Significant Impact.
MIN-3: The proposed project, in combination with past, present, and reasonably foreseeable projects, would result in less than significant cumulative impacts with respect to mineral resources.
Less than Significant Impact. No mitigation is required. Less than Significant Impact.

G E N E R A L P L A N F R E S N O , C A L I F O R N I A
R E C I R C U L A T E D D R A F T P R O G R A M E N V I R O N M E N T A L I M P A C T R E P O R T P U B L I C R E V I E W D R A F T
M A R C H 2 0 2 1
2-22
Table 1-1: Executive Summary Matrix
Potential Environmental Impact Level of Significance Before Mitigation Mitigation Measures Level of Significance
After Mitigation NOISE NOI-1: The proposed project would generate a substantial temporary or permanent increase in ambient noise levels in the vicinity of the project in excess of standards established in the local general plan or noise ordinance, or in other applicable local, state, or federal standards
Potentially Significant Impact. No mitigation measures beyond implementation of General Plan policies are feasible.
Significant and Unavoidable Impact.
NOI-2: The proposed project would generate excessive groundborne vibration or groundborne noise levels.
Potentially Significant Impact. Mitigation Measure NOI-2: Construction Vibration. The use of heavy construction equipment within 25 feet of existing structures shall be prohibited.
Less than Significant Impact.
NOI-3: For a project located within the vicinity of a private airstrip or an airport land use plan or, where such a plan has not been adopted, within two miles of a public airport or public use airport, the proposed project would not expose people residing or working in the project area to excessive noise levels
Less than Significant Impact. No mitigation is required. Less than Significant Impact.
NOI-4: The proposed project, in combination with past, present, and reasonably foreseeable projects, would generate a substantial temporary or permanent increase in ambient noise levels in the vicinity of the project in excess of standards established in the local general plan or noise ordinance, or in other applicable local, state, or federal standards.
Potentially Significant Impact. No mitigation measures beyond implementation of General Plan policies are feasible.
Significant and Unavoidable Impact.
NOI-5: The proposed project, in combination with past, present, and reasonably foreseeable projects, would not generate excessive groundborne vibration or groundborne noise levels
Less than Significant Impact. No mitigation is required. Less than Significant Impact.
NOI-6: The proposed project, in combination with past, present, and reasonably foreseeable projects, would not expose people residing or working in the project area to excessive aircraft-related noise.
Less than Significant Impact. No mitigation is required. Less than Significant Impact.
POPULATION AND HOUSING POP-1: The project would not induce substantial unplanned population growth in an area, either directly (for example, by proposing new homes and businesses) or indirectly (for example, through extension of roads or other infrastructure).
Less than Significant Impact. No mitigation is required. Less than Significant Impact.
POP-2: The project would not displace substantial numbers of existing people or housing, necessitating the construction of replacement housing elsewhere.
Less than Significant Impact. No mitigation is required. Less than Significant Impact.
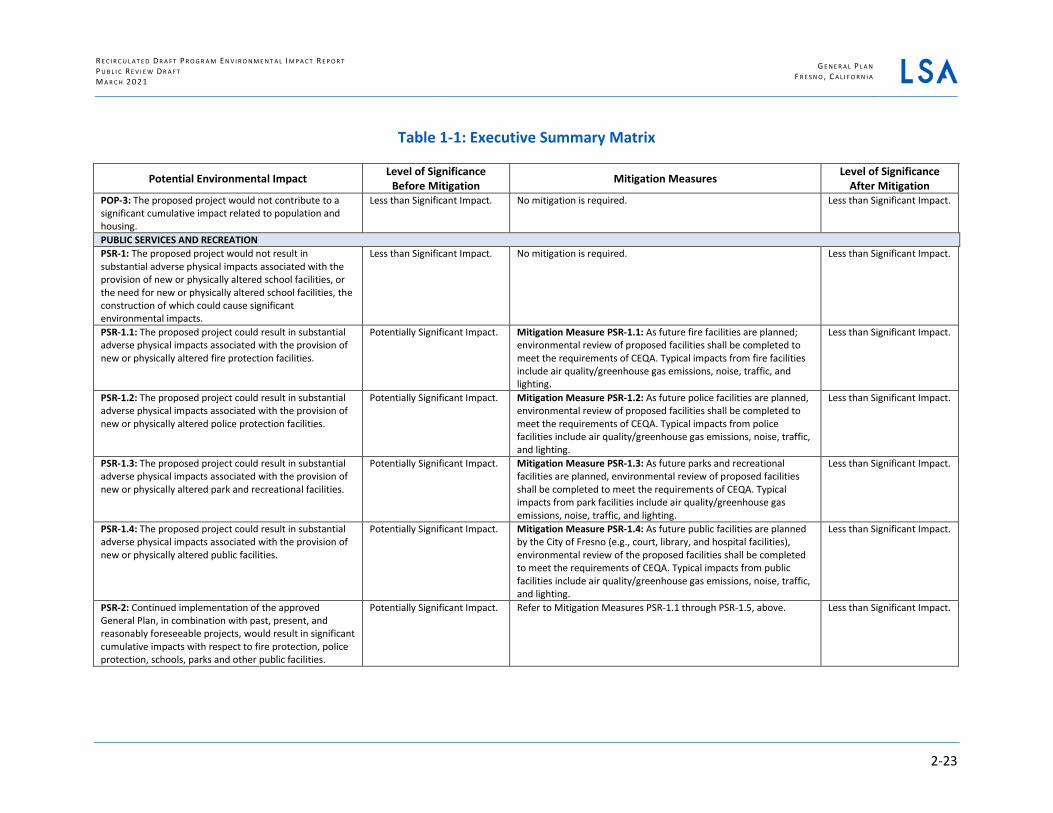
R E C I R C U L A T E D D R A F T P R O G R A M E N V I R O N M E N T A L I M P A C T R E P O R T P U B L I C R E V I E W D R A F T M A R C H 2 0 2 1
G E N E R A L P L A N F R E S N O , C A L I F O R N I A
2-23
Table 1-1: Executive Summary Matrix
Potential Environmental Impact Level of Significance Before Mitigation Mitigation Measures Level of Significance
After Mitigation POP-3: The proposed project would not contribute to a significant cumulative impact related to population and housing.
Less than Significant Impact. No mitigation is required. Less than Significant Impact.
PUBLIC SERVICES AND RECREATION PSR-1: The proposed project would not result in substantial adverse physical impacts associated with the provision of new or physically altered school facilities, or the need for new or physically altered school facilities, the construction of which could cause significant environmental impacts.
Less than Significant Impact. No mitigation is required. Less than Significant Impact.
PSR-1.1: The proposed project could result in substantial adverse physical impacts associated with the provision of new or physically altered fire protection facilities.
Potentially Significant Impact. Mitigation Measure PSR-1.1: As future fire facilities are planned; environmental review of proposed facilities shall be completed to meet the requirements of CEQA. Typical impacts from fire facilities include air quality/greenhouse gas emissions, noise, traffic, and lighting.
Less than Significant Impact.
PSR-1.2: The proposed project could result in substantial adverse physical impacts associated with the provision of new or physically altered police protection facilities.
Potentially Significant Impact. Mitigation Measure PSR-1.2: As future police facilities are planned, environmental review of proposed facilities shall be completed to meet the requirements of CEQA. Typical impacts from police facilities include air quality/greenhouse gas emissions, noise, traffic, and lighting.
Less than Significant Impact.
PSR-1.3: The proposed project could result in substantial adverse physical impacts associated with the provision of new or physically altered park and recreational facilities.
Potentially Significant Impact. Mitigation Measure PSR-1.3: As future parks and recreational facilities are planned, environmental review of proposed facilities shall be completed to meet the requirements of CEQA. Typical impacts from park facilities include air quality/greenhouse gas emissions, noise, traffic, and lighting.
Less than Significant Impact.
PSR-1.4: The proposed project could result in substantial adverse physical impacts associated with the provision of new or physically altered public facilities.
Potentially Significant Impact. Mitigation Measure PSR-1.4: As future public facilities are planned by the City of Fresno (e.g., court, library, and hospital facilities), environmental review of the proposed facilities shall be completed to meet the requirements of CEQA. Typical impacts from public facilities include air quality/greenhouse gas emissions, noise, traffic, and lighting.
Less than Significant Impact.
PSR-2: Continued implementation of the approved General Plan, in combination with past, present, and reasonably foreseeable projects, would result in significant cumulative impacts with respect to fire protection, police protection, schools, parks and other public facilities.
Potentially Significant Impact. Refer to Mitigation Measures PSR-1.1 through PSR-1.5, above. Less than Significant Impact.

G E N E R A L P L A N F R E S N O , C A L I F O R N I A
R E C I R C U L A T E D D R A F T P R O G R A M E N V I R O N M E N T A L I M P A C T R E P O R T P U B L I C R E V I E W D R A F T
M A R C H 2 0 2 1
2-24
Table 1-1: Executive Summary Matrix
Potential Environmental Impact Level of Significance Before Mitigation Mitigation Measures Level of Significance
After Mitigation TRANSPORTATION TRA-1: Continued Implementation of the approved General Plan would increase vehicle traffic and would result in 12 roadway segments to exceed General Plan LOS standards, which is in conflict with LOS-related policies in the Mobility and Transportation Element of the approved General Plan.
Potentially Significant Impact. No feasible mitigation measures are available. Significant and unavoidable impact.
TRA-2: The proposed project would not conflict orand would be inconsistent with CEQA Guidelines section 15064.3, subdivision (b)
Potentially Significant ImpactLess than Significant Impact.
No feasible mitigation measures are availableNo mitigation is required.
Significant and unavoidable impactLess than Significant Impact.
TRA-3: The proposed project would not substantially increase hazards due to a geometric design feature (e.g., sharp curves or dangerous intersections) or incompatible uses (e.g., farm equipment).
Less than Significant Impact. No mitigation is required. Less than Significant Impact.
TRA-4: The proposed project would not result in inadequate emergency access
Less than Significant Impact. No mitigation is required. Less than Significant Impact.
TRA-5: Continued Implementation of the approved General Plan would result in a cumulative impact related to an increase in vehicle traffic that would result in 12 roadway segments exceeding General Plan LOS standards, and thereby conflicting with LOS-related policies in the Mobility and Transportation Element of the approved General Plan
Potentially Significant Impact. No feasible mitigation measures are available. Significant and unavoidable impact.
UTILITIES UTL-1.1: Continued implementation of the approved General Plan would require or result in the relocation or construction of new or expanded water conveyance facilities, the construction or relocation of which could cause significant environmental effects. Although mitigation measures are proposed to reduce impacts associated with the provision of water conveyance facilities, such mitigation would not reduce impacts to a less than significant level because project specifics are unknown at this time, and project-level environmental analysis has not occurred.
Potentially Significant Impact. Mitigation Measure UTL-1.1.1: The City shall evaluate the water conveyance system and, at the time that discretionary projects are submitted for approval by the City, the City shall not approve development that would demand additional water and exceed the capacity of a facility until additional capacity is provided. The following capacity improvements shall be evaluated for potential environmental impacts and constructed by the City by approximately 2025. • Construct 65 new groundwater wells, in accordance with Chapter
9 and Figure 9-1 of the 2014 Metro Plan Update. • Construct a 2.0 million gallon potable water reservoir (Reservoir
T2) near the intersection of Clovis and California Avenues, in accordance with Chapter 9 and Figure 9-1 of the 2014 Metro Plan Update.
• Construct a 4.0 million gallon potable water reservoir (Reservoir
Significant and unavoidable impact.

R E C I R C U L A T E D D R A F T P R O G R A M E N V I R O N M E N T A L I M P A C T R E P O R T P U B L I C R E V I E W D R A F T M A R C H 2 0 2 1
G E N E R A L P L A N F R E S N O , C A L I F O R N I A
2-25
Table 1-1: Executive Summary Matrix
Potential Environmental Impact Level of Significance Before Mitigation Mitigation Measures Level of Significance
After Mitigation T5) near the intersection of Ashlan and Chestnut Avenues, in accordance with Chapter 9 and Figure 9-1 of the 2014 Metro Plan Update.
• Construct a 4.0 million gallon potable water reservoir (Reservoir T6) near the intersection of Ashlan Avenue and Highway 99, in accordance with Chapter 9 and Figure 9-1 of the 2014 Metro Plan Update.
• Construct 50.3 miles of regional water transmission mains ranging in size from 24- inch to 48-inch, in accordance with Chapter 9 and Figure 9-1 of the 2014 Metro Plan Update.
• Construct 95.9 miles of 16-inch transmission grid mains, in accordance with Chapter 9 and Figure 9-1 of the 2014 Metro Plan Update.
Prior to initiating construction of any of the capacity improvement projects identified above, the City shall conduct appropriate environmental analyses for each project to determine whether environmental impacts would occur.
Mitigation Measure UTL-1.1.2: The City shall evaluate the water conveyance system at the time discretionary projects are submitted and shall not approve development that would demand additional water and exceed the capacity of a facility until additional capacity is provided. The following capacity improvements shall be evaluated for potential environmental impacts and constructed by the City after approximately the year 2035 and additional water conveyance facilities shall be provided prior to exceedance of capacity within the water conveyance facilities to accommodate full buildout of the approved General Plan. • Construct a 4.0 million gallon potable water reservoir (SEDA
Reservoir 1) within the northern part of the Southeast Development Area.
• Construct a 4.0 million gallon potable water reservoir (SEDA Reservoir 2) within the southern part of the Southeast Development Area.
UTL-1.2: Continued implementation of the approved General Plan would require or result in the relocation or construction of new or expanded surface water treatment facilities, the construction or relocation of which could cause significant environmental effects. Although mitigation is proposed to reduce impacts associated with
Potentially Significant Impact. Mitigation Measure UTL-1.2.1: The City shall evaluate the water supply system at the time discretionary projects are submitted and shall not approve development that would demand additional water until additional capacity is provided. By approximately the year 2025, the following capacity improvements shall be evaluated for potential environmental impacts and constructed by the City.
Significant and unavoidable impact.

G E N E R A L P L A N F R E S N O , C A L I F O R N I A
R E C I R C U L A T E D D R A F T P R O G R A M E N V I R O N M E N T A L I M P A C T R E P O R T P U B L I C R E V I E W D R A F T
M A R C H 2 0 2 1
2-26
Table 1-1: Executive Summary Matrix
Potential Environmental Impact Level of Significance Before Mitigation Mitigation Measures Level of Significance
After Mitigation the provision of water treatment facilities, such mitigation would not reduce impacts to a less than significant level because project specifics are unknown at this time, and project-level environmental analysis has not occurred.
• Construct an approximately 30 mgd expansion of the existing northeast surface water treatment facility for a total capacity of 60 mgd, in accordance with Chapter 9 and Figure 9-1 of the 2014 Metro Plan Update.
• Construct an approximately 20 mgd surface water treatment facility in the southwest portion of the City, in accordance with Chapter 9 and Figure 9-1 of the 2014 Metro Plan Update.
• Construct a 25,000 AF/year recycled water facility as an expansion to the RWRF in accordance with the January 2014 City of Fresno Metropolitan Water Resources Management Plan. This improvement is required after the year 2025.
UTL-1.3: Continued implementation of the approved General Plan would require construction of new or expanded wastewater treatment facilities, the construction or relocation of which could cause significant environmental effects. Although mitigation measures are proposed to reduce impacts associated with the provision of wastewater treatment facilities, such mitigation would not reduce impacts to a less than significant level because project specifics are unknown at this time, and project-level environmental analysis has not occurred.
Potentially Significant Impact. Mitigation Measures UTL-1.3.1: The City shall evaluate the wastewater system at the time discretionary projects are submitted and shall not approve development that contributes wastewater to the wastewater treatment facility that could exceed capacity until additional capacity is provided. By approximately the year 2025, the City shall evaluate the potential environmental impacts and construct the following improvements. • Construct an approximately 70 mgd expansion of the Regional
Wastewater Treatment Facility prior to flows reaching 80 percent of rated capacity, and obtain revised waste discharge permits as the generation of wastewater is increased.
• Construct an approximately 0.49 mgd expansion of the North Facility and obtain revised waste discharge permits as the generation of wastewater is increased.
Mitigation Measures UTL-1.3.2: The City shall evaluate the wastewater system at the time discretionary projects are submitted and shall not approve development that contributes wastewater to the wastewater treatment facility that could exceed capacity until additional capacity is provided. After approximately the year 2025, the City shall evaluate the potential environmental impacts of, and construct the following improvements. • Construct an approximately 24 mgd Wastewater Treatment
Facility within the Southeast Development Area and obtain revised waste discharge permits as the generation of wastewater is increased.
• Construct an approximately 9.6 mgd expansion of the Regional Wastewater Treatment Facility and obtain revised waste discharge permits as the generation of wastewater is increased.
Significant and unavoidable impact.
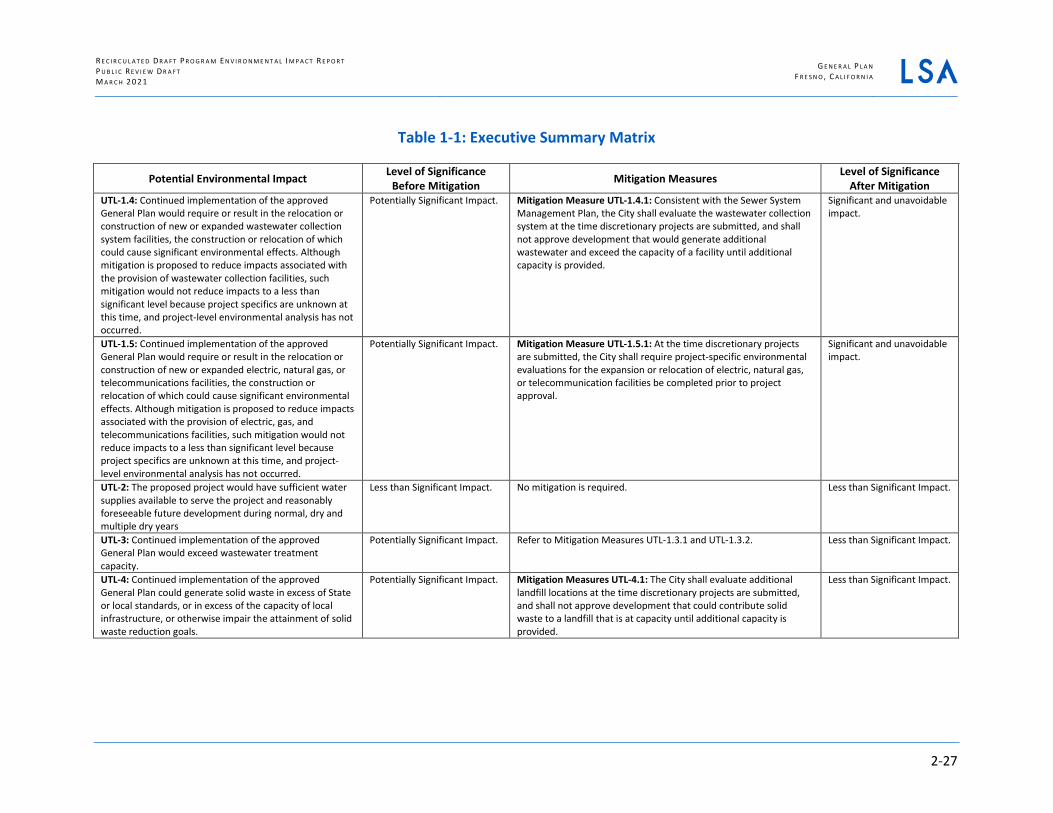
R E C I R C U L A T E D D R A F T P R O G R A M E N V I R O N M E N T A L I M P A C T R E P O R T P U B L I C R E V I E W D R A F T M A R C H 2 0 2 1
G E N E R A L P L A N F R E S N O , C A L I F O R N I A
2-27
Table 1-1: Executive Summary Matrix
Potential Environmental Impact Level of Significance Before Mitigation Mitigation Measures Level of Significance
After Mitigation UTL-1.4: Continued implementation of the approved General Plan would require or result in the relocation or construction of new or expanded wastewater collection system facilities, the construction or relocation of which could cause significant environmental effects. Although mitigation is proposed to reduce impacts associated with the provision of wastewater collection facilities, such mitigation would not reduce impacts to a less than significant level because project specifics are unknown at this time, and project-level environmental analysis has not occurred.
Potentially Significant Impact. Mitigation Measure UTL-1.4.1: Consistent with the Sewer System Management Plan, the City shall evaluate the wastewater collection system at the time discretionary projects are submitted, and shall not approve development that would generate additional wastewater and exceed the capacity of a facility until additional capacity is provided.
Significant and unavoidable impact.
UTL-1.5: Continued implementation of the approved General Plan would require or result in the relocation or construction of new or expanded electric, natural gas, or telecommunications facilities, the construction or relocation of which could cause significant environmental effects. Although mitigation is proposed to reduce impacts associated with the provision of electric, gas, and telecommunications facilities, such mitigation would not reduce impacts to a less than significant level because project specifics are unknown at this time, and project-level environmental analysis has not occurred.
Potentially Significant Impact. Mitigation Measure UTL-1.5.1: At the time discretionary projects are submitted, the City shall require project-specific environmental evaluations for the expansion or relocation of electric, natural gas, or telecommunication facilities be completed prior to project approval.
Significant and unavoidable impact.
UTL-2: The proposed project would have sufficient water supplies available to serve the project and reasonably foreseeable future development during normal, dry and multiple dry years
Less than Significant Impact. No mitigation is required. Less than Significant Impact.
UTL-3: Continued implementation of the approved General Plan would exceed wastewater treatment capacity.
Potentially Significant Impact. Refer to Mitigation Measures UTL-1.3.1 and UTL-1.3.2. Less than Significant Impact.
UTL-4: Continued implementation of the approved General Plan could generate solid waste in excess of State or local standards, or in excess of the capacity of local infrastructure, or otherwise impair the attainment of solid waste reduction goals.
Potentially Significant Impact. Mitigation Measures UTL-4.1: The City shall evaluate additional landfill locations at the time discretionary projects are submitted, and shall not approve development that could contribute solid waste to a landfill that is at capacity until additional capacity is provided.
Less than Significant Impact.

G E N E R A L P L A N F R E S N O , C A L I F O R N I A
R E C I R C U L A T E D D R A F T P R O G R A M E N V I R O N M E N T A L I M P A C T R E P O R T P U B L I C R E V I E W D R A F T
M A R C H 2 0 2 1
2-28
Table 1-1: Executive Summary Matrix
Potential Environmental Impact Level of Significance Before Mitigation Mitigation Measures Level of Significance
After Mitigation UTL-5: The proposed project would comply with federal, state, and local management and reduction statutes and regulations related to solid waste.
Less than Significant Impact. No mitigation is required. Less than Significant Impact.
UTL-6: Continued implementation of the approved General Plan could result in cumulative impacts to utilities and service systems. Although mitigation measures are proposed to reduce impacts associated with the provision of utilities and service systems, such mitigation would not reduce impacts to a less than significant level because project specifics are unknown at this time, and project-level environmental analysis has not occurred.
Potentially Significant Impact. Refer to Mitigation Measures UTL-1.1.1, UTL-1.1.2, UTL-1.2.1, UTL-1.3.1 UTL-1.3.2, UTL-1.4.1, UTL-1.5.1, UTL-3.1, and UTL-4.1.
Significant and unavoidable impact.
WILDFIRE WF-1: The proposed project would not substantially impair an adopted emergency response plan or emergency evacuation plan.
Less than Significant Impact. No mitigation is required. Less than Significant Impact.
WF-2: Due to slope, prevailing winds, and other factors, the proposed project would not exacerbate wildfire risks, and thereby would not expose project occupants to, pollutant concentrations from a wildfire or the uncontrolled spread of a wildfire.
Less than Significant Impact. No mitigation is required. Less than Significant Impact.
WF-3: The proposed project would not require the installation or maintenance of associated infrastructure (such as roads, fuel breaks, emergency water sources, power lines or other utilities) that may exacerbate fire risk or that may result in temporary or ongoing impacts to the environment.
Less than Significant Impact. No mitigation is required. Less than Significant Impact.
WF-4: The proposed project would not expose people or structures to significant risks, including downslope or downstream flooding or landslides, as a result of runoff, post-fire slope instability, or drainage changes.
Less than Significant Impact. No mitigation is required. Less than Significant Impact.
WF-5: The proposed project, in combination with past, present, and reasonably foreseeable projects, would result in less than significant cumulative impacts with respect to wildfire.
Less than Significant Impact. No mitigation is required. Less than Significant Impact.

R E C I R C U L A T E D P R O G R A M E N V I R O N M E N T A L I M P A C T R E P O R T P U B L I C R E V I E W D R A F T M A R C H 2 0 2 1
G E N E R A L P L A N F R E S N O , C A L I F O R N I A
3-1
3.0 PROJECT DESCRIPTION
This chapter describes the purpose of this Environmental Impact Report (EIR) update and the text amendments to the Fresno General Plan (referred to as the “project”) evaluated in this Draft Program EIR (PEIR). This chapter includes a description of the project location, a list of project objectives, a description of the existing General Plan Land Uses, and a list of required approvals and entitlements. Information presented in this chapter was derived from information provided by City of Fresno (City) staff, and the previously-certified Master EIR (MEIR) for the General Plan.
Following the public review of the Draft PEIR in March 2020, and the publication of the Response to Comment Document in July 2020, the City decided to recirculate the Draft PEIR to provide clarifying text and to address the City’s Guidelines for Vehicle Miles Traveled (VMT) Thresholds, which were adopted in June 2020, after circulation of the Draft PEIR.
The following project description serves as the basis for the environmental analysis contained in this PEIR. The City is the California Environmental Quality Act (CEQA) lead agency and has final authority to approve the proposed project and certify the EIR.
3.1 PROJECT LOCATION
The Ccity of Fresno is located in Fresno County in the central San Joaquin Valley. The city is located approximately 200 miles north of Los Angeles, and 170 miles south of Sacramento. The city is located on the State Route (SR) 99 corridor. SR 99 is designated in Caltrans’ Interregional Transportation Strategic Plan as a High Emphasis Focus Route. A High Emphasis Focus Route is a high-volume, primary artery in which lower-volume and facility-standard State highway routes connect for purposes of longer interregional trips and access to statewide gateways. Figure 3-1, Regional Location and Local Vicinity Map, shows the city of Fresno in its regional context and local vicinity. To the north of Fresno is Madera County, to the northeast and adjacent to Fresno, is the city of Clovis. Unincorporated land is located to the east, south, and west of Fresno.
The Planning Area is the geographic area for which the General Plan establishes policies about future growth. The boundary of the Planning Area was determined in response to State law (California Government Code Section 65300) requiring each city to include in its General Plan all territory within the boundaries of the incorporated area as well as “any land outside its boundaries which in the planning agency’s judgment bears relation to its planning”. The Planning Area established by the City of Fresno includes all areas within the City’s current city limits, including the Fresno‐Clovis Regional Wastewater Reclamation Facility (RWRF), the areas within the current Sphere of Influence (SOI), and an area north of the city’s most northeasterly portion (referred to as the North Area). The Planning Area has not been changed since it was evaluated in the MEIR.
The SOI is a boundary that encompasses lands that are expected to ultimately be annexed into the City. Until annexed, the lands are unincorporated and fall under the jurisdiction of the County of Fresno. Within the Planning Area, the current SOI covers approximately 103,570 acres, or approximately 162 square miles including the 3,293‐acre RWRF and an additional 2,486 acres identified as the North Area. The Planning Area encompasses approximately 106,000 acres, or

G E N E R A L P L A N F R E S N O , C A L I F O R N I A
R E C I R C U L A T E D P R O G R A M E N V I R O N M E N T A L I M P A C T R E P O R T P U B L I C R E V I E W D R A F T
M A R C H 2 0 2 1
3-2
approximately 166 square miles of both incorporated (approximately 72,200 acres) and unincorpo-rated (approximately 33,800 acres) land bearing relation to the City’s future growth. The Planning Area is generally bounded by the San Joaquin River to the north, American Avenue to the south, Garfield Avenue to the west, and McCall Avenue to the east, with the RWRF generally located with Jensen Avenue to the north, American Avenue to the south, South Chateau Fresno Avenue to the west, and Cornelia Avenue to the east. The Planning Area, as shown on Figure 3-2, Planning Area, includes various unincorporated islands surrounded by the city limits.
3.2 PROJECT CHARACTERISTICS
The intent of the project is to update the text of the General Plan in order to reflect changes in applicable statutes and regulations related to Vehicle Miles Traveled (VMT), as well as updating the EIR to include a current baseline for the continued implementation of the General Plan, and reflect changes in City planning documents since adoption of the General Plan in 2014. The project also includes an update to the City’s Greenhouse Gas Reduction Plan. In doing so, the City is converting the previously-certified MEIR to a PEIR with the goal of extending the life of the environmental document for the General Plan, pursuant to State CEQA Guidelines Section 15179 (Limitations on the Use of Master EIRs). The MEIR was certified by the City Council in 2014. This update is intended to streamline implementation of the General Plan’s programs and policies by supporting them with updated environmental analysis, a current regulatory framework, and mitigation measures, pursuant to CEQA. The Planning Area, as described above in Section 3.1, has not been changed since the existing General Plan MEIR was certified, nor is the City proposing to change it for this General Plan EIR update. Additionally, the City is not proposing any land use changes for this General Plan EIR update. The specific text changes that are proposed are included below in Section 3.2.2.
Since the General Plan was adopted and the MEIR was certified in 2014, several amendments to the General Plan have been adopted, and new local, state, and/or federal regulations have been enacted. Below is a list of the relevant plans and regulations that have already been approved or adopted and environmentally assessed and will be assumed in the PEIR in order to represent current conditions and plans of the city and the new baseline for the analysis in the PEIR.
• Plan Amendments include, but are not limited to, the following approved and adopted plans:
○ Downtown Neighborhoods and Community Plan, 2016;
○ Fulton Corridor Specific Plan, 2016;
○ Housing Element, 2017;
○ Southwest Fresno Specific Plan, 2017;
○ Active Transportation Plan, 2017;
○ Parks Master Plan, 2018;
○ Approximately 32 General Plan Amendments (GPAs) involving over 150 sites; and
○ New airport land use plans and noise contours adopted in 2018
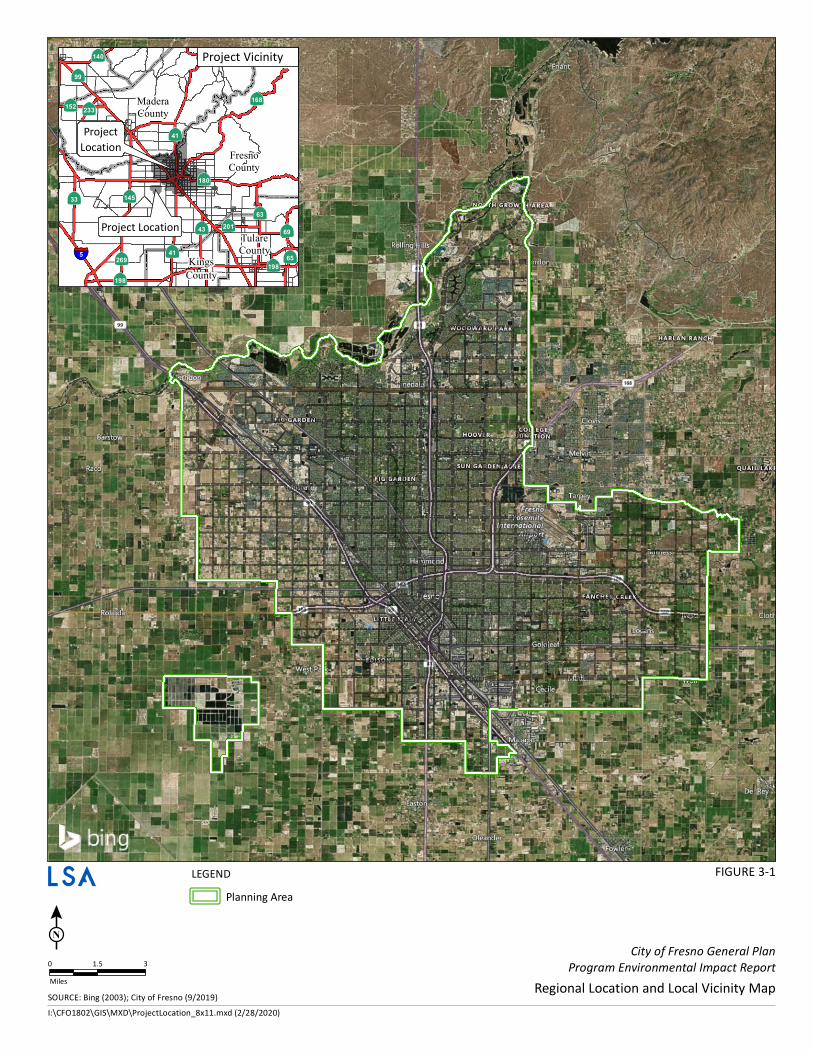
Service Layer Credits: © 2020 Microsoft Corporation Earthstar
SOURCE: Bing (2003); City of Fresno (9/2019)I:\CFO1802\GIS\MXD\ProjectLocation_8x11.mxd (2/28/2020)
FIGURE 3-1
City of Fresno General PlanProgram Environmental Impact Report
Regional Location and Local Vicinity Map0 1.5 3Miles
LEGENDPlanning Area
MaderaCounty
FresnoCounty
TulareCounty
KingsCounty
ÃÃ201
ÃÃ233ÃÃ168
ÃÃ145
ÃÃ41 ÃÃ65ÃÃ269
ÃÃ69
ÃÃ152
ÃÃ198
ÃÃ140
ÃÃ33
ÃÃ198
ÃÃ43ÃÃ63
ÃÃ180
ÃÃ41
ÃÃ99
Project Location
ProjectLocation
§̈¦5
Project Vicinity

Whites Bridge
Maple
Bra
wle
y
Herndon
Bullard
Shaw
Clo
vis
Fo
wle
r
Te
mp
era
nce
We
st
Pa
lm
Clo
vis
Fo
wle
r
Te
mp
era
nce
De
Wo
lf
Hig
hla
nd
McC
all
Shields
McKinley
Belmont
Ch
estn
ut
Pe
ach
American
Ce
da
r
Gra
ntla
nd
Ha
ye
s
Elm
Ea
st
Ma
rks
We
st
Wa
lnu
t
Co
rne
lia
North
California
Jensen
Central
Ashlan
Gra
ntla
nd
Ha
ye
s
Co
rne
lia
Bra
wle
y
Ma
rks
Shaw
Bullard
Herndon
Nees
McC
all
Hig
hla
nd
De
Wo
lf
Shields
McKinley
Belmont
California
Jensen
North
Kings Canyon
Ashlan
Pe
ach
Behymer
Copper
Shepherd
Nees
Bla
cksto
ne
First Ce
da
r
Ch
estn
ut
Garf
ield
Bry
an
Polk
Bly
the
Vale
ntine
Van N
ess
Fru
it
Maro
a
Fre
sno
Mill
bro
ok
Maple W
illow
Dakota
Clinton
Olive
Gettysburg
Barstow
Sierra
Alluvial
Nielsen
Kearney
Muscat
Annadale
Church
Will
ow
Min
new
aw
a
Malaga
Ora
nge
Bry
an
Sunnysid
e
Arm
str
ong
Locan
Leonard
Thom
pson
Fig
Cherr
y
Hughes
Fru
it
Polk
Vale
ntine
Bly
the
Alluvial
Sierra
Barstow
Perrin
Sunnysid
e
Arm
str
ong
Locan
Thom
pson
Leonard
Clinton
Olive
Tulare
Butler
Church
Annadale
Dakota
Gettysburg
Min
new
aw
a
International
Teague
Gould Canal / Redbank Creek
California
State UniversityFresno
Fresno
International
Airport
Fresno-Clovis Regional Wastewater
Reclamation Facility
·|}þ
·|}þ
·|}þ
·|}þ
·|}þ
·|}þ·|}þ
99
99
41
168
180
180
41
LEGEND
City Limits
Sphere Of Influence
Planning Area
SOURCE City of Fresno, Planning and Development Department:
MILES
2.51.250
N
FIGURE 3-2
Planning Area
I:\CFO1802\G\Planning_Area.cdr (2/28/2020)
City of Fresno General Plan
Program Environmental Impact Report

R E C I R C U L A T E D P R O G R A M E N V I R O N M E N T A L I M P A C T R E P O R T P U B L I C R E V I E W D R A F T M A R C H 2 0 2 1
G E N E R A L P L A N F R E S N O , C A L I F O R N I A
3-5
• New local, state, and/or federal regulations that have taken effect since the MEIR was certified in 2014 include:
○ Cooperative Agreement between the City of Fresno Irrigation District and the City of Fresno for Water Utilization and Conveyance, 2016;
○ Sustainable Groundwater Management Act (SGMA) (2014);
○ 2017 Housing Package as described by the State of California Department of Housing and Community Development (Website: http://www.hcd.ca.gov/policy-research/lhp.shtml);
○ Climate Action Plan Legislation taking into account Executive Order S-03-05 (2005), SB 32 (2006), and Executive Order B-30-15 (2015);
○ Vehicle Miles Travelled (VMT) Legislation – Senate Bill 743 (2013); and
○ Tribal Consultation – Assembly Bill (AB) 52 (2014).
Use of a baseline consistent with the date of issuance of the Notice of Preparation for the Draft PEIR (i.e. 2019) is consistent with the requirements of CEQA Guidelines Section 15125(a)(1), which provides that "[g]enerally, the lead agency should describe physical environmental conditions as they exist at the time the notice of preparation is published, or if no notice of preparation is published, at the time environmental analysis is commenced, from both a local and regional perspective."
This baseline presents the most accurate and understandable picture possible of expected impacts on current physical conditions of the General Plan as amended. It also accounts for changes in City planning documents and new local, state, and/or federal regulations that have taken effect since the MEIR was certified and the General Plan was adopted in 2014. Consistent with CEQA Guidelines Section 15125(a), the intent is "to give the public and decision makers the most accurate and understandable picture practically possible of the project's likely near-term and long-term impacts.”
The City is not proposing any land use designation changes as part of the project, and the project will not result in any direct physical changes or new land uses. All previous changes to land use designations since the adoption of the General Plan in 2014 have already been evaluated under CEQA, as applicable, and those changes do not result in any new potential environmental impacts to be considered as part of this project.
Use of an alternative baseline would generally not lead to a comparably accurate picture of the expected impacts of the project. Baseline conditions other than 2019 would therefore not achieve CEQA’s objective of informing the public and decision makers as to the potential impacts of the project compared with the baseline of the physical conditions at the time of publication of the Notice of Preparation. Therefore, if the PEIR used the same baseline as the MEIR, approximately five years of development in physical environmental conditions would not be accounted for and would not provide an accurate assessment of potential environmental effects that have occurred or would occur through continued implementation of the approved General Plan.
It should be noted that for the PEIR’s greenhouse gas analysis, a baseline inventory year of 2016 was used because the City prepared an updated inventory in 2016 that accounted for regulations

G E N E R A L P L A N F R E S N O , C A L I F O R N I A
R E C I R C U L A T E D P R O G R A M E N V I R O N M E N T A L I M P A C T R E P O R T P U B L I C R E V I E W D R A F T
M A R C H 2 0 2 1
3-6
adopted to that point in time. Therefore, the 2016 baseline provides the best available baseline for the GHG Reduction Plan Update because it can be compared directly with State progress to date and established targets. This year as the baseline inventory for greenhouse gas provides the most accurate and understandable picture of the environmental impacts of the project with respect to greenhouse gases.
As mentioned above, when the General Plan was adopted in 2014, the City utilized a MEIR to evaluate implementation of the General Plan. Because a MEIR is intended to streamline subsequent environmental reviews of projects by allowing for approvals of projects analyzed in the MEIR, the MEIR was used to addressed potential impacts that could occur at the project-level by including mitigation measures that would apply at the project level. The City used the MEIR as a basis to determine whether a project proposed under the approved General Plan was within the scope of the MEIR, pursuant to CEQA Guidelines Section 15177. If the City determined that a project was a subsequent project within the Scope of the MEIR, that project would be subject to only limited review to determine if the project would cause additional significant environmental effects on the environment beyond those analyzed in the MEIR. This process, referred to in the City as a Finding of Conformity, allowed for the incorporation of all feasible mitigation measures from the MEIR and did not require any additional environmental analysis beyond the analysis required by CEQA Guidelines Section 15177.
Although similar to a MEIR, a PEIR consistent with CEQA Guidelines Section 15168 serves as a first-tier environmental document that analyzes and documents the broad potential environmental impacts that could result from implementation of a plan with the understanding that a more detailed site-specific review may be required to assess future projects implemented under the program. A PEIR does not provide analysis of specific projects that can be used to complete a Finding of Conformity, but is intended to provide the City’s decision makers with sufficient analysis to intelligently consider the environmental consequences of the General Plan. In addition, the process described by CEQA Guidelines Section 15177, and implemented by the City as Finding of Conformity, applies exclusively to MEIRs and cannot be used with a PEIR. The use of a PEIR allows for future plans and projects to rely on analysis included in the PEIR to tier from for subsequent analysis. This would allow for future plans and projects to utilize the baseline information included in the PEIR; however, because a Program EIR does not provide detailed analysis to address project-level impacts, in many cases subsequent analysis of future plans and project will require specific project-related analysis and mitigation.
3.2.1 Existing General Plan
The General Plan is a set of policies and programs that form a blueprint for the physical development of the city. The General Plan includes the elements listed below. As discussed above, the current General Plan will remain in-effect, aside from the proposed changes identified in Section 3.2.2, below. The General Plan identifies 2035 as the horizon year for which figures for growth in residential units, non-residential square footage, population, and jobs are estimated. After the 2035 horizon year, it is anticipated that the city will continue to develop. The city will continue to grow into the remaining portions of the SOI that were not developed during the horizon of the General Plan. As discussed below in Section 3.2.6, full buildout is anticipated to occur in approximately 2056.

R E C I R C U L A T E D P R O G R A M E N V I R O N M E N T A L I M P A C T R E P O R T P U B L I C R E V I E W D R A F T M A R C H 2 0 2 1
G E N E R A L P L A N F R E S N O , C A L I F O R N I A
3-7
3.2.1.1 General Plan Elements
The General Plan includes the following elements.
• Economic Development and Fiscal Sustainability Element. This element relates the long‐term economic development and job potential to the fiscal health and sustainability over the long‐term. The project evaluated in this PEIR does not include any revisions to this element.
• Urban Form, Land Use, and Design Element. This element provides policy direction on urban form and provides a basis for land use decision‐making. It also establishes a land use classification system, intensity and height standards, and citywide and area‐specific land use policies. The project evaluated in this PEIR does not include any revisions to this element.
• Mobility and Transportation Element. This element addresses the multi‐modal transportation needs throughout the Planning Area including all users of streets and highways, transit, sidewalks and trails, and bicycle transportation modes. As a part of the PEIR update, and discussed below in Section 3.2.2, the project proposes changes to this element.
• Parks, Open Space, and Schools Element. This element provides guidance for green spaces and community facilities in the Planning Area such as parks, recreation, open space, biological resources, and schools. The project evaluated in this PEIR does not include any revisions to this element.
• Public Utilities and Services Element. This element addresses public facilities and services including police, fire protection, potable water, sewage collection and treatment, solid waste, and storm drainage/flood control. The project evaluated in this PEIR does not include any revisions to this element.
• Resource Conservation and Resilience Element. This element establishes policies for the conservation of natural resources, land resources including air quality and greenhouse gas emissions, water resources including groundwater and waterways, energy resources and farmland, urban agriculture, food system resources, and mineral resources. The project evaluated in this PEIR does not include any revisions to this element.
• Historic and Cultural Resources Element. This element establishes policies to address historic and cultural resources within the Planning Area. The project evaluated in this PEIR does not include any revisions to this element.
• Noise and Safety Element. This element identifies the natural and man‐made public health and safety hazards that exist within the Planning Area, and establishes preventative and responsive objectives and policies and programs to mitigate their potential impacts. The project evaluated in this PEIR does not include any revisions to this element.
• Healthy Communities Element. This element discusses the relationships between the built, natural, and social environments and community health and wellness outcomes, such as death,
G E N E R A L P L A N F R E S N O , C A L I F O R N I A
R E C I R C U L A T E D P R O G R A M E N V I R O N M E N T A L I M P A C T R E P O R T P U B L I C R E V I E W D R A F T
M A R C H 2 0 2 1
3-8
chronic disease, and effects of drug abuse and crime. The project evaluated in this PEIR does not include any revisions to this element.
• Housing Element Consistency. This element provides an understanding of the city’s housing needs and the goals, policies and programs that have been developed to help meet those needs and how they are consistent with other policies of this General Plan. The Housing Element was updated in April 2017. The project evaluated in this PEIR does not include any revisions to the Housing Element.
• Implementation Element. This element describes the implementation process in general terms and the major actions to be undertaken by the City; the implementing policies in each element of the General Plan provide details that will guide program development. The project evaluated in this PEIR does not include any revisions to this element.
3.2.2 Proposed Changes to the Mobility and Transportation Element
The PEIR will evaluate the potential environmental impacts that could result from the incorporation of changes made to the Mobility and Transportation Element of the General Plan. The Mobility and Transportation Element identifies Level of Service (LOS) as the measurement tool when evaluating potential impacts related to vehicle traffic. Following recent approval of SB 743, assessing potential environmental impacts relative to Vehicle Miles Traveled (VMT) will beis required after July 1, 2020. Specific text changes are shown below; double-underlined text represents language that will be added to the General Plan, and text with strikethrough represents language that will be deleted from the General Plan.
General Plan Policy Changes. Table 3.2.A lists policies included in the Mobility and Transportation Element that would be modified or added as a result of establishing VMT as a metric for environmental analysis.

R E C I R C U L A T E D P R O G R A M E N V I R O N M E N T A L I M P A C T R E P O R T P U B L I C R E V I E W D R A F T M A R C H 2 0 2 1
G E N E R A L P L A N F R E S N O , C A L I F O R N I A
3-9
Table 3.2.A: Text Changes to General Plan Policies related to Level of Service
Policy Number Policy
MT-1-k Multi-Modal Level of Service Standards. Develop and use a tiered system of flexible, multi-modal Level of Service standards for streets designated by the Circulation Diagram (Figure MT-1). Strive to accommodate a peak hour vehicle LOS of D or better on street segments and at intersections, except where Policies MT-1-m through MT-1-p provide greater specificity. Establish minimum acceptable service levels for other modes and use them in the development and environmental review process.
MT-1-m Standards for Planned Bus Rapid Transit Corridors and Activity Centers. Independent of the Traffic Impact Zones identified in MT-2-I and Figure MT-4, strive to maintain the following vehicle LOS standards on major roadway segments and intersections along Bus Rapid Transit Corridors and in Activity Centers:
LOS E or better at all times, including peak travel times, unless the City Traffic Engineer determines that mitigation to maintaining this LOS would be infeasible and/or conflict with the achievement of other General Plan policies.
Accept LOS F conditions in Activity Centers and Bus Rapid Transit Corridors only if provisions are made to improve the overall system and/or promote non-vehicular transportation and transit as part of a development project or a City-initiated project. In accepting LOS F conditions, the City Traffic Engineer may request limited analyses of operational issues at locations near Activity Centers and along Bus Rapid Transit Corridors, such as queuing or left-turn movements.
Give priority to maintaining pedestrian service first, followed by transit service and then by vehicle LOS, where conflicts between objectives for service capacity between different transportation modes occur.
Identify pedestrian-priority and transit-priority streets where these modes would have priority in order to apply a multi-modal priority system, as part of the General Plan implementation.
MT-1-n Peak Hour Vehicle LOS. For planning purposes and implementation of Capital Improvement Projects, Mmaintain a peak-hour vehicle LOS standard of D or better for all roadway areas outside of identified Activity Center and Bus Rapid Transit Corridor districts, unless the City Traffic Engineer determines that mitigation to maintaining this LOS would be infeasible and/or conflict with the achievement of other General Plan policies.
MT-2-m Use VMT analysis for CEQA. Use Vehicle Miles Traveled (VMT) as the criteria for evaluating transportation impacts under the California Environmental Quality Act (CEQA), pursuant to Senate Bill 743. Level of Service (LOS) may still be used for planning purposes and implementation of Capital Improvement Projects; however, VMT shall be used for determining impacts and mitigation under CEQA beginning in July of 2020. Commentary: In 2013, the State of California passed Senate Bill 743, which eliminated automobile Level of Service (LOS) from transportation analysis under CEQA and replaced it with VMT. This shift from LOS to VMT is intended to better align with other statewide transportation goals, including reduction of GHG emissions, the creation of multimodal networks, and the promotion of integrated land uses.
MT-4-g Advocacy for Bike Accommodation. Advocate for the accommodation of bike facilities in new or upgraded State Route interchanges and railroad construction projects, and construction of bicycle crossings of freeways and railroads. Caltrans has indicated that California’s transportation system cannot meet the State’s needs with just highways and supports guidelines meant to improve Caltrans’ design of bicycle facilities. The guidelines were developed by the American Association of State Highway Transportation Officials and the National Association of City Transportation Officials. These guidelines promote a network of Class 1 bicycle facilities that connect major origins and destinations linked with a network of Class 2 facilities on all possible streets. A Class 1 bicycle facility is situated on a separate right-of-way or with some sort of physical barrier placed on the street between the bicycle and motor vehicle, while a Class 2 facility shares the travel way with motor vehicles separated by striping. These standards should be considered as transportation system developments so as not to preclude future design options.

G E N E R A L P L A N F R E S N O , C A L I F O R N I A
R E C I R C U L A T E D P R O G R A M E N V I R O N M E N T A L I M P A C T R E P O R T P U B L I C R E V I E W D R A F T
M A R C H 2 0 2 1
3-10
Table 3.2.A: Text Changes to General Plan Policies related to Level of Service
Policy Number Policy
MT-6-g Path and Trail Development. Require all projects to incorporate planned multi-purpose path and trail development standards and corridor linkages consistent with the General Plan, applicable law and case-by-case determinations as a condition of project approval. Commentary: This should be done pursuant to Figure MT-2: Paths and Trails, and the adopted ATP, as may amended.
MT-8-g High Speed Train. If the State moves forward with HST, ensure it is constructed through Fresno in a manner that minimizes impacts to surrounding property owners and creates the most opportunity for redevelopment around the HST station.
MT-8-h Move Forward with High-Speed Train Station Area Planning. Work with local residents, property and business owners, and other stakeholders to develop a station area plan to provide the most opportunity for growth and prosperity in concert with development of the Fresno HST station.
Source: City of Fresno General Plan (LSA 2020).
General Plan Text Changes. The following text beginning on page 4-14 of the Mobility and Transportation Element would be modified as shown below.
Multi-Modal LOS. As mentioned above, the General Plan proposes a balanced transportation system that serves public transit, bicyclists and pedestrians as well as motor vehicles. This multimodal system will support more compact development patterns, which in turn will support other goals, including farmland preservation and neighborhood walkability. Less reliance on the automobile is critical for Fresno if the City is to improve air quality and reduce greenhouse gas emissions. A multi-modal system will ensure mobility for all community members. Ultimately, a truly multi-modal system is more resilient from a transportation perspective, giving Fresno attributes it needs to manage congestion over the long-term.
Fresno can create a transportation system that performs well for all modes, in part by measuring performance with qualitative indicators for each mode based on inputs covering facility design, facility controls, and volumes. This multi-modal LOS concept is illustrated in Table 4-2. Implementing a multi-modal LOS standard would require the consideration of all travel modes when evaluating traffic congestion and needed mitigation such that widening roads at the expense of walking and bicycling—a result that ironically is much more expensive for private development to build, the public sector to maintain, and adds more traffic to streets since other travel modes are no longer possible - would not explicitly be considered reasonable or acceptable mitigation. A multi-modal LOS system will also help support the development of more intense land uses where desired by permitting localized automobile congestion if walking, biking, and transit systems operate at high levels. A multi-modal LOS standard does not define an overall grade for a roadway section, but provides information for each travel mode to properly assess, for that facility, the best approach to improve its travel capacity with the financing available. Based on a project’s location, the proposed improvements will be different. A more suburban intersection may add capacity with a double left turn lane where at a Downtown intersection it may be determined infeasible due to the lack of available right-of-way, or pedestrian islands are required to improve pedestrian flow and intersection wait times.

R E C I R C U L A T E D P R O G R A M E N V I R O N M E N T A L I M P A C T R E P O R T P U B L I C R E V I E W D R A F T M A R C H 2 0 2 1
G E N E R A L P L A N F R E S N O , C A L I F O R N I A
3-11
3.2.3 Greenhouse Gas Reduction Plan
As part of the General Plan update process that concluded in 2014, the City prepared a Greenhouse Gas Reduction Plan that was included as an appendix to the MEIR to inventory existing and projected greenhouse gases and establish targets to demonstrate consistency with AB 32 (California Global Warming Solutions Act of 2006). Strategies were proposed for existing development and future development in accordance with the General Plan to meet greenhouse gas reduction targets established by AB 32. As a part of the update to the General Plan EIR and in response to new State legislation (SB 32), an update to the Greenhouse Gas Reduction Plan is included in Appendix G.
3.2.4 Land Use Diagram
The Land Use Diagram included in the General Plan adopted in 2014 was proposed to accommodate future growth, but it has been updated periodically as General Plan Amendments are approved. Figure 3-3, Planned Land Use, shows the currently approved Land Use Diagram (as of May 2019), which maintains the same SOI established in the General Plan. The land use pattern and policies encourage infill development and revitalization of older neighborhoods, and along established major street corridors as well as development of compact and complete communities in Development Areas located on the outer areas of the Planning Area, and further described in Section 3.2.9, below.
The following provides a discussion of the land use categories throughout the Planning Area. Figure 3‐3 illustrates the location of the land use categories. Note that the adoption of the Downtown Neighborhoods Community Plan and the Fulton Corridor Specific Plan and accompanying amendment to the Development Code in 2016 established three new land use designations for the Downtown which have replaced the 12 land use designations that were in place at the time the General Plan was adopted. These new land use designations are Downtown Neighborhood, Downtown General, and Downtown Core, and they are described below, along with all of the other land use designations that are utilized in the Fresno General Plan.
3.2.4.1 Planning Area
Residential. Residential land use provides for a wide range of neighborhoods and housing types, anywhere from larger lot single‐family residential (SFR) development to neighborhoods with a mix of houses and townhouse/duplexes, to high density apartment communities.
Single‐family residential development is typically arranged as stand‐alone detached units, or attached as duplexes or triplexes. They may range in density from 1 to 12 units per acre. Garages may be accessed from the front or from alleys.
Townhomes or row homes are typically clustered in groups of four-to-six units. They range from two-to-three stories in height and from seven to 16 units per acre. Where possible, garage access should be from the rear of the site.
Multi‐family residential buildings may be multiple (up to eight) stories while garage spaces should be integrated into the ground level of the development or below grade.

G E N E R A L P L A N F R E S N O , C A L I F O R N I A
R E C I R C U L A T E D P R O G R A M E N V I R O N M E N T A L I M P A C T R E P O R T P U B L I C R E V I E W D R A F T
M A R C H 2 0 2 1
3-12
Residential land uses also allow as permitted uses neighborhood‐serving community facilities such as parks, churches, schools, family day care, libraries, community gardens, and farmers markets. Residential uses are designated by density as follows:
Low Density. This designation is intended to provide for large lot residential development. Low Density residential allows one to 3.5 housing units per acre. The resulting land use pattern is large lot residential in nature, such as rural residential, ranchettes, or estate homes, with densities up to 3.5 units per acre.
Medium Low Density. The Medium Low Density designation is intended to provide for single‐family detached housing with densities of 3.5 to 6 units per acre.
Medium Density. Medium Density residential covers developments of 5 to 12 units per acre and is intended for areas with predominantly single‐family residential development, but can also accommodate a mix of housing types, from small‐lot starter homes, zero‐lot‐line developments, and duplexes, to townhouses. Much of the city’s existing neighborhoods fall within this designation.
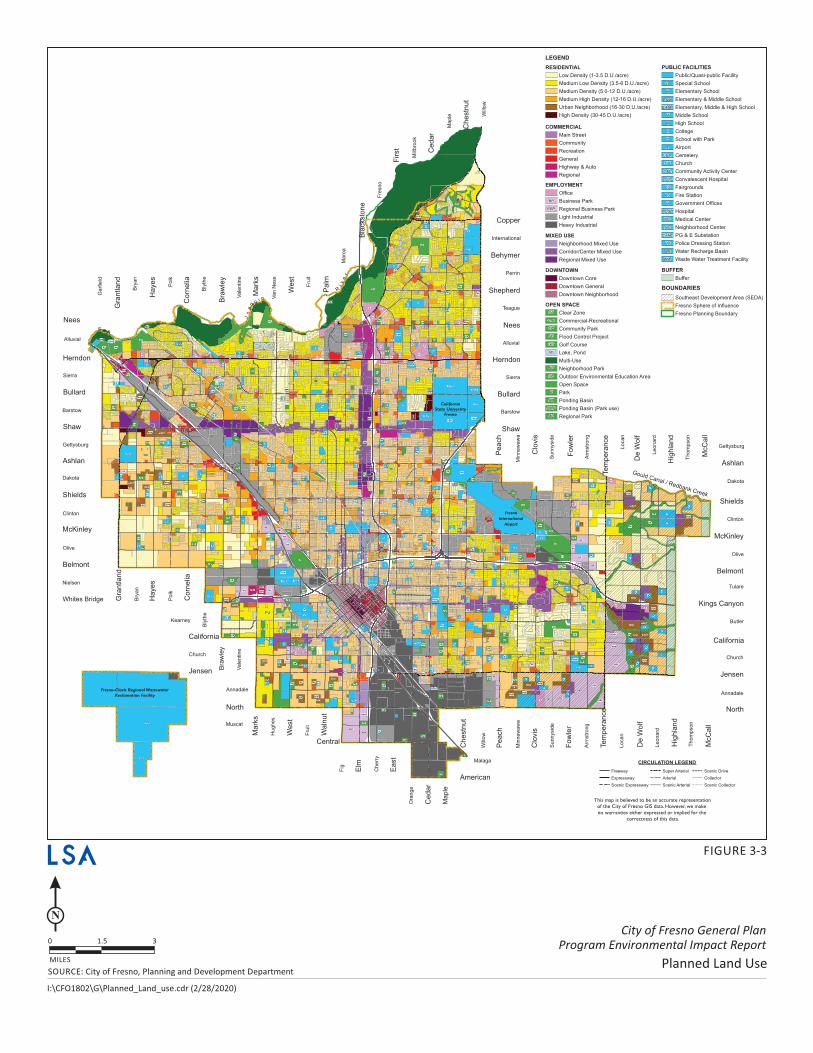
!!!!!!!!!!!!
!!
!!
!!
!!
!!
!!
!!
!!
!!
!!
!
!
!!
!
!!
!
!!!
!!
!!
!!
!!
!!
!!
!!
!!
!!
!!
!!
!!
!!
!!
!!
!
YYYYYYYYYYYYYYYYYYYYYYYYYYYYYYYYY
YYYYYY
YYYY
YYYY
! ! ! ! ! ! ! !!
!!
!!
!!
! ! ! ! ! !! ! ! ! ! !
! ! ! ! ! !!!
! ! ! ! ! ! ! ! ! ! ! ! ! ! !
! ! ! ! ! ! ! ! ! ! ! !
!!
!!
!!
!!
!!
!!
!!!!!!!!!!!!
YYYYYYYYY
YYYYYYYYY
YYYYYYYYYYYYYYYYYY
YYYYYYYYYYYYYYYYYY
!!
!!
!!
!!
!!
!!
!!
!!
!!
!!
!!
!!
!!
!!
!!
!!
!!
!
!!!!!!
!!
!!
!!
!!
!!
!!
!!
!!
!
!!
!!
!!
!!
!!
!!
!!
!!
!!
!!
!!
!!
!!
!!
!!
!!
!!
!
!!
!!
!!
!!
!!
!!
!!
!!
!!
!!
!!
!
!
!!
!
!
!!
!!
!!
!!
!!
!!
!!
!!
!!
!!
!!
!!
!
YYYYYYYYYYYYYYY
! ! ! ! ! ! ! ! ! ! ! ! ! ! ! ! ! ! ! ! ! ! !
!!
!!
!!
!!
!!
!!
!!
!!
!!
!!
!!
!!
!!
!!
!!
!!
YYYYYYYYYY
YYYY
YYYYYY
!!!!!!!
!! ! ! ! !
!!!!!!
!
!!
!!
!!
!
!!!!
Whites Bridge
Ma
ple
Bra
wle
y
Herndon
Bullard
Shaw
Clo
vis
Fo
wle
r
Te
mp
era
nce
We
st
Pa
lm
Clo
vis
Fo
wle
r
Te
mp
era
nce
De
Wo
lf
Hig
hla
nd
McC
all
Shields
McKinley
Belmont
Ch
estn
ut
Pe
ach
American
Ce
da
r
Gra
ntla
nd
Ha
ye
s
Elm
Ea
st
Ma
rks
We
st
Wa
lnu
t
Co
rne
lia
North
California
Jensen
Central
Ashlan
Gra
ntla
nd
Ha
ye
s
Co
rne
lia
Bra
wle
y
Ma
rks
Shaw
Bullard
Herndon
Nees
McC
all
Hig
hla
nd
De
Wo
lf
Shields
McKinley
Belmont
California
Jensen
North
Kings Canyon
Ashlan
Pe
ach
Behymer
Copper
Shepherd
Nees
Bla
cksto
ne
First Ce
da
r
Ch
estn
ut
Garf
ield
Bry
an
Polk
Bly
the
Vale
ntine
Van N
ess
Fru
it
Maro
a
Fre
sno
Mill
bro
ok
Maple W
illow
Dakota
Clinton
Olive
Gettysburg
Barstow
Sierra
Alluvial
Nielsen
Kearney
Muscat
Annadale
Church
Will
ow
Min
new
aw
a
Malaga
Ora
nge
Bry
an
Sunnysid
e
Arm
str
ong
Locan
Leonard
Thom
pson
Fig
Cherr
y
Hughes
Fru
it
Polk
Vale
ntine
Bly
the
Alluvial
Sierra
Barstow
Perrin
Sunnysid
e
Arm
str
ong
Locan
Thom
pson
Leonard
Clinton
Olive
Tulare
Butler
Church
Annadale
Dakota
Gettysburg
Min
new
aw
a
International
Teague
Gould Canal / Redbank Creek
California
State University
Fresno
Fresno
International
Airport
Fresno-Clovis Regional Wastewater
Reclamation Facility
R
iv
er
Jo
aq
u i n
S a n
CP
E&M
M&H
SS
BP
BP
BP
BP
BP
OOBP
CZO
O
BP BP BP
BP
BP
BPBP
BP
BP
BP
BP
BP
O
BP
O
OOO
O
O
OO
OO
OO
O
OO
O
O
O O
O
O
O
O
OOO
OO
OO
O
O
O
OO
OO
OO
OO
O
OOO
O
O
O
O
RBP
RBPRBP
RBP
RBP
RBP
RBP
RBP
RBP
OOO OO O
OO
P
P
P
P
P
ECEM
E
E
EEE
E
E
E
E E
EA
HOSP
E H
EHOSP
BP
BP
BP
BP
H&AH&A
H&A
O
O
O
O
O
RUN
PB
PB
PB
PB
PB
PB
PB
PB
PB
PB
PB
PB
PB
PB PB
PBPB
PB
PBPB
PB
PB
PB
PB
PB
PB
PB
PB
PB
PB
PBPB
PB
PBPB
PB PBPB
PB
PB PB
PB
PB PB
PB
PBPB
PB
PB
PB
PB
PB
PB
PBPBPB
PB PB
PB
PB
PB
PB
PBPBPB
PBPB
PB
CP
CP
NP
CP
NPNP
NP NP
NP
NPNP
NP
NP
NP
NP
NP
NP
NP
NP
CZ
CZ
CZ
GC
GC
GC
GC
GC
GC
P
P
P
P
CP
CP
CP
CP
CP
CP
CP
NPNP
NPNPNP
NP
NP
NPNPNP
NPNP
NP
NP
NP
NP
NP
NP
NP
RPRP
RP
CSUF
CSUF
CSUF
A
AA
A
CSUF
CSUF
CSUF
PG&E
HOSP
HOSP
E
E
E
E
E
E
EE
E EE
E
E
E
EEEE
EE
EE
EE
EE
E
EE
E E E
E
FG
WW
WW
CH
CH
CH
CH
CH
CEM
CEM
CEM
PG&E
PG&E
WR
WR
WR
EE
E
EE
E
EEE
E
E
EE
E
E
EE
E
E
EE
EE
E
E E
E
E
E
E
E
E
E
E
E&M
E/M/H
H
H
H
H
H
H
H
H
P
P
PPP
P
P
P
P
P
P
P
P
P
P
P P
P
P
P
P
P
SS
SS
SS
SS
SS
BP
O
NP
RUNRUN
RUNRUN
RUN
RUN
RUN RUN
RUN
RUN
CP
CP
O
RUN RUN
RUN
RUN
RUN
RUNRUN
RUN
RUNRUN
RUN
RUN
RUN
RUN
RUN
RUN
RUN
O
RUN
RUN
PB
NP
RUN
SS
E
E
O
E
CP
PB
CH
PB
E
O
CH
OO
CP PB
SS
PB
PB
RUN
NP
E
PB
O
RUN
PB
NP
PB E
E
E
PB
P
PB
E
E
NP E
ENP
E
P
E
E
O
E
NP O
PB
E
O
H
RBP
PB
RBP
O
O
NP
NP
E
O
O
E
EPB
NP
OPB
E
SS NP
PB
O
O
NPE
E
O
O
E
RUN
E
NP
O
E
FG
O
E
O
PB
RUN
PB
PB
BP
O
E
PB
A
H&A
O
O
ENP
P
O
E
M&H
PB
LEGEND
RESIDENTIAL
Low Density (1-3.5 D.U./acre)
Medium Low Density (3.5-6 D.U./acre)
Medium Density (5.0-12 D.U./acre)
Medium High Density (12-16 D.U./acre)
Urban Neighborhood (16-30 D.U./acre)
High Density (30-45 D.U./acre)
DOWNTOWN
Downtown Core
Downtown General
Downtown Neighborhood
BUFFER
Buffer
BOUNDARIES
Southeast Development Area (SEDA)
Fresno Sphere of Influence
Fresno Planning Boundary
This map is believed to be an accurate representation
of the City of Fresno GIS data. However, we make
no warranties either expressed or implied for the
correctness of this data.
CIRCULATION LEGEND
Freeway
Expressway
Scenic Expressway
Super Arterial
Arterial
YYYYYYYYYYY Scenic Arterial
! ! ! ! ! ! ! Scenic Drive
Collector
Scenic Collector
MIXED USE
Neighborhood Mixed Use
Corridor/Center Mixed Use
Regional Mixed Use
COMMERCIAL
Main Street
Community
Recreation
General
Highway & Auto
Regional
EMPLOYMENT
Office
Business Park
Regional Business Park
Light Industrial
Heavy Industrial
BP
RBP
OPEN SPACE
Clear Zone
Commercial-Recreational
Community Park
Flood Control Project
Golf Course
Lake, Pond
Multi-Use
Neighborhood Park
Outdoor Environmental Education Area
Open Space
Park
Ponding Basin
Ponding Basin (Park use)
Regional Park
CZ
C-R
CP
FC
GC
W
NP
OE
P
PB
PB/P
RP
PUBLIC FACILITIES
Public/Quasi-public Facility
Special School
Elementary School
Elementary & Middle School
Elementary, Middle & High School
Middle School
High School
College
School with Park
Airport
Cemetery
Church
Community Activity Center
Convalescent Hospital
Fairgrounds
Fire Station
Government Offices
Hospital
Medical Center
Neighborhood Center
PG & E Substation
Police Dressing Station
Water Recharge Basin
Waste Water Treatment Facility
SS
E
E&M
E/M/H
M
C
H
P
A
CEM
CH
CAC
CHOSP
FG
FS
G
HOSP
MC
NC
PG&E
PD
WR
WW
MILES
31.50
N
FIGURE 3-3
Planned Land Use
I:\CFO1802\G\Planned_Land_use.cdr (2/28/2020)
City of Fresno General Plan
Program Environmental Impact Report
SOURCE City of Fresno, Planning and Development Department:

G E N E R A L P L A N F R E S N O , C A L I F O R N I A
R E C I R C U L A T E D P R O G R A M E N V I R O N M E N T A L I M P A C T R E P O R T P U B L I C R E V I E W D R A F T
M A R C H 2 0 2 1
3-14
This page intentionally left blank

R E C I R C U L A T E D P R O G R A M E N V I R O N M E N T A L I M P A C T R E P O R T P U B L I C R E V I E W D R A F T M A R C H 2 0 2 1
G E N E R A L P L A N F R E S N O , C A L I F O R N I A
3-15
Medium High. Medium High Density residential is intended for neighborhoods with a mix of single‐family residences, townhomes, garden apartments, and multi‐family units intended to support a fine‐grain, pedestrian scale. This land use accommodates densities from 12 to 16 units per acre overall— individual parcels may have densities outside of that range so long as a master planned neighborhood has an average density that conforms.
Urban Neighborhood. Urban Neighborhood residential covers densities from 16 to 30 units per acre, which will require multi‐family dwellings but still allows for a mix of housing types including single‐family houses. This land use is intended to provide for a compact community that includes community facilities, walkable access to parkland and commercial services, and supports efficient, frequent transit service. Urban Neighborhood is designated for targeted areas with complementary land uses adjacent.
High Density. High Density residential is intended to accommodate attached homes, two‐ to four‐plexes, and apartment buildings, supported by walkable access to frequent transit, retail and services, and community facilities such as parks and schools. High Density allows for 30 to 45 units per acre.
Commercial. Commercial land use designations allow a wide range of retail and service establishments intended to serve local and regional needs. Only mixed‐use designations allow residential with a commercial component.
Main Street. Main Street commercial encourages a traditional “Main Street” character with active storefronts, outdoor seating, and pedestrian‐oriented design. This designation promotes primarily one to two story retail uses, with moderate office and minimal multi‐family as supportive uses. It also preserves small‐scale, fine‐grain character in neighborhoods where single‐family residential and townhomes are predominant. The maximum Floor Area Ratio (FAR) is 1.0. A FAR is the ratio of a building's total floor area to the size of a site. An example is a 3‐acre site with a 1.0 FAR could have up to approximately 130,000 square feet of floor area within a building (equivalent to 3 acres or one to one ratio).
Community. Community commercial is intended for pedestrian‐oriented commercial development that primarily serves local needs such as convenience shopping and offices. Many of the city’s current commercial districts fall into this designation. Specific uses allowed include medium‐scale retail, office, civic and entertainment uses, supermarkets, drug stores and supporting uses. The maximum FAR is 1.0.
Recreation. The recreation designation is intended for areas of private commercial recreation uses such as bowling alleys, family entertainment centers, and golf driving ranges. The maximum FAR is 0.5.
General. This designation is intended for a range of retail and service uses that are not appropriate in other areas because of higher volumes of vehicle traffic and potential adverse impacts on other uses. Development such as strip malls would fall into this designation. Examples of allowable uses include: building materials, storage facilities with active storefronts,

G E N E R A L P L A N F R E S N O , C A L I F O R N I A
R E C I R C U L A T E D P R O G R A M E N V I R O N M E N T A L I M P A C T R E P O R T P U B L I C R E V I E W D R A F T
M A R C H 2 0 2 1
3-16
equipment rental, wholesale businesses, and specialized retail not normally found in shopping centers. The maximum FAR is 2.0.
Highway & Auto. The Highway & Auto land use designation is intended for limited areas near a freeway to accommodate uses that depend on or are supported by freeway access but do not generate a large volume of traffic. Hotels, restaurants, and auto malls are typical land uses. The maximum FAR is 0.75.
Regional. This land use designation is intended to meet local and regional retail demand, such as large‐scale retail, office, civic and entertainment uses, shopping malls, with large format or “big‐box” retail, are allowed, as are supporting uses such as gas stations, and hotels. Buildings are typically larger-footprint and urban‐scaled. Development and design standards will create a pedestrian orientation within centers and along major corridors, with parking generally on the side or rear of major buildings, but automobile‐oriented uses also will be accommodated on identified streets and frontages. The maximum FAR is 1.0.
Employment
Office. The Office land use designation is intended for administrative, financial, business, professional, medical, and public offices. This designation is mainly intended to apply to existing office uses on smaller lots, generally located on arterial roadways. This designation is also considered compatible with existing residential neighborhoods given the smaller level of noise and traffic generation than commercial uses. Retail uses would be limited to business services and food service and convenience goods for those who work in the area. The maximum FAR is 2.0.
Business Park. The Business Park designation provides for office/business parks in campus‐like setting that is well suited for large offices or multi‐tenant buildings. This designation is intended to accommodate and allow for the expansion of small businesses with limited outdoor storage proximate to residential uses, thus adequate landscaping is imperative. Typical land uses include research and development, laboratories, administrative and general offices, medical offices and clinics, professional offices, prototype manufacturing, testing, repairing, packaging, and printing. No freestanding retail is permitted, except for small uses serving businesses and employees. The maximum FAR is 1.0.
Regional Business Park. The Regional Business Park land use designation is intended for large or campus‐like office and technology development that includes office, research and develop-ment, manufacturing, and other large‐scale, professional uses, with limited and properly screened outdoor storage. Permitted uses include incubator‐research facilities prototype manufacturing, testing, repairing, packaging, and printing as well as offices and research facilities. Small‐scale retail and service uses serving local employees and visitors are permitted as secondary uses. The maximum FAR is 1.0.
Light Industrial. The Light Industrial designation accommodates a diverse range of light industrial uses, including limited manufacturing and processing, research and development, fabrication, utility equipment and service yards, wholesaling, warehousing, and distribution activities. Small‐scale retail and ancillary office uses are also permitted. Light Industrial areas

R E C I R C U L A T E D P R O G R A M E N V I R O N M E N T A L I M P A C T R E P O R T P U B L I C R E V I E W D R A F T M A R C H 2 0 2 1
G E N E R A L P L A N F R E S N O , C A L I F O R N I A
3-17
may serve as buffers between Heavy Industrial and other land uses and otherwise are generally located in areas with good transportation access, such as along railroads and freeways. The maximum FAR is 1.5.
Heavy Industrial. The Heavy Industrial designation accommodates the broadest range of industrial uses including manufacturing, assembly, wholesaling, distribution, and storage activities that are essential to the development of a balanced economic base. Small‐scale commercial services and ancillary office uses are also permitted. The maximum FAR is 1.5.
Mixed Use. Mixed‐use land use designations are based on commercial uses and require a residential component.
Corridor/Center Mixed Use. The Corridor/Center Mixed Use designation is higher intensity than Neighborhood Mixed Use and is intended to allow for either horizontal or vertical mixed‐use development in multiple story buildings along key circulation corridors in the city where height and density can be easily accommodated. Ground‐floor retail and upper‐floor residential or offices are the primary uses, with personal and business services and public and institutional space as supportive uses. Development will facilitate the transformation of existing transportation corridors into vibrant, highly walkable areas with broad, pedestrian‐friendly sidewalks, trees, landscaping, and local‐serving uses with new buildings that step down in relationship to the scale and character of adjacent neighborhoods. This designation will largely apply along arterial streets, at targeted locations between regional activity centers. Residential densities range between 16 and 30 units per acre with a minimum 40 percent residential uses and the maximum FAR is 1.5.
Regional Mixed Use. This land use designation is intended to accommodate mixed‐use development in urban‐scale buildings and retail establishments that serve residents and businesses of the region at large. Medium‐scale retail, housing, office, civic and entertainment uses, and shopping malls, with large format or “big‐box” retail, are allowed, as are supporting uses such as gas stations and hotels and residential in mixed use or single use buildings. Design standards will support a pedestrian orientation within centers and along major corridors, with parking on the side or rear in general, but automobile‐oriented uses also will be accommodated on identified streets and frontages. Residential densities range between 30 and 45 units per acre with a minimum 30 percent residential uses and the maximum FAR is 2.0.
Neighborhood Mixed Use. The Neighborhood Mixed Use designation is similar to the Main Street and Community commercial land use designations; however, it allows a minimum of 50 percent residential uses, whereas the commercial districts do not allow residential uses. This designation provides for mixed‐use districts of local‐serving, pedestrian‐oriented commercial development, such as convenience shopping and professional offices in two‐ to three‐story buildings. Development is expected to include ground floor neighborhood retails uses and upper‐level housing or offices, with a mix of small lot single family houses, townhomes, and multi‐family dwelling units on side streets, in a horizontal or vertical mixed‐use orientation. The built form will have a scale and character that is consistent with pedestrian‐orientation, to attract and promote a walk‐in clientele, with small lots and frequent roadway and pedestrian connections permitting convenient access from residences to commercial space.

G E N E R A L P L A N F R E S N O , C A L I F O R N I A
R E C I R C U L A T E D P R O G R A M E N V I R O N M E N T A L I M P A C T R E P O R T P U B L I C R E V I E W D R A F T
M A R C H 2 0 2 1
3-18
Automobile‐oriented uses are not permitted. Residential densities range between 12 and 16 units per acre and the maximum FAR is 1.5.
Open Space. These designations apply to open space areas that are not parks or trails, such as riparian corridors, the clear zone around Fresno‐Yosemite International Airport, and the San Joaquin River bottom, which is primarily designated as open space even though it includes a limited number of existing homes. Within open space, there is a Multi‐Use designation that is located along the San Joaquin River Corridor that allows parks, open space, bathrooms, launch areas for canoes, parking, and sand/gravel facilities.
Public Facilities. These designations apply to lands owned by public entities, including City Hall and other City buildings, county buildings, schools, colleges, the municipal airport and hospitals. They also include public facilities such as fire and police stations, City‐operated recycling centers and sewage treatment facilities. In addition, these designations apply to public facilities, including neighborhood, community and regional parks, recreational centers, and golf courses. It also applies to multi‐purpose trails that serve both regional and neighborhood level needs, some of which are paved while others, in particular those found along the San Joaquin River Bluff Environs, may be unpaved.
Buffer. This designation is intended to separate urban uses from long‐term agricultural uses in order to preserve long‐term viable agricultural areas and intensive farming operations adjoining but outside the Planning Area. The Buffer designation will serve to prevent urban residential and related uses from developing near agricultural operations and infringing on full operation of important farmland. A variety of uses are compatible with the purpose of the Buffer, which are defined in detail in the Development Code. General categories include environmental habitats; water conveyance, retention and recharge; preservation and preparation of gravel resources for beneficial uses related to permanent water resource facilities; limited agriculture and necessary supportive uses, such as agricultural processing, excluding animal processing or uses that have the potential to create nuisances; and residential uses with 20 acres of land required per residence.
Downtown. Downtown land use designations are customized for the special conditions of downtown and include three levels of intensity: Neighborhood, General, and Core.
Downtown Neighborhood. This land use designation will create lively, walkable, mixed-use urban neighborhoods surrounding the Downtown Core.
Downtown General. This land use designation supports a high concentration of regional activity generators such as governmental buildings and convention centers within a pedestrian-oriented, mixed-use urban setting.
Downtown Core. This land use designation fosters the enhancement of Fresno’s business, shopping and cultural heart by guiding the development of the densest, most active and most interested mixed-use urban center in the region.

R E C I R C U L A T E D P R O G R A M E N V I R O N M E N T A L I M P A C T R E P O R T P U B L I C R E V I E W D R A F T M A R C H 2 0 2 1
G E N E R A L P L A N F R E S N O , C A L I F O R N I A
3-19
3.2.5 Comparison of Land Uses between the MEIR and PEIR
As discussed above, Figure 3-3 shows the land use diagram. No changes to the current land use diagram are proposed as a part of this project. The differences in land use categories within the Planning Area between the existing baseline year of 2019 and what was proposed in the approved General Plan are shown in Table 3.2.B. The Planning Area encompasses the cCity’s current city limits, including the City’s RWRF, the current SOI, and the North Area (described in Section 3.2.10).
Table 3.2.B: Existing 2019 Baseline and General Plan Update Comparison
Land Use Designation General Plan Acreage Identified in MEIR
Existing 2019 Baseline Acreage Change in Acreage
Residential1 46,043 46,459 416 Commercial 6,913 6,665 -248 Industrial 9,578 9,303 -275 Mixed use 4,223 3,863 -360 Public Facilities2 19,127 17,519 -1,608 Open Space3 1,546 2,342 796 Other4 18,597 19,876 1,279 Total 106,027 106,027 0 Population 970,0005 921,0576 -48,943 Source: City of Fresno Planning and Development Department (2019). 1 The residential designation includes all designations that allow residential units except for Mixed use. The Neighborhoods
designation in the Downtown Area primarily allows residences. 2 Public facilities include parks, schools, and other facilities publicly owned. 3 Open space includes ponding basins, commercial recreation, clear zones, flood control facilities, and open space. 4 The “Other” category for the General Plan does not include SEGA because the individual land uses are included in the land use
designations. This category includes roads canals, railroads, etc. and the buffer area designated in Southeast Development Area. 5 The population identified for the General Plan represents full buildout of the Planning Area. Full buildout is projected to occur in
approximately year 2056. 5 Based on updated projections and discussed in Section 4.14, Population and Housing, the General Plan build out year of 2056
would result in a small population than previously projected.
3.2.6 Population Projection for Planning Area under General Plan
As shown in Table 3.2.C, the projected population estimate under buildout conditions within the Planning Area is 970,000 persons by year 2056. The population growth within the Planning Area is estimated from projections that were identified in the Fresno County 2050 Growth Projections prepared for the Fresno Council of Governments in May 2017.

G E N E R A L P L A N F R E S N O , C A L I F O R N I A
R E C I R C U L A T E D P R O G R A M E N V I R O N M E N T A L I M P A C T R E P O R T P U B L I C R E V I E W D R A F T
M A R C H 2 0 2 1
3-20
Table 3.2.C: Population Estimate for City of Fresno Planning Area
Year Population Estimate
County of Fresno City of Fresno Planning Area 2015 972,300a 583,380b 2020 1,047,440a 628,464b 2025 1,122,840a 673,704b 2030 1,191,850a 715,110b 2035 1,258,860a 755,316b 2040 1,323,070a 793,842b 2045 1,383,690a 830,214b 2050 1,447,090a 868,254b 2055 1,519,445c 911,667b 2056 1,535,095d 921,057b
Source: City of Fresno (2019). a Fresno County 2050 Growth Projections, Fresno Council of Governments, Table 1. b Planning Area population estimate is 60 percent of the County’s population. c Estimated County Population in 2055 based upon previous 5 year growth increments of approximately 5%. d The one‐year growth increment used for 2056 was approximately 1.03%, which was generally a similar increment if the growth.
increment was extended over 5‐years, and it was based upon the previous 5‐year growth of approximately 5%.
3.2.7 Infill Areas
Infill is the development of new housing or other buildings on scattered vacant lots in a predominantly developed area or on new building parcels created by permitted lot splits. The General Plan identifies primary areas of infill, as shown in Figure 3‐4, Infill Areas. They include the Downtown Planning Area, which includes the Downtown Neighborhoods Community Plan (DNCP) and the Fulton Corridor Specific Plan (FCSP), encompassing approximately 7,290 acres. Another area of primary infill is the Bus Rapid Transit (BRT) Corridors and Centers. The corridors include the Blackstone Avenue Corridor, Ventura Avenue – Kings Canyon Road Corridor, Clovis Avenue – State Route 180/Belmont Corridor, Shaw Avenue Corridor, and the California Avenue and West Shaw Avenue Corridors. The specific locations of these corridors are depicted on Figure IM‐1 of the General Plan. The Non‐Corridor Infill Areas are located throughout the city and not within the infill areas identified above.
3.2.8 Growth Areas
The Growth Areas are defined as areas located outside the existing city limits and within the Planning Area, as shown on Figure 3‐5, Growth Areas. In addition, the Growth Areas do not include existing county islands within Fresno, or the North Area (described in Section 3.2.10). Two categories of growth areas are identified in the General Plan:
• Growth Area 1 includes areas where future growth could occur based on planned infrastructure expansion, public service capacity, and fiscal considerations.
• Growth Area 2 includes areas that require critical infrastructure improvements, and the City does not anticipate funding for these areas to be committed in the near‐term.

SOURCE DARM; Infill/InfillAreas-MEIR:
MILES
31.50
N
I:\CFO1802\G\Infill_Areas.cdr (2/28/2020)
FIGURE 3-4
City of Fresno General Plan
Program Environmental Impact Report
Infill Areas
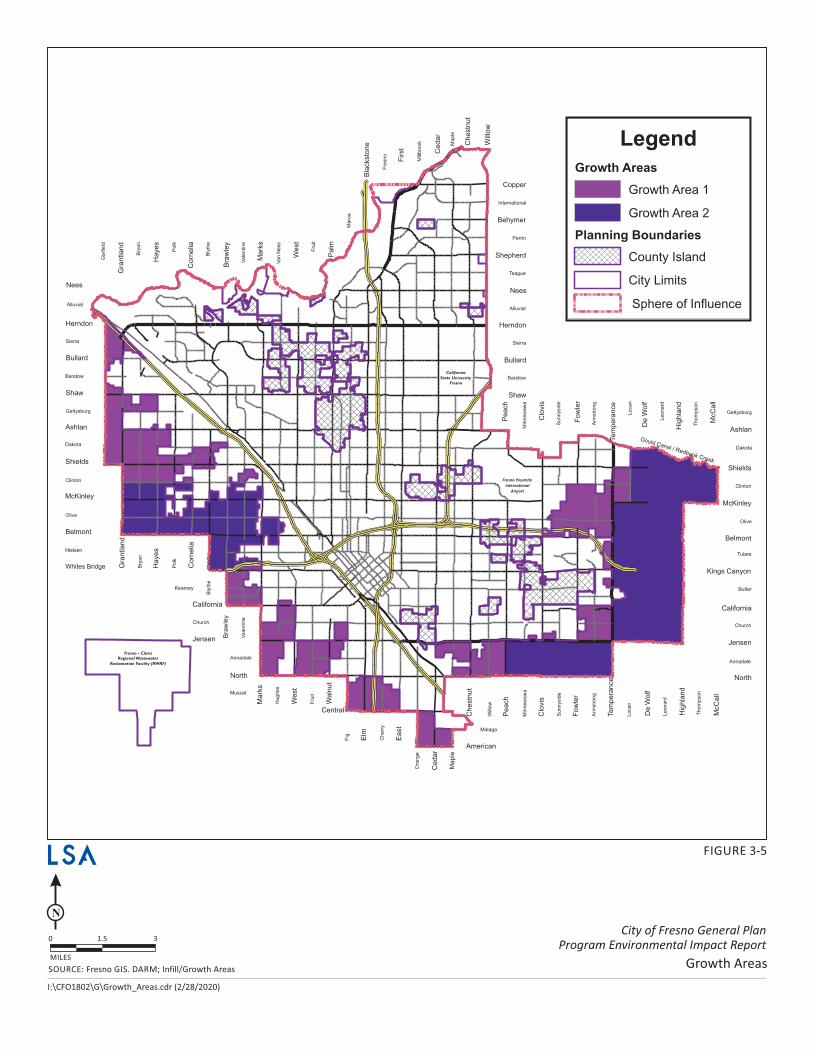
SOURCE Fresno GIS. DARM; Infill/Growth Areas:
MILES
31.50
N
I:\CFO1802\G\Growth_Areas.cdr (2/28/2020)
FIGURE 3-5
City of Fresno General Plan
Program Environmental Impact Report
Growth Areas

R E C I R C U L A T E D P R O G R A M E N V I R O N M E N T A L I M P A C T R E P O R T P U B L I C R E V I E W D R A F T M A R C H 2 0 2 1
G E N E R A L P L A N F R E S N O , C A L I F O R N I A
3-23
3.2.9 Development Areas
There are three general areas defined as Development Areas in the General Plan. These areas are shown on Figure 3‐6, Development Areas. The Development Areas include areas contemplated for Complete Neighborhoods that are connected with a range of housing types, employment, supporting retail and service uses, parks and open space, and public/civic uses. The Development Areas include: the West Development Area, the Southwest Development Area, and the Southeast Development Area.
3.2.10 North Area
The North Area is located outside of the existing city limits and outside of the existing SOI. This area is located along the San Joaquin River Corridor north of the City limits and west of Friant Road. The area is under the jurisdiction of the County of Fresno. The City has included this area as part of the Planning Area because the City believes that this area bears relation to its planning, as allowed under California Government Code Section 65300.
3.3 PROJECT OBJECTIVES
The City established specific objectives for the General Plan when it was adopted in 2014 which would serve to aid decision-makers in their review of the proposed project and its associated environmental impacts. Within the General Plan, these were referred to as Goals, but for the sake of clarity, the CEQA term of “objectives” will be used in this EIR. The following objectives were adopted for the General Plan in 2014, and are applicable to the proposed project:
1. Increase opportunity, economic development, business and job creation.
2. Support a successful and competitive Downtown.
3. Emphasize conservation, successful adaptation to climate and changing resource conditions, and performance effectiveness in the use of energy, water, land, buildings, natural resources, and fiscal resources required for the long‐term sustainability of Fresno.
4. Emphasize achieving healthy air quality and reduced greenhouse gas emissions.
5. Support agriculture and food production as an integral industry.
6. Protect, preserve, and enhance natural, historic, and cultural resources.
7. Provide for a diversity of districts, neighborhoods, housing types (including affordable housing), residential densities, job opportunities, recreation, open space, and educational venues that appeal to a broad range of people throughout the city.
8. Develop Complete Neighborhoods and districts with an efficient and diverse mix of residential densities, building types, and affordability which are designed to be healthy, attractive, and centered by schools, parks, and public and commercial services to provide a sense of place and that provide as many services as possible within walking distance.

G E N E R A L P L A N F R E S N O , C A L I F O R N I A
R E C I R C U L A T E D P R O G R A M E N V I R O N M E N T A L I M P A C T R E P O R T P U B L I C R E V I E W D R A F T
M A R C H 2 0 2 1
3-24
9. Promote a city of healthy communities and improve quality of life in established neighborhoods.
10. Emphasize increased land use intensity and mixed‐use development at densities supportive of greater use of transit in Fresno.
11. Emphasize and plan for all modes of travel on local and Major Streets in Fresno.
12. Resolve existing public infrastructure and service deficiencies, make full use of existing infrastructure, and invest in improvements to increase competitiveness and promote economic growth.
13. Emphasize the City as a role model for good growth management planning, efficient processing and permit streamlining, effective urban development policies, environmental quality, and a strong economy. Work collaboratively with other jurisdictions and institutions to further these values throughout the region.
14. Provide a network of well‐maintained parks, open spaces, athletic facilities, and walking and biking trails connecting the city’s districts and neighborhoods to attract and retain a broad range of individuals, benefit the health of residents, and provide the level of public amenities required to encourage and support development of higher density urban living and transit use.
15. Improve Fresno's visual image and enhance its form and function through urban design strategies and effective maintenance.
16. Protect and improve public health and safety.
17. Recognize, respect, and plan for Fresno's cultural, social, and ethnic diversity, and foster an informed and engaged citizenry.
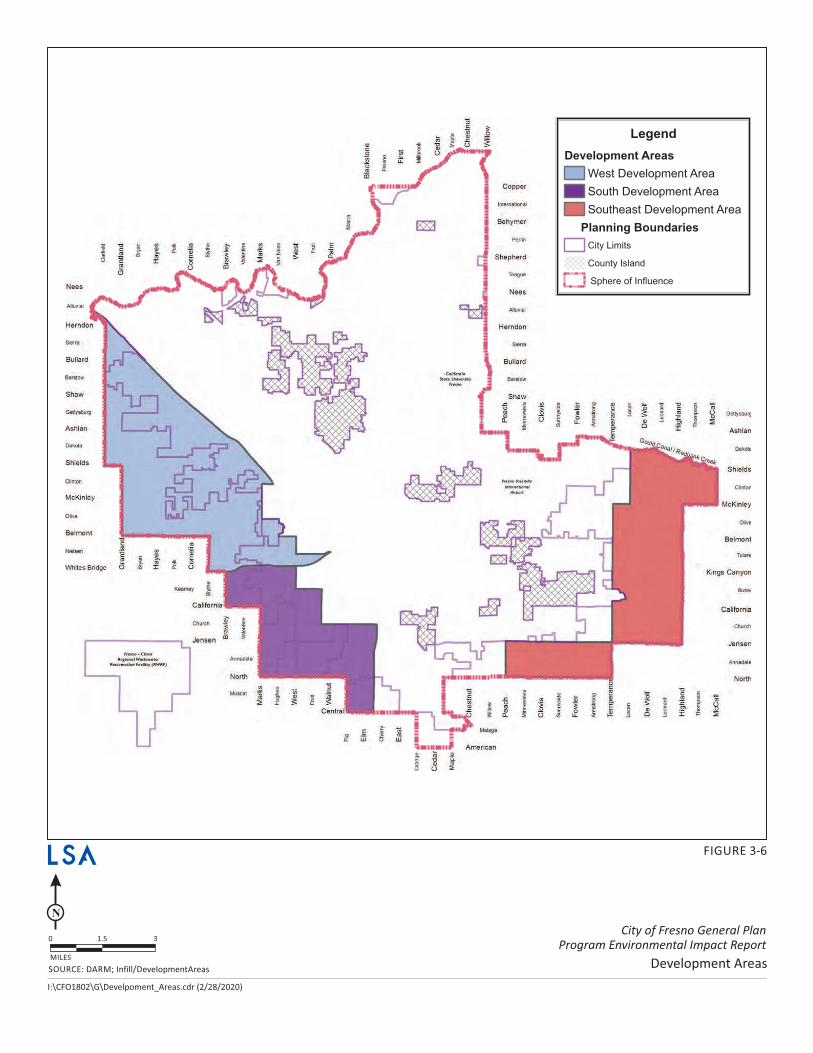
SOURCE DARM; Infill/DevelopmentAreas:
MILES
31.50
N
I:\CFO1802\G\Develpoment_Areas.cdr (2/28/2020)
FIGURE 3-6
City of Fresno General Plan
Program Environmental Impact Report
Development Areas

G E N E R A L P L A N F R E S N O , C A L I F O R N I A
R E C I R C U L A T E D P R O G R A M E N V I R O N M E N T A L I M P A C T R E P O R T P U B L I C R E V I E W D R A F T
M A R C H 2 0 2 1
3-26
This page intentionally left blank
R E C I R C U L A T E D P R O G R A M E N V I R O N M E N T A L I M P A C T R E P O R T P U B L I C R E V I E W D R A F T M A R C H 2 0 2 1
G E N E R A L P L A N F R E S N O , C A L I F O R N I A
3-27
3.4 DISCRETIONARY ACTIONS AND USES OF THIS EIR
The City is the Lead Agency for approval of the proposed changes to the text included in the Mobility and Transportation Element of the General Plan, the update to the Greenhouse Gas Reduction Plan, and certification of the PEIR. No newly proposed projects or land uses are included in the PEIR. Rather, as subsequent projects requiring discretionary approvals are proposed, those individual projects would be subject to plan review and CEQA analysis. It is the City’s intent that the PEIR can be reviewed and tiered from, as appropriate, for evaluations of environmental issues associated with subsequent projects when such approvals require discretionary actions by the City and/or Responsible Agencies. If the City or Responsible Agencies tier off the PEIR, the agency approving the subsequent discretionary actions will be responsible to determine if the environmental evaluation in the PEIR adequately addresses the potential effects associated with the subsequent projects.
As future development in accordance with the General Plan is proposed for development, numerous agencies may be defined as Responsible and Trustee Agencies. Development of these future projects may require approval of discretionary actions by other agencies. These Responsible and Trustee Agencies can use the PEIR for their discretionary approval, if they determine that the environmental evaluation adequately addresses the effects associated with the discretionary action requested of them for approval.
Following is a general list of potential Responsible and Trustee Agencies.
• Caltrans, including the Division of Aeronautics
• California Air Resources Board
• California Department of Conservation
• California Department of Fish and Wildlife
• California Department of Forestry and Fire Protection
• California Department of Housing and Community Development
• California Department of Parks and Recreation
• California Department of Toxic Substances Control
• California Public Utilities Commission
• California State Office of Historic Preservation
• California State Lands Commission
• California State University, Fresno
• California State Water Resources Control Board

G E N E R A L P L A N F R E S N O , C A L I F O R N I A
R E C I R C U L A T E D P R O G R A M E N V I R O N M E N T A L I M P A C T R E P O R T P U B L I C R E V I E W D R A F T
M A R C H 2 0 2 1
3-28
• Central Valley Regional Water Quality Control Board
• County of Fresno
• County of Fresno Local Agency Formation Commission
• Fire Districts (Various)
• Fresno Airport Land Use Commission
• Fresno Council of Governments
• Fresno Metropolitan Flood Control District
• Fresno Irrigation District
• San Joaquin River Conservancy
• San Joaquin Valley Air Pollution Control District
• School Districts (Various)
• Sewer Districts (Various)
• Water Districts (Various)
• Any Other Responsible or Trustee Agency that may need to provide discretionary approval
R E C I R C U L A T E D P R O G R A M E N V I R O N M E N T A L I M P A C T R E P O R T P U B L I C R E V I E W D R A F T M A R C H 2 0 2 1
G E N E R A L P L A N F R E S N O , C A L I F O R N I A
4-1
4.0 EVALUATION OF ENVIRONMENTAL IMPACTS
This chapter contains an analysis of each potentially significant environmental issue that has been identified for the continued implementation of the approved Fresno General Plan, text changes to the Mobility and Transportation Element related to Vehicle Miles Traveled (VMT) analysis, and an update to the Greenhouse Gas Reduction Plan (proposed project). The following discussion: (1) identifies how a determination of significance is made; (2) identifies the environmental issues addressed in this chapter; (3) describes the context for the evaluation of cumulative effects; (4) lists the format of the topical issue section; and (5) provides an evaluation of each potentially significant issue in Sections 4.1 through 4.18.
4.1 DETERMINATION OF SIGNIFICANCE
Under CEQA, a significant effect is defined as a substantial, or potentially substantial, adverse change in the environment. The State CEQA Guidelines direct that this determination be based on scientific and factual data. The impact evaluation in this chapter is prefaced by criteria of significance, which are the thresholds for determining whether an impact is significant. These criteria of significance are based on the State CEQA Guidelines (Appendix G) and applicable City of Fresno (City) policies.
Unlike a Project Environmental Impact Report (EIR), which addresses the environmental impacts of a specific development project, a Program EIR (PEIR) addresses the potential impacts of a series of actions that can be characterized as one large project. Because there is no specific development project being proposed at this time, a Project EIR cannot be prepared; no specific project level details are available. The proposed project, which includes the continued implementation of the approved General Plan, text changes to the Mobility and Transportation Element related to VMT analysis, and an update to the Greenhouse Gas Reduction Plan, is part of a planning document that outlines the type of future development projects that are allowed in the city. Therefore, preparation of a Program EIRPEIR for the proposed project is appropriate, and required, as the project elements are one large project that are related, as described in the State CEQA Guidelines Section 15168 either:
1. Geographically;
2. As logical parts in the chain of contemplated actions;
3. In connection with issuance of rules, regulations, plans, or other general criteria to govern the conduct of a continuing program; or
4. As individual activities carried out under the same authorizing statutory or regulatory authority and having generally similar environmental effects which can be mitigated in similar ways.
The use of a Program EIRPEIR provides an occasion for a more exhaustive consideration of effects and alternatives than otherwise would be practical under a Project EIR. However, future discretionary projects facilitated by certification of a Program EIRPEIR must be further evaluated in light of the Program EIRPEIR to determine whether or not an additional environmental document

G E N E R A L P L A N F R E S N O , C A L I F O R N I A
R E C I R C U L A T E D P R O G R A M E N V I R O N M E N T A L I M P A C T R E P O R T P U B L I C R E V I E W D R A F T
M A R C H 2 0 2 1
4-2
must be prepared. Therefore, the City will determine whether future projects require the preparation of a new Initial Study, Mitigated Negative Declaration, or new EIR. Under CEQA, environmental documentation is required on all discretionary actions, which includes the approval of the proposed project. The purpose of the CEQA process is to disclose environmental impacts of a proposed project to the general public and agencies, who then have the ability to have their comments considered by decision makers.
The proposed project would be implemented through the horizon year of 2035 and beyond, since complete build out of the General Plan would not likely occur until after 2056. TheThis Draft EIR has been prepared as a Program EIRPEIR for the following reasons:
• The proposed project would be implemented over a 15‐year period.
• The proposed project would be implemented over a large geographic area, which is defined as the total area within the Planning Area.
• Development plans and details have not been developed for new projects that could be facilitated by project approval.
Therefore, the use of a Program EIRPEIR is appropriate in evaluating project-related environmental impacts resulting from implementation of the proposed project.
4.2 ISSUES ADDRESSED IN THE DRAFT PEIR
Sections 4.1 through 4.18 of this chapter of the Draft PEIR describe the environmental setting of the project as evaluated in the Draft Program EIRPEIR, and the impacts that are expected to result from implementation of the proposed project. Mitigation measures are proposed to reduce potential impacts, where required.
4.1 Aesthetics 4.2 Agriculture and Forestry Resources 4.3 Air Quality 4.4 Biological Resources 4.5 Cultural Resources and Tribal Cultural Resources 4.6 Energy 4.7 Geology and Soils 4.8 Greenhouse Gas Emissions 4.9 Hazards and Hazardous Materials
4.10 Hydrology and Water Quality 4.11 Land Use and Planning 4.12 Mineral Resources 4.13 Noise 4.14 Population and Housing 4.15 Public Services and Recreation 4.16 Transportation 4.17 Utilities and Service Systems 4.18 Wildfire
The following sections of the Draft PEIR have been updated in this Recirculated Draft PEIR.
4.3 Air Quality 4.8 Greenhouse Gas Emissions 4.16 Transportation

R E C I R C U L A T E D P R O G R A M E N V I R O N M E N T A L I M P A C T R E P O R T P U B L I C R E V I E W D R A F T M A R C H 2 0 2 1
G E N E R A L P L A N F R E S N O , C A L I F O R N I A
4-3
4.3 ENVIRONMENTAL SETTING
This chapter has been prepared in accordance with State CEQA Guidelines Section 15125, which states: “An EIR must include a description of the physical environmental conditions in the vicinity of the project, as they exist at the time the notice of preparation is published, or if no notice of preparation is published, at the time environmental analysis is commenced, from both a local and regional perspective. The environmental setting will normally constitute the baseline physical conditions by which a Lead Agency determines whether an impact is significant. The description of the environmental setting shall be no longer than is necessary to an understanding of the physical effects of the proposed project and its alternatives.”
The NOP for the proposed project was published on May 16, 2019. Thus, eachmost of the environmental topical sections in this chapter includes a discussion of physical conditions in the Planning Area on or around May 16, 2019. As described in Chapter 3.0, Project Description, the PEIR uses a baseline inventory year of 2016 for the greenhouse gas analysis. This was done because the City prepared an updated inventory in 2016 that accounted for regulations adopted to that point in time. As a result, the 2016 baseline year provides the most accurate and understandable picture of the environmental impacts of the project for the greenhouse gas analysis.
4.4 CUMULATIVE ANALYSIS CONTEXT
CEQA defines cumulative impacts as “two or more individual effects which, when considered together, are considerable, or which can compound to increase other environmental impacts.” Section 15130 of the State CEQA Guidelines requires that an EIR evaluate potential environmental impacts when the project’s incremental effect is cumulatively considerable. “Cumulatively considerable” means that the incremental effects of an individual project are considerable when viewed in connection with the effects of past projects, the effects of other current projects, and the effects of “reasonably foreseeable probable future” projects, per State CEQA Guidelines Section 15355. Cumulative impacts can result from a combination of the proposed project together with other closely related projects that cause an adverse change in the environment. Cumulative impacts can result from individually minor but collectively significant projects taking place over time.
The methodology used for assessing cumulative impacts typically varies depending on the specific topic being analyzed. CEQA requires that cumulative impacts be discussed using either a list of past, present, and probable future projects producing related or cumulative impacts, or a summary of projections contained in an adopted local, regional, or Statewide plan, or related planning document, that describes or evaluates conditions contributing to the cumulative effect. This EIR uses both approaches to evaluate cumulative impacts, and the particular approach used depends on the topical area under consideration. Refer to the cumulative discussion in the individual topic sections for further discussion.
4.5 FORMAT OF ISSUE SECTIONS
The environmental topical section comprises two primary parts: (1) Setting, and (2) Impacts and Mitigation Measures. An overview of the general organization and the information provided in the two parts is provided below:

G E N E R A L P L A N F R E S N O , C A L I F O R N I A
R E C I R C U L A T E D P R O G R A M E N V I R O N M E N T A L I M P A C T R E P O R T P U B L I C R E V I E W D R A F T
M A R C H 2 0 2 1
4-4
• Setting. The Setting section for the environmental topic generally provides a description of the applicable physical setting (e.g., existing land uses, existing traffic conditions) for the Planning Area of the City of Fresno. An overview of regulatory considerations that are applicable to each specific environmental topic is also provided.
• Impacts and Mitigation Measures. The Impacts and Mitigation Measures section for the environmental topic presents a discussion of the impacts that could result from implementation of the proposed project. The section begins with the criteria of significance, which establish the thresholds to determine whether an impact is significant. The latter part of this section presents the impacts from the proposed project and mitigation measures, as appropriate. Cumulative impacts are also addressed.
Impacts are numbered and shown in bold type, and the corresponding mitigation measures are numbered and indented. Impacts and mitigation measures are numbered consecutively and begin with an acronymic or abbreviated reference to the impact section (e.g., TRA for Transportation). The following symbols are used for individual topics in the Draft PEIR:
AES Aesthetics AG Agriculture and Forestry Resources AIR Air Quality BIO Biological Resources CUL Cultural Resources EN Energy GEO Geology and Soils GHG Greenhouse Gas Emissions HAZ Hazards and Hazardous Materials HYD Hydrology and Water Quality LU Land Use and Planning MIN Mineral Resources NOI Noise POP Population and Housing PSR Public Services and Recreation TRA Transportation UTL Utilities and Service Systems WF Wildfire
Impacts are also categorized by type of impact, as follows: Less-Than-Significant (LTS), Significant (S), and Significant and Unavoidable (SU).
4.6 ENVIRONMENTAL ISSUES
Sections 4.1 through 4.18 of this chapter in the Draft PEIR describe the environmental setting of the project as it relates to each specific environmental topic evaluated in the EIR and the impacts that are expected to result from implementation of the proposed project. Mitigation measures are proposed to reduce potential impacts, where required.

R E C I R C U L A T E D P R O G R A M E N V I R O N M E N T A L I M P A C T R E P O R T P U B L I C R E V I E W D R A F T M A R C H 2 0 2 1
G E N E R A L P L A N F R E S N O , C A L I F O R N I A
4-5
Sections 4.3, 4.8, and 4.16 of the Draft PEIR have been modified and are the only Chapter 4.0 sections included in the Recirculated Draft PEIR. Text that has been modified and deleted is shown in strikethrough and new text is shown as double-underlined. This format is intended to provide clear identification of the changes since the circulation of the Draft PEIR and the Response to Comments Document and will simplify the reader’s review of the revisions.

G E N E R A L P L A N F R E S N O , C A L I F O R N I A
R E C I R C U L A T E D P R O G R A M E N V I R O N M E N T A L I M P A C T R E P O R T P U B L I C R E V I E W D R A F T
M A R C H 2 0 2 1
4-6
This page intentionally left blank

R E C I R C U L A T E D P R O G R A M E N V I R O N M E N T A L I M P A C T R E P O R T P U B L I C R E V I E W D R A F T M A R C H 2 0 2 1
G E N E R A L P L A N F R E S N O , C A L I F O R N I A
4.3-1
4.3 AIR QUALITY
4.3.1 Introduction
This section describes the existing air quality setting in the Planning Area and has been prepared using the methodologies and assumptions contained in the San Joaquin Valley Air Pollution Control District’s (SJVAPCD) Guidance for Assessing and Mitigating Air Quality Impacts (GAMAQI).1 In keeping with these guidelines, this section describes existing air quality and the regulatory framework for air quality. The section also describes the potential effects of the proposed project on air quality, including the effects of construction and operational traffic associated with the proposed project on regional pollutant levels and health risks. Mitigation measures to reduce potentially significant air quality impacts are identified, as necessary. This section has been recirculated to address the applicability of the Community Emission Reduction Plan (CERP) to implementation of the approved General Plan, text changes to the Mobility and Transportation Element, and the updates to the Greenhouse Gas Reduction Plan.
In March 2020, the Governor of the State of California declared a state of emergency relative to the Novel Coronavirus/COVID-19 pandemic. Subsequent orders from the State set forth new requirements for public noticing, as well as public engagement with respect to documents prepared pursuant to the California Environmental Quality Act (CEQA). The City of Fresno has conducted noticing and circulation in compliance with CEQA Guidelines Section 15087 and Executive Order N-80-20. While COVID-19 is a highly communicable respiratory disease, the severity of which can vary for each infected person, its status as a pandemic is not expected to continue throughout the duration of the project. In addition, the potential risk of any future pandemics is not an environmental impact for CEQA purposes; instead, it is an impact of the environment on the Project, which is not required to be addressed in a CEQA analysis.2 The CEQA guidelines do not include any criteria or thresholds for evaluating communicable diseases, including COVID-19, and do not provide guidance or thresholds for evaluating the impact of criteria pollutants on susceptibility to communicable disease, beyond what is set forth in existing guidance. Moreover, the timing, nature, and scope of any future pandemics are unknown at this time. The extent to which residents of the plan area would be vulnerable to a future mass illness or pandemic would depend upon the nature of the illness and the primary means by which it spreads, both of which cannot be predicted at this time.
4.3.2 CEQA Baseline
The City of Fresno is responsible for preparation of a Program Environmental Impact Report (PEIR) for the approved General Plan that was adopted in December 2014. The intent of this current effort is to convert the Master EIR (MEIR) that was prepared in 2014 to a PEIR, and to update the analysis to be in conformance with State law and to be consistent with recent legislative changes, which include Assembly Bill 32 (2006) and Senate Bill (SB) 32 (2016) regarding climate change, SB 743
1 San Joaquin Valley Air Pollution Control District. 2015. CEQA, Guidance/Policies/Rules, Guidance for Assessing
and Mitigating Air Quality Impacts. March 19. Website: www.valleyair.org/transportation/ceqa_idx.htm (accessed February 17, 2020).
2 California Bldg. Indus. Ass'n v Bay Area Air Quality Mgmt. Dist. (2015) 62 Cal. 4th 369; CEQA Guidelines § 15126.2(a).

G E N E R A L P L A N F R E S N O , C A L I F O R N I A
R E C I R C U L A T E D P R O G R A M E N V I R O N M E N T A L I M P A C T R E P O R T P U B L I C R E V I E W D R A F T
M A R C H 2 0 2 1
4.3-2
(2013) regarding Vehicle Miles Travelled (VMT), and the Sustainable Groundwater Management Act (SGMA) (2014). The Project Description, as described in Chapter 3.0 of this PEIR, provides an overview of the content of the approved General Plan, explains that the PEIR will evaluate the continued implementation of the approved General Plan, and identifies specific text changes to the approved General Plan that constitute what is being evaluated in the PEIR (referred to as the “proposed project”). In addition, the Greenhouse Gas Reduction Plan, included as an Appendix to the MEIR, has also been updated and included as Appendix G of the PEIR to take into account the requirements of SB 32. The text changes analyzed as the proposed project are limited to technical revisions to the Mobility and Transportation Element and include the addition of VMT policies consistent with the requirements of Senate Bill (SB) 743 and the revision of text relating to Level of Service (LOS) metrics. These changes are narrow in scope and do not result in direct physical changes to the environment. Therefore, the physical environmental effects of the proposed project would be essentially the same as if the text changes to the approved General Plan were not proposed (referred to as the “No Project scenario”).
Since the General Plan was adopted and the MEIR was certified in 2014, several amendments to the General Plan have been adopted, and new local, State, and/or federal regulations have been enacted. Accordingly, use of a baseline consistent with the date of issuance of the Notice of Preparation (NOP) in 2019, as required by CEQA Guidelines Section 15125, presents the most accurate and understandable picture possible of the project’s expected impacts on current physical conditions of the General Plan as amended.
The No Project scenario assumes continuation of the approved General Plan (2014) without the Mobility and Transportation Element changes or updates to the Greenhouse Gas Reduction Plan just described. In this scenario, future development in the city would occur as currently set forth under the approved General Plan. Text changes related to the Mobility and Transportation Element, including the addition of VMT policies, would not occur. The approved General Plan would not be updated to reflect conformance with SB 743, and no updates to the Greenhouse Gas Reduction Plan would occur. Despite the lack of an update under the No Project scenario, the distribution and location of projected growth would occur in a manner that is consistent with the City’s approved General Plan and zoning documents, as no changes to the proposed land uses are proposed. Development under the approved General Plan would be the same as compared to the proposed project analyzed in the PEIR, and the physical changes to the environment would be the same under both scenarios.
4.3.3 Existing Environmental Setting
The city of Fresno is located in the county of Fresno in the San Joaquin Valley Air Basin (SJVAB). The Air Basin consists of Kings, Madera, San Joaquin, Merced, Stanislaus, and Fresno counties, as well as a portion of Kern county. The local agency with jurisdiction over air quality in the Basin is the San Joaquin Valley Air Pollution Control District (SJVAPCD). Regional and local air quality is impacted by topography, dominant airflows, atmospheric inversions, location, and season.
4.3.3.1 Study Area for Project Impacts
The study area for project impacts regarding air quality is the City of Fresno Planning Area and proximate sensitive receptors potentially impacted by a project within the Planning Area because

R E C I R C U L A T E D P R O G R A M E N V I R O N M E N T A L I M P A C T R E P O R T P U B L I C R E V I E W D R A F T M A R C H 2 0 2 1
G E N E R A L P L A N F R E S N O , C A L I F O R N I A
4.3-3
continued implementation of the City of Fresno General Plan is limited to areas within the Planning Area. However, the continued implementation of the approved General Plan is the cumulative result of hundreds of separate projects requiring separate approvals that add to emissions generated from existing development. Air quality impacts are inherently cumulative in nature. For example, the largest source of emissions, motor vehicles, occur as individuals travel throughout the Planning Area and beyond to a multitude of destinations each day.
4.3.3.2 Study Area for Cumulative Impacts
The study area for the analysis of cumulative regional air quality impacts is the SJVAB which includes the Counties of San Joaquin, Stanislaus, Merced, Madera, Fresno, Kings, Tulare and a portion of Kern. Under the federal Clean Air Act, any monitoring location that exceeds ambient air quality ozone and particulate standards within the air basin results in the entire air basin to be designated nonattainment. Therefore, an exceedance in Fresno or another city would affect the attainment status of the rest of the San Joaquin Valley even if no other location exceeded one of the standards. This means that air quality plans must provide reductions that demonstrate attainment at the location with the highest concentration in the basin and that cleaner locations would attain the standards earlier.
Air pollutants can remain in the atmosphere for long periods and can build to unhealthful levels when stagnant conditions that are common in the San Joaquin Valley occur. Pollutants are transported downwind from urban areas with many emission sources, but also are recirculated to the urban areas by wind eddies and upslope/downslope mountain and valley winds. Therefore, emissions from large urban areas like Fresno have the potential to create regional air quality impacts for ozone and PM in addition to localized impacts for CO, NO2, and PM.
The analysis of regional emissions is based on a summary of projections approach as provided in Section 15130(b)(1)(B) of the CEQA Guidelines. The applicable projections include those provided within the air quality attainment plans for the San Joaquin Valley Air Basin prepared by the District. The study area for the analysis of cumulative localized impacts is limited to areas with sensitive receptors that are in the immediate vicinity of specific sources.
4.3.3.3 San Joaquin Valley
The information in this section is primarily from the SJVAPCD’s Guide for Assessing and Mitigating Air Quality Impacts3 and the accompanying Technical Document4.
The Air Basin has an “inland Mediterranean” climate and is characterized by long, hot, dry summers and short, foggy winters. Sunlight can be a catalyst in the formation of some air pollutants (such as ozone); the Air Basin averages over 260 sunny days per year.
3 Ibid. 4 San Joaquin Valley Air Pollution Control District. 2002. Guide for Assessing and Mitigating Air Quality
Impacts Technical Document Information for Preparing Air Quality Sections in EIRs. January 10. Available online at: valleyair.org/transportation/CEQA%20Rules/GAMAQI%20Tech%20Doc%20Jan%202002%20Rev.pdf (accessed February 17, 2020).

G E N E R A L P L A N F R E S N O , C A L I F O R N I A
R E C I R C U L A T E D P R O G R A M E N V I R O N M E N T A L I M P A C T R E P O R T P U B L I C R E V I E W D R A F T
M A R C H 2 0 2 1
4.3-4
Topography. The Air Basin is generally shaped like a bowl. It is open in the north and is surrounded by mountain ranges on all other sides. The Sierra Nevada mountains are along the eastern boundary (8,000 to 14,000 feet in elevation), the Coast Ranges are along the western boundary (3,000 feet in elevation), and the Tehachapi Mountains are along the southern boundary (6,000 to 8,000 feet in elevation). Comparing the San Joaquin Valley to Los Angeles’ air basin, the Los Angeles basin can handle 10 times more pollution due to its different location, topography and air flow patterns (proximity to the ocean and ocean winds).
Dominant Airflow. Dominant airflows provide the driving mechanism for transport and dispersion of air pollution. The mountains surrounding the Air Basin form natural horizontal barriers to the dispersion of air contaminants. The wind generally flows south‐southeast through the valley, through the Tehachapi Pass and into the Southeast Desert Air Basin portion of Kern county. As the wind moves through the Air Basin, it mixes with the air pollution generated locally, generally transporting air pollutants from the north to the south in the summer and in a reverse flow in the winter.
Inversions. Generally, the temperature of air decreases with height, creating a gradient from warmer air near the ground to cooler air at elevation. This gradient of cooler air over warm air is known as the environmental lapse rate. Inversions occur when warm air sits over cooler air, trapping the cooler air near the ground. These inversions trap pollutants from dispersing vertically, and the mountains surrounding the San Joaquin Valley trap the pollutants from dispersing horizontally. Strong temperature inversions occur throughout the Air Basin in the summer, fall, and winter. Daytime temperature inversions occur at elevations of 2,000 to 2,500 feet above the San Joaquin Valley floor during the summer and at 500 to 1,000 feet during the winter.
During the summer months, high temperatures, atmospheric stagnation, and temperature inversions create an environment conducive for the formation of elevated ozone levels. The Valley averages over 260 sunny days per year. Nearly 90 percent of the annual precipitation in the Valley falls between the months of November through April, with little to none occurring during the summer months.
Ozone concentrations tend to be the highest from June to September, because high pressure systems that influence Valley meteorological and dispersion conditions occur most frequently during the summer months. Ozone concentrations rise from the beginning of the year toward the summer where levels reach their peak by August when temperatures are usually the warmest and when high pressure and stagnation over the Valley are most common.
Temperature inversions, or increasing temperature with increasing height (shown in Figure 4.3-1), can prohibit vertical mixing of an air mass, thus trapping pollutants near the earth’s surface. Put simply, the base of the inversion acts as a lid on the atmosphere, trapping pollution. During the ozone season, inversion events caused by high pressure systems cause air pollutant emissions to

R E C I R C U L A T E D P R O G R A M E N V I R O N M E N T A L I M P A C T R E P O R T P U B L I C R E V I E W D R A F T M A R C H 2 0 2 1
G E N E R A L P L A N F R E S N O , C A L I F O R N I A
4.3-5
build up. Ozone precursors then react to form ozone, which can in turn build up concentrations from day to day under a prolonged period of atmospheric stagnation.5
Figure 4.3-1: San Joaquin Valley Inversion
Source: SJVAPCD (2016). 2016 Plan for the 2008 8-Hour Ozone Standard. Figure 2-3.
These inversions cause haziness, which in addition to moisture may include suspended dust, a variety of chemical aerosols emitted from vehicles, particulates from wood stoves, and other pollutants. In the winter, these conditions can lead to carbon monoxide (CO) “hotspots” along heavily traveled roads and at busy intersections. During summer’s longer daylight hours, stagnant air, high temperatures, and plentiful sunshine provide the conditions and energy for the photochemical reaction between reactive organic gases (ROG) and oxides of nitrogen (NOx), which results in the formation of ozone.
Location and Season. Because of the prevailing daytime winds and time‐delayed nature of ozone, concentrations are highest in the southern portion of the Air Basin, such as around Bakersfield. Summers are often periods of hazy visibility and occasionally unhealthful air, while winter air quality impacts tend to be localized and can consist of (but are not exclusive to) odors from agricultural operations; soot or smoke around residential, agricultural, and hazard‐reduction wood burning; or dust near mineral resource recovery operations.
In the context of air quality, “carrying capacity” refers to the density of emissions that an air basin can “absorb” or “carry” and still meet ambient air quality standards for a given pollutant. The key factors that shape variations in a regional carrying capacity include meteorology, climate, and
5 San Joaquin Valley Air Pollution Control District. 2016. 2016 Plan for the 2008 8-Hour Ozone Standard.
June 16. Website: valleyair.org/Air_Quality_Plans/Ozone-Plan-2016.htm (accessed February 17, 2020).

G E N E R A L P L A N F R E S N O , C A L I F O R N I A
R E C I R C U L A T E D P R O G R A M E N V I R O N M E N T A L I M P A C T R E P O R T P U B L I C R E V I E W D R A F T
M A R C H 2 0 2 1
4.3-6
topography. The Valley’s carrying capacity for particulate matter less than 2.5 micrometers in diameter (PM2.5) is greatly affected by prevailing weather during the winter months and the region’s topography (surrounding mountains). As discussed above, temperature inversions are common during the winter months in the Valley. During these sometimes-lengthy stagnant air episodes, PM2.5 emissions from daily activities rapidly build up to levels above the standard. During these events (or in anticipation of these events) that the SJVAPCD’s Check-Before-You-Burn program and Real-time Air Advisory Network (RAAN) system intervene to inform (or require) the public to limit activity that generates PM2.5 emissions.6
4.3.3.4 Local Air Quality
The local air quality can be evaluated by reviewing relevant air pollution concentrations near the approved General Plan area. Table 4.3-1 summarizes 2015 through 2018 published monitoring data, which is the most recent 4‐year period available. The data is from three monitoring stations in Fresno and one in Clovis. The data shows that during the past few years, the region in and around the city of Fresno has exceeded the standards for some key components of air pollution: ozone, particulate matter (PM) less than 10 micrometers in diameter (PM10), and PM less than 2.5 micrometers in diameter (PM2.5). See the pollutant descriptions in Table 4.3.D for more information regarding the characteristics and health effects of these pollutants.
The data in Table 4.3.A reflects the concentration of the pollutants in the air, measured using air monitoring equipment. This differs from emissions, which are calculations of a pollutant being emitted over a period of time. Emissions for Fresno county using the most recent data available are shown in Table 4.3.B. Emissions within the city of Fresno are included in these emissions, though it also includes other emissions in the county. As shown in Table 4.3.B, the main source of NOx and CO is from on‐road mobile vehicles (cars and trucks on the road). The main source of TOG, ROG, PM, PM10, and PM2.5 is from miscellaneous processes. The main source of SOx is from industrial processes. See the pollutant descriptions in Table 4.3.D for more information regarding the characteristics and health effects of these pollutants.
6 San Joaquin Valley Air Pollution Control District. 2018. 2018 Plan for the 1997, 2006, and 2012 PM2.5
Standards. Available online at: valleyair.org/pmplans/documents/2018/pm-plan-adopted/2018-Plan-for-the-1997-2006-and-2012-PM2.5-Standards.pdf (accessed February 17, 2020). November 15.
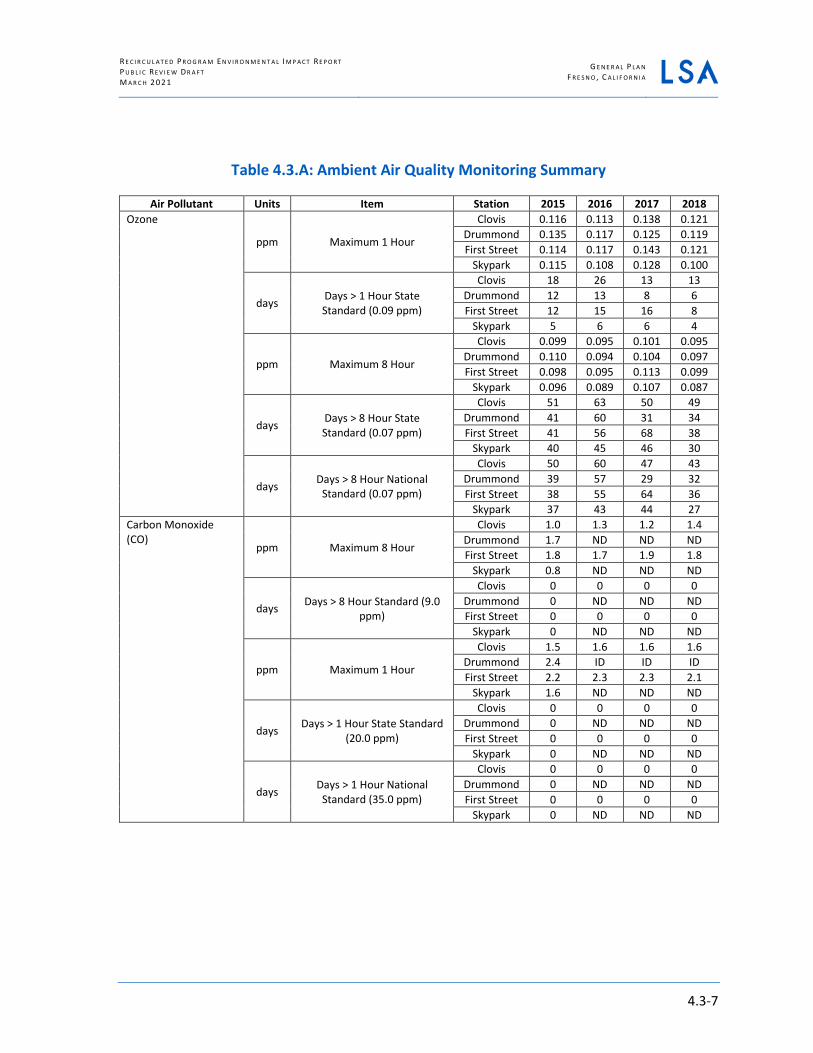
R E C I R C U L A T E D P R O G R A M E N V I R O N M E N T A L I M P A C T R E P O R T P U B L I C R E V I E W D R A F T M A R C H 2 0 2 1
G E N E R A L P L A N F R E S N O , C A L I F O R N I A
4.3-7
Table 4.3.A: Ambient Air Quality Monitoring Summary
Air Pollutant Units Item Station 2015 2016 2017 2018 Ozone
ppm Maximum 1 Hour
Clovis 0.116 0.113 0.138 0.121 Drummond 0.135 0.117 0.125 0.119 First Street 0.114 0.117 0.143 0.121
Skypark 0.115 0.108 0.128 0.100
days Days > 1 Hour State Standard (0.09 ppm)
Clovis 18 26 13 13 Drummond 12 13 8 6 First Street 12 15 16 8
Skypark 5 6 6 4
ppm Maximum 8 Hour
Clovis 0.099 0.095 0.101 0.095 Drummond 0.110 0.094 0.104 0.097 First Street 0.098 0.095 0.113 0.099
Skypark 0.096 0.089 0.107 0.087
days Days > 8 Hour State Standard (0.07 ppm)
Clovis 51 63 50 49 Drummond 41 60 31 34 First Street 41 56 68 38
Skypark 40 45 46 30
days Days > 8 Hour National Standard (0.07 ppm)
Clovis 50 60 47 43 Drummond 39 57 29 32 First Street 38 55 64 36
Skypark 37 43 44 27 Carbon Monoxide (CO)
ppm Maximum 8 Hour
Clovis 1.0 1.3 1.2 1.4 Drummond 1.7 ND ND ND First Street 1.8 1.7 1.9 1.8
Skypark 0.8 ND ND ND
days Days > 8 Hour Standard (9.0 ppm)
Clovis 0 0 0 0 Drummond 0 ND ND ND First Street 0 0 0 0
Skypark 0 ND ND ND
ppm Maximum 1 Hour
Clovis 1.5 1.6 1.6 1.6 Drummond 2.4 ID ID ID First Street 2.2 2.3 2.3 2.1
Skypark 1.6 ND ND ND
days Days > 1 Hour State Standard (20.0 ppm)
Clovis 0 0 0 0 Drummond 0 ND ND ND First Street 0 0 0 0
Skypark 0 ND ND ND
days Days > 1 Hour National Standard (35.0 ppm)
Clovis 0 0 0 0 Drummond 0 ND ND ND First Street 0 0 0 0
Skypark 0 ND ND ND

G E N E R A L P L A N F R E S N O , C A L I F O R N I A
R E C I R C U L A T E D P R O G R A M E N V I R O N M E N T A L I M P A C T R E P O R T P U B L I C R E V I E W D R A F T
M A R C H 2 0 2 1
4.3-8
Table 4.3.A: Ambient Air Quality Monitoring Summary
Air Pollutant Units Item Station 2015 2016 2017 2018 Nitrogen Dioxide (NO2)
ppm Annual Average
Clovis 0.010 0.010 0.010 0.010 Drummond 0.011 0.012 0.012 0.014 First Street 0.010 0.010 0.011 0.011
Skypark 0.007 0.006 0.007 0.008
ppm Maximum 1 Hour
Clovis 0.059 0.050 0.059 0.065 Drummond 0.056 0.059 0.065 0.075 First Street 0.050 0.056 0.057 0.068
Skypark 0.036 0.035 0.051 0.043
days Days > 1 Hour State Standard (0.18 ppm)
Clovis 0 0 0 0 Drummond 0 0 0 0 First Street 0 0 0 0
Skypark 0 0 0 0 Sulfur Dioxide ppm Annual Average First Street 0.001 0.001 0.001 0.001
ppm Maximum 24 Hour First Street 0.011 0.008 0.008 0.007 Inhalable Course Particles (PM10) μg/m3 Annual Average
Clovis 33.9 32.7 36.2 39.6 Drummond 39.6 38.0 44.2 45.8 First Street 34.5 35.4 39.6 41.0
μg/m3 24 Hour Clovis 105.3 76.2 103.2 114.6
Drummond 120.7 88.3 120.5 154.8 First Street 105.3 91.9 160.1 136.2
days Days > 24 Hour State Standard (50 μg/m3)
Clovis 8 10 13 14 Drummond 13 17 17 19 First Street 51 65 97 101
days Days > 24 Hour National Standard (150 μg/m3)
Clovis 0 0 0 0 Drummond 0 0 0 0 First Street 0 0 1 0
Fine Particulate Matter (PM2.5) μg/m3 Annual Average
Clovis 14.9 12.5 136 15.6 First Street 14.5 13.6 14.8 16.6
μg/m3 24 Hour Clovis 80.7 50.4 69.5 82.3
First Street 75.2 53.8 86.0 96.9
days Days > 24 Hour National Standard (35 μg/m3)
Clovis 14 8 19 26 First Street 20 16 31 36
Source: CARB and USEPA (2019). > = exceed ppm = parts per million μg/m3 = micrograms per cubic meter BD = no data State Standard = California Ambient Air Quality Standard National Standard = National Ambient Air Quality Standard Stations: Clovis = 908 N. Villa Avenue, Clovis Drummond = 4706 E. Drummond Street, Fresno First Street = 3727 N. First Street, Fresno Skypark = 4508 Chennault Avenue, Fresno

R E C I R C U L A T E D P R O G R A M E N V I R O N M E N T A L I M P A C T R E P O R T P U B L I C R E V I E W D R A F T M A R C H 2 0 2 1
G E N E R A L P L A N F R E S N O , C A L I F O R N I A
4.3-9
Table 4.3.B: Fresno County Emissions
Emissions Source Emissions (tons per day)
TOG ROG CO NOx SOx PM PM10 PM2.5
Stationary Sources Fuel Combustion 1.7 0.5 3.1 5.9 0.2 0.8 0.8 0.8 Waste Disposal 32.8 0.6 0.1 0.1 0.0 0.2 0.1 0.0 Cleaning and Surface Coatings 9.9 9.3 - - - 0.0 0.0 0.0 Petroleum Production and Marketing 16.8 1.8 0.0 0.0 0.0 0.0 0.0 0.0 Industrial Processes 4.0 3.9 0.1 2.1 0.8 3.6 2.7 1.5 Total Stationary Sources 65.1 16.1 4.1 8.1 1.2 4.7 2.7 1.5 Areawide Sources Solvent Evaporation 12.6 11.3 - - - - - - Miscellaneous Processes 94.9 12.4 18.4 2.2 0.1 114.9 57.6 10.9 Total Areawide Sources 192.9 33.7 61.2 4.0 0.4 132.4 68.1 15.5 Mobile Sources On-Road Motor Vehicles 14.7 13.3 90.6 52.6 0.16 3.0 2.9 1.9 Other Mobile Sources 7.9 7.0 43.2 19.1 0.1 1.2 1.2 1.1 Total Mobile Sources 22.7 20.3 133.8 71.7 0.2 4.2 4.1 3.0 Grand Total for Fresno County 195.2 60.2 156.3 82.0 1.5 123.8 64.4 15.4 Source: CARB (2017). Website: www.arb.ca.gov/app/emsinv/2017/emssumcat_query.php?F_DIV=-4&F_DD=Y&F_YR=2012&F_SEASON=A&SP=SIP105ADJ&F_AREA=CO&F_CO=10
4.3.3.5 Sensitive Receptors
Those individuals who are sensitive to air pollution include children, the elderly, and persons with pre‐existing respiratory or cardiovascular illness. The SJVAPCD considers a sensitive receptor to be a location that houses or attracts children, the elderly, people with illnesses, or others who are especially sensitive to the effects of air pollutants. Examples of sensitive receptors include hospitals, residences, convalescent facilities, and schools. There are many sensitive receptors throughout the city of Fresno.
4.3.3.6 Attainment Status
The United States Environmental Protection Agency (USEPA) and the California Air Resources Board (CARB) designate air basins where ambient air quality standards are exceeded as “nonattainment” areas. If standards are met, the area is designated as an “attainment” area. If there is inadequate or inconclusive data to make a definitive attainment designation, they are considered “unclassified.”
National nonattainment areas are further designated as marginal, moderate, serious, severe, or extreme as a function of deviation from standards. Each standard has a different definition, or “form” of what constitutes attainment, based on specific air quality statistics. For example, the federal 8‐hour CO standard is not to be exceeded more than once per year; therefore, an area is in attainment of the CO standard if no more than one 8‐hour ambient air monitoring value exceeds the threshold per year. In contrast, the federal annual PM2.5 standard is met if the 3‐year average of the annual average PM2.5 concentration is less than or equal to the standard. The current attainment designations for the basin are shown in Table 4.3.C.

G E N E R A L P L A N F R E S N O , C A L I F O R N I A
R E C I R C U L A T E D P R O G R A M E N V I R O N M E N T A L I M P A C T R E P O R T P U B L I C R E V I E W D R A F T
M A R C H 2 0 2 1
4.3-10
Table 4.3.C: SJVAB Air Quality Attainment Status
Pollutant State Federal Ozone (1-hour) Severe/Nonattainment Not Applicable Ozone (8-hour) Nonattainment Extreme Nonattainment
PM10 Nonattainment Attainment (Maintenance) PM2.5 Nonattainment Nonattainment
Carbon Monoxide Attainment Attainment (Maintenance) Nitrogen Dioxide Attainment Unclassified/Attainment
Lead Attainment Unclassified/Attainment Sulfur Dioxide Attainment Unclassified
Sulfates Attainment No Federal Regulation Hydrogen Sulfide Unclassified No Federal Regulation
Source: California Air Resources Board and USEPA (2016).
4.3.4 Methodology
Air pollutants are regulated at the national, State, and air basin level; each agency has a different level of regulatory responsibility. The USEPA regulates at the national level. The CARB regulates at the State level. The SJVAPCD regulates at the air basin or local level.
4.3.4.1 National and State Air Quality Standards
The USEPA is responsible for national and interstate air pollution issues and policies. The USEPA sets national vehicle and stationary source emission standards, oversees approval of all State Implementation Plans, provides research and guidance for air pollution programs, and sets National Ambient Air Quality Standards, also known as federal standards. There are federal standards for six common air pollutants, called criteria air pollutants, which were identified from provisions of the Clean Air Act of 1970. The criteria pollutants are:
• Ozone (O3)
• Particulate matter (PM10 and PM2.5)
• Nitrogen dioxide (NO2)
• Carbon monoxide (CO)
• Lead (Pb)
• Sulfur dioxide (SO2)
The federal standards were set to protect public health, including that of sensitive individuals; thus, the standards continue to change as more medical research is available regarding the health effects
R E C I R C U L A T E D P R O G R A M E N V I R O N M E N T A L I M P A C T R E P O R T P U B L I C R E V I E W D R A F T M A R C H 2 0 2 1
G E N E R A L P L A N F R E S N O , C A L I F O R N I A
4.3-11
of the criteria pollutants. Primary federal standards are the levels of air quality necessary, with an adequate margin of safety, to protect the public health.7
A State Implementation Plan is a document prepared by each state describing existing air quality conditions and measures that will be followed to attain and maintain federal standards. The State Implementation Plan for the State of California is administered by the CARB, which has overall responsibility for Statewide air quality maintenance and air pollution prevention. California’s State Implementation Plan incorporates individual federal attainment plans for regional air districts—air district prepares their federal attainment plan, which sent to CARB to be approved and incorporated into the California State Implementation Plan. Federal attainment plans include the technical foundation for understanding air quality (e.g., emission inventories and air quality monitoring), control measures and strategies, and enforcement mechanisms.
The CARB also administers California Ambient Air Quality Standards (CAAQS) for the 10 air pollutants designated in the California Clean Air Act. The 10 State air pollutants are the six federal standards listed above as well as visibility‐reducing particulates, hydrogen sulfide, sulfates, and vinyl chloride.
The federal and State ambient air quality standards, relevant effects, properties, and sources of the pollutants are summarized in Table 4.3.D and Table 4.3.E.
7 California Air Resources Board. 2016. Ambient Air Quality Standards. Available online at: www.arb.ca.gov/
research/aaqs/aaqs2.pdf (accessed February 17, 2020).
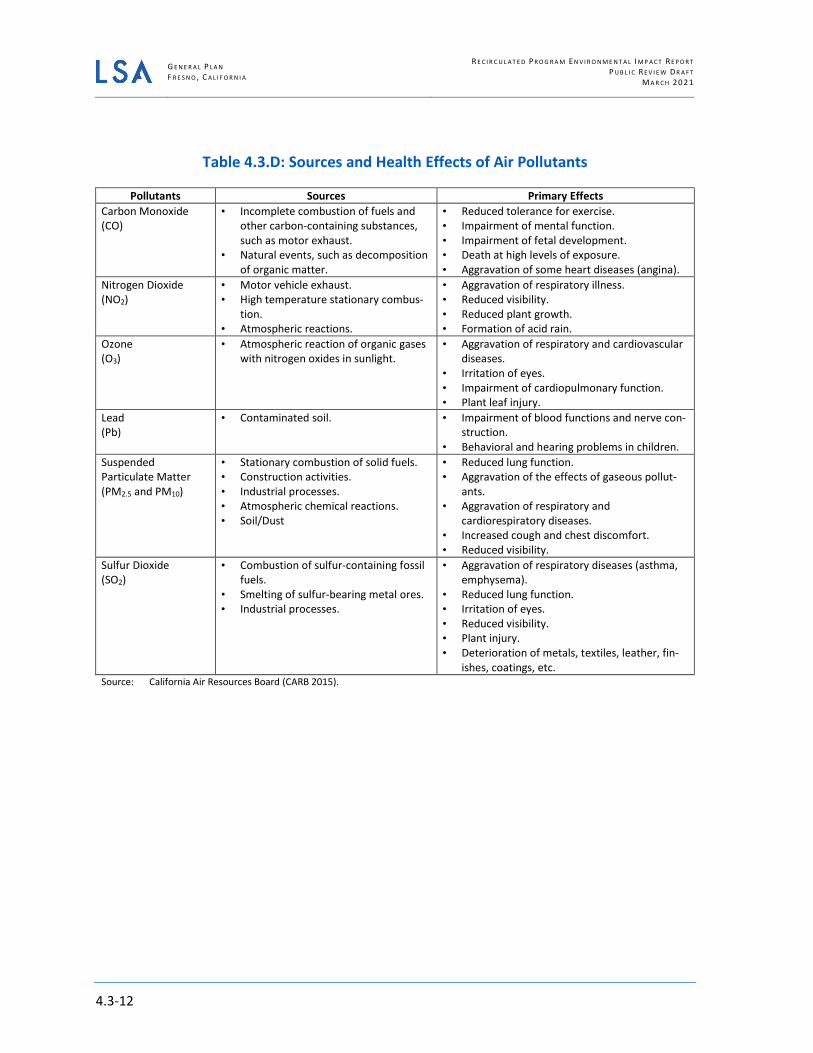
G E N E R A L P L A N F R E S N O , C A L I F O R N I A
R E C I R C U L A T E D P R O G R A M E N V I R O N M E N T A L I M P A C T R E P O R T P U B L I C R E V I E W D R A F T
M A R C H 2 0 2 1
4.3-12
Table 4.3.D: Sources and Health Effects of Air Pollutants
Pollutants Sources Primary Effects Carbon Monoxide (CO)
• Incomplete combustion of fuels and other carbon-containing substances, such as motor exhaust.
• Natural events, such as decomposition of organic matter.
• Reduced tolerance for exercise. • Impairment of mental function. • Impairment of fetal development. • Death at high levels of exposure. • Aggravation of some heart diseases (angina).
Nitrogen Dioxide (NO2)
• Motor vehicle exhaust. • High temperature stationary combus-
tion. • Atmospheric reactions.
• Aggravation of respiratory illness. • Reduced visibility. • Reduced plant growth. • Formation of acid rain.
Ozone (O3)
• Atmospheric reaction of organic gases with nitrogen oxides in sunlight.
• Aggravation of respiratory and cardiovascular diseases.
• Irritation of eyes. • Impairment of cardiopulmonary function. • Plant leaf injury.
Lead (Pb)
• Contaminated soil. • Impairment of blood functions and nerve con-struction.
• Behavioral and hearing problems in children. Suspended Particulate Matter (PM2.5 and PM10)
• Stationary combustion of solid fuels. • Construction activities. • Industrial processes. • Atmospheric chemical reactions. • Soil/Dust
• Reduced lung function. • Aggravation of the effects of gaseous pollut-
ants. • Aggravation of respiratory and
cardiorespiratory diseases. • Increased cough and chest discomfort. • Reduced visibility.
Sulfur Dioxide (SO2)
• Combustion of sulfur-containing fossil fuels.
• Smelting of sulfur-bearing metal ores. • Industrial processes.
• Aggravation of respiratory diseases (asthma, emphysema).
• Reduced lung function. • Irritation of eyes. • Reduced visibility. • Plant injury. • Deterioration of metals, textiles, leather, fin-
ishes, coatings, etc. Source: California Air Resources Board (CARB 2015).

R E C I R C U L A T E D P R O G R A M E N V I R O N M E N T A L I M P A C T R E P O R T P U B L I C R E V I E W D R A F T M A R C H 2 0 2 1
G E N E R A L P L A N F R E S N O , C A L I F O R N I A
4.3-13
Table 4.3.E: Federal and State Ambient Air Quality Standards
Pollutant Averaging
Time California Standardsa Federal Standardsb
Concentrationc Methodd Primaryc,e Secondaryc,f Methodg
Ozone (O3)h
1-Hour 0.09 ppm (180 μg/m3) Ultraviolet
Photometry
– Same as Primary
Standard
Ultraviolet Photometry 8-Hour 0.07 ppm
(137 μg/m3) 0.070 ppm
(137 μg/m3) Respirable Particulate
Matter (PM10)i
24-Hour 50 μg/m3 Gravimetric or Beta
Attenuation
150 μg/m3 Same as Primary
Standard
Inertial Separation and
Gravimetric Analysis
Annual Arithmetic
Mean 20 μg/m3 –
Fine Particulate
Matter (PM2.5)i
24-Hour - 35 μg/m3 Same as Primary
Standard
Inertial Separation and
Gravimetric Analysis
Annual Arithmetic
Mean 12 μg/m3
Gravimetric or Beta Attenuation
12.0 μg/m3
Carbon Monoxide
(CO)
8-Hour 9.0 ppm (10 mg/m3) Non-Dispersive
Infrared Photometry
(NDIR)
9 ppm (10 mg/m3) – Non-Dispersive
Infrared Photometry
(NDIR)
1-Hour 20 ppm (23 mg/m3)
35 ppm (40 mg/m3)
8-Hour (Lake Tahoe)
6 ppm (7 mg/m3) – –
Nitrogen Dioxide (NO2)j
Annual Arithmetic
Mean
0.03 ppm (57 μg/m3)
Gas Phase Chemi-
luminescence
53 ppb (100 μg/m3)
Same as Primary
Standard Gas Phase
Chemi-luminescence
1-Hour 0.18 ppm (339 μg/m3)
100 ppb (188 μg/m3) -
Lead (Pb)l,m
30-Day Average
1.5 μg/m3
Atomic Absorption
– – High-Volume Sampler and
Atomic Absorption
Calendar Quarter
– 1.5 μg/m3 (for certain areas)l Same as
Primary Standard
Rolling 3-Month
Averagei – 0.15 μg/m3
Sulfur Dioxide (SO2)k
24-Hour 0.04 ppm
(105 μg/m3)
Ultraviolet Fluorescence
0.14 ppm (for certain areas) –
Ultraviolet Fluorescence;
Spectro-photometry
(Pararosaniline Method)
3-Hour – – 0.5 ppm
(1300 μg/m3)
1-Hour 0.25 ppm (655 μg/m3)
75 ppb (196 μg/m3)k –
Annual Arithmetic
Mean – 0.030 ppm
(for certain areas)k –
Visibility-Reducing Particlesl
8-Hour See footnote n
Beta Attenuation and
Transmittance through Filter
Tape.
No
Federal
Standards
Sulfates 24-Hour 25 μg/m3 Ion
Chromatography Hydrogen
Sulfide 1-Hour 0.03 ppm (42 μg/m3)
Ultraviolet Fluorescence
Vinyl Chloridej 24-Hour 0.01 ppm
(26 μg/m3) Gas
Chromatography Table notes are provided on the following page.

G E N E R A L P L A N F R E S N O , C A L I F O R N I A
R E C I R C U L A T E D P R O G R A M E N V I R O N M E N T A L I M P A C T R E P O R T P U B L I C R E V I E W D R A F T
M A R C H 2 0 2 1
4.3-14
Source: California Air Resources Board, 2016. https://www.arb.ca.gov/research/aaqs/aaqs2.pdf a California standards for ozone, carbon monoxide (except 8-hour Lake Tahoe), sulfur dioxide (1- and 24-hour), nitrogen dioxide, and
particulate matter (PM10, PM2.5, and visibility reducing particles), are values that are not to be exceeded. All others are not to be equaled or exceeded. California ambient air quality standards are listed in the Table of Standards in Section 70200 of Title 17 of the California Code of Regulations.
b National standards (other than ozone, particulate matter, and those based on annual arithmetic mean) are not to be exceeded more than once a year. The ozone standard is attained when the fourth highest 8-hour concentration measured at each site in a year, averaged over three years, is equal to or less than the standard. For PM10, the 24-hour standard is attained when the expected number of days per calendar year with a 24-hour average concentration above 150 μg/m3 is equal to or less than one. For PM2.5, the 24-hour standard is attained when 98 percent of the daily concentrations, averaged over three years, are equal to or less than the standard. Contact USEPA for further clarification and current national policies.
c Concentration expressed first in units in which it was promulgated. Equivalent units given in parentheses are based upon a reference temperature of 25°C and a reference pressure of 760 torr. Most measurements of air quality are to be corrected to a reference temperature of 25°C and a reference pressure of 760 torr; ppm in this table refers to ppm by volume, or micromoles of pollutant per mole of gas.
d Any equivalent measurement method which can be shown to the satisfaction of the CARB to give equivalent results at or near the level of the air quality standard may be used.
e National Primary Standards: The levels of air quality necessary, with an adequate margin of safety to protect the public health. f National Secondary Standards: The levels of air quality necessary to protect the public welfare from any known or anticipated adverse
effects of a pollutant. g Reference method as described by the USEPA. An “equivalent method” of measurement may be used but must have a “consistent
relationship to the reference method” and must be approved by the USEPA. h On October 1, 2015, the national 8-hour ozone primary and secondary standards were lowered from 0.075 to 0.070 ppm. i On December 14, 2012, the national annual PM2.5 primary standard was lowered from 15 μg/m3 to 12.0 μg/m3. The existing national
24- hour PM2.5 standards (primary and secondary) were retained at 35 μg/m3, as was the annual secondary standard of 15 μg/m3. The existing 24-hour PM10 standards (primary and secondary) of 150 μg/m3 also were retained. The form of the annual primary and secondary standards is the annual mean, averaged over 3 years.
j To attain the 1-hour national standard, the 3-year average of the annual 98th percentile of the 1-hour daily maximum concentrations at each site must not exceed 100 ppb. Note that the national 1-hour standard is in units of parts per billion (ppb). California standards are in units of parts per million (ppm). To directly compare the national 1-hour standard to the California standards the units can be converted from ppb to ppm. In this case, the national standard of 100 ppb is identical to 0.100 ppm.
k On June 2, 2010, a new 1-hour SO2 standard was established and the existing 24-hour and annual primary standards were revoked. To attain the 1-hour national standard, the 3-year average of the annual 99th percentile of the 1-hour daily maximum concentrations at each site must not exceed 75 ppb. The 1971 SO2 national standards (24-hour and annual) remain in effect until one year after an area is designated for the 2010 standard, except that in areas designated nonattainment for the 1971 standards, the 1971 standards remain in effect until implementation plans to attain or maintain the 2010 standards are approved.
Note that the 1-hour national standard is in units of parts per billion (ppb). California standards are in units of parts per million (ppm). To directly compare the 1-hour national standard to the California standard the units can be converted to ppm. In this case, the national standard of 75 ppb is identical to 0.075 ppm.
l The CARB has identified lead and vinyl chloride as ‘toxic air contaminants’ with no threshold level of exposure for adverse health effects determined. These actions allow for the implementation of control measures at levels below the ambient concentrations specified for these pollutants.
m The national standard for lead was revised on October 15, 2008, to a rolling 3-month average. The 1978 lead standard (1.5 μg/m3 as a quarterly average) remains in effect until one year after an area is designated for the 2008 standard, except that in areas designated nonattainment for the 1978 standard, the 1978 standard remains in effect until implementation plans to attain or maintain the 2008 standard are approved.
n In 1989, the CARB converted both the general Statewide 10-mile visibility standard and the Lake Tahoe 30-mile visibility standard to instrumental equivalents, which are “extinction of 0.23 per kilometer” and “extinction of 0.07 per kilometer” for the Statewide and Lake Tahoe Air Basin standards, respectively.
°C = degrees Celsius CARB = California Air Resources Board USEPA = United States Environmental Protection Agency ppb = parts per billion ppm = parts per million mg/m3 = milligrams per cubic meter g/m3 = micrograms per cubic meter

R E C I R C U L A T E D P R O G R A M E N V I R O N M E N T A L I M P A C T R E P O R T P U B L I C R E V I E W D R A F T M A R C H 2 0 2 1
G E N E R A L P L A N F R E S N O , C A L I F O R N I A
4.3-15
Ozone. Ozone is a secondary air pollutant produced in the atmosphere through a complex series of photochemical reactions involving ROG and NOx. The main sources of ROG and NOx, often referred to as ozone precursors, are combustion processes (including combustion in motor vehicle engines) and the evaporation of solvents, paints, and fuels. Automobiles are the single largest source of ozone precursors. Ozone is referred to as a regional air pollutant because its precursors are transported and diffused by wind concurrently with ozone production through the photochemical reaction process. Ozone causes eye irritation, airway constriction, and shortness of breath and can aggravate existing respiratory diseases such as asthma, bronchitis, and emphysema.
Carbon Monoxide. CO is an odorless, colorless gas usually formed as the result of the incomplete combustion of fuels. The single largest source of CO is motor vehicles. CO transport is limited - it disperses with distance from the source under normal meteorological conditions. However, under certain extreme meteorological conditions, CO concentrations near congested roadways or intersec-tions may reach unhealthful levels that adversely affect local sensitive receptors (e.g., residents, schoolchildren, the elderly, and hospital patients). Typically, high CO concentrations are associated with roadways or intersections operating at unacceptable levels of service (LOS) or with extremely high traffic volumes. Exposure to high concentrations of CO reduces the oxygen-carrying capacity of the blood and can cause headaches, nausea, dizziness, and fatigue, impair central nervous system function, and induce angina (chest pain) in persons with serious heart disease. Extremely high levels of CO, such as those generated when a vehicle is running in an unventilated garage, can be fatal.
Particulate Matter. Particulate matter is the term used for a mixture of solid particles and liquid droplets found in the air. Coarse particles are those that are 10 microns or less in diameter, or PM10. Fine, suspended particulate matter with an aerodynamic diameter of 2.5 microns or less, or PM2.5, is not readily filtered out by the lungs. Nitrates, sulfates, dust, and combustion particulates are major components of PM10 and PM2.5. These small particles can be directly emitted into the atmosphere as byproducts of fuel combustion; through abrasion, such as tire or brake lining wear; or through fugitive dust (wind or mechanical erosion of soil). They can also be formed in the atmosphere through chemical reactions. Particulates may transport carcinogens and other toxic compounds that adhere to the particle surfaces and can enter the human body through the lungs.
Nitrogen Dioxide. NO2 is a reddish brown gas that is a byproduct of combustion processes. Automobiles and industrial operations are the main sources of NO2. Aside from its contribution to ozone formation, NO2 also contributes to other pollution problems, including a high concentration of fine particulate matter, poor visibility, and acid deposition. NO2 may be visible as a coloring component on high pollution days, especially in conjunction with high ozone levels. NO2 decreases lung function and may reduce resistance to infection.
Sulfur Dioxide. SO2 is a colorless, irritating gas formed primarily from incomplete combustion of fuels containing sulfur. Industrial facilities also contribute to gaseous SO2 levels in the region. SO2 irritates the respiratory tract, can injure lung tissue when combined with fine particulate matter, and reduces visibility and the level of sunlight.

G E N E R A L P L A N F R E S N O , C A L I F O R N I A
R E C I R C U L A T E D P R O G R A M E N V I R O N M E N T A L I M P A C T R E P O R T P U B L I C R E V I E W D R A F T
M A R C H 2 0 2 1
4.3-16
Lead. Lead is a metal found naturally in the environment as well as in manufactured products. The major sources of lead emissions have historically been mobile and industrial sources. As a result of the phase-out of leaded gasoline, metal processing is currently the primary source of lead emissions. The highest levels of lead in air are generally found near lead smelters. Other stationary sources are waste incinerators, utilities, and lead-acid battery factories. Twenty years ago, mobile sources were the main contributor to ambient lead concentrations in the air. In the early 1970s, the USEPA established national regulations to gradually reduce the lead content in gasoline. In 1975, unleaded gasoline was introduced for motor vehicles equipped with catalytic converters. The USEPA banned the use of leaded gasoline in highway vehicles in December 1995. As a result of the USEPAs regulatory efforts to remove lead from gasoline, emissions of lead from the transportation sector and levels of lead in the air decreased dramatically.
Odors. Odors are also an important element of local air quality conditions. Specific activities can raise concerns related to odors on the part of nearby neighbors. Major sources of odors include restaurants and manufacturing plants. Other odor producers include the industrial facilities within the region. While sources that generate objectionable odors must comply with air quality regulations, the public’s sensitivity to locally-produced odors often exceeds regulatory thresholds.
Toxic Air Contaminants. In addition to the criteria pollutants discussed above, toxic air contaminants (TACs) are another group of pollutants of concern. TACs are injurious in small quantities and are regulated by the USEPA and CARB. Some examples of TACs include benzene, butadiene, formaldehyde, and hydrogen sulfide. The identification, regulation, and monitoring of TACs is relatively recent compared to that for criteria pollutants.
TACs do not have ambient air quality standards, but are regulated by the USEPA, CARB, and the SJVAPCD. In 1998, the CARB identified particulate matter from diesel-fueled engines as a TAC. The CARB has completed a risk management process that identified potential cancer risks for a range of activities using diesel-fueled engines.8 High-volume freeways, stationary diesel engines, and facilities attracting heavy and constant diesel vehicle traffic (e.g., distribution centers and truck stops) were identified as posing the highest risk to adjacent receptors. Other facilities associated with increased risk include warehouse distribution centers, large retail or industrial facilities, high-volume transit centers, and schools with a high volume of bus traffic. Health risks from TACs are a function of both concentration and duration of exposure.
Unlike TACs emitted from industrial and other stationary sources noted above, most diesel particulate matter is emitted from mobile sources—primarily “off-road” sources such as construction and mining equipment, agricultural equipment, and truck-mounted refrigeration units, as well as trucks and buses traveling on freeways and local roadways.
8 California Air Resources Board. 2000. Stationary Source Division and Mobile Source Control Division. Risk
Reduction Plan to Reduce Particulate Matter Emissions from Diesel-Fueled Engines and Vehicles. October.

R E C I R C U L A T E D P R O G R A M E N V I R O N M E N T A L I M P A C T R E P O R T P U B L I C R E V I E W D R A F T M A R C H 2 0 2 1
G E N E R A L P L A N F R E S N O , C A L I F O R N I A
4.3-17
Although not specifically monitored, recent studies indicate that exposure to diesel particulate matter may contribute significantly to a cancer risk (a risk of approximately 500 to 700 in 1,000,000) that is greater than all other measured TACs combined.9 The technology for reducing diesel particulate matter emissions from heavy-duty trucks is well established, and both State and Federal agencies are moving aggressively to regulate engines and emission control systems to reduce and remediate diesel emissions. The CARB anticipates that by 2020, average statewide diesel particulate matter concentrations will decrease by 85 percent from levels in 2000 with full implementation of the CARB’s Diesel Risk Reduction Plan,10 meaning that the statewide health risk from diesel particulate matter is expected to decrease from 540 cancer cases in 1,000,000 to 21.5 cancer cases in 1,000,000. It is likely that cancer risk in the SJVAB from diesel particulate matter will decrease by a similar factor by 2020.
High Volume Roadways. Air pollutant exposures and their associated health burdens vary considerably within places in relation to sources of air pollution. Motor vehicle traffic is perhaps the most important source of intra-urban spatial variation in air pollution concentrations. Air quality research consistently demonstrates that pollutant levels are substantially higher near freeways and busy roadways, and human health studies have consistently demonstrated that children living within 100 to 200 meters (328 to 656 feet) of freeways or busy roadways have reduced lung function and higher rates of respiratory disease. At present, it is not possible to attribute the effects of roadway proximity on non-cancer health effects to one or more specific vehicle types or vehicle pollutants. Engine exhaust, from diesel, gasoline, and other combustion engines, is a complex mixture of particles and gases, with collective and individual toxicological characteristics.
Valley Fever. Valley fever is a fungal infection caused by coccidioides organisms. It can cause fever, chest pain and coughing, among other signs and symptoms. The coccidioides species of fungi that cause valley fever are commonly found in the soil in certain areas, including Kern county. These fungi can be stirred into the air by anything that disrupts the soil, such as farming, construction and wind. The fungi can then be breathed into the lungs and cause valley fever, also known as acute coccidioidomycosis. A mild case of valley fever usually goes away on its own. In more severe cases of valley fever, doctors prescribe antifungal medications that can treat the underlying infection. Valley Fever is not contagious and therefore does not spread from person to person. Most cases (approximately 60 percent) have no symptoms or only very mild flu-like symptoms and do not see a doctor. When symptoms are present, the most common are fatigue, cough, fever, profuse sweating at night, loss of appetite, chest pain, generalized muscle and joint aches particularly of the ankles and knees. There may also be a rash that resembles measles or hives but develops more often as tender red bumps on the shins or forearms.
Asbestos. Asbestos is the name given to a number of naturally occurring fibrous silicate minerals that have been mined for their useful properties such as thermal insulation, chemical and thermal stability, and high tensile strength. The three most common types of asbestos are chrysotile, amosite, and crocidolite. Chrysotile, also known as white asbestos, is the most common type of asbestos found in buildings. Chrysotile makes up approximately 90 to 95 percent of all asbestos contained in buildings in the United States.
9 Ibid. 10 Ibid.

G E N E R A L P L A N F R E S N O , C A L I F O R N I A
R E C I R C U L A T E D P R O G R A M E N V I R O N M E N T A L I M P A C T R E P O R T P U B L I C R E V I E W D R A F T
M A R C H 2 0 2 1
4.3-18
Construction sometimes requires the demolition of existing buildings that may include materials containing asbestos. Although the project does not call for demolition specifically, some demolition does occur as a result of the ongoing implementation of the General Plan. In addition, asbestos is also found in a natural state known as naturally occurring asbestos. Exposure and disturbance of rock and soil that naturally contain asbestos can result in the release of fibers into the air and consequent exposure to the public. Asbestos most commonly occurs in ultramafic rock that has undergone partial or complete alteration to serpentine rock (serpentinite) and often contains chrysotile asbestos. In addition, another form of asbestos, tremolite, can be found associated with ultramafic rock, particularly near faults. Sources of asbestos emissions include unpaved roads or driveways surfaced with ultramafic rock, construction activities in ultramafic rock deposits, or rock quarrying activities where ultramafic rock is present.
Exposure to asbestos is a health threat; exposure to asbestos fibers may result in health issues such as lung cancer, mesothelioma (a rare cancer of the thin membranes lining the lungs, chest, and abdominal cavity), and asbestosis (a non‐cancerous lung disease that causes scarring of the lungs).
The CARB has an Air Toxics Control Measure for construction, grading, quarrying, and surface mining operations requiring the implementation of mitigation measures to minimize emissions of asbestos-laden dust. The measure applies to road construction and maintenance, construction and grading operations, and quarries and surface mines when the activity occurs in an area where naturally occurring asbestos is likely to be found. Areas are subject to the regulation if they are identified on maps published by the Department of Conservation as ultramafic rock units or if the Air Pollution Control Officer or owner/operator has knowledge of the presence of ultramafic rock, serpentine, or naturally occurring asbestos on the site. The measure also applies if ultramafic rock, serpentine, or asbestos is discovered during any operation or activity.
4.3.5 Regulatory Setting
4.3.5.1 Federal Policies and Regulations
The 1970 Federal Clean Air Act authorized the establishment of national health-based air quality standards and also set deadlines for their attainment. The Federal Clean Air Act Amendments of 1990 changed deadlines for attaining national standards as well as the remedial actions required of areas of the nation that exceed the standards. Under the Clean Air Act, State and local agencies in areas that exceed the national standards are required to develop State Implementation Plans to demonstrate how they will achieve the national standards by specified dates.
4.3.5.2 State Policies and Regulations
In 1988, the California Clean Air Act (CCAA) required that all air districts in the State endeavor to achieve and maintain California ambient air quality standards (CAAQS) for carbon monoxide, ozone, sulfur dioxide and nitrogen dioxide by the earliest practical date. The California Clean Air Act provides districts with authority to regulate indirect sources and mandates that air quality districts focus particular attention on reducing emissions from transportation and area-wide emission sources. Each nonattainment district is required to adopt a plan to achieve a 5 percent annual reduction, averaged over consecutive 3-year periods, in district-wide emissions of each nonattainment pollutant or its precursors. A Clean Air Plan shows how a district would reduce

R E C I R C U L A T E D P R O G R A M E N V I R O N M E N T A L I M P A C T R E P O R T P U B L I C R E V I E W D R A F T M A R C H 2 0 2 1
G E N E R A L P L A N F R E S N O , C A L I F O R N I A
4.3-19
emissions to achieve air quality standards. Generally, the State standards for these pollutants are more stringent than the national standards.
Legal authority for California to regulate sources of air pollution is found in federal and State law. The CARB is charged with coordinating regional and local efforts to attain and maintain State and nation air quality standards. The CARB has been given authority to regulate many sources that would normally be pre‐empted by federal regulations through the issuance of waivers.
Pursuant to these authorities, CARB has adopted the world’s most stringent standards for passenger cars, light‐duty trucks, and medium‐duty vehicles. CARB has also adopted regulations establishing standards for heavy‐duty vehicles, off-road vehicles and engines, off-road recreational vehicles, off road diesel engines and equipment, off-road gasoline and liquefied petroleum gas (LPG) engines and equipment, and marine pleasure craft. Descriptions of these regulations are provided below.
Low-Emission Vehicle Program. The CARB first adopted Low‐Emission Vehicle (LEV) program standards in 1990. These first LEV standards ran from 1994 through 2003. LEV II regulations, running from 2004 through 2010, represent continuing progress in emission reductions. As the State’s passenger vehicle fleet continues to grow and more sport utility vehicles and pickup trucks are used as passenger cars rather than work vehicles, the more stringent LEV II standards were adopted to provide reductions necessary for California to meet federally mandated clean air goals outlined in the 1994 State Implementation Plan (SIP). In 2012, CARB adopted the LEV III amendments to California’s Low‐ Emission Vehicle (LEV) regulations. These amendments include more stringent emission standards for both criteria pollutants and greenhouse gases for new passenger vehicles.
On-Road Heavy-Duty Vehicle Program. The CARB has adopted standards for emissions from various types of new on‐road heavy‐duty vehicles. Section 1956.8, Title 13, California Code of Regulations contains California’s emission standards for on‐road heavy‐duty engines and vehicles, and test procedures.11 CARB has also adopted programs to reduce emissions from in‐use heavy‐duty vehicles including the Heavy‐Duty Diesel Vehicle Idling Reduction Program, the Heavy‐Duty Diesel In‐Use Compliance Program, the Public Bus Fleet Rule and Engine Standards, and the School Bus Program and others.
In addition, the CARB’s Truck and Bus regulation was established to meet federal attainment standards. This regulation requires heavy-duty diesel vehicles that operate in California to reduce TAC emissions from their exhaust. Diesel exhaust is responsible for 70 percent of the cancer risk from airborne toxics. Therefore, by January 1, 2023, nearly all trucks and buses will be required to have 2010 or newer model year engines to reduce PM and NOx emissions. To help ensure that the benefits of this regulation are achieved, starting in 2020, only vehicles compliant with this regulation will be registered by the California Department of Motor Vehicles (DMV).12
11 California Air Resources Board. 2019. On-Road Heavy-Duty Vehicle Program. Last reviewed July 2.
Website: ww3.arb.ca.gov/msprog/onroadhd/onroadhd.htm (accessed February 17, 2020). 12 California Air Resources Board. 2019. Truck and Bus Regulation. Website: ww2.arb.ca.gov/our-work/
programs/truck-and-bus-regulation (accessed February 17, 2020).

G E N E R A L P L A N F R E S N O , C A L I F O R N I A
R E C I R C U L A T E D P R O G R A M E N V I R O N M E N T A L I M P A C T R E P O R T P U B L I C R E V I E W D R A F T
M A R C H 2 0 2 1
4.3-20
Airborne Toxic Control Measure for Asbestos. In July 2001, the CARB approved an Air Toxic Control Measure for construction, grading, quarrying and surface mining operations to minimize emissions of naturally occurring asbestos. The regulation requires application of best management practices to control fugitive dust in areas known to have naturally occurring asbestos and requires notification to the local air district prior to commencement of ground‐disturbing activities. The measure establishes specific testing, notification and engineering controls prior to grading, quarrying or surface mining in construction zones where naturally occurring asbestos is located on projects of any size. There are additional notification and engineering controls at work sites larger than one acre in size. These projects require the submittal of a “Dust Mitigation Plan” and approval by the air district prior to the start of a project.
Construction sometimes requires the demolition of existing buildings where construction occurs. Buildings often include materials containing asbestos, but no demolition is associated with this project. However, asbestos is also found in a natural state, known as naturally occurring asbestos. Exposure and disturbance of rock and soil that naturally contain asbestos can result in the release of fibers into the air and consequent exposure to the public. Asbestos most commonly occurs in ultramafic rock that has undergone partial or complete alteration to serpentine rock (serpentinite) and often contains chrysotile asbestos. In addition, another form of asbestos, tremolite, can be found associated with ultramafic rock, particularly near faults. Sources of asbestos emissions include unpaved roads or driveways surfaced with ultramafic rock, construction activities in ultramafic rock deposits, or rock quarrying activities where ultramafic rock is present.
The CARB has an Air Toxics Control Measure for construction, grading, quarrying, and surface mining operations requiring the implementation of mitigation measures to minimize emissions of asbestos-laden dust. The measure applies to road construction and maintenance, construction and grading operations, and quarries and surface mines when the activity occurs in an area where naturally occurring asbestos is likely to be found. Areas are subject to the regulation if they are identified on maps published by the Department of Conservation as ultramafic rock units or if the Air Pollution Control Officer or owner/operator has knowledge of the presence of ultramafic rock, serpentine, or naturally occurring asbestos on the site. The measure also applies if ultramafic rock, serpentine, or asbestos is discovered during any operation or activity. The Department of Conservation Maps show the presence of asbestos mines in San Bernardino county.
Diesel Risk Reduction Plan. The CARB’s Diesel Risk Reduction Plan has led to the adoption of new State regulatory standards for all new on‐road, off‐road, and stationary diesel‐fueled engines and vehicles to reduce DPM emissions by about 90 percent overall from year 2000 levels as stated on page 1 of the plan. The projected emission benefits associated with the full implementation of this plan, including federal measures, are reductions in DPM emissions and associated cancer risks of 75 percent by 2010 and 85 percent by 2020.13
13 Ibid.
R E C I R C U L A T E D P R O G R A M E N V I R O N M E N T A L I M P A C T R E P O R T P U B L I C R E V I E W D R A F T M A R C H 2 0 2 1
G E N E R A L P L A N F R E S N O , C A L I F O R N I A
4.3-21
Air Quality Land Use Handbook.The CARB has developed an Air Quality and Land Use Handbook14
which is intended to serve as a general reference guide for evaluating and reducing air pollution impacts associated with new projects that go through the land use decision-making process. According to the CARB Handbook, recent air pollution studies have shown an association between respiratory and other non-cancer health effects and proximity to high traffic roadways. Other studies have shown that diesel exhaust and other cancer-causing chemicals emitted from cars and trucks are responsible for much of the overall cancer risk from airborne toxics in California. The CARB Handbook recommends that county and city planning agencies strongly consider proximity to these sources when finding new locations for "sensitive" land uses such as homes, medical facilities, daycare centers, schools and playgrounds.
Land use designations with air pollution sources of concern include freeways, rail yards, ports, refineries, distribution centers, chrome plating facilities, dry cleaners and large gasoline service stations. Key recommendations in the CARB Handbook include taking steps to avoid siting new, sensitive land uses:
• Within 500 feet of a freeway, urban roads with 100,000 vehicles/day or rural roads with 50,000 vehicles/day;
• Within 1,000 feet of a major service and maintenance rail yard;
• Immediately downwind of ports (in the most heavily impacted zones) and petroleum refineries;
• Within 300 feet of any dry cleaning operation (for operations with two or more machines, provide 500 feet); and
• Within 300 feet of a large gas station (defined as a facility with a throughput of 3.6 million gallons per year or greater).
The CARB Handbook specifically states that its recommendations are advisory and acknowledges land use agencies have to balance other considerations, including housing and transportation needs, economic development priorities, and other quality of life issues.
The recommendations are generalized and do not consider site specific meteorology, freeway truck percentages or other factors that influence risk for a particular project site. The purpose of the land use compatibility analysis is to further examine the project site for actual health risk associated with the location of new housing on the project site.
Recommendations on siting new sensitive land uses such as residences, schools, daycare centers, playgrounds, or medical facilities are provided in Table 4.3.F.
14 California Air Resources Board. 2005. Air Quality and Land Use Handbook: A Community Health Perspective.
April.

G E N E R A L P L A N F R E S N O , C A L I F O R N I A
R E C I R C U L A T E D P R O G R A M E N V I R O N M E N T A L I M P A C T R E P O R T P U B L I C R E V I E W D R A F T
M A R C H 2 0 2 1
4.3-22
Table 4.3.F: Recommendations on Siting New Sensitive Land Uses Near Toxic Air Contaminant Sources
Source Category Advisory Recommendation Freeways and High-Traffic Roads
Avoid siting new sensitive land uses within 500 feet of a freeway, urban roads with 100,000 vehicles/day, or rural roads with 50,000 vehicles/day.
Distribution Centers Avoid siting new sensitive land uses within 1,000 feet of a distribution center (that accommodates more than 100 trucks per day, more than 40 trucks with operating transport refrigeration units (TRUs) per day, or where TRU unit operations exceed 300 hours per week). Take into account the configuration of existing distribution centers and avoid locating residences and other new sensitive land uses near entry and exit points.
Rail Yards Avoid siting new sensitive land uses within 1,000 feet of a major service and maintenance rail yard. Within one mile of a rail yard, consider possible siting limitations and mitigation approaches.
Refineries Avoid siting new sensitive land uses immediately downwind of petroleum refineries. Consult with local air districts and other local agencies to determine an appropriate separation.
Chrome Platers Avoid siting new sensitive land uses within 1,000 feet of a chrome plater. Dry Cleaners Using Perchloroethylene
Avoid siting new sensitive land uses within 300 feet of any dry cleaning operation. For operations with two or more machines, provide 500 feet. For operations with 3 or more machines, consult with the local air district. Do not site new sensitive land uses in the same building with Perchloroethylene dry cleaning operations.
Gasoline Dispensing Facilities Avoid siting new sensitive land uses within 300 feet of a large gas station (defined as a facility with a throughput of 3.6 million gallons per year or greater). A 50‐foot separation is recommended for typical gas dispensing facilities.
Source: CARB (2006). Note: These recommendations are advisory. Land use agencies have to balance other considerations, including housing and transportation needs, economic development priorities, and other quality of life issues.
4.3.5.3 Regional Policies and Regulations
San Joaquin Valley Air Pollution Control District. The SJVAPCD is responsible for controlling emissions primarily from stationary sources. The SJVAPCD maintains air quality monitoring stations throughout the basin. The SJVAPCD, in coordination with the eight county transportation agencies, is also responsible for developing, updating, and implementing air quality attainment plans for the Air Basin. The SJVAPCD also has roles under CEQA.
California Environmental Quality Act. The SJVAPCD provides guidance and thresholds for CEQA air quality and greenhouse gas analyses. The result of this guidance as well as State regulations to control air pollution is an overall improvement in the Basin. In particular, the SJVAPCD’s Guide for Assessing and Mitigating Air Quality Impacts (GAMAQI) states the following:
The SJVAPCD’s Air Quality Attainment Plans include measures to promote air quality elements in county and city general plans as one of the primary means of reducing indirect emissions such as those from land use development projects. The approved General Plan is the primary long range planning document used by cities and counties to direct development. Since air districts have no authority over land use decisions, it is up to cities and counties to ensure that their general plans
R E C I R C U L A T E D P R O G R A M E N V I R O N M E N T A L I M P A C T R E P O R T P U B L I C R E V I E W D R A F T M A R C H 2 0 2 1
G E N E R A L P L A N F R E S N O , C A L I F O R N I A
4.3-23
help achieve air quality goals. Section 65302.1 of the California Government Code requires cities and counties in the San Joaquin Valley to amend appropriate elements of their general plans to include data, analysis, comprehensive goals, policies, and feasible implementation strategies to improve air quality in their next housing element revisions. This was completed for the City of Fresno with the adoption of the Air Quality Update of the 2025 Fresno General Plan Resources Conservation Element last revised May 7, 2009.
The Air Quality Guidelines for General Plans (AQGGP), adopted by the SJVAPCD in 1994 and amended in 2005, is a guidance document containing goals and policy examples that cities and counties may want to incorporate into their General Plans to satisfy Section 65302.1. When adopted in a general plan and implemented, the suggestions in the AQGGP can reduce vehicle trips and miles traveled and improve air quality. The specific suggestions in the AQGGP are voluntary. The SJVAPCD strongly encourages cities and counties to use their land use and transportation planning authority to help achieve air quality goals by adopting the suggested policies and programs. The approved General Plan integrates many of the recommended goals and policies of the AQGGP.
The SJVAB is classified nonattainment for ozone, PM10, and PM2.5. The SJVAPCD had adopted project level thresholds based on a cumulative contribution of ozone precursors ROG and NOx of 10 tons per year and thresholds for PM10 and PM2.5 of 15 tons per year. Although these thresholds are project specific, a conservative interpretation of this threshold would apply the annual emission thresholds to annual emission generated during continued implementation of the approved General Plan. The combined annual emissions of projects during construction and operation are compared to the annual threshold.
Current Air Quality Plans. The SJVAPCD is responsible for formulating and implementing the Air Quality Management Plan (AQMP) for the Basin. The main purpose of an AQMP is to bring the area into compliance with federal and State air quality standards. The SJVAPCD does not have one single AQMP for criteria pollutants, rather the SJVAPCD address each criteria pollutant with its own Plan. The SJVAPCD has the following AQMPs:
• 2018 Plan for the 1997, 2006, and 2012 PM2.5 Standards
• 2016 Moderate Area Plan for the 2012 PM2.5 sStandard
• 2016 Plan for the 2008 8-Hour Ozone Standard
• 2013 Plan for the Revoked 1-Hour Ozone Standard
• 2007 PM10 Maintenance Plan
• 2004 Revision to the California State Implementation Plan for Carbon Monoxide
The SJVAPCD’s AQMPs incorporate the latest scientific and technological information and planning assumptions, including updated emission inventory methodologies for various source categories. The SJVAPCD’s AQMPs included the integrated strategies and measures needed to

G E N E R A L P L A N F R E S N O , C A L I F O R N I A
R E C I R C U L A T E D P R O G R A M E N V I R O N M E N T A L I M P A C T R E P O R T P U B L I C R E V I E W D R A F T
M A R C H 2 0 2 1
4.3-24
meet the national ambient air quality standards (NAAQS), implementation of new technology measures, and demonstrations of attainment of the 1-hour and 8-hour ozone NAAQS as well as the latest 24-hour and annual PM2.5 standards.
The SJVAPCD’s current air quality plans are discussed blow.
Ozone Plans. The SJVAPCD’s Governing Board approved the 2016 Plan for the 2008 8-Hour Ozone Standard on June 16, 2016. The comprehensive strategy in this plan will reduce NOx emissions by over 60 percent between 2012 and 2031, and will bring the San Joaquin Valley into attainment of USEPA’s 2008 8-hour ozone standard as expeditiously as practicable, no later than December 31, 2031.
Particulate Matter Plans. The SJVAPCD adopted the 2007 PM10 Maintenance Plan in September 2007 to assure the SJVAB’s continued attainment of the USEPA’s PM10 standard. The USEPA designated the valley as an attainment/maintenance area for PM10.
The 2008 PM2.5 Plan builds upon the comprehensive strategy adopted in the 2007 Ozone Plan to bring the Basin into attainment of the 1997 national standards for PM2.5. The USEPA has identified NOx and SO2 as precursors that must be addressed in air quality plans for the 1997 PM2.5 standards. The 2008 PM2.5 Plan is a continuation of the SJVACPD’s strategy to improve the air quality in the SJVAB.
The SJVAPCD prepared the 2012 PM2.5 Plan to bring the San Joaquin Valley into attainment of the USEPA’s most recent 24‐hour PM2.5 standard of 35 μg/m³. The CARB approved the SJVAPCD’s 2012 PM2.5 Plan at a public hearing on January 24, 2013. The plan, approved by the SJVAPCD Governing Board on December 20, 2012, will bring the Valley into attainment of USEPA’s 1997 PM2.5 standard as expeditiously as practicable, but no later than, December 31, 2020.
The SJVAPCD adopted the 2018 Plan for the 1997, 2006, and 2012 PM2.5 Standards on November 15, 2018. This plan addresses the USEPA federal 1997 annual PM2.5 standard of 15 μg/m³ and 24-hour PM2.5 standard of 65 μg/m³; the 2006 24-hour PM2.5 standard of 35 μg/m³; and the 2012 annual PM2.5 standard of 12 μg/m³. This plan demonstrates attainment of the federal PM2.5 standards as expeditiously as practicable.
Rules and Regulations. The SJVAPCD rules and regulations that may apply to projects that will occur during buildout of the Plan Area include but are not limited to the following:
• Rule 2201 – New and Modified Stationary Source Review (applies to any stationary/industrial equipment that emits regulated pollutants in amounts specified by the rule). Rule 2201 requires stationary source projects that exceed certain thresholds to install best available control technology (BACT) and to obtain emission offsets to ensure that growth in stationary sources on a cumulative basis will not result in an increase in emissions.

R E C I R C U L A T E D P R O G R A M E N V I R O N M E N T A L I M P A C T R E P O R T P U B L I C R E V I E W D R A F T M A R C H 2 0 2 1
G E N E R A L P L A N F R E S N O , C A L I F O R N I A
4.3-25
• Rule 2280—Portable Equipment Registration. Portable equipment used at project sites for less than six consecutive months must be registered with the SJVAPCD. The SJVAPCD will issue the registrations 30 days after receipt of the application.
• Rule 2303-Mobile Source Emission Reduction Credits. A project may qualify for SJVAPCD vehicle emission reduction credits if it meets the specific requirements of Rule 2303 for any of the following categories:
○ Low-Emission Transit Buses
○ Zero-Emission Vehicles
○ Retrofit Passenger Cars, Light-Duty Trucks, and Medium-Duty Vehicles
○ Retrofit Heavy-Duty Vehicles
• Rule 4002 – National Emissions Standards for Hazardous Air Pollutants. The purpose of the rule is to incorporate the National Emission Standards for Hazardous Air Pollutants from Part 61, Chapter I, Subchapter C, Title 40, Code of Federal Regulations and the National Emission Standards for Hazardous Air Pollutants for Source Categories from Part 63, Chapter I, Subchapter C, Title 40, Code of Federal Regulations to protect the health and safety of the public from hazardous air pollutants, such as asbestos.
• Rule 4102 – Nuisance. The purpose of this rule is to protect the health and safety of the public, and applies to any source operation that emits or may emit air contaminants or other materials.
• Rule 4601 – Architectural Coatings. The purpose of this rule is to limit Volatile Organic Compounds (VOC) emissions from architectural coatings. Emissions are reduced by limits on VOC content and providing requirements on coatings storage, cleanup, and labeling.
• Rule 4641 – Cutback, Slow Cure, and Emulsified Asphalt, Paving and Maintenance Operations. The purpose of this rule is to limit VOC emissions from asphalt paving and maintenance operations. The paving operations for new development and existing paved surfaces will be subject to Rule 4641.
• Rule 4692 – Commercial Charbroiling. The purpose of this rule is to limit VOC and PM10 emissions from commercial charbroiling. New and existing businesses with charbroiling equipment are subject to this rule.
• Rule 4901 – Wood Burning Fireplaces and Wood Burning Heaters. The purposes of this rule are to limit emissions of carbon monoxide and particulate matter from wood burning fireplaces, wood burning heaters, and outdoor wood burning devices, and to establish a public education program to reduce wood burning emissions. All development that includes wood burning devices is subject to this rule.
G E N E R A L P L A N F R E S N O , C A L I F O R N I A
R E C I R C U L A T E D P R O G R A M E N V I R O N M E N T A L I M P A C T R E P O R T P U B L I C R E V I E W D R A F T
M A R C H 2 0 2 1
4.3-26
• Rule 8011—General Requirements: Fugitive Dust Emission Sources. Fugitive dust regulations are applicable to outdoor fugitive dust sources. Operations, including construction operations, must control fugitive dust emissions in accordance with SJVAPCD Regulation VIII. According to Rule 8011, the SJVAPCD requires the implementation of control measures for fugitive dust emission sources. For projects in which construction-related activities would disturb equal to or greater than 1 acre of surface area, the SJVAPCD recommends that demonstration of receipt of an SJVAPCD-approved Dust Control Plan or Construction Notification Form, before issuance of the first grading permit, be made a condition of approval.
• Regulation VIII – Fugitive PM10 Prohibitions. Rules 8011‐8081 are designed to reduce PM10 emissions (predominantly dust/dirt) generated by human activity, including construction and demolition activities, road construction, bulk materials storage, paved and unpaved roads, carryout and track out, etc. All development projects that involve soil disturbance are subject to at least one provision of the Regulation VIII series of rules.
• Rule 9410 – Employer Based Trip Reduction. The purpose of this rule is to reduce vehicle miles traveled (VMT) from private vehicles used by employees to commute to and from their worksites in order to reduce emissions of NOx, VOC and PM. The rule requires larger employers (those with 100 or more eligible employees) to establish employee trip reduction programs to reduce VMT, reducing emissions associated with work commutes. The rule uses a menu-based Employer Trip Reduction Implementation Plan and periodic reporting requirements to evaluate performance on a phased‐in compliance schedule.
• Rule 9510 – Indirect Source Review. This rule reduces the impact of NOx and PM10 emissions from new development projects. The rule places application and emission reduction requirements on development projects meeting applicability criteria in order to reduce emissions through onsite mitigation, offsite SJVAPCD‐administered projects, or a combination of the two. Compliance with SJVAPCD Rule 9510 reduces emissions impacts through incorporation of onsite measures as well as payment of an offsite fee that funds emission reduction projects in the Air Basin. The emissions analysis for Rule 9510 is detailed and is dependent on the exact project design that is expected to be constructed or installed. Compliance with Rule 9510 is separate from the CEQA process, though the control measures used to comply with Rule 9510 may be used to mitigate significant air quality impacts.
• Odor impacts on residential areas and other sensitive receptors, such as hospitals, day-care centers, schools, etc., warrant the closest scrutiny, but consideration could also be given to other land uses where people may congregate, such as recreational facilities, worksites, and commercial areas. While offensive odors rarely cause any physical harm, they can be very unpleasant, leading to considerable distress among the public and often generating citizen complaints to local governments and the SJVAPCD.

R E C I R C U L A T E D P R O G R A M E N V I R O N M E N T A L I M P A C T R E P O R T P U B L I C R E V I E W D R A F T M A R C H 2 0 2 1
G E N E R A L P L A N F R E S N O , C A L I F O R N I A
4.3-27
Two situations create a potential for odor impact. The first occurs when a new odor source is located near an existing sensitive receptor. The second occurs when a new sensitive receptor locates near an existing source of odor. The SJVAPCD has determined the common land use types that are known to produce odors in the Basin. These types are shown in Table 4.3.G.
Table 4.3.G: Screening Levels for Potential Odor Sources
Odor Generator Distance Wastewater Treatment Facilities 2 miles Sanitary Landfill 1 mile Transfer Station 1 mile Composting Facility 1 mile Petroleum Refinery 2 miles Asphalt Batch Plant 1 mile Chemical Manufacturing 1 mile Fiberglass Manufacturing 1 mile Painting/Coating Operations (e.g., auto body shop) 1 mile Food Processing Facility 1 mile Feed Lot/Dairy 1 mile Rendering Plant 1 mile Source: San Joaquin Valley Air Pollution Control District (2015).
Community Emissions Reductions Program: Assembly Bill 617. AB 617 requires the CARB and air districts to develop and implement a Community Emission Reduction Plan (CERP) with additional emissions reporting, monitoring, and reduction plans and measures in an effort to reduce air pollution exposure in disadvantaged communities. Given that 20 of the 30 most disadvantaged communities in California are in the San Joaquin Valley, this process is expected to bring additional clean air resources and strategies to many Valley communities.
South Central Fresno and the City of Shafter are the first Valley communities selected by the California Air Resources Board for investment of additional resources under AB 617. The Valley Air District has established a steering committee for each of these communities comprising community residents, businesses, community advocates, and government representatives to assist in the development and implementation of community air monitoring and emission reduction programs.
South Central Fresno is geographically bounded by McKinley Avenue to the north, Chestnut Avenue to the east, American Avenue to the south, and includes the community of Malaga and its surrounding industrial area to the southeast. The western portion of the boundary ranges from Nielsen and Brawley Avenues in the northwest to State Route (SR) 41 and American Avenue in the southwest, which incorporates residential and industrial communities along SR- 99 and west of SR-41 such as the Industrial Triangle and parts of West Fresno. The South Central Fresno community also includes downtown Fresno, Chinatown, Roeding Park, and encompasses multiple hospitals, schools, small businesses, and densely populated residential areas. The total population in this South Central Fresno community is estimated to be around 130,000.

G E N E R A L P L A N F R E S N O , C A L I F O R N I A
R E C I R C U L A T E D P R O G R A M E N V I R O N M E N T A L I M P A C T R E P O R T P U B L I C R E V I E W D R A F T
M A R C H 2 0 2 1
4.3-28
The southwest portion of Fresno includes a number of industrial sources of emissions and includes SR-180 and SR-41, and their interchange. As such, the sources that affect South Central Fresno include freight operations, industry, and freeways.
Fresno’s CERP was adopted by CARB and is now in the implementation phase. The CERP includes a technical analysis describing the sources of pollution impacting the community, as well as the location of sensitive receptors within the community. Sources of pollution that are of particular concern to South Central Fresno are identified, and possible strategies for reducing pollution impacts from these sources are evaluated. The strategies that were ultimately selected for implementation in the community are outlined in the CERP, including incentive funding measures, public engagement strategies, enforcement strategies, regulatory strategies, and strategies that will be completed in partnership with other agencies and local organizations. In addition, the CERP includes an implementation schedule and metrics for tracking emission reductions in annual reporting and at the 5-year milestone.
Fresno Council of Governments. Fresno Council of Governments (FCOG) is responsible for regional transportation planning in Fresno county and participates in developing mobile source emission inventories used in air quality attainment plans.
Regional Transportation Plan/Sustainable Communities Strategy. Regional Transportation Plans (RTPs) are State-mandated plans that identify long-term transportation needs for a region’s transportation network. Fresno Council of Governments’ (FCOG) 2018 RTP charts the long‐range vision of regional transportation in Fresno county through the year 2042. The RTP identifies existing and future transportation related needs, while considering all modes of travel, analyzing alternative solutions, and identifying priorities for the anticipated available funding for the 1,100 projects and multiple programs included within it. Senate Bill 375 (SB 375), which went into effect in 2009, added statutes to the California Government Code to encourage planning practices that create sustainable communities. It calls for each metropolitan planning organization to prepare a Sustainable Communities Strategy (SCS) as an integrated element of the RTP that is to be updated every four years. The SCS is intended to show how integrated land use and transportation planning can lead to lower greenhouse gas (GHG) emissions from autos and light trucks. Fresno COG has included the SCS in its 2018 RTP.
Transportation Conformity. FCOG must ensure that transportation plans and projects comply with Federal Transportation Conformity. Transportation conformity is a way to ensure that Federal funding and approval are given to those transportation activities that are consistent with air quality goals. It ensures that these transportation activities do not worsen air quality or interfere with the "purpose" of the State Implementation Plan, which is to meet the NAAQS. Meeting the NAAQS often requires emissions reductions from mobile sources. According to the Clean Air Act, transportation plans, programs, and projects cannot:
• Create new NAAQS violations;
• Increase the frequency or severity of existing NAAQS violations; or
• Delay attainment of the NAAQS.

R E C I R C U L A T E D P R O G R A M E N V I R O N M E N T A L I M P A C T R E P O R T P U B L I C R E V I E W D R A F T M A R C H 2 0 2 1
G E N E R A L P L A N F R E S N O , C A L I F O R N I A
4.3-29
In practice, air quality plans include criteria pollutant emission budgets required for attainment of air quality standards by mandated deadlines. The budgets must not be exceeded considering projected growth in mobile source activity. The FCOG 2019 Conformity Analysis determined that the conformity tests for ozone, PM10 and PM2.5 revealed that all years are projected to be less than the approved emissions budgets and, as such, the conformity tests are satisfied.
4.3.5.4 Local Policies and Regulations
The following is a summary of the applicable policies included in the City’s approved General Plan that are related to air quality and applicable to the proposed project.
City of Fresno General Plan. The approved General Plan is a set of policies and programs that form a blueprint for the physical development of the city. For a description of each of the elements within the approved General Plan, refer to Chapter 3.0, Project Description. The following objectives and policies related to air quality are presented in various elements of the approved General Plan:
Urban Form, Land Use, and Design Element
Policy UF‐1‐c: Identifiable City Structure. Focus integrated and ongoing planning efforts to achieve an identifiable city structure, comprised of a concentration of buildings, people, and pedestrian-oriented activity in Downtown; along a small number of transit-oriented, mixed-use corridors and strategically located Activity Centers; and in existing and new neighborhoods augmented with parks and connected by multi-purpose trails and tree lined bike lanes and streets.
Objective UF‐12: Locate roughly one-half of future residential development in infill areas—defined as being within the City on December 31, 2012—including the Downtown core area and surrounding neighborhoods, mixed-use centers and transit-oriented development along major BRT corridors, and other non-corridor infill areas, and vacant land.
Commentary: The Planning Director will provide an annual report describing the City’s compliance with the Plan and progress toward meeting the goals and objectives to City Council, and prepare, every five years, an updated plan for achieving this goal, with recommended appropriate policy amendments and also new implementation strategies necessary to meet this goal by 2035. The rate of progress toward meeting this goal is not expected to occur in a linear or “one-to-one” pattern. Development in infill areas versus growth areas may progress in an uneven pattern, depending upon the schedule of relevant key incentive programs (such as those related to BRT) and the impact of market forces. However, the City expects to make steady progress toward all the goals and objectives and anticipates meeting them at or near the close of General Plan Horizon in 2035. See the Implementation Element for additional implementation strategies for this objective.
Policy UF‐12‐a: BRT Corridors. Design land uses and integrate development site plans along BRT corridors, with transit-oriented development that supports transit ridership and convenient pedestrian access to bus stops and BRT station stops.
G E N E R A L P L A N F R E S N O , C A L I F O R N I A
R E C I R C U L A T E D P R O G R A M E N V I R O N M E N T A L I M P A C T R E P O R T P U B L I C R E V I E W D R A F T
M A R C H 2 0 2 1
4.3-30
Commentary: Developments close to major streets encourages walking and can be connected with the adjacent neighborhoods through a network of pedestrian ways. Parking will be concealed from the street, and predominant residential uses will be considered an acceptable use in all mixed-use areas.
Policy UF-12-b: Activity Centers. Mixed-use designated areas along BRT and/or transit corridors are appropriate for more intensive concentrations of urban uses. Typical uses could include commercial areas; employment centers; schools; compact residential development; religious institutions; parks; and other gathering points where residents may interact, work, and obtain goods and services in the same place.
Commentary: Activity Centers are typified by a full range of uses, including residential, retail, employment, education, recreation, public amenities, and/or open space features. Near the mixed-use central area of the Activity Center, there are typically higher residential densities, typically 15 to 45 dwelling units per acre, but away from the center of the Activity Center, uses become predominantly residential at lower densities.
Policy UF‐12‐d: Appropriate Mixed-Use. Facilitate the development of vertical and horizontal mixed-uses to blend residential, commercial, and public land uses on one or adjacent sites. Ensure land use compatibility between mixed-use districts in Activity Centers and the surrounding residential neighborhoods.
Commentary: Vertical mixed-use may be achieved within the same building with multiple compatible uses in multiple stories, and horizontal mixed use may be achieved across an integrated development site with a mix of compatible and complementary uses housed in different buildings.
Policy UF-12-e: Access to Activity Centers. Promote adoption and implementation of standards supporting pedestrian activities and bicycle linkages from surrounding land uses and neighborhoods into Activity Centers and to transit stops. Provide for priority transit routes and facilities to serve the Activity Centers.
Policy UF-12-f: Mixed-Use in Activity Centers. Adopt a new Development Code which includes use regulations and standards to allow for mixed-uses and shared parking facilities.
Policy UF-12-g: Impacts on Surrounding Uses. Establish design standards and buffering requirements for high-intensity Activity Centers to protect surrounding residential uses from increased impacts from traffic noise and vehicle emissions, visual intrusion, interruption of view and air movement, and encroachment upon solar access.
Objective UF‐14: Create an urban form that facilitates multi-modal connectivity.
Commentary: Multi-modal connectivity creates the opportunity for people to travel through a variety of modes of transportation, including biking, walking, driving, and using public transit.

R E C I R C U L A T E D P R O G R A M E N V I R O N M E N T A L I M P A C T R E P O R T P U B L I C R E V I E W D R A F T M A R C H 2 0 2 1
G E N E R A L P L A N F R E S N O , C A L I F O R N I A
4.3-31
Policy UF‐14‐a: Design Guidelines for Walkability. Develop and use design guidelines and standards for a walkable and pedestrian-scaled environment with a network of streets and connections for pedestrians and bicyclists, as well as transit and autos.
Commentary: These guidelines will highlight how to achieve these design ideas and avoid barriers to access, such as:
○ Walls and fences that separate related uses or isolate neighborhoods;
○ Over reliance on cul-de-sacs and dead end streets that cut off access within neighborhoods;
○ Disconnected bike and pedestrian paths;
○ Wide streets that lack pedestrian support, such as sidewalks, median strips, and a landscaped strip that separates pedestrians from the street;
○ Street front parking lots that separate pedestrian from commercial operations;
○ Retail centers that are exclusively auto-oriented;
○ Transit stops that are not easily accessible from an individual’s starting point and destination; and
○ Long blocks that discourage walking.
Policy UF-14-b: Local Street Connectivity. Design local roadways to connect throughout neighborhoods and large private developments with adjacent major roadways and pathways of existing adjacent development. Create access for pedestrians and bicycles where a local street must dead end or be designed as a cul-de-sac to adjoining uses that provide services, shopping, and connecting pathways for access to the greater community area.
Policy UF-14-c: Block Length. Create development standards that provide desired and maximum block lengths in residential, retail, and mixed-use districts in order to enhance walkability.
Commentary: When preparing such standards the City should assess the desirability of varying maximum block length requirements between single family residential, multi-family residential, mixed use, and commercial districts.
Objective LU‐2: Plan for infill development that includes a range of housing types, building forms, and land uses to meet the needs of both current and future residents.
Policy LU-2-a: Infill Development and Redevelopment. Promote development of vacant, underdeveloped, and re-developable land within the City Limits where urban services are

G E N E R A L P L A N F R E S N O , C A L I F O R N I A
R E C I R C U L A T E D P R O G R A M E N V I R O N M E N T A L I M P A C T R E P O R T P U B L I C R E V I E W D R A F T
M A R C H 2 0 2 1
4.3-32
available by considering the establishment and implementation of supportive regulations and programs.
Policy LU-2-b: Infill Development for Affordable Housing. Establish a priority infill incentive program for residential infill development of existing vacant lots and underutilized sites within the City as a strategy to help to meet the affordable housing needs of the community.
Policy LU‐3‐b: Mixed-Use Urban Corridors that Connect the Downtown Planning Area. Support the development of mixed-use urban corridors that connect the Downtown Planning Area with the greater Fresno-Clovis Metropolitan Area with functional, enduring, and desirable urban qualities along the Blackstone Avenue, Shaw Avenue, California Avenue, and Ventura Avenue/Kings Canyon Road corridors, as shown on Figure LU-1: General Plan Land Use Diagram.
Policy LU-3-c: Zoning for High Density on Major BRT Corridors. Encourage adoption of supportive zoning regulations for compact development along BRT corridors leading to the Downtown Core that will not diminish the long-term growth and development potential for Downtown.
Policy LU‐5‐f: High Density Residential Uses. Promote high-density residential uses to support Activity Centers and BRT Corridors, and walkable access to transit stops.
Policy LU‐6‐b: Commercial Development Guidelines. Consider adopting commercial development guidelines to assure high quality design and site planning for large commercial developments, consistent with the Urban Form policies of this Plan.
Commentary: The guidelines should address:
○ Architectural finishes, coordinated color palette, massing, and hierarchy in scale;
○ Pedestrian-scaled amenities, signage, and lighting;
○ Site improvements, including parking lot landscaping, perimeter landscaping, foundation landscaping, walkways, and passageways;
○ Ground floor transparency requirements along shopping streets and limitations on blank walls in these areas;
○ Anti-theft glass on windows, rather than bars or roll-down metal screens, that are architecturally compatible with building design;
○ Screening of truck loading, parking, mechanical equipment, transformers, ventilation systems, storage containers, and refuse collection areas from the street;
○ Shading and its relationship and effects on surrounding buildings;

R E C I R C U L A T E D P R O G R A M E N V I R O N M E N T A L I M P A C T R E P O R T P U B L I C R E V I E W D R A F T M A R C H 2 0 2 1
G E N E R A L P L A N F R E S N O , C A L I F O R N I A
4.3-33
○ Building entries; and
○ Design standards for perimeter walls and fencing.
Policy LU‐6‐f: Auto-Oriented Commercial Uses. Direct highway-oriented and auto-serving commercial uses to locations that are compatible with the Urban Form policies of the General Plan. Ensure adequate buffering measures for adjacent residential uses, noise, glare, odors, and dust.
Policy LU-6-g: Lodging Facilities Location. Site lodging facilities and related accommodations near major transportation facilities.
Policy LU‐8‐b: Access to Public Facilities. Ensure that major public facilities and institutions have adequate multi-modal access and can be easily reached by public transit.
Resource Conservation and Resilience Element
Objective RC‐4: In cooperation with other jurisdictions and agencies in the San Joaquin Valley Air Basin, take necessary actions to achieve and maintain compliance with State and federal air quality standards for criteria pollutants.
Commentary: This includes compliance with California Government Code Section 65302.1 for the San Joaquin Valley.
Policy RC-4-a: Support Regional Efforts. Support and lead, where appropriate, regional, State and federal programs and actions for the improvement of air quality, especially the SJVAPCD’s efforts to monitor and control air pollutants from both stationary and mobile sources and implement Reasonably Available Control Measures in the Ozone Attainment Plan.
Commentary: A list of Reasonably Available Control Measures was submitted by the SJVAPCD to the U.S. Environmental Protection Agency as part of the Ozone Attainment Plan designed to reduce ozone-forming emissions. The City is responsible for implementing measures related to operations and/or services that the City controls.
Policy RC-4-b: Conditions of Approval. Develop and incorporate air quality maintenance requirements, compatible with Air Quality Attainment and Maintenance Plans, as conditions of approval for General Plan amendments, community plans, Specific Plans, neighborhood plans, Concept Plans, and development proposals.
Policy RC-4-c: Evaluate Impacts with Models. Continue to require the use of computer models used by SJVAPCD to evaluate the air quality impacts of plans and projects that require such environmental review by the City.
Policy RC-4-d: Forward Information. Forward information regarding proposed General Plan amendments, community plans, Specific Plans, neighborhood plans, Concept Plans, and

G E N E R A L P L A N F R E S N O , C A L I F O R N I A
R E C I R C U L A T E D P R O G R A M E N V I R O N M E N T A L I M P A C T R E P O R T P U B L I C R E V I E W D R A F T
M A R C H 2 0 2 1
4.3-34
development proposals that require air quality evaluation, and amendments to development regulations to the SJVAPCD for their review of potential air quality and health impacts.
Policy RC-4-e: Support Employer-Based Efforts. Support and promote employer implementation of staggered work hours and employee incentives to use carpools, public transit, and other measures to reduce vehicular use and traffic congestion.
Policy RC-4-f: Municipal Operations and Fleet Actions. Continue to control and reduce air pollution emissions from vehicles owned by the City and municipal operations and facilities by undertaking the following:
• Expand the use of alternative fuel, electric, and hybrid vehicles in City fleets.
• Create preventive maintenance schedules that will ensure efficient engine operation.
• Include air conditioning recycling and charging stations in the City vehicle maintenance facilities, to reduce Freon gases being released into the atmosphere and electrostatic filtering systems in City maintenance shops, when feasible or when required by health regulations.
• Use satellite corporation yards for decentralized storage and vehicle maintenance.
• Convert City-owned emergency backup generators to natural gas fuels whenever possible, and create an advanced energy storage system.
Policy RC-4-g: FAX Actions. Continue to improve Fresno Area Express (FAX) bus transit system technical performance, reduce emission levels, streamline system operations, and implement BRT where supportive land uses are proposed by Figure LU-1: Land Use Diagram.
Policy RC-4-h: Airport Actions. Support Airport efforts to develop and maintain programs and policies to support City, State and federal efforts to achieve and maintain air quality standards.
Policy RC-4-i: Methane Capture. Continue to pursue opportunities to reduce air pollution by using methane gas from the old City landfill and the City’s wastewater treatment process.
Policy RC-4-j: All Departments. Continue to develop and implement in all City departments, operational policies to reduce air pollution.
Policy RC-4-k: Electric Vehicle Charging. Develop standards to facilitate electric vehicle charging infrastructure in both new and existing public and private buildings, in order to accommodate these vehicles as the technology becomes more widespread.
Policy RC‐7‐d: Update Standards for New Development. Continue to refine water saving and conservation standards for new development.

R E C I R C U L A T E D P R O G R A M E N V I R O N M E N T A L I M P A C T R E P O R T P U B L I C R E V I E W D R A F T M A R C H 2 0 2 1
G E N E R A L P L A N F R E S N O , C A L I F O R N I A
4.3-35
Objective RC‐8: Reduce the consumption of non-renewable energy resources by requiring and encouraging conservation measures and the use of alternative energy sources.
Policy RC-8-a: Existing Standards and Programs. Continue existing beneficial energy conservation programs, including adhering to the California Energy Code in new construction and major renovations.
Policy RC-8-b: Energy Reduction Targets. Strive to reduce per capita residential electricity use to 1,800 kWh per year and non-residential electricity use to 2,700 kWh per year per capita by developing and implementing incentives, design and operation standards, promoting alternative energy sources, and cost-effective savings.
Commentary: These targets represent 28 and 30 percent reductions respectively, from the 2010 rate of consumption.
Policy RC-8-c: Energy Conservation in New Development. Consider providing an incentive program for new buildings that exceed California Energy Code requirements by fifteen percent.
Policy RC-8-d: Incentives. Establish an incentive program for residential developers who commit to building all of their homes to ENERGY STAR performance guidelines.
Commentary: See also Policy RC-7-j on PACE financing for energy efficient retrofits.
Policy RC-8-e: Energy Use Disclosure. Promote compliance with State law mandating disclosure of a building’s energy data and rating of the previous year to prospective buyers and lessees of the entire building or lenders financing the entire building.
Policy RC-8-f: City Heating and Cooling. Reduce energy use at City facilities by updating heating and cooling equipment and installing “smart lighting” where feasible and economically viable.
Policy RC-8-g: Revolving Energy Fund. Create a City Energy Fund which uses first year savings and rebates from completed City-owned energy efficiency projects to provide resources for additional energy projects. Dedicate this revolving fund to the sole use of energy efficiency projects that will pay back into the fund.
Policy RC-8-h: Solar Assistance. Identify and publicize information about financial mechanisms for private solar installations and provide over-the-counter permitting for solar installations meeting specified standards, which may include maximum size (in kV) of units that can be so approved.
Policy RC-8-i: Renewable Target. Adopt and implement a program to increase the use of renewable energy to meet a given percentage of the city’s peak electrical load within a given time frame.

G E N E R A L P L A N F R E S N O , C A L I F O R N I A
R E C I R C U L A T E D P R O G R A M E N V I R O N M E N T A L I M P A C T R E P O R T P U B L I C R E V I E W D R A F T
M A R C H 2 0 2 1
4.3-36
Policy RC-8-j: Alternative Fuel Network. Support the development of a network of integrated charging and alternate fuel station for both public and private vehicles, and if feasible, open up municipal stations to the public as part of network development.
Policy RC-8-k: Energy Efficiency Education. Provide long-term and on-going education of homeowners and businesses as to the value of energy efficiency and the need to upgrade existing structures on the regular basis as technology improves and structures age.
Healthy Communities Element.
Policy HC‐3‐b: Housing-Related Illness Assessment and Testing. Support efforts to provide community assessment and testing programs for housing-related illnesses (i.e. blood lead levels, respiratory health, and skin conditions).
Commentary: Work collaboratively with the American Lung Association to support assessment and testing of housing related illnesses through best practice program, such as the Master Home Environmentalist Program.
Policy HC‐3‐d: Green Standards for Affordable Housing. Provide appropriate incentives for affordable housing providers, agencies, non-profit, and market rate developers to use LEED and CALGreen Tier 1 or Tier 2 standards or third-party equivalents.
Commentary: The City will publicize the health, environmental, and long term economic and maintenance benefits of applying LEED, CALGreen for third-party equivalents to projects in Fresno.
Policy HC‐3‐f: New Drive-Through Facilities. Incorporate design review measures in the Development Code to reduce vehicle emissions resulting from queued idling vehicles at drive-through facilities proximate to residences.
Commentary: This action will help the City achieve the health benefits associated with improved neighborhood air quality through reduced auto-related emissions.
Mobility and Transportation Element.
Objective MT‐1: Create and maintain a transportation system that is safe, efficient, provides access in an equitable manner, and optimizes travel by all modes.
Policy MT-1-a: Transportation Planning Consistent with the General Plan. Continue to review local, regional and inter-regional transportation plans and capital improvement plans, and advocate for the approval and funding of State highway and rail projects, consistent with the General Plan and discourage projects inconsistent with the General Plan.
Policy MT-1-b: Circulation Plan Diagram Implementation. Design and construct planned streets and highways that complement and enhance the existing network, as well as future improvements to the network consistent with the goals, objectives and policies of the

R E C I R C U L A T E D P R O G R A M E N V I R O N M E N T A L I M P A C T R E P O R T P U B L I C R E V I E W D R A F T M A R C H 2 0 2 1
G E N E R A L P L A N F R E S N O , C A L I F O R N I A
4.3-37
General Plan, as shown on the Circulation Diagram (Figure MT-1), to ensure that each new and existing roadway continues to function as intended.
Policy MT-1-c: Plan Line Adoption. Prepare and adopt Official Plan Lines, or other appropriate documentation such as Director Determinations, for transportation corridors, roadways, and bicycle/pedestrian paths/trails, as necessary to preserve and/or obtain right-of-way needed for planned circulation improvements.
Policy MT-1-d: Integrate Land Use and Transportation Planning. Plan for and maintain a coordinated and well integrated land use pattern, local circulation network and transportation system that accommodates planned growth, reduces impacts on adjacent land uses, and preserves the integrity of established neighborhoods.
Policy MT-1-e: Ensure Interconnectivity Across Land Uses. Update development standards and design guidelines applicable to public and private property to achieve Activity Centers, neighborhoods and communities which are well connected by pedestrian, bicycle, appropriate public transportation and automobile travel facilities.
Policy MT-1-f: Match Travel Demand with Transportation Facilities. Designate the types and intensities of land uses at locations such that related travel demands can be accommodated by a variety of viable transportation modes and support Complete Neighborhoods while avoiding the routing of excessive or incompatible traffic through local residential streets.
Policy MT-1-g: Complete Streets Concept Implementation. Provide transportation facilities based upon a Complete Streets concept that facilitates the balanced use of all viable travel modes (pedestrians, bicyclists, motor vehicle and transit users), meeting the transportation needs of all ages, income groups, and abilities and providing mobility for a variety of trip purposes, while also supporting other City goals.
Implementation actions will include:
• Meeting the needs of all users within the street system as a whole; each individual street does not need to provide all modes of travel, but travel by all modes must be accommodated throughout the Planning Area;
• Continuing to adopt refined street cross-section standards as appropriate in response to needs identified;
• Encouraging conversion of one-way streets to two-way streets to improve location circulation, access, and safety;
• Considering the impact of streets on public health by addressing storm water runoff quality, air quality, and water conservation among other factors; and

G E N E R A L P L A N F R E S N O , C A L I F O R N I A
R E C I R C U L A T E D P R O G R A M E N V I R O N M E N T A L I M P A C T R E P O R T P U B L I C R E V I E W D R A F T
M A R C H 2 0 2 1
4.3-38
• Adhering to the water efficient landscape standards adopted by the City for median and streetscape plantings and irrigation methods.
Policy MT-1-h: Update Standards for Complete Streets. Update the City’s Engineering and Street Design Standards to ensure that roadway and streetscape design specifications reflect the Complete Streets concept, while also addressing the needs of through traffic, transit stops, bus turnouts, passenger loading needs, bike lanes, pedestrian accommodation, and short- and long-term parking.
Commentary: For instance, transit stops and bus turnouts may have higher priority than through traffic on important transit corridors; through traffic may have higher priority than parking on Arterials; and pedestrian and bicycle movement may have high priority in areas with high pedestrian interest and activity such as the Downtown Planning Area.
Policy MT-1-i: Local Street Standards. Establish and implement local roadway standards addressing characteristics such as alignment, width, continuity and traffic calming, to provide efficient neighborhood circulation; to allow convenient access by residents, visitors, and public service and safety providers; and to promote neighborhood integrity and desired quality of life by limiting intrusive pass-through traffic.
Policy MT-1-j: Transportation Improvements Consistent with Community Character. Prioritize transportation improvements that are consistent with the character of surrounding neighborhoods and supportive of safe, functional and Complete Neighborhoods; minimize negative impacts upon sensitive land uses such as residences, hospitals, schools, natural habitats, open space areas, and historic and cultural resources.
• In implementing this policy, the City will design improvements to:
• Facilitate provision of multi-modal transportation opportunities;
• Provide added safety, including appropriate traffic calming measures;
• Promote achievement of air quality standards;
• Provide capacity in a cost effective manner; and
• Create improved and equitable access with increased efficiency and connectivity.
Policy MT-1-l: Level of Service in the Downtown Area. Within the Downtown Planning Area accept vehicle LOS F conditions during peak hours for street segments and intersections specified in community and Specific Plans as may be adopted by the City. Where there is an overlap in policies regarding LOS in the Downtown Planning Area, this policy shall supersede.
Policy MT-1-o: LOS Deviations Outside of Activity Centers and Areas Designated for Mixed-Use. Accept vehicle LOS E or F conditions outside of identified multi-modal districts only if

R E C I R C U L A T E D P R O G R A M E N V I R O N M E N T A L I M P A C T R E P O R T P U B L I C R E V I E W D R A F T M A R C H 2 0 2 1
G E N E R A L P L A N F R E S N O , C A L I F O R N I A
4.3-39
provisions commensurate with the level of impact and approved by the City Traffic Engineer are made to sufficiently improve the overall transportation system and/or promote non-vehicular transportation as part of a development project or City-initiated project.
Policy MT-1-p: Participate in Sustainable Communities Strategy/ Regional Transportation Plan. Continue to work with the Fresno Council of Governments in developing and updating the Sustainable Communities Strategy and Regional Transportation Plan, consistent with the goals, objectives and policies of the General Plan.
Objective MT‐4: Establish and maintain a continuous, safe, and easily accessible bikeways system throughout the metropolitan area to reduce vehicle use, improve air quality and the quality of life, and provide public health benefits.
Policy MT-4-a: Active Transportation Plan. To the extent consistent with this General Plan, continue to implement and periodically update the Active Transportation Plan to meet State standards and requirements for recommended improvements and funding proposals as determined appropriate and feasible.
Policy MT-4-b: Bikeway Improvements. Establish and implement property development standards to assure that projects adjacent to designated bikeways provide adequate right-of-way and that necessary improvements are constructed to implement the planned bikeway system shown on Figure MT-2 to provide for bikeways, to the extent feasible, when existing roadways are reconstructed; and alternative bikeway alignments or routes where inadequate right-of-way is available.
Policy MT-4-c: Bikeway Linkages. Provide linkages between bikeways, trails and paths, and other regional networks such as the San Joaquin River Trail and adjacent jurisdiction bicycle systems wherever possible.
Policy MT-4-d: Prioritization of Bikeway Improvements. Prioritize bikeway components that link existing separated sections of the system, or that are likely to serve the highest concentration of existing or potential cyclists, particularly in those neighborhoods with low vehicle ownership rates, or that are likely to serve destination areas with the highest demand such as schools, shopping areas, recreational and park areas, and employment centers.
Policy MT-4-e: Minimum Bike Lane Widths. Provide not less than 10 feet of street width (five feet for each travel direction) to implement bike lanes for designated Class II bikeways along roadways. Strive for 14 feet of street width (seven feet for each travel direction) for curbside bike lanes where right-of-way is available.
Policy MT-4-f: Bike Detection Devices. Include bicycle detection devices when new intersection traffic control signals are installed and strive to retrofit existing traffic control signals to provide bicycle detection and retiming of signal phases to make them more bicycle friendly.

G E N E R A L P L A N F R E S N O , C A L I F O R N I A
R E C I R C U L A T E D P R O G R A M E N V I R O N M E N T A L I M P A C T R E P O R T P U B L I C R E V I E W D R A F T
M A R C H 2 0 2 1
4.3-40
Policy MT-4-g: Advocacy for Bike Accommodation. Advocate for the accommodation of bike facilities in new or upgraded State Route interchanges and railroad construction projects, and construction of bicycle crossings of freeways and railroads.
Policy MT-4-h: Bicycle Parking Facilities. Promote the installation of bicycle locking racks and bicycle parking facilities at public buildings, transit facilities, public and private parking lots, and recreational facilities. Establish standards for bicycle parking in the Development Code.
Policy MT-4-i: Bicycling and Public Transportation. Promote the integration of bicycling with other forms of transportation, including public transit. Continue to provide bike racks or space for bicycles on FAX buses.
Policy MT-4-j: Street Maintenance for Bicycle Safety. Provide regular sweeping and other necessary maintenance to clear bikeways of dirt, glass, gravel, and other debris and maintain the integrity of the bicycling network.
Policy MT-4-k: Bicycle Safety, Awareness, and Education. Promote bicycle ridership by providing secure bicycle facilities, promoting traffic safety awareness for both bicyclists and motorists, promoting the air quality benefits, promoting non-renewable energy savings, and promoting the public health benefits of physical activity.
Objective MT‐5: Establish a well-integrated network of pedestrian facilities to accommodate safe, convenient, practical, and inviting travel by walking, including for those with physical mobility and vision impairments.
Policy MT-5-a: Sidewalk Development. Pursue funding and implement standards for development of sidewalks on public streets, with priority given to meeting the needs of persons with physical and vision limitations; providing safe routes to school; completing pedestrian improvements in established neighborhoods with lower vehicle ownership rates; or providing pedestrian access to public transportation routes.
Policy MT-5-b: Sidewalk Requirements. Assure adequate access for pedestrians and people with disabilities in new residential developments per adopted City policies, consistent with the California Building Code and the Americans with Disabilities Act.
Policy MT-5-c: New Subdivision Design. Do not approve new single-family residential subdivisions with lots that front and access onto a major roadway, unless the City Traffic Engineer determines that no other feasible alternative means of vehicle access can be provided and that sufficient design measures can be implemented, such as an on-site driveway turnaround, landscaped buffering, or an on-street parking lane to assure a desirable and enduring residential environment.
Commentary: To make this determination, the City Traffic Engineer may require an evaluation of alternative means of access, including frontage roads, backup treatment, and substantial redesign of the subdivision proposal.

R E C I R C U L A T E D P R O G R A M E N V I R O N M E N T A L I M P A C T R E P O R T P U B L I C R E V I E W D R A F T M A R C H 2 0 2 1
G E N E R A L P L A N F R E S N O , C A L I F O R N I A
4.3-41
Policy MT-5-d: Pedestrian Safety. Minimize vehicular and pedestrian conflicts on both major and non-roadways through implementation of traffic access design and control standards addressing street intersections, median island openings and access driveways to facilitate accessibility while reducing congestion and increasing safety. Increase safety and accessibility for pedestrians with vision disabilities through the installation of Accessible Pedestrian Signals at signalized intersections.
Policy MT-5-e: Traffic Management in Established Neighborhoods. Establish acceptable design and improvement standards and provide traffic planning assistance to established neighborhoods to identify practical traffic management and calming methods to enhance the pedestrian environment with costs equitably assigned to properties receiving the benefits or generating excessive vehicle traffic.
Policy MT-5-f: Modifications to Street Standards. Continue to evaluate and adopt modifications to City street standards to achieve overall objectives of providing good access and travel opportunities while calming traffic, promoting pedestrian and other transportation options, and reducing the amount of land devoted to streets.
Objective MT‐6: Establish a network of multi-purpose pedestrian and bicycle paths, as well as limited access trails, to link residential areas to local and regional open spaces and recreation areas and urban Activity Centers in order to enhance Fresno's recreational amenities and alternative transportation options.
Policy MT-6-a: Link Residences to Destinations. Design a pedestrian and bicycle path network that links residential areas with Activity Centers, such as parks and recreational facilities, educational institutions, employment centers, cultural sites, and other focal points of the city environment.
Policy MT-6-b: Multi-Agency Planning for Paths and Trail System. Continue to participate in multi-agency planning and implementation partnerships for the coordinated development of the Fresno-Clovis Metropolitan Area planned path and trail system and with Madera County for the San Joaquin River Parkway trail system.
Policy MT-6-c: Link Paths and Trails and Recreational Facilities. Strive to provide path or trail connections to recreational facilities, including parks and community centers where appropriate, and give priority to pathway improvements within neighborhoods characterized by lower vehicle ownership rates and lower per capita rates of parks and public open space.
Policy MT-6-d: Link Paths and Trails and Cultural Resources. Strive to designate and implement paths and trails to pass by environmental amenities, historic sites, and other cultural resources, where appropriate, and provide informational signage or other interpretation of those resources to the public.
Policy MT-6-e: Utilize Public Rights of Way. Pursue the attainment of path and trail corridors within abandoned railroad rights-of-way, canal alignments, PG&E transmission

G E N E R A L P L A N F R E S N O , C A L I F O R N I A
R E C I R C U L A T E D P R O G R A M E N V I R O N M E N T A L I M P A C T R E P O R T P U B L I C R E V I E W D R A F T
M A R C H 2 0 2 1
4.3-42
tower easements, limited access streets (Expressways, freeways), riverbottom/bluff areas, or other such rights-of-ways. Offer existing easements and rights-of-way to local agencies before selling them to private parties.
Policy MT-6-f: Path and Trail Designation Process. Develop a network of multi-purpose path and trail corridors by using the Official Plan Line process or other processes as provided by the Development Code to obtain appropriate linear rights-of-way along riparian corridors, drainage and irrigation easements, utility easements, abandoned railroad rights-of-way, and major street corridors.
Policy MT-6-g: Path and Trail Development. Require all projects to incorporate planned multi-purpose path and trail development standards and corridor linkages consistent with the General Plan, applicable law and case-by-case determinations as a condition of project approval.
Commentary: This should be done pursuant to Figure MT-2: Paths and Trails, and the adopted ATP, as may amended.
Policy MT-6-h: Preference for Public Ownership. Avoid path and trail alignments that involve private ownership of sections of public path or trail right-of-way. Use the Director Determination process, if necessary, to adjust planned path or trail rights-of-way to avoid these situations by realigning along more visible, publicly owned routes.
Policy MT-6-i: Path and Trail Design Standards. Designate and design paths and trails in accordance with design standards established by the City that give consideration to all path and trail users (consistent with design, terrain and habitat limitations) and provide for appropriate widths, surfacing, drainage, design speed, barriers, fences, signage, visibility, intersections, bridges, and street cleaning.
Commentary: Trail improvements and characteristics (e.g. accessibility, continuity, width and location, and surface treatment) within the Fancher Creek water conveyance and riparian corridor, and other alignments immediately adjacent to existing or planned residential land, will be determined by the City Council after providing for appropriate public participation.
Policy MT-6-j: Variety in Path and Trail Design. Provide for different levels and types of usable pedestrian and bicycle corridors, including broad, shaded sidewalks; jogging paths; paved and all terrain bicycle paths; through-block passageways; and hiking trails. Where a designated multi-purpose path route is adjacent to a public right-of-way which accommodates bike lane, allow for flexibility in path design, so that bike lanes may be substituted for the bicycle component of the multi-purpose path where it is safe and appropriate to do so.
Commentary: This should be done pursuant to Figure MT-2: Paths and Trails, and the adopted ATP, as amended.

R E C I R C U L A T E D P R O G R A M E N V I R O N M E N T A L I M P A C T R E P O R T P U B L I C R E V I E W D R A F T M A R C H 2 0 2 1
G E N E R A L P L A N F R E S N O , C A L I F O R N I A
4.3-43
Policy MT-6-k: Path and Trail Buffers. Use landscaping with appropriate and adequate physical and visual barriers (e.g., masonry walls, wrought-iron, or square-tube fencing) to screen path and trail rights-of ways and separate paths and trails from mining operations, drainage facilities, and similar locations as warranted.
Policy MT-6-l: Environmentally Sensitive Path and Trail Design. Develop paths and trails with minimum environmental impact by taking the following actions:
• Surface paths and trails with materials that are conducive to maintenance and safe travel, choosing materials that blend in with the surrounding area;
• Design paths and trails to follow contour lines where the least amount of grading (fewest cuts and fills) and least disturbance of the surrounding habitat will occur;
• Beautify path and trail rights-of-way in a manner consistent with intended use, safety, and maintenance;
• Use landscaping to stabilize slopes, create physical or visual barriers, and provide shaded areas; and
• Preserve and incorporate native plant species into the landscaping.
Policy MT-6-m: Path and Trail Crossings. Limit vehicle access, to the extent feasible, where paths or trails are designated parallel and adjacent to roadways, with consideration given to other transportation, land use, and site design priorities and constraints.
Policy MT-6-n: Emergency Vehicle Access along Paths and Trails. Provide points of emergency vehicle access within the path and trail corridors, via parking areas, service roads, emergency access gates in fencing, and firebreaks.
Commentary: Service roads will be interconnected, where possible, to permit through travel by emergency vehicles.
Objective MT‐8: Provide public transit options that serve existing and future concentrations of residences, employment, recreation and civic uses and are feasible, efficient, safe, and minimize environmental impacts.
Commentary: Public transit services must meet accessibility standards for individuals with disabilities as required by applicable state and federal regulations.
Policy MT-8-a: Street Design Coordinated with Transit. Coordinate the planning, design, and construction of the major roadway network with transit operators to facilitate efficient direct transit routing throughout the Planning Area.

G E N E R A L P L A N F R E S N O , C A L I F O R N I A
R E C I R C U L A T E D P R O G R A M E N V I R O N M E N T A L I M P A C T R E P O R T P U B L I C R E V I E W D R A F T
M A R C H 2 0 2 1
4.3-44
Commentary: Neighborhoods with circuitous and discontinuous streets are more difficult for public transit to serve efficiently than those with consistently spaced linear or semi-grid patterns.
Policy MT-8-b: Transit Serving Residential and Employment Nodes. Identify the location of current and future residential and employment concentrations and Activity Centers throughout the transit service area in order to facilitate planning and implementation of optimal transit services for these uses. Work with California State University, Fresno to determine locations within the campus core for bus stops.
Policy MT-8-c: New Development Facilitating Transit. Continue to review development proposals in transportation corridors to ensure they are designed to facilitate transit. Coordinate all projects that have residential or employment densities suitable for transit services, so they are located along existing or planned transit corridors or that otherwise have the potential for transit orientation to FAX and consider FAX’s comments in decision-making.
Policy MT-8-d: Coordination of Transportation Modes. Plan, design, and implement transportation system improvements promoting coordination and continuity of transportation modes and facilities, such as shared parking or park and ride facilities at Activity Centers.
Policy MT-8-e: Regional Coordination. Continue to work with local and regional governmental institutions to promote efficient transportation policies and coordinated programs.
Policy MT-8-f: Multi-modal Downtown Transportation Facility. Support the development of a multi-modal transportation facility in Downtown.
Commentary: Additional details for the facility are anticipated to be addressed in a future community or Specific Plan, such as the proposed DNCP or FCSP.
Policy MT-8-g: High Speed Train. If the State moves forward with HST, ensure it is constructed through Fresno in a manner that minimizes impacts to surrounding property owners and creates the most opportunity for redevelopment around the HST station.
Policy MT-8-h: Move Forward with High-Speed Train Station Area Planning. Work with local residents, property and business owners, and other stakeholders to develop a station area plan to provide the most opportunity for growth and prosperity in concert with development of the Fresno HST station.
Policy MT-8-i: Legislative Support. Monitor State and federal legislation that creates incentives to reduce auto dependency and support the use of alternatives to the single occupant vehicle and support legislation that is consistent with the General Plan.

R E C I R C U L A T E D P R O G R A M E N V I R O N M E N T A L I M P A C T R E P O R T P U B L I C R E V I E W D R A F T M A R C H 2 0 2 1
G E N E R A L P L A N F R E S N O , C A L I F O R N I A
4.3-45
Policy MT-8-j: Transit Services. Emphasize expansion of transit service in low-income neighborhoods that lack appropriate service levels.
Objective MT‐9: Provide public transit opportunities to the maximum number and diversity of people practicable in balance with providing service that is high in quality, convenient, frequent, reliable, cost- effective, and financially feasible.
Policy MT-9-a: Equitable Transit Provision. Provide transit that can serve all residents, including older residents and persons with disabilities.
Policy MT-9-b: Transit Service Productivity Evaluation. Continue to evaluate transit service productivity and cost efficiency indicators in the City’s Short-Range Transit Plan, and make necessary and appropriate service adjustments when operationally and financially feasible.
Commentary: Short-range transportation planning is a federal requirement for continued funding.
Policy MT-9-c: Addressing Unmet Transit Needs. Continue to participate in the Council of Fresno County Governments’ annual unmet transit needs evaluation process, particularly with respect to identifying need for access to medical and educational services; perform market analysis to identify potential transit choice riders; and pursue public education and information programs to identify changes in demand characteristics and opportunities to increase ridership.
Policy MT-9-d: Long-Range Transit Options. Advocate and participate in regional transportation analyses and identify appropriate long-range measures to support incorporation of light rail transit and other advanced transit service within major transportation corridors, freeway and railroad alignments.
Policy MT-9-e: Area Specific Transit Improvements. Continue to evaluate and pursue the planning and implementation of area specific transit improvements, such as street car facilities.
Policy MT-9-f: Encourage Telecommuting. Support measures that will facilitate expanded use of telecommunications technologies to reduce congestion, expansion of regional transportation facilities consistent with this General Plan, energy use, and air emissions (i.e., work at home, dispersed telecommute work centers, teleconferencing).
General Plan Policy Revisions. The following General Plan policies are proposed to be revised as a part of this project. Specific text changes are shown below; double-underlined text represents language that will be added to the General Plan, and text with strikethrough represents language that will be deleted from the General Plan.
Policy MT-1-k: Multi-Modal Level of Service Standards. Develop and use a tiered system of flexible, multi-modal Level of Service standards for streets designated by the Circulation Diagram (Figure MT-1). Strive to accommodate a peak hour vehicle LOS of D or better on

G E N E R A L P L A N F R E S N O , C A L I F O R N I A
R E C I R C U L A T E D P R O G R A M E N V I R O N M E N T A L I M P A C T R E P O R T P U B L I C R E V I E W D R A F T
M A R C H 2 0 2 1
4.3-46
street segments and at intersections, except where Policies MT-1-m through MT-1-p provide greater specificity. Establish minimum acceptable service levels for other modes and use them in the development and environmental review process.
Policy MT-1-m: Standards for Planned Bus Rapid Transit Corridors and Activity Centers. Independent of the Traffic Impact Zones identified in MT-2-i and Figure MT-4, strive to maintain the following vehicle LOS standards on major roadway segments and intersections along Bus Rapid Transit Corridors and in Activity Centers:
• LOS E or better at all times, including peak travel times, unless the City Traffic Engineer determines that mitigation to maintaining this LOS would be infeasible and/or conflict with the achievement of other General Plan policies.
• Accept LOS F conditions in Activity Centers and Bus Rapid Transit Corridors only if provisions are made to improve the overall system and/or promote non-vehicular transportation and transit as part of a development project or a City-initiated project. In accepting LOS F conditions, the City Traffic Engineer may request limited analyses of operational issues at locations near Activity Centers and along Bus Rapid Transit Corridors, such as queuing or left-turn movements.
• Give priority to maintaining pedestrian service first, followed by transit service and then by vehicle LOS, where conflicts between objectives for service capacity between different transportation modes occur.
• Identify pedestrian-priority and transit-priority streets where these modes would have priority in order to apply a multi-modal priority system, as part of the General Plan implementation.
Policy MT-1-n: Peak Hour Vehicle LOS. For planning purposes and implementation of Capital Improvement Projects, Maintain a peak-hour vehicle LOS standard of D or better for all roadway areas outside of identified Activity Center and Bus Rapid Transit Corridor districts, unless the City Traffic Engineer determines that mitigation to maintaining this LOS would be infeasible and/or conflict with the achievement of other General Plan policies.
4.3.6 Significance Criteria
The thresholds for impacts to air quality used in this analysis are consistent with Appendix G of the State CEQA Guidelines. The continued implementation of the approved General Plan would result in a significant impact related to air quality if it would:
AIR-1 Conflict with or obstruct implementation of the applicable air quality plan;
AIR-2 Result in a cumulatively considerable net increase of any criteria pollutant for which the project region is non-attainment under an applicable federal or State ambient air quality standard;

R E C I R C U L A T E D P R O G R A M E N V I R O N M E N T A L I M P A C T R E P O R T P U B L I C R E V I E W D R A F T M A R C H 2 0 2 1
G E N E R A L P L A N F R E S N O , C A L I F O R N I A
4.3-47
AIR-3 Expose sensitive receptors to substantial pollutant concentrations;
AIR-4 Result in other emissions (such as those leading to odors) adversely affecting a substantial number of people.
The SJVAPCD is the applicable air pollution control district for the SJVAB, which includes the city of Fresno. The SJVAPCD has adopted thresholds of significance in its GAMAQI that are used where appropriate in the following analysis. While the final determination of whether a project is significant is within the purview of the Lead Agency pursuant to Section 15064(b) of the CEQA Guidelines, SJVAPCD recommends that its quantitative air pollution thresholds be used to determine the significance of project emissions. If the City as Lead Agency finds that the project has the potential to exceed these air pollution thresholds, the project will be considered to have significant air quality impacts.
4.3.7 Impacts and Mitigation Measures
The following section presents a discussion of the impacts related to air quality that could result from continued implementation of the approved General Plan. The section begins with the criteria of significance, which establish the thresholds to determine if an impact is significant. The latter part of this section presents the impacts associated with continued implementation of the approved General Plan and the recommended mitigation measures, if required. Mitigation measures are recommended, as appropriate, for significant impacts to eliminate or reduce them to a less-than-significant level. Cumulative impacts are also addressed.
4.3.7.1 Project Impacts
The following discussion describes the potential impacts related to air quality that could result from the continued implementation of the approved General Plan.
AIR‐1 The proposed project would not conflict with or obstruct implementation of the applicable air quality plan.
The project was assessed to determine if the impacts from continued implementation of the approved General Plan would conflict with or obstruct the implementation of the applicable attainment plans, including SJVACPD attainment plans and the South Central Fresno CERP.
SJVAPCD Attainment Plans. As defined above, the project is the buildout of the Project Area. Buildout is predicted to occur at growth rates consistent with those used by the SJVAPCD to develop plans for all nonattainment pollutants in the SJVAB. The General Plan growth rate would result in buildout by the year 2056.
As discussed in Section 4.3.5.3, the SJVAPCD is responsible for formulating and implementing the AQMP for the Basin. The main purpose of an AQMP is to bring the area into compliance with federal and State air quality standards. The SJVAPCD does not have one single AQMP for criteria pollutants, rather the SJVAPCD address each criteria pollutant with its own Plan. The SJVAPCD has the following AQMPs: 2018 Plan for the 1997, 2006, and 2012 PM2.5 Standards; 2016 Moderate Area Plan for the 2012 PM2.5 Standard; 2016 Plan for the 2008 8-Hour Ozone Standard; 2013 Plan for the Revoked 1-

G E N E R A L P L A N F R E S N O , C A L I F O R N I A
R E C I R C U L A T E D P R O G R A M E N V I R O N M E N T A L I M P A C T R E P O R T P U B L I C R E V I E W D R A F T
M A R C H 2 0 2 1
4.3-48
Hour Ozone Standard; 2007 PM10 Maintenance Plan; and 2004 Revision to the California State Implementation Plan for Carbon Monoxide. In order to determine the approved General Plan’s consistency with these AQMPs, this the assessment usesd two tests to determine if the project conflicts or obstructs the applicable air quality plans. First, if development proposed by the approved General Plan exceeds the growth projections used in the applicable attainment plan, it would produce a potentially significant impact. Second, if the project includes goals, policies, and development standards that are in conflict with the development related control measures in the attainment plans, the project would be potentially significant. Under these tests, the project would not have a significant impact.
For a project to be consistent with the attainment plans, the pollutants emitted from project operation should not exceed the SJVAPCD daily threshold or cause a significant impact on air quality, or the project must already have been included in the attainment plans projection. The growth projections used for the approved General Plan assume that growth in population, vehicle use and other source categories will occur at historically robust rates that are consistent with the rates used to develop the SJVAPCD’s attainment plans. In other words, the amount of growth predicted for the approved General Plan is accommodated by the SJVAPCD’s attainment plan and would allow the air basin to attain the 8‐hour ozone standard by the 2023 attainment date. In addition, reductions anticipated from existing regulations and adopted control measures will result in emissions continuing to decline even though development and population will increase. Furthermore, continued implementation of the approved General Plan would allow for implementation of the City’s sustainability efforts that reduce motor vehicle use and energy consumption. This is accomplished with more compact development achieved by increasing development density and by providing a land use pattern and transportation infrastructure more supportive of public transportation, walking, and bicycling. Therefore, continued implementation of the approved General Plan would support the implementation of SJVAPCD’s attainment plans and would meet this criterion.
Review of the goals and policies of the approved General Plan found them to be consistent with the applicable control measures of the SJVAPCD attainment plan. The approved General Plan includes numerous policies that would reduce operational air pollutant emissions and increase energy efficiency. The applicable goals and policies are listed in the previous section. The City also participates in regional planning efforts such as the San Joaquin Valley Blueprint Project and works closely with Fresno COG in developing Regional Transportation Plans and capital improvement plans and capital improvement plans (see Policy MT‐1‐p). These efforts contribute to the attainment strategy for the SJVAB.
The SJVAPCD has adopted rules and regulations specifically designed to reduce the impacts of growth on the applicable air quality plans. For example, Rule 9510, Indirect Source Review, was adopted to provide emission reductions needed by the SJVAPCD to demonstrate attainment of the federal PM10 standard and contribute to reductions that assist in attaining federal ozone standards. Rule 9510 also contributes toward attainment of State standards for these pollutants. The SJVAPCD’s Regulation VIII, Fugitive PM10 Prohibitions, requires controls for sources of particulate matter necessary for attaining the federal PM10 standards and achieving progress toward attaining the State PM10 standards. Rule 2201, New and Modified Stationary Source Review, requires new and

R E C I R C U L A T E D P R O G R A M E N V I R O N M E N T A L I M P A C T R E P O R T P U B L I C R E V I E W D R A F T M A R C H 2 0 2 1
G E N E R A L P L A N F R E S N O , C A L I F O R N I A
4.3-49
modified stationary/industrial sources to provide emission controls and offsets that ensure that stationary sources decline over time and do not impact the applicable air quality plans. Development associated with continued implementation of the approved General Plan would comply with these rules and regulations providing additional support for the conclusion that it would not interfere or obstruct with the application of the attainment plans. Therefore, the project would be consistent with the SJVAPCD air quality attainment plans and would result in a less than significant impact. No mitigation would be required.
South Central Fresno CERP. As described above, South Central Fresno is geographically bounded by McKinley Avenue to the north, Chestnut Avenue to the east, American Avenue to the south, and Nielsen Avenue, Brawley Avenue, SR-41, and American Avenue to the west. The sources that affect South Central Fresno include freight operations, industry, and freeways.
Fresno’s CERP was adopted by CARB on September 19, 2019, and is now in the implementation phase. The CERP includes a technical analysis describing the sources of pollution impacting the community, as well as the location of sensitive receptors within the community. Sources of pollution that are of particular concern to South Central Fresno are highlighted, and possible strategies for reducing pollution impacts from these sources are evaluated. The strategies that were ultimately selected for implementation in the community are outlined in the CERP, including incentive funding measures, public engagement strategies, enforcement strategies, regulatory strategies, and strategies that will be completed in partnership with other agencies and local organizations. In addition, the CERP includes an implementation schedule and metrics for tracking emission reductions in annual reporting and at the five-year milestone.
The CERP is designed to focus on reducing individual criteria air pollutant and TAC emissions in South Central Fresno and identifies strategies to reduce the cumulative exposure burden in South Central Fresno. The CERP strategies relate to heavy duty trucks, high polluting and idling cars, residential wood burning, land use/industrial development, illegal burning, and industrial processes. The approved General Plan’s consistency with these measures is discussed below.
Heavy Duty Mobile Sources Measures. The heavy duty mobile source measures include the following incentive programs: provide enhanced incentive funding for zero and near-zero emission technology; deployment of zero emission yard trucks and truck refrigeration units (TRUs); measures to reduce idling: charging plugs for trucks; support planning and development of clean fueling infrastructure: alternative fuel fueling station; enhance outreach and access to incentive funding for new school buses; incentives for locomotives; incentives for railcar movers/switchers. All of these measures are the responsibility of the SJVAPCD and CARB to implement and the continued implementation of the approved General Plan, text changes to the Mobility and Transportation Element, and the updates to the Greenhouse Gas Reduction Plan would not conflict with these incentive programs and measures.
Older/High Polluting Passenger Cars Measures. The older/high polluting passenger cars measures include incentives intended to increase the deployment of electric vehicles through the replacement of gas-powered vehicles currently in use; providing additional charging infrastructure throughout the community; providing for electric vehicle maintenance training to increase available repair facilities and job skills in the community; and repairing high polluting
G E N E R A L P L A N F R E S N O , C A L I F O R N I A
R E C I R C U L A T E D P R O G R A M E N V I R O N M E N T A L I M P A C T R E P O R T P U B L I C R E V I E W D R A F T
M A R C H 2 0 2 1
4.3-50
passenger vehicles. The City supports increased EVs within the city by encouraging the installation of EV chargers within new and existing multi-family residential and commercial parking areas within the city. The City is launching an EV charging pilot program, designed to assist the State with their goals to increase the number of EVs in California and improve the air quality in our communities. The 87 Level 2 EV Chargers locations are currently being installed and almost ready for use throughout the city. The majority of the costs to purchase and install the chargers are covered by grants and incentives from the SJVAPCD, and the California Electric Vehicle Implementation Program (CAL-EVIP). The grants and incentives obtained by the City were also targeted for disadvantaged communities. A significant number of the EV Chargers will be installed in areas that are currently underserved with EV infrastructure. The EV Chargers will be available for both public use and for City vehicles to allow for optimal usage. The continued implementation of the approved General Plan, text changes to the Mobility and Transportation Element, and the updates to the Greenhouse Gas Reduction Plan would not conflict with these incentives and measures.
Residential Burning Measures. The SJVAPCD is committed to reducing emissions from residential burning. Building upon the SJVACPD’s wood burning reduction strategy, the residential burning measures in the CERP provide enhanced incentives to replace wood burning devices, increased efforts to educate public about harmful impacts of wood smoke, enhanced enforcement of wood burning curtailments, focused outreach to reduce illegal activity, and enhanced enforcement to reduce illegal burning of residential waste. All of these measures are the responsibility of the SJVAPCD and CARB to implement and the continued implementation of the approved General Plan, text changes to the Mobility and Transportation Element, and the updates to the Greenhouse Gas Reduction Plan would not conflict with these measures.
Agricultural Operations Measures. Due to the proximity of the South Central Fresno community to areas that are currently used for agricultural operations, but that are zoned for future industrial development under the approved General Plan, members of the South Central Fresno Steering Committee expressed concerns about the impacts of emissions from removing orchards and vineyards and disposing of the resulting agricultural biomass. To address these concerns and help to reduce agricultural burning in the area, the agricultural operations measures include an incentive program for deploying on-field alternatives to the open burning of agricultural materials, such as chipping/soil incorporation. This measure would be the responsibility of the SJVAPCD and CARB to implement and the continued implementation of the approved General Plan, text changes to the Mobility and Transportation Element, and the updates to the Greenhouse Gas Reduction Plan would not conflict with this measure.
Industrial Source Measures. Industrial source measures include incentives, with regulatory requirements, to plating operations to further reduce chrome emissions, enhanced stationary source inspection frequency, pilot training program for conducting self-inspections at gas stations, explore potential incentives to install advanced control technology to achieve emission reductions beyond regulatory requirements (BACT and BARCT), and the following regulatory actions: evaluation of BARCT requirements for rules that apply to cap-and-trade facilities; evaluation of rules to determine whether additional reductions are possible for sources of NOx and PM2.5; and expedited facility risk assessment and risk reduction under district

R E C I R C U L A T E D P R O G R A M E N V I R O N M E N T A L I M P A C T R E P O R T P U B L I C R E V I E W D R A F T M A R C H 2 0 2 1
G E N E R A L P L A N F R E S N O , C A L I F O R N I A
4.3-51
implementation of the Air Toxics “Hot Spots” Information and Assessment Act (AB 2588). All of these measures are the responsibility of the SJVAPCD and CARB to implement and the continued implementation of the approved General Plan, text changes to the Mobility and Transportation Element, and the updates to the Greenhouse Gas Reduction Plan would not conflict with these incentives and measures.
Emissions Exposure and Land Use Measures. Measures to reduce land use and urban sources and exposure reduction include incentives to install solar panels, incentives to reduce PM from commercial underfired charbroilers, incentives for replacement of residential lawn and garden equipment, enhanced outreach and access to incentive funding for commercial lawn and garden equipment, enhanced outreach and access to incentive funding for public fleet vehicles, incentive programs to install advanced air filtration systems in community schools, reducing children’s exposure through increased enrollment in the Healthy Air Living Schools program, incentive programs for weatherization and energy efficiency, automobile idle-reduction outreach, and community outreach to increase community awareness and knowledge of air quality. All of these measures are the responsibility of the SJVAPCD to implement and the continued implementation of the approved General Plan, text changes to the Mobility and Transportation Element, and the updates to the Greenhouse Gas Reduction Plan would not conflict with these measures.
Additional emissions exposure and land use measures include supporting projects that reduce VMT, providing assistance during the CEQA process, providing education and outreach on available tools for public information regarding land use projects, collaborating to enhance community participation in land use processes, enhanced enforcement of SJVAPCD Regulation VIII (Fugitive Dust Prohibitions), street sweeping, road paving improvements, increased urban greening and forestry to improve air quality, and installation of vegetative barriers around/near sources of concern. The continued implementation of the approved General Plan, text changes to the Mobility and Transportation Element, and the updates to the Greenhouse Gas Reduction Plan would be consistent with these measures as the continued implementation of the approved General Plan aims to promote mixed-use development and encourage alternative modes of transportation to reduce vehicle trip lengths and reliance on the automobile. As a result, transportation energy demand in the Planning Area would be reduced. Continued implementation of the approved General Plan, text changes to the Mobility and Transportation Element, and the updates to the Greenhouse Gas Reduction Plan also encourages development of housing near employment and transportation, which would lead to a potential decrease in VMT. Continued implementation of the approved General Plan would also promote land use patterns that would improve walking and bicycling facilities to be more prominent, comfortable, and safe throughout the city. In addition, the continued implementation of the approved General Plan would support the development of a network of integrated charging and alternate fuel station for both public and private vehicles, and if feasible, open up municipal stations to the public as part of network development (Policy RC-8-j) that would also serve to reduce the overall transportation energy demand. As listed in Section 4.2.7.1 above, the approved General Plan includes policies with provisions for reducing exposure of sensitive receptors to TAC emissions including: UF-12-d, LU-6-f, MT-1-d, MT-1-j, and MT-5-c. Further, individual projects to be developed under the approved General Plan would be required to undergo CEQA review and

G E N E R A L P L A N F R E S N O , C A L I F O R N I A
R E C I R C U L A T E D P R O G R A M E N V I R O N M E N T A L I M P A C T R E P O R T P U B L I C R E V I E W D R A F T
M A R C H 2 0 2 1
4.3-52
would be subject to District Rules and Regulations, including Regulation VIII (Fugitive Dust Prohibitions).
Summary. As discussed above, although most of the measures are the responsibility of the SJVAPCD and CARB to implement, the proposed project would generally implement the applicable measures outlined in the CERP, including emissions exposure and land use measures. Therefore, continued implementation of the approved General Plan, text changes to the Mobility and Transportation Element, and the updates to the Greenhouse Gas Reduction Plan would not conflict with or hinder implementation of the CERP.
Applicable Laws, Regulations, Relevant Land Use Policies
• Refer to the approved General Plan policies and objectives identified in Section 4.3.5.4, Local Policies and Regulations, above.
Level of Significance Without Mitigation: Less Than Significant Impact.
AIR‐2 The proposed project would result in a cumulatively considerable net increase of criteria pollutants for which the project region is non‐attainment under an applicable federal or State ambient air quality standard.
The SJVAPCD has adopted project level quantitative thresholds for ozone precursors reactive organic gases ROG and NOx of 10 tons per year and recommends quantitative thresholds for PM10
and PM2.5 of 15 tons per year. Although these thresholds are intended for use on individual development projects, no other quantitative plan level threshold has been adopted. Continued implementation of the approved General Plan would provide for the development of numerous individual development projects that would be subject to the project level thresholds at the time they are proposed. Large individual projects are likely to exceed the thresholds during project construction and operation.
Continued implementation of the approved General Plan reflects the cumulative projects anticipated for the Ccity from the present until buildout. A more appropriate metric for cumulative contribution at the plan level is whether the cumulative impact of development predicted by the continued implementation of the approved General Plan would conflict with plans adopted to achieve the applicable standards. A conflict would result when emission levels exceed the amounts required for attainment by the years mandated by State and federal regulations. After the attainment year, the emissions inventory must stay below the attainment inventory even with continued growth in order to maintain the standard. Once standards are achieved, no significant impact to health would occur as long as standards are maintained. As described in Impact AIR-1 above, the project would not conflict with the implementation of the SJVACD’s air quality attainment plans.
The project area is designated nonattainment for ozone, PM10, and PM2.5. Ozone is not directly emitted but is formed in the atmosphere by ozone precursors (ROG and NO2). In addition, PM10 and PM2.5 are emitted directly and also form in the atmosphere as a secondary pollutant from emissions of NO2 and ammonia. Ammonia is not a criteria pollutant and the SJVAPCD PM control strategy is

R E C I R C U L A T E D P R O G R A M E N V I R O N M E N T A L I M P A C T R E P O R T P U B L I C R E V I E W D R A F T M A R C H 2 0 2 1
G E N E R A L P L A N F R E S N O , C A L I F O R N I A
4.3-53
based primarily on NO2 controls and reductions of directly emitted PM10 and PM2.5. Therefore, this section addresses the cumulative emissions of the pollutants ROG, NOx, PM10, and PM2.5.
Development of the approved General Plan would result in air pollutant emissions from short-term construction activities and long-term project operation described below.
Construction. Construction activity from continued implementation of the approved General Plan would cause temporary, short-term emissions of various air pollutants within the Planning Area. ROG and NOx (ozone precursors), PM10, and PM2.5 would be emitted by construction equipment during various activities, which may include but are not limited to grading, excavation, building construction, or demolition. Soil disturbance during construction activities emit fugitive dust, a fraction of which is comprised of PM10 and PM2.5.
SJVAPCD and State regulations have been created to reduce construction emissions. The CARB has adopted regulations for new off-road diesel engines and equipment that result in cleaner equipment being placed in service as older, higher emitting equipment is retired. The CARB also adopted the in-use off-road diesel vehicle regulation requiring NOx and PM10 emission reductions from equipment and vehicles currently in operation. SJVAPCD Regulation VIII includes requirements to control fugitive dust emissions during construction activities and requires commercial projects over 5 acres and residential projects over 10 acres to file a Dust Control Plan. The GAMAQI states that compliance with Regulation VIII will normally reduce impacts from fugitive dust to less than significant. Rule 9510 – Indirect Source Review requires projects to reduce exhaust related construction emissions by 20 percent for NOx and by 50 percent for PM10; however, significance for these emissions is based on whether projects exceed the SJVAPCD annual quantitative thresholds.
The SJVAPCD indicates that the control measures in Regulation VIII are required by regulation for all construction sites to reduce fugitive dust emissions. The GAMAQI lists additional measures that may be required because of sheer project size or proximity of the project to sensitive receptors. The additional measures are referred to as “enhanced control measures” in the GAMAQI. These enhanced control measures have been added as amendments to Regulation VIII, so they are no longer considered mitigation measures that could be imposed on very large or sensitive projects, but standard control measures required for rule compliance. As stated above, each commercial project over 5 acres in size and residential project over 10 acres in size is required to submit a Dust Control Plan to the SJVAPCD for approval and requires control measures adequate to prevent significant fugitive dust impacts. If measures included in the Dust Control Plan prove inadequate to control fugitive dust, construction contractors must implement additional controls or cease dust generating construction activities. In addition, projects smaller than the Dust Control Plan size thresholds must still comply with most other Regulation VIII requirements. Therefore, fugitive dust impacts from construction activities are considered less than significant.
The buildout associated with the continued implementation of the approved General Plan would result in potentially hundreds of individual development projects. Information regarding specific development projects, soil conditions, and the location of sensitive receptors in relation to the various projects would be needed in order to determine localized impacts associated with construction activity. However, overall estimates based on annual rates of construction activity required to reach buildout provides a reasonable method for determining an annual contribution
G E N E R A L P L A N F R E S N O , C A L I F O R N I A
R E C I R C U L A T E D P R O G R A M E N V I R O N M E N T A L I M P A C T R E P O R T P U B L I C R E V I E W D R A F T
M A R C H 2 0 2 1
4.3-54
rate for construction emissions. Emissions from construction activities are expected to decline over time as new cleaner equipment replaces older higher emitting equipment. However, on a cumulative basis, construction emissions would continue to exceed SJVAPCD annual thresholds even with the regulatory reductions.
Emissions related to projected construction activities are included in emission forecasts used to demonstrate attainment of the applicable air quality standards and would therefore, not interfere or obstruct with SJVAPCD attainment plans. However, the combined impact of all construction projects to reach buildout is a cumulative impact that makes it more difficult to attain the air quality standards compared to a scenario where no growth takes place. Although individual projects may exceed SJVAPCD project level thresholds, using a project threshold to address the impact of hundreds of projects that would be constructed under General Plan buildout is a highly conservative measure of project level significance for an impact that is cumulative in nature.
Rule 9510 – Indirect Source Review requires reductions of construction emissions in order to mitigate the impacts of growth. The rule requires NOx reductions of 20 percent and PM10 reductions of 45 percent compared to the statewide average by using clean construction equipment at the project site or paying mitigation fees to the SJVAPCD to obtain off-site reductions. Rule 9510 serves to mitigate both project level and cumulative effects of construction on ozone and particulate matter emissions. Individual projects that exceed project level significance thresholds after accounting for Rule 9510 reductions would be required to implement additional mitigation measures to reduce significant emissions or the City would be required to prepare an EIR and adopt a statement of overriding considerations.
CARB off-road equipment regulations would result in reductions in NOx and PM emissions as new equipment meeting current and future standards replaces older higher emitting equipment. The regulations provide substantial reductions near term and midterm. CARB also requires retrofits of existing equipment to reduce particulate emissions that will help reduce emissions from older equipment. Regulations are normally implemented over a 5 to 10-year period at which time a new round of regulations are proposed if still needed to attain the air quality standards. The CARB has a long history of tightening regulations as technology advances increase the feasibility of additional controls. Large individual projects that exceed the SJVAPCD project thresholds will be required to include feasible mitigation measures that reduce the significant impact. The measures could include additional onsite controls or off-site mitigation fees that reduce emissions to less than significant levels.
When project construction emissions are viewed in relation to the applicable air quality plans adopted by the SJVAPCD, the emissions would not result in a significant cumulative contribution since the emissions would not interfere with attainment of air quality standards. However, estimated annual project construction emissions exceed project level thresholds by a substantial margin for all pollutants. Therefore, construction emissions are considered potentially significant.
Operation. Long-term air pollutant emission impacts are those associated with mobile sources (e.g., vehicle trips), energy sources (e.g., electricity and natural gas), and area sources (e.g., architectural coatings and the use of landscape maintenance equipment.

R E C I R C U L A T E D P R O G R A M E N V I R O N M E N T A L I M P A C T R E P O R T P U B L I C R E V I E W D R A F T M A R C H 2 0 2 1
G E N E R A L P L A N F R E S N O , C A L I F O R N I A
4.3-55
PM10 emissions result from running exhaust, tire and brake wear, and the entrainment of dust into the atmosphere from vehicles traveling on paved roadways. Entrainment of PM10 occurs when vehicle tires pulverize small rocks and pavement and the vehicle wakes generate airborne dust. The contribution of tire and brake wear is small compared to the other PM emission processes. Gasoline-powered engines have small rates of particulate matter emissions compared with diesel-powered vehicles.
Energy source emissions result from activities in buildings for which electricity and natural gas are used. The quantity of emissions is the product of usage intensity (i.e., the amount of electricity or natural gas) and the emission factor of the fuel source. Major sources of energy demand include building mechanical systems, such as heating and air conditioning, lighting, and plug-in electronics, such as refrigerators or computers. Greater building or appliance efficiency reduces the amount of energy for a given activity and thus lowers the resultant emissions. The emission factor is determined by the fuel source, with cleaner energy sources, like renewable energy, producing fewer emissions than conventional sources.
Area source emissions consist of direct sources of air emissions located at a project site, including architectural coatings and the use of landscape maintenance equipment. Area source emissions associated with the continued implementation of the approved General Plan would include emissions from the use of landscaping equipment and the use of consumer products.
The estimated annual City of Fresno air pollutant emissions associated with buildout of the General Plan are shown in Table 4.3-8. The primary emissions associated with the project are regional in nature, meaning that air pollutants are rapidly dispersed on release or, in the case of vehicle emissions associated with the project; emissions are released in other areas of the Air Basin. The annual emissions associated with project operational trip generation, energy, and area sources are identified in Table 4.3.H for ROG, NOx, PM10, and PM2.5.
As shown in Table 4.3.H, total annual emissions of ROG, NOx, PM10, and PM2.5 for all development that could occur under the approved General Plan would exceed the SJVAPCD’s project level significance thresholds; however, as previously discussed, the project level thresholds are a highly conservative measure of significance for a long-range plan. The scale of individual project level emissions that would result under the continued implementation of the approved General Plan has not been determined. Therefore, in order to present conservative assumptions, the air quality impacts associated with future operation of individual projects that may occur with implementation of the approved General Plan, when measured against annual regional thresholds, are assumed to be potentially significant. Therefore, Mitigation Measure MM AQ-2 is identified and requires the preparation of project specific technical assessments evaluating operational-related air quality impacts to further ensure that operational-related emissions are reduced to the maximum extent feasible for projects that require environmental evaluation under CEQA. Despite implementation of MM AQ-2, and in an abundance of caution, the potential regional criteria pollutant emissions impact associated with the continued implementation of the approved General Plan would remain significant and unavoidable.

G E N E R A L P L A N F R E S N O , C A L I F O R N I A
R E C I R C U L A T E D P R O G R A M E N V I R O N M E N T A L I M P A C T R E P O R T P U B L I C R E V I E W D R A F T
M A R C H 2 0 2 1
4.3-56
Table 4.3.H: City of Fresno Planning Area Annual Average Air Pollutant Emissions
Land Use Source Emissions (tons/year)
ROG NOx PM10 PM2.5
Residential
Area 21.9 1.8 0.3 0.3 Energy 0.4 3.3 0.3 0.3 Mobile 2.8 45.1 17.4 4.8 Total 25.1 50.3 18.0 5.3
Commercial/ Mixed-Use
Area 10.8 <1 0.0 0.0 Energy 0.1 1.2 0.1 0.1 Mobile 7.2 124.8 32.5 8.9 Total 18.1 126.0 32.6 9.0
Industrial
Area 5.2 0.0 0.0 0.0 Energy 0.1 1.1 0.1 0.1 Mobile 0.5 8.6 3.3 0.9 Total 5.8 9.8 3.4 1.0
Total
Area 37.8 1.8 0.3 0.3 Energy 0.6 5.7 0.4 0.4 Mobile 49.1 186.0 54.0 15.3 Total 87.5 193.5 54.7 16.0
SJVAPCD Annual Thresholds 10 10 15 15 Source: LSA (January 2020).
Table 4.3. I: City of Fresno Planning Area Daily Air Pollutant Emissions
Source Emissions (tons/day)
ROG NOx PM10 PM2.5
Area 0.1 <0.1 <0.1 <0.1 Energy <0.1 <0.1 <0.1 <0.1 Mobile 0.1 0.5 0.2 <0.1 Total 0.2 0.5 0.2 <0.1 Source: LSA (January 2020).
The State and the SJVAPCD continue to adopt additional regulations on most sources of emissions to be implemented during the approved General Plan buildout period and result in much greater reductions than is predicted with the adopted regulations included in the air quality models as of 2019 or with off-model quantification methods available pending the next model update. Expanded use of renewable fuels, zero emission vehicles, and replacing combustion sources with electrically powered alternatives will also result in reductions in criteria pollutant emissions. In addition, the approved General Plan includes policies and development patterns that will result in lower vehicle miles traveled and energy use compared to development projects constructed in the recent past that provide the basis for future emission projections. However, future development within the Planning Area would result in increases in annual emissions that exceed SJVAPCD significance thresholds for all nonattainment pollutants. Although the growth in emissions is accounted for in SJVAPCD attainment plans, this analysis identifies the impact as significant under the ton per year quantitative threshold criterion as shown in Table 4.3.H.

R E C I R C U L A T E D P R O G R A M E N V I R O N M E N T A L I M P A C T R E P O R T P U B L I C R E V I E W D R A F T M A R C H 2 0 2 1
G E N E R A L P L A N F R E S N O , C A L I F O R N I A
4.3-57
Stationary Sources. A variety of industrial and commercial processes (e.g., food processing plants, glass manufacturers, gas stations, dry cleaning) allowed under the project would also be expected to emit criteria pollutant emissions. These are referred to as stationary and stationary/area sources in this assessment. The top three stationary/area source emitters within the cCity of Fresno Planning Area are shown in Table 4.3.J.
Emissions from stationary sources are regulated at the local and regional level through SJVAPCD permitting and prohibitory rules. Under Rule 2201– New and Modified Stationary Source Review, sources emitting more than two pounds per day of any regulated pollutant are required to obtain an Authority to Construct (ATC) and Permit to Operate (PTO) from the SJVAPCD, and to implement best available control technology (BACT). Emission offsets are required for stationary sources that exceed offset thresholds contained in Rule 2201. The SJVAPCD has also adopted prohibitory rules that set emission limits and/or identify control technologies that apply to new and existing sources and further reduce emissions. The net effect of this regulatory system is continued reductions in stationary source emissions including the continued implementation of the approved General Plan. Therefore, stationary source emissions from the project are considered less than significant.
Table 4.3.J: Top Three Stationary/Area Source Emitters in City of Fresno Planning Area (2015)
Pollutant Facility (Type of Facility) Percent of Emissions (%)
ROG E&J Gallo Winery 54.3 SFPP, L.P. 11.0 MB Technology 7.7
NOx
Vitro Flatt Glass LLC 66.3 Rio Bravo Fresno 15.8 SFPP, L.P. 2.7
PM10
Rio Bravo Fresno 14.9 MB Technology 13.0 Vitro Flatt Glass LLC 9.4
Source: California Air Resources Board, CEIDARS database. Website: www.arb.ca.gov/app/emsinv/facinfo/facinfo.php.
Health Effects Summary. Known health effects related to ozone include worsening of bronchitis, asthma, and emphysema and a decrease in lung function. Particulate matter can also lead to a variety of health effects in people. These include premature death of people with heart or lung disease, heart attacks, irregular heartbeat, decreased lung function, and increased respiratory symptoms.
Although the emissions from project operations are expected to exceed the SJVAPCD’s project level thresholds, this does not in itself constitute a significant health impact to the future residents on the project site and within the SJVAB.
G E N E R A L P L A N F R E S N O , C A L I F O R N I A
R E C I R C U L A T E D P R O G R A M E N V I R O N M E N T A L I M P A C T R E P O R T P U B L I C R E V I E W D R A F T
M A R C H 2 0 2 1
4.3-58
The SJVAPCD’s project level thresholds are based in part on Section 180 (e) of the Clean Air Act. The project level thresholds are intended to provide a means of consistency in significance determination within the environmental review process.
Notwithstanding, simply exceeding the SJVAPCD’s project level thresholds does not constitute a particular health impact to an individual nearby. The reason for this is that the project level thresholds are in tons/year emitted into the air, whereas health effects are determined based on the concentration of a pollutant in the air at a particular location (e.g., ppm by volume of air or µg/m3of air). CAAQS and NAAQS were developed to protect the most susceptible population groups from adverse health effects and were established in terms of ppm or µg/m3 for the applicable emissions.
The total emissions inventory for Fresno County is shown in Table 4.3.B. As shown in Table 4.3.I above, the daily increase in emissions associated with the continued implementation of the General Plan would be a small fraction of the county’s emissions.
Therefore, the project emissions would not be expected to exceed the most stringent applicable NAAQS or CAAQS for NOX, PM2.5, and PM10. It should be noted that the AAQS are developed and represent levels at which the most susceptible persons (children and the elderly) are protected. In other words, the AAQS are purposefully set low to protect children, the elderly, and those with existing respiratory problems.
Furthermore, air quality trends for emissions of NOX, VOCs, and ozone (which is a byproduct of NOX and VOCs) have been trending downward within the SJVAB even as development has increased over the last several years. Therefore, continued implementation of the approved General Plan is not expected to result in any Basin-wide increase in health effects.
As noted in the Brief of Amicus Curiae by the SJVAPCD (2015)15, the SJVAPCD has acknowledged that currently available modeling tools are not equipped to provide a meaningful analysis of the correlation between an individual development project’s air emissions and specific human health impacts. (See page 4 of the SJVAPCD Brief of Amicus Curiae).
Additionally, the SJVAPCD acknowledges that health effects quantification from ozone, as an example, is correlated with the increases in ambient level of ozone in the air (concentration) that an individual person breathes. The SJVAPCD indicates that it would take a large amount of additional emissions to result in a modeled increase in ambient ozone levels over the entire region. As such, it is not currently possible to accurately quantify ozone-related health impacts caused by NOX or VOC emissions from relatively small projects (defined as projects with a regional scope) due to photochemistry and regional model limitations.
15 San Joaquin Valley Unified Air Pollution Control District. 2015. Amicus Curiae Brief of San Joaquin Valley
Unified Air Pollution Control District. April. Available online at: www.courts.ca.gov/documents/7-s219783-ac-san-joaquin-valley-unified-air-pollution-control-dist-041315.pdf (accessed January 2020).

R E C I R C U L A T E D P R O G R A M E N V I R O N M E N T A L I M P A C T R E P O R T P U B L I C R E V I E W D R A F T M A R C H 2 0 2 1
G E N E R A L P L A N F R E S N O , C A L I F O R N I A
4.3-59
Therefore, the project’s emissions are not sufficiently high enough to use a regional modeling program to correlate health effects on a Basin-wide level. Further, the SJVAPCD acknowledges the same:
“…the Air District is simply not equipped to analyze and to what extent the criteria pollutant emissions of an individual CEQA project directly impact human health in a particular area…even for projects with relatively high levels of emissions of criteria pollutant precursor emissions.” (See page 8 of the SJVAPCD Brief of Amicus Curiae.)
The SJVAPCD Brief of Amicus Curiae are incorporated by reference into this environmental documentation for this project.
Current scientific, technological, and modeling limitations prevent the relation of expected adverse air quality impacts to likely health consequences.
Applicable Laws, Regulations, Relevant Land Use Policies
• SJVAPCD Land Use Related Regulations. Individual projects to be developed under the proposed project would be subject to District Rules and Regulations, including Rule 9510 (Indirect Source Review) and Regulation VIII (Fugitive Dust Prohibitions), Existing businesses and new projects that are large employers (over 100 employees) will be subject to Rule 9410 (Employer Based Trip Reduction). Rule 9510 was adopted with the purpose of mitigating the impacts of growth on air quality throughout the San Joaquin Valley. Rule 9510 is by far the most stringent development related air regulation in California and the nation. Reductions from Rule 9510 are surplus, meaning they are not required to demonstrate attainment of air quality standards. Rule 9410’s purpose is to reduce emissions related to employee commute trips. These two rules provide substantial emission reductions from the approved General Plan buildout and provide assurance that the project would not result in significant air quality impacts.
• SJVAPCD Voluntary Emission Reduction Agreements (VERA). The SJVAPCD offers VERAs as a method for development projects that exceed SJVAPCD thresholds after accounting for Rule 9510 reductions to mitigate significant criteria pollutant impacts. VERAs require emission reductions in addition to those required by Rule 9510. The developers of individual projects enter into contracts with the SJVAPCD to purchase emission reductions obtained through projects funded under SJVAPCD grant and incentive programs. The SJVAPCD will also verify emission reductions from projects identified by the developer and manage the implementation and long-term monitoring of the projects. The use of a VERA may not be feasible for all projects but should be considered for large projects with significant impacts.

G E N E R A L P L A N F R E S N O , C A L I F O R N I A
R E C I R C U L A T E D P R O G R A M E N V I R O N M E N T A L I M P A C T R E P O R T P U B L I C R E V I E W D R A F T
M A R C H 2 0 2 1
4.3-60
Although the existing policies, ordinances, and regulations and the objectives and policies proposed in the approved General Plan will reduce criteria pollutant emissions, the project exceeds the SJVAPCD project level thresholds of significance for ROG, NOx, PM10, and PM2.5. Therefore, the project impact is potentially significant.
• Refer to the approved General Plan policies and objectives identified in Section 4.3.5.4, Local Policies and Regulations, above.
Level of Significance Without Mitigation: Potentially Significant Impact.
Impact AIR-2: The proposed project would result in a cumulatively considerable net increase of criteria pollutants for which the project region is non-attainment under an applicable federal or State ambient air quality standards.
Mitigation Measure AIR-2.1 Prior to future discretionary project approval, development project applicants shall prepare and submit to the Director of the City Planning and Development Department, or designee, a technical assessment evaluating potential project construction phase-related air quality impacts. The evaluation shall be prepared in conformance with SJVAPCD methodology for assessing construction impacts. If construction related air pollutants are determined to have the potential to exceed the SJVAPCD adopted threshold of significance, the Planning and Development Department shall require that applicants for new development projects incorporate mitigation measures into construction plans to reduce air pollutant emissions during construction activities. The identified measures shall be included as part of the Project Conditions of Approval. Possible mitigation measures to reduce construction emissions include but are not limited to:
• Install temporary construction power supply meters on site and use these to provide power to electric power tools whenever feasible. If temporary electric power is available on site, forbid the use of portable gasoline- or diesel-fueled electric generators.
• Use of diesel oxidation catalysts and/or catalyzed diesel particulate traps on diesel equipment, as feasible.
• Maintain equipment according to manufacturers’ specifications.
• Restrict idling of equipment and trucks to a maximum of 5 minutes (per California Air Resources Board [CARB] regulation).
• Phase grading operations to reduce disturbed areas and times of exposure.

R E C I R C U L A T E D P R O G R A M E N V I R O N M E N T A L I M P A C T R E P O R T P U B L I C R E V I E W D R A F T M A R C H 2 0 2 1
G E N E R A L P L A N F R E S N O , C A L I F O R N I A
4.3-61
• Avoid excavation and grading during wet weather.
• Limit on-site construction routes and stabilize construction entrance(s).
• Remove existing vegetation only when absolutely necessary.
• Sweep up spilled dry materials (e.g., cement, mortar, or dirt track-out) immediately. Never attempt to wash them away with water. Use only minimal water for dust control.
• Store stockpiled materials and wastes under a temporary roof or secured plastic sheeting or tarp.
Mitigation Measure AIR-2.2 Prior to future discretionary project approval, development project applicants shall prepare and submit to the Director of the City Planning and Development Department, or designee, a technical assessment evaluating potential project operation-related air quality impacts. The evaluation shall be prepared in conformance with SJVAPCD methodology in assessing air quality impacts. If operation-related air pollutants are determined to have the potential to exceed the SJVAPCD-adopted thresholds of significance, the Planning and Development Department shall require that applicants for new development projects incorporate mitigation measures to reduce air pollutant emissions during operational activities. The identified measures shall be included as part of the Project Conditions of Approval. Possible mitigation measures to reduce long-term emissions include but are not limited to:
• For site-specific development that requires refrigerated vehicles, the construction documents shall demonstrate an adequate number of electrical service connections at loading docks for plugging in the anticipated number of refrigerated trailers to reduce idling time and emissions.
• Applicants for manufacturing and light industrial uses shall consider energy storage (i.e., battery) and combined heat and power (CHP, also known as cogeneration) in appropriate applications to optimize renewable energy generation systems and avoid peak energy use.

G E N E R A L P L A N F R E S N O , C A L I F O R N I A
R E C I R C U L A T E D P R O G R A M E N V I R O N M E N T A L I M P A C T R E P O R T P U B L I C R E V I E W D R A F T
M A R C H 2 0 2 1
4.3-62
• Site-specific developments with truck delivery and loading areas and truck parking spaces shall include signage as a reminder to limit idling of vehicles while parked for loading/unloading in accordance with CARB Rule 2845 (13 California Code of Regulations [CCR] Chapter 10, Section 2485).
• Require that 240-volt electrical outlets or Level 3 chargers be installed in parking lots that would enable charging of neighborhood electric vehicles (NEVs) and/or battery powered vehicles.
• Maximize use of solar energy including solar panels; installing the maximum possible number of solar energy arrays on building roofs throughout the city to generate solar energy.
• Maximize the planting of trees in landscaping and parking lots.
• Use light-colored paving and roofing materials.
• Require use of electric or alternatively fueled street-sweepers with HEPA filters.
• Require use of electric lawn mowers and leaf blowers.
• Utilize only Energy Star heating, cooling, and lighting devices, and appliances.
• Use of water-based or low volatile organic compound (VOC) cleaning products.
Level of Significance With Mitigation: Significant and Unavoidable Impact.
While Mitigation Measure AIR-2.1 and Mitigation Measure AIR-2.2 would significantly reduce criteria air pollutant emissions generated during construction and operational activities associated with the continued implementation of the approved General Plan, there is currently not enough information to quantify emissions of specific project development that may occur under the proposed project. Without quantification to guarantee a less than significant finding, future development projects may still exceed the SJVAPCD regional significance thresholds. Therefore, operational activities would be considered to remain significant and unavoidable.
AIR‐3 The proposed project would expose sensitive receptors to substantial pollutant concentrations.
The analysis below addresses exposure to sensitive receptors from both stationary sources and mobile sources. Proposed projects associated with the continued implementation of the approved General Plan that emit TACs would require review under SJVAPCD rules and regulations or review
R E C I R C U L A T E D P R O G R A M E N V I R O N M E N T A L I M P A C T R E P O R T P U B L I C R E V I E W D R A F T M A R C H 2 0 2 1
G E N E R A L P L A N F R E S N O , C A L I F O R N I A
4.3-63
under CEQA, especially if located near sensitive receptors. Projects with sensitive receptors proposed near localized sources of TAC emissions (e.g., residents to be located near major roadways or stationary sources) could expose new sensitive populations to TACs and other air pollutants. According to the CARB and SJVAPCD, exposure to elevated levels of TACs contribute to elevated health risks. The ARB recommends that buffers should be included to avoid exposure of sensitive receptors to TAC sources. Risk levels drop dramatically beyond 500 feet from a source due to dispersion of emissions with distance.
It is important to note that CEQA generally does not require analysis or mitigation of the impact of existing environmental conditions on a project, including a project's future users or residents. However, as with other laws and regulations enforced by other agencies that protect public health and safety, the City, as the lead agency, has authority other than CEQA to institute policies that aim to protect public health and safety.
Stationary Sources. Stationary sources of TACs within the city of Fresno include the stationary sources permitted by the SJVAPCD. Various permitted uses are dispersed throughout the city. Various industrial and commercial processes (e.g., manufacturing and dry cleaning) allowed under the continued implementation of the approved General Plan would be expected to release TACs. Industrial land uses, such as chemical processing facilities, chrome-plating facilities, dry cleaners, and gasoline-dispensing facilities, have the potential to be substantial stationary sources that would require a permit from SJVAPCD for emissions of TACs. Emissions of TACs would be controlled through permits issued by SJVAPCD and would be subject to further study and health risk assessment prior to the issuance of any necessary air quality permits. Since it is not possible to determine the amount of TAC concentrations at the time of this analysis, it is not possible to calculate the risks for a particular health effect within the Planning Area. The proposed project is a programmatic project and until specific future projects are proposed, the associated TAC emissions cannot be determined or modeled at this time. Future development projects subject to environmental review under CEQA would be required to analyze potential TAC emissions and include mitigation as appropriate.
In addition to stationary/area sources of TACs, commercial and industrial operations could generate a substantial amount of diesel particulate matter emissions from off-road equipment use and truck idling. New land uses in the city that use diesel trucks, including trucks with transport refrigeration units, could generate an increase in DPM that would contribute to cancer and non-cancer health risk in the Basin. Land use projects are required to comply with AB 2588 and CARB standards for diesel engines. As stated above, until specific future projects are proposed, the associated emissions cannot be determined or modeled at this time. However, mitigation has been identified so that future projects would be subject to environmental review under CEQA and would be required to analyze potential emissions and include mitigation as appropriate.
Siting of Sensitive Receptors. Because placement of sensitive land uses falls outside CARB’s jurisdiction, CARB developed and approved the Air Quality and Land Use Handbook: A Community Health Perspective to address the siting of sensitive land uses in the vicinity of freeways, distribution centers, rail yards, ports, refineries, chrome-plating facilities, dry cleaners, and gasoline-dispensing facilities. This guidance document was developed to assess compatibility and associated health risks when placing sensitive receptors near existing pollution sources.
G E N E R A L P L A N F R E S N O , C A L I F O R N I A
R E C I R C U L A T E D P R O G R A M E N V I R O N M E N T A L I M P A C T R E P O R T P U B L I C R E V I E W D R A F T
M A R C H 2 0 2 1
4.3-64
CARB’s recommendations for the siting of new sensitive land uses were based on a compilation of recent studies that evaluated data on the adverse health effects from proximity to air pollution sources. The key observation in these studies is that proximity to air pollution sources substantially increases both exposure and the potential for adverse health effects. Respiratory and cardiovascular problems including asthma, lung cancer, and premature death have been associated with living near major roadways and freeways.16 Children who live near major roadways and freeways have been found to have higher asthma rates and reduced lung function.17 There are three carcinogenic toxic air contaminants that constitute the majority of the known health risks from motor vehicle traffic: DPM from trucks and benzene and butadiene from passenger vehicles. Exposure to DPM accounts for the majority of carcinogenic risk in the Basin. It has been found that outdoor concentrations are highest near the roadway and decrease with increasing distance downwind of the source.18 CARB recommends avoiding siting new sensitive land uses within 500 feet of urban roads with more than 100,000 vehicles per day or rural roads with more than 50,000 vehicles per day.19
Table 4.3-6 shows a summary of the other CARB recommendations for siting new sensitive land uses within the vicinity of air pollutant sources. Recommendations in the table are based on data that show that localized air pollution exposures can be reduced by as much as 80 percent by following CARB minimum distance separations.
Continued implementation of the approved General Plan would allow for new residential units to be constructed within the city; however precise location of future residential units is unknown at this time. Based on modeling conducted by LSA, if new sensitive receptors were sited within 500 feet of SR-99, 400 feet within SR-41, 400 feet of 180, or 500 feet within SR-168; or within CARB’s minimum siting recommendations of other stationary sources; future residents may be exposed to significant concentrations of air pollutants. Residential land uses or other sensitive uses could be developed near or adjacent to areas designated for commercial and industrial uses and in proximity to existing permitted TAC sources. Risk contours within the city of Fresno are shown in Appendix C.
CEQA does not generally require an agency to consider the effects of existing environmental conditions on a proposed project’s future users or residents. However, as with other laws and regulations enforced by other agencies that protect public health and safety, the City, as the lead agency, has authority other than CEQA to require measures to protect public health and safety.
As listed in Section 4.2.7.1 above, the approved General Plan includes Policies with provisions for reducing exposure of sensitive receptors to TAC emissions including: UF-12-d, LU-6-f, MT-1-d, MT-1-j, and MT-5-c.
16 Balmes, J.R., Earnest, G., Katz, P.P., Yelin, E.E., Eisner, M.D., Chen, H., Trupin, L., Lurmann, F., and Blanc,
P.D. 2009. Exposure to traffic: Lung function and health status of adults with asthma. The Journal of Allergy and Clinical Immunology, 123(3):626–631.
17 California Air Resources Board. 2013. Overview of the Children’s Health Study. Website: ww3.arb.ca.gov/research/chs/over.htm (accessed February 17, 2020).
18 Zhu, Y., Hinds, W.C., Kim, S., Shen, S., and Sioutas, C. 2002. Study of ultrafine particles near a major roadway with heavy-duty diesel traffic. Atmospheric Environment, 36(27):4323-4335.
19 California Air Resources Board. 2005. Air Quality and Land Use Handbook: A Community Health Perspective. April.

R E C I R C U L A T E D P R O G R A M E N V I R O N M E N T A L I M P A C T R E P O R T P U B L I C R E V I E W D R A F T M A R C H 2 0 2 1
G E N E R A L P L A N F R E S N O , C A L I F O R N I A
4.3-65
Future development associated with the continued implementation of the approved General Plan would be required to comply with AB 2588, and CARB standards for diesel engines. While existing City policies and regulations are intended to minimize impacts associated with sensitive receptors, mitigation measures for future project developments that implement these policies and regulations are identified to ensure that the intended environmental protections are achieved. Compliance with Mitigation Measure AIR-3.1 would ensure that mobile sources of TACs not covered under SJVAPCD permits are considered during subsequent project-level environmental review. Mitigation Measure AIR-3.1 would require the preparation of project-specific technical health risk assessments for certain discretionary large industrial or warehousing uses to evaluate operational-related health risk impacts to further ensure that operational-related emissions are reduced to a less than significant level. However, information regarding operational characteristics of future specific development projects and the associated emissions cannot be determined at the time of this analysis; therefore, cumulative growth within the city could result in potential TAC health could cumulatively contribute to elevated health risks in the city. Therefore, in an abundance of caution, potential TAC health risks are considered a significant impact.
In addition, Mitigation Measure AIR-3.2 identifies the use of the discretionary review process for residential and other sensitive land uses near freeways to impose site plan and design features aimed at minimizing exposure to environmental pollution. Therefore, compliance with Mitigation Measure AIR-3.1 and Mitigation Measure AIR-3.2 would ensure the potential TAC health risk impact associated with the continued implementation of the approved General Plan would be less than significant.
No specific development projects are identified in the approved General Plan; therefore, measures are identified that shall be implemented on a project-by-project basis to reduce project related impacts.
Applicable Laws, Regulations, Relevant Land Use Policies
• Refer to the approved General Plan policies and objectives identified in Section 4.3.5.4, Local Policies and Regulations, above.
Level of Significance Without Mitigation: Potentially Significant Impact.
Impact AIR-3: Development projects associated with the continued implementation of the approved General Plan could expose sensitive receptors to substantial pollutant concentrations.
Mitigation Measure AIR-3.1 Prior to future discretionary approval for projects that require environmental evaluation under CEQA, the City of Fresno shall evaluate new development proposals for new industrial or warehousing land uses that: (1) have the potential to generate 100 or more truck trips per day or have 40 or more trucks with operating diesel-powered transport refrigeration units, and (2) are within 1,000 feet of a sensitive land use (e.g., residential, schools, hospitals, or nursing homes), as measured from the property line of the project to the property line of the nearest sensitive use. Such projects shall submit a Health Risk Assessment (HRA) to the City Planning and Development Department. The HRA shall be prepared

G E N E R A L P L A N F R E S N O , C A L I F O R N I A
R E C I R C U L A T E D P R O G R A M E N V I R O N M E N T A L I M P A C T R E P O R T P U B L I C R E V I E W D R A F T
M A R C H 2 0 2 1
4.3-66
in accordance with policies and procedures of the most current State Office of Environmental Health Hazard Assessment (OEHHA) and the SJVAPCD. If the HRA shows that the incremental health risks exceed their respective thresholds, as established by the SJVAPCD at the time a project is considered, the Applicant will be required to identify and demonstrate that best available control technologies for toxics (T-BACTs), including appropriate enforcement mechanisms to reduce risks to an acceptable level. T-BACTs may include, but are not limited to:
• Restricting idling on site or electrifying warehousing docks to reduce diesel particulate matter;
• Requiring use of newer equipment and/or vehicles;
• Provide charging infrastructure for: electric forklifts, electric yard trucks, local drayage trucks, last mile delivery trucks, electric and fuel-cell heavy duty trucks; and/or
• Install solar panels, zero-emission backup electricity generators, and energy storage to minimize emissions associated with electricity generation at the project site.
T-BACTs identified in the HRA shall be identified as mitigation measures in the environmental document and/or incorporated into the site plan.
Mitigation Measure AIR-3.2 Locate sensitive land uses (e.g., residences, schools, and daycare centers) to avoid incompatibilities with recommended buffer distances identified in the most current version of the CARB Air Quality and Land Use Handbook: A Community Health Perspective (CARB Handbook). Sensitive land uses that are within the recommended buffer distances listed in the CARB Handbook shall provide enhanced filtration units or submit a Health Risk Assessment (HRA) to the City. If the HRA shows that the project would exceed the applicable SJVAPCD thresholds, mitigation measures capable of reducing potential impacts to an acceptable level must be identified and approved by the City.
Level of Significance With Mitigation: Significant and Unavoidable.
Implementation of Mitigation Measure AIR-3.1 and AIR 3.2 would serve to ensure that the impacts of the continued implementation of the approved General Plan are assessed to determine if they would expose sensitive receptors to potentially significant impacts from TAC emissions. However, at the time an individual project is proposed, an assessment may identify significant impacts or

R E C I R C U L A T E D P R O G R A M E N V I R O N M E N T A L I M P A C T R E P O R T P U B L I C R E V I E W D R A F T M A R C H 2 0 2 1
G E N E R A L P L A N F R E S N O , C A L I F O R N I A
4.3-67
cumulative contributions of TAC emissions for which feasible mitigation measures are not available. Therefore, TAC impacts would remain significant.
AIR‐4 The proposed project would result in other emissions (such as those leading to odors) adversely affecting a substantial number of people.
The city of Fresno has many sources with the potential to generate odors including wastewater treatment facilities, landfills, transfer stations, recycling centers, manufacturing plants, food processors, painting operations, and rendering plants. Based on review of odor complaint history, very few of these facilities experience substantial odor complaints over the last three years. The continued implementation of the approved General Plan could result in the odor sources being located near sensitive receptors and could result in significant impacts on sensitive receptors.
The approved General Plan could also result in sensitive receptors being constructed within the screening level distances from existing odor sources. These potential odor impacts on new sensitive receptors could be significant. When potential odor impacts on these new sensitive receptors occur, the SJVAPCD has authority under Rule 4102 to require the owner of the odor‐generating source to take actions that would reduce impacts to less than significant.
The SJVAPCD provided a record of all odor complaints within the City of Fresno Planning Area from 2015 through 2019, which are included in Appendix C. The odor complaints revealed three odor complaints at Church Avenue and Willow Avenue between August 2016 and September 2016, eight odor complaints at E&J Gallo Winery between October 2015 and December 2018, eight odor complaints at Cedar and Jensen Avenues between January 2015 and November 2017, and 43 odor complaints at P-R Farms between October 2018 and November 2018.
Potential impacts from odor sources would be mitigated through compliance with General Plan Policy PU‐9‐d and by enforcement actions by agencies with regulatory authority over odors. General Plan Policy PU‐9‐d would ensure that waste and recycling facilities are properly located. Potential odor impacts from waste and recycling facilities is one of the primary factors considered in the location decision and are regulated by the State of California through CalRecycle and the Local Enforcement Agency delegated by the State. The SJVAPCD addresses odor issues through Rule 4102 – Nuisance. Facilities creating nuisance odors generating public complaints can result in SJVAPCD enforcement action. Individual development projects are required to determine if odors would be a potentially significant impact as part of CEQA review. The approved General Plan does not identify specific projects that are likely to result in an increase in odors. However, projects meeting the screening criteria are likely to be proposed in the Plan Area. In addition, projects containing sensitive receptors are likely to be proposed near existing odor sources. Projects proposing new receptors within screening level distances will reduce the impact to less than significant through procedures provided by Rule 4102. Proposal of a new source within the screening distance would require the applicant to demonstrate that the proposed facility includes odor controls within its design and through implementation of odor management practices to reduce odors to less than significant. Therefore, impacts from the project are potentially significant.

G E N E R A L P L A N F R E S N O , C A L I F O R N I A
R E C I R C U L A T E D P R O G R A M E N V I R O N M E N T A L I M P A C T R E P O R T P U B L I C R E V I E W D R A F T
M A R C H 2 0 2 1
4.3-68
Applicable Laws, Regulations, Relevant Land Use Policies
• Refer to the approved General Plan policies and objectives identified in Section 4.3.5.4, Local Policies and Regulations, above.
Level of Significance Without Mitigation: Potentially Significant Impact.
Impact AIR-4: The proposed project could result in significant odors that could adversely affect a substantial number of people.
Mitigation Measure AIR-4.1 Require developers of projects with the potential to generate significant odor impacts as determined through review of SJVAPCD odor complaint history for similar facilities and consultation with the SJVAPCD, to prepare an odor impact assessment and to implement odor control measures recommended by the SJVAPCD or the City as needed to reduce the impact to a level deemed acceptable by the SJVAPCD. The City’s Planning and Development Department shall verify that all odor control measures have been incorporated into the project design specifications prior to issuing a permit to operate.
Level of Significance With Mitigation: Less Than Significant Impact.
4.3.7.2 Cumulative Impacts
AIR‐5 The proposed project would have a significant effect on the environment if it – in combination with other projects – would contribute to a significant cumulative impact related to air quality.
As defined in Section 15130 of the State CEQA Guidelines, cumulative impacts are the incremental effects of an individual project when viewed in connection with the effects of past, current, and probable future projects within the cumulative impact area for air quality. The cumulative study area analyzed for potential air quality impacts is the Basin. Each project in the Basin is required to comply with SJVAPCD rules and regulations and is subject to independent review.
The Basin is currently designated as a nonattainment area for the federal ozone standard and PM2.5 standard and as a nonattainment area for the State ozone, PM10, and PM2.5 standard. Thus, the Basin has not met the federal and State standards for these air pollutants. Future development that may occur with the continued implementation of the approved General Plan would contribute criteria pollutants to the area during project construction and operation. However, future development under the proposed project would be required to comply with CARB motor vehicle standards, SJVAPCD regulations from stationary sources and architectural coatings, Title 24 energy efficiency standards, and the approved General Plan and policies. While the approved General Plan policies and regulations are intended to reduce impacts associated with air quality violations, specific standard conditions for future project developments that implement these policies and regulations are identified as mitigation measures to ensure that the intended environmental

R E C I R C U L A T E D P R O G R A M E N V I R O N M E N T A L I M P A C T R E P O R T P U B L I C R E V I E W D R A F T M A R C H 2 0 2 1
G E N E R A L P L A N F R E S N O , C A L I F O R N I A
4.3-69
protections are achieved. Consequently, emissions generated by development projects in addition to existing sources within the city would be considered to cumulatively contribute to the nonattainment designations of the Basin. Continued implementation of the approved General Plan could contribute to an increase in frequency or severity of air quality violations and delay attainment of the AAQS or interim emission reductions in the AQMP due to the increase in vehicle trips associated with implementation of the project. Therefore, emissions generated from the proposed project would result in a significant cumulative air quality impact.
Since the combination, number, and size of projects that could be under construction at any one time are unknown, even with implementation of mitigation measures, the proposed project would result in significant cumulative construction emissions from criteria pollutants. Additionally, even with implementation of mitigation, operational impacts from criteria pollutant emissions would contribute to an ozone exceedance, which could hinder the attainment of air quality standards. Further, cumulative growth within the city could result in potential TAC health risks exceeding applicable standards and cumulatively contributing to elevated health risks in the Basin. Therefore, air quality emissions associated with future development that may occur under the continued implementation of the approved General Plan could result in cumulatively considerable impacts, even with implementation of mitigation.
Applicable Laws, Regulations, Relevant Land Use Policies
• Refer to the approved General Plan policies and objectives identified in Section 4.3.5.4, Local Policies and Regulations, above.
Level of Significance Without Mitigation: Potentially Significant Impact.
Impact AIR-5: The proposed project in combination with other projects, would contribute to a significant cumulative impact related to air quality.
Mitigation Measures: Refer to Mitigation Measures AIR-2.1, AIR-2.2, AIR-3.1, AIR-3.2 and AIR-4.1.
Level of Significance With Mitigation: Significant and Unavoidable Impact.
As discussed above, while implementation of Mitigation Measures AIR-2.1, AIR-2.2, AIR-3.1, AIR-3.2 and AIR-4.1 would significantly reduce criteria air pollutant emissions generated by continued implementation of the approved General Plan, there is currently not enough information to quantify emissions of specific project development that may occur under the proposed project. Without quantification to guarantee a less than significant finding, future development projects may still exceed the SJVAPCD regional significance thresholds. Therefore, cumulative impacts to air quality would be considered to remain significant and unavoidable.

G E N E R A L P L A N F R E S N O , C A L I F O R N I A
R E C I R C U L A T E D P R O G R A M E N V I R O N M E N T A L I M P A C T R E P O R T P U B L I C R E V I E W D R A F T
M A R C H 2 0 2 1
4.3-70
This page intentional left blank
R E C I R C U L A T E D P R O G R A M E N V I R O N M E N T A L I M P A C T R E P O R T P U B L I C R E V I E W D R A F T M A R C H 2 0 2 1
G E N E R A L P L A N F R E S N O , C A L I F O R N I A
4.8-1
4.8 GREENHOUSE GAS EMISSIONS
4.8.1 Introduction
This section provides a discussion of greenhouse gas emissions (GHG), existing regulations pertaining to GHGs, and an analysis of GHG emissions impacts associated with the construction and operation of continued implementation of the approved General Plan. This analysis examines the short-term construction and long-term operational impacts within the Planning Area and evaluates the effectiveness of measures incorporated as part of the approved General Plan and Recirculated Greenhouse Gas Reduction Plan Update. This section has been recirculated to make it consistent with the Recirculated Greenhouse Gas Reduction Plan Update (2021), included as Appendix G to this PEIR.
4.8.2 CEQA Baseline
The City of Fresno (City) is responsible for preparation of a Program Environmental Impact Report (PEIR) for the approved General Plan that was adopted in December 2014. The intent of this current effort is to convert the Master EIR (MEIR) that was prepared in 2014 to a PEIR, and to update the analysis to be in conformance with State law and to be consistent with recent legislative changes, which include Assembly Bill 32 (2006) and Senate Bill (SB) 32 (2016) regarding climate change, SB 743 (2013) regarding Vehicle Miles Travelled (VMT), and the Sustainable Groundwater Management Act (SGMA) (2014). The Project Description, as described in Chapter 3.0 of this PEIR, provides an overview of the content of the approved General Plan, explains that the PEIR will evaluate the continued implementation of the approved General Plan, and identifies specific text changes to the approved General Plan that constitute what is being evaluated in the PEIR (referred to as the “proposed project”). In addition, the Greenhouse Gas Reduction Plan, included as an Appendix to the MEIR, has also been updated and included as Appendix G of the PEIR to take into account the requirements of SB 32. The text changes analyzed as the proposed project are limited to technical revisions to the Mobility and Transportation Element and include the addition of VMT policies consistent with the requirements of SB 743 and the revision of text relating to Level of Service (LOS) metrics. These changes are narrow in scope and do not result in direct physical changes to the environment. Therefore, the physical environmental effects of the proposed project would be essentially the same as if the text changes to the approved General Plan were not proposed (referred to as the “No Project scenario”).
Since the General Plan was adopted and the MEIR was certified in 2014, several amendments to the General Plan have been adopted, and new local, State, and/or federal regulations have been enacted. Accordingly, most of the PEIR uses a baseline consistent with the date of issuance of the Notice of Preparation (NOP) in 2019, as required by CEQA Guidelines Section 15125. However, it should be noted that for the PEIR’s greenhouse gas analysis, a baseline inventory year of 2016 was used because the City prepared an updated inventory in 2016 that accounted for regulations adopted to that point in time. Therefore, the 2016 baseline provides the best available baseline for the GHG Reduction Plan Update because it can be compared directly with State progress to date and established targets. This year as the baseline inventory for greenhouse gas provides the most accurate and understandable picture of the environmental impacts of the project with respect to greenhouse gases.

G E N E R A L P L A N F R E S N O , C A L I F O R N I A
R E C I R C U L A T E D P R O G R A M E N V I R O N M E N T A L I M P A C T R E P O R T P U B L I C R E V I E W D R A F T
M A R C H 2 0 2 1
4.8-2
The No Project scenario assumes continuation of the approved General Plan (2014) without the Mobility and Transportation Element changes or updates to the Greenhouse Gas Reduction Plan just described. In this scenario, future development in the city would occur as currently set forth under the approved General Plan. Text changes related to the Mobility and Transportation Element, including the addition of VMT policies, would not occur. The approved General Plan would not be updated to reflect conformance with SB 743, and no updates to the Greenhouse Gas Reduction Plan would occur. Despite the lack of an update under the No Project scenario, the distribution and location of projected growth would occur in a manner that is consistent with the City’s approved General Plan and zoning documents, as no changes to the proposed land uses are proposed. Development under the approved General Plan would be the same as compared to the proposed project analyzed in the PEIR, and the physical changes to the environment would be the same under both scenarios. The baseline for the analysis of greenhouse gas emissions and the updates to the Greenhouse Gas Reduction Plan Update does not change.
4.8.3 Existing Environmental Setting
The following discussion describes existing GHG emissions in the city of Fresno and the San Joaquin Valley Air Basin (SJVAB), beginning with a discussion of typical GHG types and sources, impacts of global climate changes, the regulatory framework surrounding these issues, and current emission levels.
The study area for project impacts regarding GHG is the City of Fresno Planning Area because potential development under the continued implementation of the City of Fresno General Plan is limited to areas within the Planning Area where the emissions are generated. It should be noted that GHG impacts are inherently cumulative impacts.
The study area for the analysis of cumulative GHG impacts is the State of California. This analysis will be based on a summary of projections approach as provided in Section 15130(b)(1)(B) of the CEQA Guidelines. The applicable projections include those provided by the State pursuant to AB 32 and the California Air Resources Board (CARB) Scoping Plan prepared to address AB 32 requirements.
4.8.4 Methodology
The city of Fresno is located in the county of Fresno in the SJVAB. The SJVAB consists of Kings, Madera, San Joaquin, Merced, Stanislaus, and Fresno counties, as well as a portion of Kern county. The local agency with jurisdiction over air quality in the SJVAB is the San Joaquin Valley Air Pollution Control District (SJVAPCD).
Global climate change is the observed increase in the average temperature of the Earth’s atmosphere and oceans in recent decades. The Earth’s average near-surface atmospheric temperature rose 0.6 ± 0.2° Celsius (°C) or 1.1 ± 0.4° Fahrenheit (°F) in the 20th century. The prevailing scientific opinion on climate change is that most of the warming observed over the last 50 years is attributable to human activities. The increased amounts of carbon dioxide (CO2) and other GHGs are the primary causes of the human-induced component of warming. GHGs are released by

R E C I R C U L A T E D P R O G R A M E N V I R O N M E N T A L I M P A C T R E P O R T P U B L I C R E V I E W D R A F T M A R C H 2 0 2 1
G E N E R A L P L A N F R E S N O , C A L I F O R N I A
4.8-3
the burning of fossil fuels, land clearing, agriculture, and other activities, and lead to an increase in the greenhouse effect.1
GHGs are present in the atmosphere naturally, are released by natural sources, or are formed from secondary reactions taking place in the atmosphere. The gases that are widely seen as the principal contributors to human-induced global climate change are:
• Carbon dioxide (CO2)
• Methane (CH4)
• Nitrous oxide (N2O)
• Hydrofluorocarbons (HFCs)
• Perfluorocarbons (PFCs)
• Sulfur Hexafluoride (SF6)
Over the last 200 years, humans have caused substantial quantities of GHGs to be released into the atmosphere. These extra emissions are increasing GHG concentrations in the atmosphere, and enhancing the natural greenhouse effect, which is believed to be causing global warming. While manmade GHGs include naturally-occurring GHGs such as CO2, methane, and N2O, some gases, like HFCs, PFCs, and SF6 are completely new to the atmosphere.
Certain gases, such as water vapor, are short-lived in the atmosphere. Others remain in the atmos-phere for significant periods of time, contributing to climate change in the long term. Water vapor is excluded from the list of GHGs above because it is short-lived in the atmosphere and its atmospheric concentrations are largely determined by natural processes, such as oceanic evaporation. For the purposes of this air quality analysis, the term “GHGs” will refer collectively to the six gases listed above only.
The following discussion summarizes the characteristics of the six GHGs and black carbon.
4.8.4.1 Carbon Dioxide
In the atmosphere, carbon generally exists in its oxidized form, as CO2. Natural sources of CO2 include the respiration (breathing) of humans, animals and plants, volcanic out gassing, decomposition of organic matter and evaporation from the oceans. Human caused sources of CO2 include the combustion of fossil fuels and wood, waste incineration, mineral production, and
1 The temperature on Earth is regulated by a system commonly known as the “greenhouse effect.” Just as
the glass in a greenhouse lets heat from sunlight in and reduces the heat escaping, greenhouse gases like carbon dioxide, methane, and nitrous oxide in the atmosphere keep the Earth at a relatively even temperature. Without the greenhouse effect, the Earth would be a frozen globe; thus, although an excess of greenhouse gas results in global warming, the naturally occurring greenhouse effect is necessary to keep our planet at a comfortable temperature.

G E N E R A L P L A N F R E S N O , C A L I F O R N I A
R E C I R C U L A T E D P R O G R A M E N V I R O N M E N T A L I M P A C T R E P O R T P U B L I C R E V I E W D R A F T
M A R C H 2 0 2 1
4.8-4
deforestation. Natural sources release approximately 150 billion tons of CO2 each year, far outweighing the 7 billion tons of man-made emissions of CO2 each year. Nevertheless, natural removal processes, such as photosynthesis by land- and ocean-dwelling plant species, cannot keep pace with this extra input of man-made CO2, and consequently, the gas is building up in the atmosphere.
In 2017, CO2 emissions accounted for approximately 83 percent of California's overall GHG emissions.2 The transportation sector accounted for California’s largest portion of CO2 emissions, approximately 47 percent, with gasoline consumption making up the greatest portion of these emissions. Industrial sources were California’s second largest category of GHG emissions.
4.8.4.2 Methane
Methane is produced when organic matter decomposes in environments lacking sufficient oxygen. Natural sources include wetlands and oceans. Decomposition occurring in landfills accounts for the majority of human-generated CH4 emissions in California and in the United States as a whole. Agricultural processes such as intestinal fermentation in dairy cows, manure management, and rice cultivation are also significant sources of CH4 in California. Methane accounted for approximately 9.0 percent of GHG emissions in California in 2017.3
Total annual emissions of methane in California are approximately 39.9 million tons, with manmade emissions accounting for the majority. As with CO2, the major removal process of atmospheric methane—a natural chemical breakdown in the atmosphere—cannot keep pace with source emissions, and methane concentrations in the atmosphere are increasing.
4.8.4.3 Nitrous Oxide
Nitrous oxide is produced naturally by a wide variety of biological sources, particularly microbial action in soils and water. Tropical soils and oceans account for the majority of natural source emissions. Nitrous oxide is a product of the reaction that occurs between nitrogen and oxygen during fuel combustion. Both mobile and stationary combustion emit N2O, and the quantity emitted varies according to the type of fuel, technology, and pollution control device used, as well as maintenance and operating practices. Agricultural soil management and fossil fuel combustion are the primary sources of human-generated N2O emissions in California. Nitrous oxide emissions accounted for approximately 3.1 percent of GHG emissions in California in 2017.4
2 California Air Resources Board. 2019. California Greenhouse Gas Emission Inventory – 2019 Edition. July
11. Website: www.arb.ca.gov/cc/inventory/data/data.htm (accessed February 17, 2020). 3 Ibid. 4 Ibid.

R E C I R C U L A T E D P R O G R A M E N V I R O N M E N T A L I M P A C T R E P O R T P U B L I C R E V I E W D R A F T M A R C H 2 0 2 1
G E N E R A L P L A N F R E S N O , C A L I F O R N I A
4.8-5
4.8.4.4 Hydrofluorocarbons, Perfluorocarbons, and Sulfur Hexafluoride
HFCs are primarily used as substitutes for ozone-depleting substances regulated under the Montreal Protocol.5 PFCs and SF6 are emitted from various industrial processes, including aluminum smelting, semiconductor manufacturing, electric power transmission and distribution, and magnesium casting. There is no aluminum or magnesium production in California; however, the rapid growth in the semiconductor industry leads to greater use of PFCs. HFCs, PFCs, and SF6 accounted for about 4.7 percent of GHG emissions (CO2e) in California in 2017.6
4.8.4.5 Black Carbon
Black carbon is the most strongly light-absorbing component of particulate matter (PM) formed by burning fossil fuels such as coal, diesel, and biomass. Black carbon is emitted directly into the atmosphere in the form of PM2.5 and is the most effective form of PM, by mass, at absorbing solar energy. Per unit of mass in the atmosphere, black carbon can absorb a million times more energy than CO2.7 Black carbon contributes to climate change both directly, such as absorbing sunlight, and indirectly, such as affecting cloud formation. However, because black carbon is short-lived in the atmosphere, it can be difficult to quantify its effect on global-warming.
Most U.S. emissions of black carbon come from mobile sources (52 percent), particularly from diesel fueled vehicles. The other major source of black carbon is open biomass burning, including wildfires, although residential heating and industry also contribute. The CARB estimates that the annual black carbon emissions in California have decreased approximately 70 percent between 1990 and 2010 and are expected to continue to decline significantly due to controls on mobile diesel emissions.
4.8.4.6 Global Warming Potential
GHGs have varying global warming potential (GWP) and atmospheric lifetimes. Carbon dioxide, the reference gas for global warming potential, has a global warming potential of 1. The calculation of the carbon dioxide equivalent (CO2e) is a consistent methodology for comparing emissions, since it normalizes various emissions to a consistent metric. Methane’s warming potential of 21 indicates that methane has a 21 times greater warming effect than carbon dioxide on a molecule per molecule basis. A carbon dioxide equivalent is the mass emissions of an individual GHG multiplied by its global warming potential. Emissions are typically shown in MT CO2e or a million times that, million metric tons of carbon dioxide equivalents (MMT CO2e). Global warming potentials are shown in Table 4.8.A.
5 The Montreal Protocol is an international treaty that was approved on January 1, 1989 and was
designated to protect the ozone layer by phasing out the production of several groups of halogenated hydrocarbons believed to be responsible for ozone depletion.
6 Ibid. 7 U.S. Environmental Protection Agency. 2017. Black Carbon. September. Website: 19january2017
snapshot.epa.gov/www3/airquality/blackcarbon/basic.html (accessed February 2020).

G E N E R A L P L A N F R E S N O , C A L I F O R N I A
R E C I R C U L A T E D P R O G R A M E N V I R O N M E N T A L I M P A C T R E P O R T P U B L I C R E V I E W D R A F T
M A R C H 2 0 2 1
4.8-6
Table 4.8.A: Global Warming Potentials
Gas Atmospheric Lifetime
(Years) Global Warming Potential (100-Year Time Horizon)
Carbon Dioxide 50-200 1 Methane 12 21 Nitrous Oxide 114 310 HFC-23 270 14,800 HFC-134a 14 1,430 HFC-152a 1.4 124 PFC: Tetrafluoromethane (CF4) 50,000 7,390 PFC: Hexafluoromethane (C2F6) 10,000 12,200 Sulfur Hexafluoride (SF6) 3,200 22,800 Source: Climate Change 2007: The Physical Science Basis. Contribution of Working Group I to the Fourth Assessment Report of the IPCC
(Intergovernmental Panel on Climate Change, 2007a).
4.8.4.7 Effects of Climate Change on Fresno
Scientific research indicates that an increase in global average temperature of 2 degrees Centigrade (°C) (3.6° Fahrenheit [F]) above pre-industrial levels poses risks to natural systems and human health and well-being. This is only 1.1°C (2.0°F) above present levels. In order to avoid temperatures above those levels, studies indicate that a concentration at or below 450 ppm CO2e must be achieved. Other studies indicate a stable concentration of about 400 ppm CO2e will be needed to prevent the 2.0°C (3.6°F) increase. Readings at the Mauna Loa monitoring station have already exceeded 410 ppm CO2e and the international average is likely to exceed 400 ppm in a few years. The existing trend is likely to cause substantial harm to future generations and nature.8
Despite efforts to reduce GHG emissions, these gases can remain in the atmosphere for hundreds of years and emissions are expected to continue to increase globally for some time. Therefore, it is probable that climate change impacts will be observed. The impacts are predicted to vary by region. In California, climate change may result in a decreased water supply, sea level rise, and increased wildfires, to name a few. In order to manage these impacts, the city’s vulnerability to these impacts is assessed and strategies have been developed to adapt to the projected changes.
Determining potential future impacts from climate change is an evolving process. The 2009 California Climate Adaptation Strategy provides a proactive foundation for an ongoing adaptation process within California for the sectors with the greatest risks. The document provides strategies for state and local governments to adapt to climate change.9 By incorporating applicable strategies as Implementation Strategies, the City is taking a proactive approach to ensure that impacts to the city are minimized.
8 California Air Resources Board (CARB). 2014. California Greenhouse Gas Emission Inventory: 2000-2012.
Available online at: ww3.arb.ca.gov/cc/inventory/pubs/reports/ghg_inventory_00-12_report.pdf. 9 California Natural Resources Agency (CNRA). 2009. California Climate Adaptation Strategy. Available
online at: resources.ca.gov/docs/climate/Statewide_Adaptation_Strategy.pdf.

R E C I R C U L A T E D P R O G R A M E N V I R O N M E N T A L I M P A C T R E P O R T P U B L I C R E V I E W D R A F T M A R C H 2 0 2 1
G E N E R A L P L A N F R E S N O , C A L I F O R N I A
4.8-7
The following discussion describes the main risks from climate change that could be experienced in the city of Fresno. The sections of the approved General Plan related to safety, public utilities, hydrology, and resource conservation contain policies that would decrease the risks to residents of the city. In general, City programs and policies to respond to existing levels of risk may need to be implemented more frequently or expanded to protect city residents and resources from potential impacts from climate change. Response to more or bigger events can be expected to demand more city resources.
Wildfire. The city of Fresno is surrounded by irrigated agricultural lands, rural residential develop-ment, and the city of Clovis that are not subject to wildfire to any great extent. Fallow farmland and vacant land with weedy growth can become a fire hazard if not maintained. The San Joaquin River bluff area along the city’s northern boundary could experience longer dry seasons and greater threats from wildfire.
Water. One of the potential impacts of climate change is a loss of natural snowpack, particularly the Sierra Nevada snowpack. Snowmelt provides an annual average of 15 million acre-feet of water, released between April and July each year.10 The California Department of Water Resources projects that the Sierra snowpack will experience at least a 25 percent reduction from its historic average by 2050.11 Climate change is also anticipated to bring warmer storms that result in less snowfall at lower elevations, reducing the total snowpack.
Changes in precipitation patterns are expected to cause increased flooding. For the purposes of federal flood insurance, the Federal Emergency Management Agency (FEMA) has traditionally used the 100-year flood event, which refers to the level of flood flows that has a 1 percent chance of being exceeded in any single year. As California’s hydrology changes, what is currently considered a 100-year flood may strike more often, leaving many communities at greater risk. Moreover, as peak flows and precipitation change over time, climate change calls into question assumptions of “stationarity” that are used in flood-related statistical analyses such as the 100-year flood. That is, the probable area of inundation does not change from year to year.
The California Department of Water Resources recommends that local governments implement land use policies that decrease flood risk.12 These following recommendations are included as GHG Plan implementation policies where applicable and feasible.
• Local land use agencies should update General Plans to address increased flood risks posed by climate change. General Plans should consider an appropriate risk tolerance and planning horizon for each locality.
10 California Department of Water Resources (DWR). 2008. Managing an Uncertain Future: Climate Change
Adaptation Strategies for California Water. 11 California Department of Water Resources (DWR). 2014. Final Report of the Flood Emergency Action
Team. 12 California Department of Water Resources (DWR). 2008. Managing an Uncertain Future: Climate Change
Adaptation Strategies for California Water.

G E N E R A L P L A N F R E S N O , C A L I F O R N I A
R E C I R C U L A T E D P R O G R A M E N V I R O N M E N T A L I M P A C T R E P O R T P U B L I C R E V I E W D R A F T
M A R C H 2 0 2 1
4.8-8
• Local governments should site new development outside of undeveloped floodplains unless the floodplain has at least a sustainable, 200-year level of flood protection.
• Local governments should use low-impact development techniques to infiltrate and store runoff.
• Local governments should include flood-resistant design requirements in local building codes. State, federal, and local agencies should develop conjunctive use management plans that integrate floodplain management, groundwater banking, and surface storage. Such plans could help facilitate system reoperation and provide a framework for the development of local projects that are beneficial across regions.
• Local land use agencies should adopt ordinances that protect the natural functioning of groundwater recharge areas.
As precipitation falls in the form of rain rather than snow with greater storm intensity, high-frequency flood events are projected to increase. There is currently no known literature that suggests an increase in flooding from climate change in the Fresno area; however, it is possible that there could be changing weather patterns that would result in heavy downpours of rain in the area, which could cause street flooding. In addition, the potential for increased wildfires in foothill and mountain areas upstream from Fresno resulting from climate change could increase floods following fire if reservoirs had insufficient capacity to capture the runoff at that time.
4.8.4.8 Emission Inventories
An emissions inventory that identifies and quantifies the primary human-generated sources and sinks of GHGs is a well-recognized and useful tool for addressing climate change. This section summarizes the latest information on global, United States, and California GHG emission inventories.
Global Emissions. Worldwide emissions of GHGs in 2017 totaled approximately 49,900 million metric tons of CO2e.
United States Emissions. In 20178, the United States emitted about 6,4576,676 million metric tons of CO2e. The percentage of emissions for the United States is 12.213.4 percent of the global total yet accounts for only 4.4 percent of the world’s population. This places extra responsibility for the United States to take a leadership role and to act as a model for other nations to follow. Although previous international efforts have not made substantial progress in slowing the growth in GHG emissions, the United States has many reasons to change to lower carbon economy. For example, reducing energy imports results in increased energy security, cost savings from efficiency, and creates employment in renewable energy.
State of California Emissions. According to CARB emission inventory estimates, the State emitted approximately 424.1425.3 million metric tons of CO2e (million metric tons CO2e) emissions in 20178.

R E C I R C U L A T E D P R O G R A M E N V I R O N M E N T A L I M P A C T R E P O R T P U B L I C R E V I E W D R A F T M A R C H 2 0 2 1
G E N E R A L P L A N F R E S N O , C A L I F O R N I A
4.8-9
City of Fresno Emissions. The city of Fresno baseline inventory year was 2010. The City has prepared an updated inventory for 2016 that accounts for regulations adopted to that point in time. Therefore, 2016 provides the best available baseline for the GHG Plan and can be compared directly with State progress to date and targets. Table 4.8.B shows the baseline inventory.
Table 4.8.B: City of Fresno GHG Emissions by Sector for 2016
Sector 2016 (MT CO2e) Percent of Total Emissions Motor Vehicles 1,520,052 52 Residential Energy 479,371 16 Commercial Energy 524,838 18 Fugitive Emissions 270,130 9 Solid Waste 119,167 4 Industrial Energy 10,055 <1 Agriculture Energy 20 <1 Total 2,923,633 100 Source: ICLEI Local Governments for Sustainability, City of Fresno 2016 Inventory Update, 2018.
As shown in Table 4.8.B, motor vehicles were the largest source at approximately 52 percent of the city’s GHG emissions in 2016, followed by commercial and residential energy at 18 and 16 percent respectively. The remaining sources included fugitive emissions at 9 percent and solid waste sources at 4 percent. Agriculture and industrial energy emissions each account for less than 1 percent of total emissions.
4.8.5 Regulatory Setting
4.8.5.1 Federal Policies and Regulations
The United States Environmental Protection Agency (EPA) is responsible for implementing federal policy to address global climate change. The federal government’s early efforts have focused on public-private partnerships to reduce GHG intensity through energy efficiency, renewable energy, methane and other non-CO2 gases, agricultural practices, and implementation of technologies to achieve GHG reductions.
The EPA is required to regulate carbon dioxide and other GHGs as pollutants under Section 202(a)(1) of the federal Clean Air Act. The first step in implementing its authority was the Mandatory Reporting Rule that required inventory data collection commencing on January 1, 2010 with first reports due March 2011. Effective January 2, 2011, the EPA requires new and existing sources of GHG emissions of 75,000 tons per year to obtain a permit under the New Source Review Prevention of Significant Deterioration and Title V Operating Permit Program.
The main federal regulatory program for automobiles is the Corporate Average Fuel Economy (CAFE) program, which has been in place since 1975. Under previous administrations, CAFE was the primary means of limiting mobile source carbon emissions. Rules finalized in 2012 put in place binding standards through Model Year 2021 and offered estimated standards through 2024. The federal light-duty vehicle standards were developed in two phases that harmonized with California standards through 2016 (Phase 1) and 2025 (Phase 2) and developed the first ever federal GHG
G E N E R A L P L A N F R E S N O , C A L I F O R N I A
R E C I R C U L A T E D P R O G R A M E N V I R O N M E N T A L I M P A C T R E P O R T P U B L I C R E V I E W D R A F T
M A R C H 2 0 2 1
4.8-10
standards for medium-duty and heavy-duty vehicles. At the time, the EPA estimated that the new standards in this rule would reduce CO2 emissions by approximately 270 MMT and save 530 million barrels of oil over the life of vehicles sold during the 2014 through 2018 model years.
In 2018, however, the EPA proposed a new, less-stringent set of standards called the Safer Affordable Fuel-Efficient (SAFE) Vehicles Rule for Model Years 2021–2026 Passenger Cars and Light Trucks. The SAFE Vehicles Rule would amend certain existing CAFE and tailpipe CO2 emissions standards for passenger cars and light trucks and establish new standards, all covering model years 2021 through 2026. The standards have yet to be finalized.
4.8.5.2 State Policies and Regulations
In June 2013, President Obama approved the nation’s first Climate Action Plan that lays out a series of executive actions to reduce carbon pollution, prepare the nation for the impacts of climate change, and lead international efforts to address global climate change. The Plan reiterates the President’s 2009 pledge to reduce United States GHG emissions by 17 percent below 2005 levels by 2020. Under the President Trump administration, the nation’s stance on climate change has shifted from being a part of global action, to policy stagnation and deregulation. In June 2017, the U.S. decided to withdraw from the Paris Climate Agreement, which was an agreement among countries to reduce global GHG emissions resulting from the 2015 United Nations Climate Change Conference. Currently, the EPA has been engaged in research into approaches to reduce the U.S. contribution to climate change. Areas of climate research include economic analyses of regulatory policy instruments (e.g., emissions trading, estimation of GHG reduction benefits, the role of uncertainty, and modeling the economic impacts of ocean acidification). In the meantime, many U.S. States and companies are putting in place their own commitments to reduce global climate change by enacting local climate action plans, policies, and standards.
California has adopted a variety of regulations aimed at reducing the State’s GHG emissions. While State actions alone cannot stop climate change, the adoption and implementation of this legislation demonstrates California’s leadership in addressing climate change. Key legislation and Executive Orders pertaining to the State’s reduction targets are described below.
Executive Order S-3-05. California Governor Arnold Schwarzenegger announced on June 1, 2005, through Executive Order S 3-05, the following reduction targets for GHG emissions:
• By 2010, reduce GHG emissions to 2000 levels;
• By 2020, reduce GHG emissions to 1990 levels; and
• By 2050, reduce GHG emissions to 80 percent below 1990 levels.

R E C I R C U L A T E D P R O G R A M E N V I R O N M E N T A L I M P A C T R E P O R T P U B L I C R E V I E W D R A F T M A R C H 2 0 2 1
G E N E R A L P L A N F R E S N O , C A L I F O R N I A
4.8-11
The State achieved the first goal of reducing emissions to 2000 levels by 2010. Total GHG emissions were reduced by 2.9 percent during that period even though population increased by 10.9 percent in the same period.13 The State also appears to be on track for achieving the 2020 target.
Executive Order B-30-15. On April 29, 2015, California Governor Jerry Brown announced through EO B-30-15 the following GHG emissions target:
• By 2030, California shall reduce GHG emissions to 40 percent below 1990 levels.
The emissions reduction target of 40 percent below 1990 levels by 2030 is an interim-year goal to make it possible to reach the ultimate goal of reducing emissions 80 percent below 1990 levels by 2050. The order directs CARB to provide a plan with specific regulations to reduce Statewide sources of GHG emissions. EO B-30-15 does not include a specific guideline for local governments.
Assembly Bill 32 (AB 32) and Senate Bill 32 (SB 32), California Global Warming Solutions Act. AB 32 requires CARB to reduce Statewide GHG emissions to 1990 levels by 2020. As part of this legislation, CARB was required to prepare a “Scoping Plan” that demonstrates how the State will achieve this goal. The Scoping Plan was adopted in 2011, and in it, local governments were described as “essential partners” in meeting the Statewide goal, recommending a GHG reduction level of 15 percent below 2005 to 2008 levels (depending on when a full emissions inventory is available) by 2020.
CARB released the 2017 Scoping Plan in November 2017. The 2017 Scoping Plan provides strategies for achieving the 2030 target established by EO B-30-15 and codified in SB 32 (40 percent below 1990 levels by 2030). The 2017 Scoping Plan recommends local plan-level GHG emissions reduction goals.
SB 375. SB 375 aligns regional transportation planning efforts, regional GHG reduction targets, and affordable housing allocations. Metropolitan Planning Organizations (MPOs) are required to adopt a Sustainable Communities Strategy, which allocates land uses in the Metropolitan Planning Organization’s Regional Transportation Plan. Qualified projects consistent with an approved Sustainable Communities Strategy or Alternative Planning Strategy and categorized as “transit priority projects” would receive incentives under new provisions of CEQA. SB 375 requires regional reduction targets for light duty passenger vehicle CO2 emissions for each MPO.
AB 1493 (Pavley). The Pavley Bill enacted in 2002 requires the maximum feasible and cost-effective reduction of GHGs from automobiles and light-duty trucks. In 2004, CARB approved the “Pavley I” regulations that applied to new passenger vehicles beginning with model year 2009 through 2016. Pavley I is expected to reduce GHG emissions from regulated vehicles by 30 percent from 2002 levels by 2016. Pavley II was incorporated into Amendments to the Low-Emission Vehicle Program referred to as LEV III. The amendments, effective August 7, 2012, apply to vehicles for model years
13 California Air Resources Board (CARB). 2014. California Greenhouse Gas Emissions Inventory: 2000-2012.
Available online at: ww3.arb.ca.gov/cc/inventory/pubs/reports/ghg_inventory_00-12_report.pdf (accessed February 17, 2020).

G E N E R A L P L A N F R E S N O , C A L I F O R N I A
R E C I R C U L A T E D P R O G R A M E N V I R O N M E N T A L I M P A C T R E P O R T P U B L I C R E V I E W D R A F T
M A R C H 2 0 2 1
4.8-12
2017 through 2025. The regulation will reduce GHGs from new cars by 34 percent from 2016 levels by 2025.14
California Energy Code (California Building Energy Efficiency Standards). Energy consumption by new buildings in California is regulated by the California Energy Code which is Part 6 under Title 24 of the California Code of Regulations (CCR Title 24). The 12 parts of the CCR Title 24 are known as the California Building Standards Code (CBSC). The California Energy Commission adopted its first energy code, titled the Energy Conservation Standards for New Residential and New Nonresidential Buildings, in 1978 in response to a legislative mandate to reduce energy consumption in the State. The CBSC is updated every 3 years, and the current 2019 California Energy Code went into effect on January 1, 2020. The California Energy Code applies to both new construction and rehabilitation of residential and non-residential buildings, and regulates energy consumed for heating, cooling, ventilation, water heating, and lighting. The California Energy Code is enforced through the local building permit process. Local government agencies may adopt and enforce energy standards for new buildings, provided these standards meet or exceed those provided in CCR Title 24. The 2019 Title 24 standards include the requirement by the California Public Utilities Commission (CPUC) Energy Efficiency Strategic Plan for net zero energy consumption for new residential development starting in 2020 and will ultimately incorporate requirements for net zero in new non-residential development by 2030.
California Green Building Standards Code (CALGreen Code). In 2008, the California Building Standards Commission adopted Part 11 of CCR Title 24, titled the California Green Building Standards Code (CALGreen Code) which became effective on August 1, 2009 as a voluntary code. The 2010 CALGreen Code was the first mandatory edition, took effect on January 1, 2011, and is now a part of the CBSC 3-year update cycle. The 2019 CALGreen Code standards became effective on January 1, 2020. The CALGreen Code establishes mandatory measures for residential and non-residential building construction and encourages sustainable construction practices in the following five categories: (1) planning and design, (2) energy efficiency, (3) water efficiency and conservation, (4) material conservation and resource efficiency, and (5) indoor environmental quality. Although the CALGreen Code was adopted as part of the State’s efforts to reduce GHG emissions, the CALGreen Code standards have co-benefits of reducing energy consumption from residential and non-residential buildings subject to the standard.
Senate Bill 97. SB 97, enacted in 2007, amends the CEQA statute to clearly establish that GHG emissions and the effects of GHG emissions are appropriate subjects for CEQA analysis. The legislation directed the California Office of Planning and Research to develop draft CEQA Guidelines “for the mitigation of GHG emissions or the effects of GHG emissions” and directed the California Natural Resources Agency to certify and adopt the State CEQA Guidelines. CEQA Guidelines Section 15183.5, Tiering and Streamlining the Analysis of GHG Emissions, was added as part of the CEQA Guideline amendments that became effective in 2010 and describes the criteria needed in a GHG reduction plan that would allow for the tiering and streamlining of CEQA analysis for development projects.
14 California Air Resources Board (CARB). 2011. LEV III Staff Report and Initial Statement of Reasons.
December 7.

R E C I R C U L A T E D P R O G R A M E N V I R O N M E N T A L I M P A C T R E P O R T P U B L I C R E V I E W D R A F T M A R C H 2 0 2 1
G E N E R A L P L A N F R E S N O , C A L I F O R N I A
4.8-13
Senate Bill x7-7. SB x7-7 requires water suppliers to reduce urban per capita water consumption 20 percent from a baseline level by 2020.
Renewable Portfolio Standard. The Renewable Portfolio Standard (RPS) requires energy providers to derive 33 percent of their electricity from qualified renewable sources by 2020. In 2018, the State Assembly passed and Governor Jerry Brown signed SB 100, which requires energy providers to derive 60 percent of their electricity from qualified renewable sources by 2030 and 100 percent by 2045. The RPS is anticipated to lower emission factors (i.e., fewer GHG emissions per kilowatt-hour used) from utilities across the State, including Pacific Gas and Electric (PG&E).
Innovative Clean Transit (ICT) Regulation. The ICT regulation was adopted in December 2018 and requires all public transit agencies to gradually transition to a 100 percent zero-emission bus (ZEB) fleet. Beginning in 2029, 100 percent of new purchases by transit agencies must be ZEBs, with a goal for full transition by 2040. It applies to all transit agencies that own, operate, or lease buses with a gross vehicle weight rating (GVWR) greater than 14,000 pounds. It includes standard, articulated, over-the-road, double-decker, and cutaway buses.
Other Regulations. The CARB has adopted numerous regulations on sources of GHGs since the approval of the Climate Change Scoping Plan. Some of the more notable regulations include the Low Carbon Fuel Standard (LCFS) and regulations affecting vehicle efficiency such as the Tire Pressure Program, Low Friction Oil, and Heavy-Duty Vehicle Aerodynamic Efficiency Standards. Also important are CARB regulations that apply to high global warming potential consumer products and refrigerants. SB 734, which requires the Governor’s Office of Planning and Research (OPR) to amend the CEQA Guidelines to provide an alternative to level of service (LOS) for evaluating transportation impacts. The law requires that those alternative criteria promote the reduction of GHG, the development of multimodal transportation networks, and a diversity of land uses. In December of 2018, OPR released guidelines on evaluating traffic impacts in CEQA. The new guidelines replace the previous LOS metric with a VMT metric for determining a significant environmental impact under CEQA as they relate to traffic.
Regional Policies and Regulations
SB 375 Regional Targets and Sustainable Community Strategy (SCS). SB 375 aligns regional transportation planning efforts, regional GHG reduction targets, and affordable housing allocations. Metropolitan Planning Organizations (MPO) are required to adopt a Sustainable Communities Strategy (SCS), which allocates land uses in the Metropolitan Planning Organiza-tion Regional Transportation Plan (RTP). Qualified projects consistent with an approved SCS or Alternative Planning Strategy and categorized as “transit priority projects” would receive incentives under new provisions of CEQA.
In 2010, as part of its mandate under SB 375, the CARB set specific GHG emission reduction targets for cars and light trucks for each of the State’s 18 metropolitan planning organizations from a 2005 base year. The GHG targets set for the Fresno region in 2010 called for a 5 percent per capita reduction by 2020 and a 10 percent per capita reduction by 2035. SB 375 requires that Fresno Council of Governments (COG) demonstrate in its SCS that GHG emission reduction targets will be met for 2020 and 2035. If not, then an Alternative Planning Strategy (APS) shall

G E N E R A L P L A N F R E S N O , C A L I F O R N I A
R E C I R C U L A T E D P R O G R A M E N V I R O N M E N T A L I M P A C T R E P O R T P U B L I C R E V I E W D R A F T
M A R C H 2 0 2 1
4.8-14
be prepared to demonstrate how the targets can be met through the alternative strategies in the APS. These numbers are subject to changes due to model validation, calibration, and ongoing local coordination efforts. The MPO growth scenario focuses on existing core areas without expansion of the City of Fresno sphere of influence.15 Under the approved General Plan, growth would be distributed along major corridors and activity centers supported by a new Bus Rapid Transit (BRT) system and has a theme of complete neighborhoods to provide convenient access to different uses at the neighborhood level. The strategy relies on a combination of increasing density, mixed uses, and infill.
The Fresno COG developed an SCS to implement SB 375 requirements. The SCS, adopted by the Fresno COG on June 26, 2014 demonstrated that Fresno County will be able to achieve the GHG targets for light-duty vehicle travel adopted by the CARB for this area. In July 2018, the Fresno COG adopted second SCS based on the previous SCS adopted in 2014. Fresno COG’s 2018 RTP/SCS was approved by all reviewing Federal and State authorities, including the CARB. In the spring of 2018, CARB adopted new GHG targets for all the 18 MPOs in the State based on the 2017 Scoping Plan and other new data. CARB established a 13 percent GHG reduction target for 2035 for the Fresno region’s 2018 RTP/SCS. The State of California recognizes Fresno County’s contribution to the aggregate 15 percent Statewide GHG emission reduction is 13 percent. The Fresno COG would be able to meet the CARB GHG targets through 2018 RTP/SCS.16
San Joaquin Valley Blueprint. The San Joaquin Valley Blueprint Planning Process is an effort by agencies, organizations, and individuals, including the Fresno COG, to identify visions, values, guiding principles, and alternative growth scenarios for development over a 20-year planning horizon. The 2018 RTP/SCS continues the blueprint development process that started in 2006.
The adopted 12 Blueprint Smart Growth Principles from this process are:
1. Create a range of housing opportunities and choices.
2. Create walkable neighborhoods.
3. Encourage community and stakeholder collaboration.
4. Foster distinctive, attractive communities with a strong sense of place.
5. Make development decisions predictable, fair, and cost-effective.
6. Mix land uses.
15 California Air Resources Board (CARB). 2010. Proposed Regional Greenhouse Gas Reduction Targets for
Automobiles and Light Trucks Pursuant to Senate Bill 375. Website: ww3.arb.ca.gov/cc/sb375/staffreport_sb375080910.pdf?_ga=2.89934491.1048265486.1571767987-1056020676.1542733892.
16 Fresno COG. 2017. Fresno County 2050 Growth Projections. Prepared for Fresno County Council of Governments. Available online at: www.fresnocog.org/wp-content/uploads/publications/Demographics/Fresno_COG_2050_Projections_Final_Report_050417.pdf (accessed March 4, 2019).

R E C I R C U L A T E D P R O G R A M E N V I R O N M E N T A L I M P A C T R E P O R T P U B L I C R E V I E W D R A F T M A R C H 2 0 2 1
G E N E R A L P L A N F R E S N O , C A L I F O R N I A
4.8-15
7. Preserve open space, farmland, natural beauty, and critical environmental areas.
8. Provide a variety of transportation choices.
9. Strengthen and direct development towards existing communities.
10. Take advantage of compact building design.
11. Enhance the economic vitality of the region.
12. Support actions that encourage environmental resource management.
Fresno County’s Blueprint Vision is as follows:
• Fresno county will be composed of unique cities, communities and a diverse population in a connected high quality environment that accommodates anticipated population growth and is supported by:
○ A vibrant economy built on competitive strength and world class education;
○ A healthy and sustainable environment where air, aquifers, surface waters, forests, soil, agriculture, open space and wildlife resources are enhanced and protected; and
○ A focus on cultural and community stewardship where all people enjoy fundamental rights as members of a free society, and where the community takes ownership of problems and their solutions.
The form of the Fresno region blueprint recognizes its economic, environmental, and cultural connectedness while maintaining a system of high-capacity multimodal transportation corridors that link the metro area to the rural areas and the State while preserving and maintaining the character of individual communities and the vital agricultural and natural resources between and around them.17
The Blueprint preferred scenario would result in countywide average residential density of 8.0 dwelling units/acre for new growth between now and 2050. The density of new growth in the Fresno Clovis Metropolitan Areas (FCMA) will be 9.0 units/acre, while the average density of new development in the non-FCMA areas will be around 5.7 units/acre. This is comparable with the current trend density for Fresno cCounty of 3.8 dwelling units/acre.18
San Joaquin Valley Air Pollution Control District. The city of Fresno is located within the San Joaquin Valley Air Basin, which is under the jurisdiction of the San Joaquin Valley Air Pollution Control
17 Fresno COG. 2009. San Joaquin Valley Blueprint. Council of Fresno County of Governments. Available
online at: www.fresnocog.org/wp-content/uploads/files/Blueprint/ProgressReport/Fresno%20County%20BP%20Document%20Revised%20Final%2007_27_09.pdf.
18 Ibid.

G E N E R A L P L A N F R E S N O , C A L I F O R N I A
R E C I R C U L A T E D P R O G R A M E N V I R O N M E N T A L I M P A C T R E P O R T P U B L I C R E V I E W D R A F T
M A R C H 2 0 2 1
4.8-16
District (District). The District has regulatory authority over certain stationary and industrial GHG emission sources and provides voluntary technical guidance on addressing GHGs for other emission sources in a CEQA context. District initiatives related to GHGs are described below.
Climate Change Action Plan. The District Governing Board approved the San Joaquin Valley Air Pollution Control District Climate Change Action Plan (CCAP) on August 21, 2008. The CCAP began a public process to bring together stakeholders, land use agencies, environmental groups, and business groups, and to conduct public workshops to develop comprehensive policies for CEQA Guidelines, a carbon exchange bank, and voluntary GHG emissions mitigation agreements for the Governing Board’s consideration. The CCAP contains the following goals and actions:
Goals
13. Assist local land-use agencies with California Environmental Quality Act (CEQA) issues relative to projects with GHG emissions increases.
14. Assist Valley businesses in complying with mandates of AB 32 (Global Warming Solutions Act of 2006).
15. Ensure that climate protection measures do not cause increases in toxic or criteria pollutants that adversely impact public health or environmental justice communities.
Actions
1. Develop GHG significance threshold(s) or other mechanisms to address CEQA projects with GHG emissions increases.
2. Develop necessary regulations and instruments for establishment and administration of the San Joaquin Valley Carbon Exchange Bank for voluntary GHG reductions created in the Valley.
3. Enhance the District’s existing criteria pollutant emissions inventory reporting system to allow businesses subject to AB 32 emission reporting requirements to submit simultaneous streamlined reports to the District and the state of California with minimal duplication.
4. Develop and administer voluntary GHG emission reduction agreements to mitigate proposed GHG increases from new projects.
CEQA Greenhouse Gas Guidance. The District developed several resource documents that were used as guidance for developing the GHG Plan. The most important is the Guidance for Valley Land-use Agencies in Addressing GHG Emission Impacts for New Projects under CEQA, which is intended to assist local agencies in complying with CEQA and which contains a GHG threshold approach that has been widely accepted for use in the San Joaquin Valley and in other parts of the State. The District concluded that the existing science is inadequate to support quantifica-tion of the impacts that project-specific GHG emissions have on global climatic change. The District found the effects of project-specific emissions to be cumulative, and without mitigation,

R E C I R C U L A T E D P R O G R A M E N V I R O N M E N T A L I M P A C T R E P O R T P U B L I C R E V I E W D R A F T M A R C H 2 0 2 1
G E N E R A L P L A N F R E S N O , C A L I F O R N I A
4.8-17
their incremental contribution to global climatic change could be considered cumulatively considerable. The District found that this cumulative impact is best addressed by requiring all projects to reduce their GHG emissions, whether through project design elements or mitigation. Many San Joaquin Valley local jurisdictions, including Fresno, have used the District guidance for CEQA compliance.
The primary features of the District’s approach include:
• Projects exempt from the requirements of CEQA, and projects complying with an approved plan or mitigation program would be determined to have a less than significant cumulative impact. The GHG Plan is intended to meet the criteria as an approved plan or mitigation program.
• Projects for which there is no applicable approved plan or program, or those projects not complying with an approved plan or program, the lead agency would evaluate the project against a performance-based standards and would require the adoption of design elements, known as a Best Performance Standard, to reduce GHG emissions.
• Projects incorporating Best Performance Standards would not require specific quantification of GHG emissions, and automatically would be determined to have a less than significant cumulative impact for GHG emissions.
San Joaquin Valley Carbon Exchange and Rule 2301. The District initiated work on the San Joaquin Valley Carbon Exchange in November 2008. The Exchange was implemented with the adoption of Amendments to Rule 2301 Emission Reduction Credit Banking on January 19, 2012. The purpose of the carbon exchange is to quantify, verify, and track voluntary GHG emissions reductions generated within the San Joaquin Valley.
The District incorporated a method to register voluntary GHG emission reductions with amendments to Rule 2301. The purposes of the amendments to the rule include the following:
• Provide an administrative mechanism for sources to bank voluntary GHG emission reductions for later use.
• Provide an administrative mechanism for sources to transfer banked GHG emission reductions to others for any use.
• Define eligibility standards, quantitative procedures, and administrative practices to ensure that banked GHG emission reductions are real, permanent, quantifiable, surplus, and enforceable.
The District is participating in a new program developed by the California Air Pollution Control Officers Association (CAPCOA) to encourage banking and use of GHG reduction credits referred to as the CAPCOA Greenhouse Gas Reduction Exchange (GHGRx). The GHGRx provides information on GHG credit projects within participating air districts. The District is one of the first to have offsets available for trading on the Exchange.

G E N E R A L P L A N F R E S N O , C A L I F O R N I A
R E C I R C U L A T E D P R O G R A M E N V I R O N M E N T A L I M P A C T R E P O R T P U B L I C R E V I E W D R A F T
M A R C H 2 0 2 1
4.8-18
Community Emissions Reductions Program: Assembly Bill 617. AB 617 requires the CARB and air districts to develop and implement a Community Emission Reduction Plan (CERP) with additional emissions reporting, monitoring, and reduction plans and measures in an effort to reduce air pollution exposure in disadvantaged communities. Given that 20 of the 30 most disadvantaged communities in California are in the San Joaquin Valley, this process is expected to bring additional clean air resources and strategies to many Valley communities.
South Central Fresno and the City of Shafter are the first Valley communities selected by the California Air Resources Board for investment of additional resources under AB 617. The Valley Air District has established a steering committee for each of these communities comprised of community residents, business owners, community advocates, and government representatives to assist in the development and implementation of community air monitoring and emission reduction programs. The Fresno Community Emissions Reduction Plan (CERP) was adopted by the San Joaquin Valley Air Pollution Control District Board in the fall of 2019.
4.8.5.3 Local Policies and Regulations
The following is a summary of the applicable policies included in the City’s Greenhouse Gas Reduction Plan and approved General Plan that are related to GHGs and applicable to the proposed project.
Greenhouse Gas Reduction Plan Update. The 2014 Greenhouse Gas Reduction Plan (GHG Plan) provided a comprehensive assessment of the benefits of these General Plan and Development Code policies along with existing plans, programs, and initiatives that reduce GHG emissions. In addition, the GHG Plan includes an emission reduction target for demonstrating consistency with State GHG reduction targets. The analysis prepared to quantify GHG emissions and emission reductions provides the basis for the GHG Plan targets and for CEQA significance findings of implementing the approved General Plan and the GHG Plan. The Greenhouse Gas Reduction Plan Update (GHG Plan Update, 2020) was prepared to re-evaluate the City’s existing GHG reduction targets and strategies. The GHG Plan Update provides new goals and supporting measures to reflect and ensure compliance with changes in the local and State policies while ensuring it encourages economic growth and keeps the city economically competitive while achieving GHG reductions and maintaining the “CEQA Qualified Plan” status.
CEQA Guidelines for Vehicle Miles Traveled Thresholds. In June 2020, the City adopted VMT thresholds and guidelines to address the shift from delay-based LOS CEQA traffic analyses to VMT CEQA traffic analyses, as required by SB 743. The City’s document serves as a detailed guideline for preparing VMT analyses consistent with SB 743 requirements for development projects, transportation projects, and plans. Project applicants will be required to follow the guidance provided in this document for preparation of CEQA VMT analysis. The document includes the following:
• Definition of region for VMT analysis;
• Standardized screening methods for VMT threshold compliance data;

R E C I R C U L A T E D P R O G R A M E N V I R O N M E N T A L I M P A C T R E P O R T P U B L I C R E V I E W D R A F T M A R C H 2 0 2 1
G E N E R A L P L A N F R E S N O , C A L I F O R N I A
4.8-19
• Recommendations for appropriate VMT significance thresholds for development projects, transportation projects, and plans; and
• Feasible mitigation strategies applicable for development projects, transportation projects, and plans.
City of Fresno General Plan. The approved General Plan is a set of policies and programs that form a blueprint for the physical development of the city. For a description of each of the elements within the approved General Plan, refer to Chapter 3.0, Project Description. The following objectives and policies related to GHGs are presented in various elements of the approved General Plan:
Urban Form, Land Use, and Design Element
Policy UF-1-c: Identifiable City Structure. Focus integrated and ongoing planning efforts to achieve an identifiable city structure, comprised of a concentration of buildings, people, and pedestrian-oriented activity in Downtown; along a small number of transit-oriented, mixed-use corridors and strategically located Activity Centers; and in existing and new neighborhoods augmented with parks and connected by multi-purpose trails and tree lined bike lanes and streets.
Objective UF‐12: Locate roughly one-half of future residential development in infill areas—defined as being within the City on December 31, 2012—including the Downtown core area and surrounding neighborhoods, mixed-use centers and transit-oriented development along major BRT corridors, and other non-corridor infill areas, and vacant land.
Commentary: The Planning Director will provide an annual report describing the City’s compliance with the Plan and progress toward meeting the goals and objectives to City Council, and prepare, every five years, an updated plan for achieving this goal, with recommended appropriate policy amendments and also new implementation strategies necessary to meet this goal by 2035. The rate of progress toward meeting this goal is not expected to occur in a linear or “one-to-one” pattern. Development in infill areas versus growth areas may progress in an uneven pattern, depending upon the schedule of relevant key incentive programs (such as those related to BRT) and the impact of market forces. However, the City expects to make steady progress toward all the goals and objectives and anticipates meeting them at or near the close of General Plan Horizon in 2035. See the Implementation Element for additional implementation strategies for this objective.
Policy UF-12-a: BRT Corridors. Design land uses and integrate development site plans along BRT corridors, with transit-oriented development that supports transit ridership and convenient pedestrian access to bus stops and BRT station stops.
Commentary: Developments close to major streets encourages walking and can be connected with the adjacent neighborhoods through a network of pedestrian ways. Parking will be concealed from the street, and predominant residential uses will be considered an acceptable use in all mixed-use areas.
G E N E R A L P L A N F R E S N O , C A L I F O R N I A
R E C I R C U L A T E D P R O G R A M E N V I R O N M E N T A L I M P A C T R E P O R T P U B L I C R E V I E W D R A F T
M A R C H 2 0 2 1
4.8-20
Policy UF-12-b: Activity Centers. Mixed-use designated areas along BRT and/or transit corridors are appropriate for more intensive concentrations of urban uses. Typical uses could include commercial areas; employment centers; schools; compact residential development; religious institutions; parks; and other gathering points where residents may interact, work, and obtain goods and services in the same place.
Commentary: Activity Centers are typified by a full range of uses, including residential, retail, employment, education, recreation, public amenities, and/or open space features. Near the mixed-use central area of the Activity Center, there are typically higher residential densities, typically 15 to 45 dwelling units per acre, but away from the center of the Activity Center, uses become predominantly residential at lower densities.
Policy UF-12-d: Appropriate Mixed-Use. Facilitate the development of vertical and horizontal mixed-uses to blend residential, commercial, and public land uses on one or adjacent sites. Ensure land use compatibility between mixed-use districts in Activity Centers and the surrounding residential neighborhoods.
Commentary: Vertical mixed-use may be achieved within the same building with multiple compatible uses in multiple stories, and horizontal mixed use may be achieved across an integrated development site with a mix of compatible and complementary uses housed in different buildings.
Policy UF-12-e: Access to Activity Centers. Promote adoption and implementation of standards supporting pedestrian activities and bicycle linkages from surrounding land uses and neighborhoods into Activity Centers and to transit stops. Provide for priority transit routes and facilities to serve the Activity Centers.
Policy UF-12-f: Mixed-Use in Activity Centers. Adopt a new Development Code which includes use regulations and standards to allow for mixed-uses and shared parking facilities.
Objective UF‐14: Create an urban form that facilitates multi-modal connectivity.
Commentary: Multi-modal connectivity creates the opportunity for people to travel through a variety of modes of transportation, including biking, walking, driving, and using public transit.
Policy UF-14-a: Design Guidelines for Walkability. Develop and use design guidelines and standards for a walkable and pedestrian-scaled environment with a network of streets and connections for pedestrians and bicyclists, as well as transit and autos.
Commentary: These guidelines will highlight how to achieve these design ideas and avoid barriers to access, such as:
○ Walls and fences that separate related uses or isolate neighborhoods;
○ Over reliance on cul-de-sacs and dead end streets that cut off access within neighborhoods;

R E C I R C U L A T E D P R O G R A M E N V I R O N M E N T A L I M P A C T R E P O R T P U B L I C R E V I E W D R A F T M A R C H 2 0 2 1
G E N E R A L P L A N F R E S N O , C A L I F O R N I A
4.8-21
○ Disconnected bike and pedestrian paths;
○ Wide streets that lack pedestrian support, such as sidewalks, median strips, and a landscaped strip that separates pedestrians from the street;
○ Street front parking lots that separate pedestrian from commercial operations;
○ Retail centers that are exclusively auto-oriented;
○ Transit stops that are not easily accessible from an individual’s starting point and destination; and
○ Long blocks that discourage walking.
Policy UF-14-b: Local Street Connectivity. Design local roadways to connect throughout neighborhoods and large private developments with adjacent major roadways and pathways of existing adjacent development. Create access for pedestrians and bicycles where a local street must dead end or be designed as a cul-de-sac to adjoining uses that provide services, shopping, and connecting pathways for access to the greater community area.
Policy UF-14-c: Block Length. Create development standards that provide desired and maximum block lengths in residential, retail, and mixed-use districts in order to enhance walkability.
Commentary: When preparing such standards the City should assess the desirability of varying maximum block length requirements between single family residential, multi-family residential, mixed use, and commercial districts.
Objective LU‐2: Plan for infill development that includes a range of housing types, building forms, and land uses to meet the needs of both current and future residents.
Policy LU-2-a: Infill Development and Redevelopment. Promote development of vacant, underdeveloped, and re-developable land within the City Limits where urban services are available by considering the establishment and implementation of supportive regulations and programs.
Policy LU-2-b: Infill Development for Affordable Housing. Establish a priority infill incentive program for residential infill development of existing vacant lots and underutilized sites within the City as a strategy to help to meet the affordable housing needs of the community.
Policy LU-3-b: Mixed-Use Urban Corridors that Connect the Downtown Planning Area. Support the development of mixed-use urban corridors that connect the Downtown Planning Area with the greater Fresno-Clovis Metropolitan Area with functional, enduring, and desirable urban qualities along the Blackstone Avenue, Shaw Avenue, California Avenue, and Ventura Avenue/Kings Canyon Road corridors, as shown on Figure LU-1: General Plan Land Use Diagram.

G E N E R A L P L A N F R E S N O , C A L I F O R N I A
R E C I R C U L A T E D P R O G R A M E N V I R O N M E N T A L I M P A C T R E P O R T P U B L I C R E V I E W D R A F T
M A R C H 2 0 2 1
4.8-22
Policy LU-3-c: Zoning for High Density on Major BRT Corridors. Encourage adoption of supportive zoning regulations for compact development along BRT corridors leading to the Downtown Core that will not diminish the long-term growth and development potential for Downtown.
Policy LU-5-f: High Density Residential Uses. Promote high-density residential uses to support Activity Centers and BRT Corridors, and walkable access to transit stops.
Policy D-3-c: Local Streets as Urban Parkways. Develop local streets as "urban parkways,” where appropriate, with landscaping and pedestrian spaces.
Policy D-4-b: Incentives for Pedestrian-Oriented Anchor Retail. Consider adopting and implementing incentives for new pedestrian-friendly anchor retail at intersections within Activity Centers and along corridors to attract retail clientele and maximize foot traffic.
Commentary: Examples of incentives include increased floor area ratios, deferred impact fees, and priority processing.
Mobility and Transportation Element
Policy MT-1-h: Update Standards for Complete Streets. Update the City’s Engineering and Street Design Standards to ensure that roadway and streetscape design specifications reflect the Complete Streets concept, while also addressing the needs of through traffic, transit stops, bus turnouts, passenger loading needs, bike lanes, pedestrian accommodation, and short- and long-term parking.
Commentary: For instance, transit stops and bus turnouts may have higher priority than through traffic on important transit corridors; through traffic may have higher priority than parking on Arterials; and pedestrian and bicycle movement may have high priority in areas with high pedestrian interest and activity such as the Downtown Planning Area.
Policy MT-1-i: Local Street Standards. Establish and implement local roadway standards addressing characteristics such as alignment, width, continuity and traffic calming, to provide efficient neighborhood circulation; to allow convenient access by residents, visitors, and public service and safety providers; and to promote neighborhood integrity and desired quality of life by limiting intrusive pass-through traffic.
Policy MT-1-j: Transportation Improvements Consistent with Community Character. Prioritize transportation improvements that are consistent with the character of surrounding neighborhoods and supportive of safe, functional and Complete Neighborhoods; minimize negative impacts upon sensitive land uses such as residences, hospitals, schools, natural habitats, open space areas, and historic and cultural resources.
• In implementing this policy, the City will design improvements to:
• Facilitate provision of multi-modal transportation opportunities;
R E C I R C U L A T E D P R O G R A M E N V I R O N M E N T A L I M P A C T R E P O R T P U B L I C R E V I E W D R A F T M A R C H 2 0 2 1
G E N E R A L P L A N F R E S N O , C A L I F O R N I A
4.8-23
• Provide added safety, including appropriate traffic calming measures;
• Promote achievement of air quality standards;
• Provide capacity in a cost effective manner; and
• Create improved and equitable access with increased efficiency and connectivity.
Objective MT‐4: Establish and maintain a continuous, safe, and easily accessible bikeways system throughout the metropolitan area to reduce vehicle use, improve air quality and the quality of life, and provide public health benefits.
Policy MT-4-a: Active Transportation Plan. To the extent consistent with this General Plan, continue to implement and periodically update the Active Transportation Plan to meet State standards and requirements for recommended improvements and funding proposals as determined appropriate and feasible.
Policy MT-4-b: Bikeway Improvements. Establish and implement property development standards to assure that projects adjacent to designated bikeways provide adequate right-of-way and that necessary improvements are constructed to implement the planned bikeway system shown on Figure MT-2 to provide for bikeways, to the extent feasible, when existing roadways are reconstructed; and alternative bikeway alignments or routes where inadequate right-of-way is available.
Policy MT-4-c: Bikeway Linkages. Provide linkages between bikeways, trails and paths, and other regional networks such as the San Joaquin River Trail and adjacent jurisdiction bicycle systems wherever possible.
Objective MT‐5: Establish a well-integrated network of pedestrian facilities to accommodate safe, convenient, practical, and inviting travel by walking, including for those with physical mobility and vision impairments.
Policy MT-5-a: Sidewalk Development. Pursue funding and implement standards for development of sidewalks on public streets, with priority given to meeting the needs of persons with physical and vision limitations; providing safe routes to school; completing pedestrian improvements in established neighborhoods with lower vehicle ownership rates; or providing pedestrian access to public transportation routes.
Policy MT-5-e: Traffic Management in Established Neighborhoods. Establish acceptable design and improvement standards and provide traffic planning assistance to established neighborhoods to identify practical traffic management and calming methods to enhance the pedestrian environment with costs equitably assigned to properties receiving the benefits or generating excessive vehicle traffic.
Objective MT‐6: Establish a network of multi-purpose pedestrian and bicycle paths, as well as limited access trails, to link residential areas to local and regional open spaces and recreation

G E N E R A L P L A N F R E S N O , C A L I F O R N I A
R E C I R C U L A T E D P R O G R A M E N V I R O N M E N T A L I M P A C T R E P O R T P U B L I C R E V I E W D R A F T
M A R C H 2 0 2 1
4.8-24
areas and urban Activity Centers in order to enhance Fresno's recreational amenities and alternative transportation options.
Policy MT-6-a: Link Residences to Destinations. Design a pedestrian and bicycle path network that links residential areas with Activity Centers, such as parks and recreational facilities, educational institutions, employment centers, cultural sites, and other focal points of the city environment.
Policy MT-6-g: Path and Trail Development. Require all projects to incorporate planned multi-purpose path and trail development standards and corridor linkages consistent with the General Plan, applicable law and case-by-case determinations as a condition of project approval.
Commentary: This should be done pursuant to Figure MT-2: Paths and Trails, and the adopted ATP, as amended.
Policy MT-6-l: Environmentally Sensitive Path and Trail Design. Develop paths and trails with minimum environmental impact by taking the following actions:
• Surface paths and trails with materials that are conducive to maintenance and safe travel, choosing materials that blend in with the surrounding area;
• Design paths and trails to follow contour lines where the least amount of grading (fewest cuts and fills) and least disturbance of the surrounding habitat will occur;
• Beautify path and trail rights-of-way in a manner consistent with intended use, safety, and maintenance;
• Use landscaping to stabilize slopes, create physical or visual barriers, and provide shaded areas; and
• Preserve and incorporate native plant species into the landscaping.
Objective MT‐8: Provide public transit options that serve existing and future concentrations of residences, employment, recreation and civic uses and are feasible, efficient, safe, and minimize environmental impacts.
Commentary: Public transit services must meet accessibility standards for individuals with disabilities as required by applicable state and federal regulations.
Policy MT-8-a: Street Design Coordinated with Transit. Coordinate the planning, design, and construction of the major roadway network with transit operators to facilitate efficient direct transit routing throughout the Planning Area.

R E C I R C U L A T E D P R O G R A M E N V I R O N M E N T A L I M P A C T R E P O R T P U B L I C R E V I E W D R A F T M A R C H 2 0 2 1
G E N E R A L P L A N F R E S N O , C A L I F O R N I A
4.8-25
Commentary: Neighborhoods with circuitous and discontinuous streets are more difficult for public transit to serve efficiently than those with consistently spaced linear or semi-grid patterns.
Policy MT-8-b: Transit Serving Residential and Employment Nodes. Identify the location of current and future residential and employment concentrations and Activity Centers throughout the transit service area in order to facilitate planning and implementation of optimal transit services for these uses. Work with California State University, Fresno to determine locations within the campus core for bus stops.
Policy MT-8-g: High Speed Train. If the State moves forward with HST, ensure it is constructed through Fresno in a manner that minimizes impacts to surrounding property owners and creates the most opportunity for redevelopment around the HST station.
Objective MT‐9: Provide public transit opportunities to the maximum number and diversity of people practicable in balance with providing service that is high in quality, convenient, frequent, reliable, cost-effective, and financially feasible.
Policy MT-10-a: Updating Parking Standards. Update off-street parking standards to reflect the context and location within activity areas of multiple uses and reductions appropriate for mixed residential and non-residential uses and proximity to existing or planned transit service.
Policy MT-10-b: Shared Parking. Establish a strategy to promote the sharing of excess parking between uses within Activity Centers and BRT corridors, including specific provisions for this in the Development Code.
Policy MT-10-c: Transportation Demand Management Guidelines. Establish transportation demand management guidelines to allow for reduced off-street parking requirements.
Policy MT-10-d: Parking Maximums. Explore maximum off-street parking limits within Activity Centers proximate to BRT corridors, if such an Activity Center is determined compatible with promotion of a healthy and vigorous business environment.
Policy MT-10-f: Parking Benefit Districts. Establish parking benefit districts to fund consolidated public parking where supported by local businesses.
Commentary: Net revenues collected from on-street parking pricing and permit revenues can be dedicated to funding public improvements within designated Parking Benefit Districts, ensuring that revenue is used to benefit the blocks where the money is collected. State laws provide for public parking facility construction, operation and maintenance.
Parks, Open Space, and Schools Element

G E N E R A L P L A N F R E S N O , C A L I F O R N I A
R E C I R C U L A T E D P R O G R A M E N V I R O N M E N T A L I M P A C T R E P O R T P U B L I C R E V I E W D R A F T
M A R C H 2 0 2 1
4.8-26
Policy POSS-1-g: Regional Urban Forest. Maintain and implement incrementally, through new development projects, additions to Fresno’s urban forest to delineate corridors and the boundaries of urban areas, and to provide tree canopy for bike lanes, sidewalks, parking lots, and trails.
Policy POSS-7-h: Interlink City and San Joaquin River Parkway Trail Networks. Strive to connect the parkway trail network to other trails in the vicinity, in order to create a community and regional trail system that offers a variety of different route combinations and enhances public access to the parkway.
Public Utilities Element
Objective PU‐7: Promote reduction in wastewater flows and develop facilities for beneficial reuse of reclaimed water and biosolids for management and distribution of treated wastewater.
Policy PU-7-a: Reduce Wastewater. Identify and consider implementing water conservation standards and other programs and policies, as determined appropriate, to reduce wastewater flows.
Policy PU-7-d: Wastewater Recycling. Pursue the development of a recycled water system and the expansion of beneficial wastewater recycling opportunities, including a timely technical, practicable, and institutional evaluation of treatment, facility siting, and water exchange elements.
Commentary: This policy corresponds with Policy RC-6-d in the Resource Conservation and Resilience Element.
Policy PU-9-a: New Techniques. Continue to collaborate with affected stakeholders and partners to identify and support programs and new techniques of solid waste disposal, such as recycling, composting, waste to energy technology, and waste separation, to reduce the volume and toxicity of solid wastes that must be sent to landfill facilities.
Policy PU-9-b: Compliance with State Law. Continue to pursue programs to maintain conformance with the Solid Waste Management Act of 1989 or as otherwise required by law and mandated diversion goals.
Resource Conservation and Resilience Element
Objective RC‐2: Promote land uses that conserve resources.
Policy RC-2-a: Link Land Use to Transportation. Promote mixed-use, higher density infill development in multi-modal corridors. Support land use patterns that make more efficient use of the transportation system and plan future transportation investments in areas of higher-intensity development. Discourage investment in infrastructure that would not meet these criteria.

R E C I R C U L A T E D P R O G R A M E N V I R O N M E N T A L I M P A C T R E P O R T P U B L I C R E V I E W D R A F T M A R C H 2 0 2 1
G E N E R A L P L A N F R E S N O , C A L I F O R N I A
4.8-27
Policy RC-2-b: Provide Infrastructure for Mixed-Use and Infill. Promote investment in the public infrastructure needed to allow mixed-use and denser infill development to occur in targeted locations, such as expanded water and wastewater conveyance systems, complete streetscapes, parks and open space amenities, and trails. Discourage investment in infrastructure that would not meet these criteria.
Policy RC‐4‐c: Evaluate Impacts with Models. Continue to require the use of computer models used by SJVAPCD to evaluate the air quality impacts of plans and projects that require such environmental review by the City.
Policy RC-4-i: Methane Capture. Continue to pursue opportunities to reduce air pollution by using methane gas from the old City landfill and the City’s wastewater treatment process.
Objective RC‐5: In cooperation with other jurisdictions and agencies in the San Joaquin Valley Air Basin, take timely, necessary, and the most cost-effective actions to achieve and maintain reductions in greenhouse gas emissions and all strategies that reduce the causes of climate change in order to limit and prevent the related potential detrimental effects upon public health and welfare of present and future residents of the Fresno community.
Policy RC-5-a: Support State Goal to Reduce Statewide GHG Emissions. As is consistent with State law, strive to meet AB 32 goal to reduce greenhouse gas emissions to 1990 levels by 2020 and strive to meet a reduction of 80 percent below 1990 levels by 2050 as stated in Executive Order S-03-05. As new statewide GHG reduction targets and dates are set by the State update the City’s Greenhouse Gas Reduction Plan to include a comprehensive strategy to achieve consistency with those targets by the dates established.
Policy RC-5-b: Greenhouse Gas Reduction Plan. As is consistent with State law, prepare and adopt a Greenhouse Gas Reduction Plan as part of the Master Environmental Impact Report to be concurrently approved with the Fresno General Plan in order to achieve compliance with State mandates, assist development by streamlining the approval process, and focus on feasible actions the City can take to minimize the adverse impacts of growth and development on global climate change. The Greenhouse Gas Reduction Plan shall include, but not be limited to:
• A baseline inventory of all known or reasonably discoverable sources of GHGs that currently exist in the city and sources that existed in 1990.
• A projected inventory of the GHGs that can reasonably be expected to be emitted from those sources in the year 2035 with implementation of this General Plan and foreseeable communitywide and municipal operations.
• A target for the reduction of emissions from those identified sources.
• A list of feasible GHG reduction measures to meet the reduction target, including energy conservation and “green building” requirements in municipal buildings and private development.

G E N E R A L P L A N F R E S N O , C A L I F O R N I A
R E C I R C U L A T E D P R O G R A M E N V I R O N M E N T A L I M P A C T R E P O R T P U B L I C R E V I E W D R A F T
M A R C H 2 0 2 1
4.8-28
• Periodically update municipal and community-wide GHG emissions inventories to determine the efficacy of adopted measures and to guide future policy formulation needed to achieve and maintain GHG emissions reduction targets.
Policy RC-5-c: GHG Reduction through Design and Operations. Increase efforts to incorporate requirements for GHG emission reductions in land use entitlement decisions, facility design, and operational measures subject to City regulation through the following measures and strategies:
• Promote the expansion of incentive-based programs that involve certification of projects for energy and water efficiency and resiliency. These certification programs and scoring systems may include public agency “Green” and conservation criteria, Energy Star™ certification, CALGreen Tier 1 or Tier 2, Leadership in Energy Efficient Design (LEED™) certification, etc.
• Promote appropriate energy and water conservation standards and facilitate mixed-use projects, new incentives for infill development, and the incorporation of mass transit, bicycle and pedestrian amenities into public and private projects.
• Require energy and water audits and upgrades for water conservation, energy efficiency, and mass transit, pedestrian, and bicycle amenities at the time of renovation, change in use, change in occupancy, and change in ownership for major projects meeting review thresholds specified in an implementing ordinance.
• Incorporate the City’s “Guidelines for Ponding Basin/Pond Construction and Management to Control Mosquito Breeding” as conditions of approval for any project using an on-site stormwater basin to prevent possible increases in vector-borne illnesses associated with global climate change.
• Periodically evaluate the City’s facility maintenance practices to determine whether there are additional opportunities to reduce GHGs through facility cleaning and painting, parks maintenance, road maintenance, and utility system maintenance.
• Periodically evaluate standards and mitigation strategies for highly vehicle-dependent land uses and facilities, such as drive-through facilities and auto-oriented development.
Policy RC-5-d: SCS and CAP Conformity Analysis. Ensure that the City includes analysis of a project’s conformity to an adopted regional Sustainable Community Strategy or Alternative Planning Strategy (APS), an adopted Climate Action Plan (CAP), and any other applicable City and regional greenhouse gas reduction strategies in affect at the time of project review.
Policy RC-5-e: Ensure Compliance. Ensure ongoing compliance with GHG emissions reduction plans and programs by requiring that air quality measures are incorporated into projects’ design, conditions of approval, and mitigation measures.
R E C I R C U L A T E D P R O G R A M E N V I R O N M E N T A L I M P A C T R E P O R T P U B L I C R E V I E W D R A F T M A R C H 2 0 2 1
G E N E R A L P L A N F R E S N O , C A L I F O R N I A
4.8-29
Policy RC-5-f: Toolkit. Provide residents and project applicants with a “toolkit” of generally feasible measures that can be used to reduce GHG emissions, including educational materials on energy-efficient and “climate-friendly” products.
Policy RC-5-g: Evaluate Impacts with Models. Continue to use computer models such as those used by SJVAPCD to evaluate greenhouse gas impacts of plans and projects that require such review.
Policy RC-6-d: Recycled Water. Prepare, Adopt, and implement a City of Fresno Recycled Water Master Plan.
Commentary: This plan will expand the City’s wastewater recycling program by developing treatment, delivery, and users.
Objective RC-7: Promote water conservation through standards, incentives and capital investments.
Policy RC-7-a: Water Conservation Program Target. Maintain a comprehensive conservation program to help reduce per capita water usage in the city’s water service area to 243 gallons per capita per day (gpcd) by 2020 and 190 gpcd by 2035, by adopting conservation standards and implementing a program of incentives, design and operation standards, and user fees.
• Support programs that result in decreased water demand, such as landscaping standards that require drought-tolerant plants, rebates for water conserving devices and systems, turf replacement, xeriscape landscape for new homes, irrigation controllers, commercial/industrial/institutional water conserving programs, prioritized leak detection program, complete water system audit, landscape water audit and budget program, and retrofit upon resale ordinance.
• Implement the U.S. Bureau of Reclamation Best Management Practices for water conservation as necessary to maintain the City’s surface water entitlements.
• Adopt and implement policies in the event that an artificial lake is proposed for development.
• Work cooperatively toward effective uniform water conservation measures that would apply throughout the Planning Area.
• Expand efforts to educate the public about water supply issues and water conservation techniques.
Policy RC-7-c: Best Practices for Conservation. Require all City facilities and all new private development to follow U.S. Bureau of Reclamation Best Management Practices for water conservation, as warranted and appropriate.

G E N E R A L P L A N F R E S N O , C A L I F O R N I A
R E C I R C U L A T E D P R O G R A M E N V I R O N M E N T A L I M P A C T R E P O R T P U B L I C R E V I E W D R A F T
M A R C H 2 0 2 1
4.8-30
Policy RC-7-d: Update Standards for New Development. Continue to refine water saving and conservation standards for new development.
Policy RC-7-e: Retrofit City Facilities, and Consider Incentives Programs to Encourage Retrofitting of Other Existing Public and Private Residential and Non-Residential Facilities and Sites. Reduce water use in municipal buildings and City operations by developing a schedule and budget for the retrofit of existing municipal buildings with water conservation features, such as auto shut-off faucets and water saving irrigation systems. Prepare a comprehensive incentive program for other existing public and private residential and non-residential buildings and irrigation systems.
Policy RC-7-f: Implementation and Update Conservation Program. Continue to implement the City of Fresno Water Conservation Program, as may be updated, and periodically update restrictions on water uses, such as lawn and landscape watering and the filling of fountains and swimming pools, and penalties for violations. Evaluate the feasibility of a 2035 conservation target of 190 gpcd in the next comprehensive update of the City of Fresno Water Conservation Program.
Policy RC-7-g: Educate on State Requirements. Educate the residents and businesses of Fresno on the requirements of the California Water Conservation Act of 2009.
Policy RC-7-h: Landscape Water Conservation Standards. Refine landscape water conservation standards that will apply to new development installed landscapes, building on the State Model Water Efficient Landscape Ordinance and other State regulations.
• Evaluate and apply, as appropriate, augmented xeriscape, “water-wise,” and “green gardening” practices to be implemented in public and private landscaping design and maintenance.
• Facilitate implementation of the State’s Water Efficient Landscape Ordinance by developing alternative compliance measures that are easy to understand and observe.
Policy RC-7-i: PACE Financing. Develop a residential Property Assessed Clean Energy (PACE) program, if it is determined to be a feasible option, to help finance water efficiency and energy efficiency upgrades for property owners.
Commentary: The program would be administered by private parties.
Objective RC-8: Reduce the consumption of non-renewable energy resources by requiring and encouraging conservation measures and the use of alternative energy sources.
Policy RC-8-a: Existing Standards and Programs. Existing Standards and Programs. Continue existing beneficial energy conservation programs, including adhering to the California Energy Code in new construction and major renovations.

R E C I R C U L A T E D P R O G R A M E N V I R O N M E N T A L I M P A C T R E P O R T P U B L I C R E V I E W D R A F T M A R C H 2 0 2 1
G E N E R A L P L A N F R E S N O , C A L I F O R N I A
4.8-31
Policy RC-8-b: Energy Reduction Targets. Strive to reduce per capita residential electricity use to 1,800 kWh per year and non-residential electricity use to 2,700 kWh per year per capita by developing and implementing incentives, design and operation standards, promoting alternative energy sources, and cost-effective savings.
Commentary: These targets represent 28 and 30 percent reductions respectively, from the 2010 rate of consumption.
Policy RC-8-c: Energy Conservation in New Development. Consider providing an incentive program for new buildings that exceed California Energy Code requirements by fifteen percent.
Policy RC-8-d: Incentives. Establish an incentive program for residential developers who commit to building all of their homes to ENERGY STAR performance guidelines.
Commentary: See also Policy RC-7-j on PACE financing for energy efficient retrofits.
Policy RC-8-e: Energy Use Disclosure. Promote compliance with State law mandating disclosure of a building’s energy data and rating of the previous year to prospective buyers and lessees of the entire building or lenders financing the entire building.
Policy RC-8-f: City Heating and Cooling. Reduce energy use at City facilities by updating heating and cooling equipment and installing “smart lighting” where feasible and economically viable.
Policy RC-8-g: Revolving Energy Fund. Create a City Energy Fund which uses first year savings and rebates from completed City-owned energy efficiency projects to provide resources for additional energy projects. Dedicate this revolving fund to the sole use of energy efficiency projects that will pay back into the fund.
Policy RC-8-h: Solar Assistance. Identify and publicize information about financial mechanisms for private solar installations and provide over-the-counter permitting for solar installations meeting specified standards, which may include maximum size (in kV) of units that can be so approved.
Policy RC-8-j: Alternative Fuel Network. Support the development of a network of integrated charging and alternate fuel station for both public and private vehicles, and if feasible, open up municipal stations to the public as part of network development.
Policy RC-8-k: Energy Efficiency Education. Provide long-term and on-going education of homeowners and businesses as to the value of energy efficiency and the need to upgrade existing structures on the regular basis as technology improves and structures age.
Policy RC-11-a: Waste Reduction Strategies. Maintain current targets for recycling and re-use of all types of waste material in the city and enhance waste and wastewater

G E N E R A L P L A N F R E S N O , C A L I F O R N I A
R E C I R C U L A T E D P R O G R A M E N V I R O N M E N T A L I M P A C T R E P O R T P U B L I C R E V I E W D R A F T
M A R C H 2 0 2 1
4.8-32
management practices to reduce natural resource consumption, including the following measures:
• Continue to require recyclable material collection and storage areas in all residential development.
• Establish recycling collection and storage area standards for commercial and industrial facilities to size the recycling areas according to the anticipated types and amounts of recyclable material generated.
• Provide educational materials to residents on how and what to recycle and how to dispose of hazardous waste.
• Provide recycling canisters and collection in public areas where trash cans are also provided.
• Institute a program to evaluate major waste generators and identify recycling opportunities for their facilities and operations.
• Continue to partner with the California Integrated Waste Management Board on waste diversion and recycling programs and the CalMax (California Materials Exchange) program.
• Evaluate the feasibility of a residential, restaurant, and institutional food waste segregation and recycling program, to reduce the amount of organic material sent to landfill and minimize the emissions generated by decomposing organic material.
• Evaluate the feasibility of “carbon footprinting” for the City’s wastewater treatment facilities, biomass and composting operations, solid waste collection and recycling programs.
• Expand yard waste collection to divert compostable waste from landfills.
• Study the feasibility and cost-benefit analysis of a municipal composting program to collect and compost food and yard waste, including institutional food and yard waste, using the resulting compost matter for City park and median maintenance.
Policy RC-11-b: Zero Waste Strategy. Create a strategic and operations plan for fulfilling the City Council resolution committing the City to a Zero Waste goal.
4.8.6 Significance Criteria
The thresholds for greenhouse gas impacts used in this analysis are consistent with Appendix G of the State CEQA Guidelines. The proposed project may be deemed to have a significant impact with respect to aesthetics GHG emissions if it would:

R E C I R C U L A T E D P R O G R A M E N V I R O N M E N T A L I M P A C T R E P O R T P U B L I C R E V I E W D R A F T M A R C H 2 0 2 1
G E N E R A L P L A N F R E S N O , C A L I F O R N I A
4.8-33
GHG-1 Generate greenhouse gas emissions, either directly or indirectly, that may have a significant impact on the environment.
GHG-2 Conflict with an applicable plan, policy or regulation adopted for the purpose of reducing the emissions of greenhouse gases.
4.8.7 Impacts and Mitigation Measures
The following section presents a discussion of the impacts related to greenhouse gas emissions that could result from implementation of the approved General Plan. The section begins with the criteria of significance, which establish the thresholds to determine if an impact is significant. The latter part of this section presents the impacts associated with implementation of the approved General Plan and the recommended mitigation measures, if required. Mitigation measures are recommended, as appropriate, for significant impacts to eliminate or reduce them to a less-than-significant level. Cumulative impacts are also addressed.
4.8.7.1 Project Impacts
The following discussion describes the potential impacts related to greenhouse gas emissions that could result from implementation of the approved General Plan.
GHG‐1 The proposed project would generate greenhouse gas emissions, either directly or indirectly, that may have a significant impact on the environment.
The proposed project includes the Recirculated GHG Reduction Plan Update (20212020) for the City. That plan includes strategies to reduce greenhouse gas emissions that align with State targets.
The GHG Reduction Plan Update includes inventory projections for 202019, 2030, and 2035. The 2020 and 2030 forecast years are consistent with the goals identified in AB 32 and the 2017 Scoping Plan, which identify Statewide GHG reduction targets by 2020 and 2030. The 2035 forecast year corresponds to the approved General Plan horizon and will allow the City to develop long-term strategies to continue GHG reductions.
Business-as-usual (BAU) scenarios are commonly used in climate action planning to ensure that control measures are adequate to overcome the effects of cumulative growth in emissions by a target year. BAU is defined in the CARB AB 32 Scoping Plan as the forecasted GHG emissions through 2030 with existing policies and programs, but without any further action to reduce GHGs. BAU inventories allow for separate accounting of the benefits of regulations, strategies, and programs on future emissions.
The City’s BAU GHG emissions for 2020, 2030, and 2035 were projected based on 2016 Inventory Update data using population, households, and employment growth rate from the Fresno County
19 A 2020 emissions inventory has not been conducted for the City of Fresno, therefore projects were used
for 2020 based on the 2016 inventory and growth data.

G E N E R A L P L A N F R E S N O , C A L I F O R N I A
R E C I R C U L A T E D P R O G R A M E N V I R O N M E N T A L I M P A C T R E P O R T P U B L I C R E V I E W D R A F T
M A R C H 2 0 2 1
4.8-34
2050 Growth Projections developed by Fresno Council of Governments.20 The BAU inventory for each forecast year is provided in Table 4.8.C.
Table 4.8.C: City of Fresno 2016 Inventory Update and Business-as-Usual Projections
Sector 2016 (MT CO2e)
Percent of Total
2020 (MT CO2e)
Percent of Total
2030 (MT CO2e)
Percent of Total
2035 (MT CO2e)
Percent of Total
Transportation 1,520,052 52 1,594,888 52 1,798,498 51 1,909,852 52 Commercial Energy 524,838 18 557,142 18 627,373 18 657,379 18 Residential Energy 479,371 16 514,053 17 579,546 17 603,951 16 Fugitive Emissions 270,130 9 288,573 9 335,316 10 357,008 10 Solid Waste 119,167 4 127,303 4 147,923 4 157,493 4 Industrial Energy 10,055 <1% 10,506 <1% 11,528 <1% 12,035 <1% Agriculture 20 <1% 20 <1% 20 <1% 20 <1% Total 2,923,633 100 3,092,486 100 3,500,204 100 3,697,738 100 Source: ICLEI Local Governments for Sustainability, City of Fresno 2016 Inventory Update, 2018. Complied by LSA. MT CO2e = metric tons of carbon dioxide equivalent
The BAU inventories presented above show that in the absence of regulations and other measures to reduce GHG emissions, the city’s BAU emissions in 2020 are estimated to be 3,092,486 MT CO2e, or a 5.8 percent increase from 2016 emissions. By 2030, emissions are estimated to increase 19.7 percent from the 2016 level to 3,500,204 MT CO2e. By 2035, emissions are estimated to increase 26.5 percent from the 2016 level to 3,697,738 MT CO2e.
Applicable Laws, Regulations, Relevant Land Use Policies
Reductions from State Regulations. The State has enacted many regulations pursuant to the requirements in AB 32 that would reduce emissions within the city. The State’s strategy is detailed in the Climate Change Scoping Plan adopted by the CARB in November 2017. Scoping Plan strategies are primarily implemented through the adoption of regulations. The most important and applicable strategies from the previous iterations and most recent 2017 Scoping Plan are discussed below.
For details regarding the reduction estimates, see the calculations in Appendix H.
Motor Vehicles. The CARB has adopted many Scoping Plan measures for mobile sources as regulations both in the previous versions and most recent Scoping Plan.21 Only the measures that have been adopted or put into practice are included in this assessment. The following regulations are included:
20 Applied Development Economics. 2017. Fresno County 2050 Growth Projections. Prepared for Fresno
County Council of Governments. Available online at: www.fresnocog.org/wp-content/uploads/publications/Demographics/Fresno_COG_2050_Projections_Final_Report_050417.pdf (accessed October 2019). May 4.
21 California Air Resources Board (CARB). 2017. Scoping Plan. Available online at: ww3.arb.ca.gov/cc/scopingplan/scoping_plan_2017.pdf (accessed August 6, 2019).

R E C I R C U L A T E D P R O G R A M E N V I R O N M E N T A L I M P A C T R E P O R T P U B L I C R E V I E W D R A F T M A R C H 2 0 2 1
G E N E R A L P L A N F R E S N O , C A L I F O R N I A
4.8-35
• Pavley and Low Carbon Fuel Standard (LCFS). EMFAC2017 emission factors that include Pavley and the LCFS were used to estimate the impact of those regulations. In this way, the reductions from those measures are more specific than simply applying the statewide reduction estimates because the reductions in EMFAC take into account the variations between vehicle classes and region.
• Low Emission Vehicle (LEV) III Standards. The LEV III standards amend the exhaust and evaporative emission standards for passenger cars and light- and medium-duty trucks. The standards provide requirements for model years 2017 to 2025. The regulation applies to both criteria pollutant and GHG emissions. The standard drops GHG emission to 166 grams per mile, a reduction of 34 percent compared with 2016 levels. LEV III implements the Pavley II standards described in the Scoping Plan.
• Tire Pressure Program. This regulation is categorized under vehicle efficiency measures in the Scoping Plan. This regulation applies to automotive service providers performing or offering to perform automotive maintenance or repair services in California. This applies to passenger cars, light-duty trucks, medium-duty vehicles, and light heavy-duty trucks with gross vehicle weight ratings of less than or equal to 10,000 pounds.22 This measure is anticipated to reduce emissions by 0.5 percent for those vehicle types.
• Low Friction Oil. CARB indicates that this measure has been achieved in practice. It is assumed that this measure would apply to the same vehicle types as in the tire pressure program. This measure is anticipated to reduce emissions by 2.2 percent.
• Aerodynamic efficiency. This regulation improves the fuel efficiency of heavy-duty tractors that pull 53-foot or longer box-type trailers. Fuel efficiency is improved through improvements in tractor and trailer aerodynamics and the use of low rolling-resistance tires. This measure would reduce emissions by 2.1 percent from heavy-duty vehicles.
Energy. The State's strategy for reducing energy-related GHGs targets electric power utilities on the production side and energy efficiency on the consumer side. Two regulations are in place to reduce emissions from this source. The Renewable Portfolio Standard requires electric utilities to provide an increasing share of their energy from renewable sources with 33 percent by 2020, 60 percent by 2030, and 100 percent by 2045. Title 24 Energy Efficiency Standards for Residential and Non-Residential Buildings requires new structures to meet increasingly stringent energy efficiency standards. The California Green Building Code mandates increased water conservation that results in less electricity consumed to pump and transport water.
Renewable Portfolio Standard (RPS). The electricity emission factor was decreased to account for the renewable energy regulations, which require 33 percent renewable energy by the year 2020, 60 percent by 2030, and 73 percent by 2035, which is
22 California Air Resources Board (CARB). 2010 Tire Inflation Regulation. Website: ww3.arb.ca.gov/cc/tire-
pressure/tire-pressure.htm (accessed July 10, 2019).

G E N E R A L P L A N F R E S N O , C A L I F O R N I A
R E C I R C U L A T E D P R O G R A M E N V I R O N M E N T A L I M P A C T R E P O R T P U B L I C R E V I E W D R A F T
M A R C H 2 0 2 1
4.8-36
interpolated from the 100 percent by 2045 requirement. The average renewable energy use for 2005-2009 for PG&E was calculated as 12.6 percent.23 Based on an approxima-tion of electric generation from RPS-eligible sources divided by forecasted electricity retail sales for the year 2018, the Energy Commission estimates that 34 percent of California’s retail electricity sales in 2018 will be provided by RPS-eligible renewable resources. This shows that the State is already ahead of its 2020 goal.24
California Energy Code (Building Energy Efficiency Standards). Building energy efficiency standards are designed to ensure that new and existing buildings achieve energy efficiency and preserve outdoor and indoor environmental quality. These standards are contained in the California Code of Regulations (CCR) Title 24, Part 6, California Energy Code. The California Energy Commission (CEC) is required by State law to update energy efficiency standards every 3 years. The 2019 Standards, which will become effective in January 2020, are focused on achieving zero net energy (ZNE) homes by increasing energy efficiency and requiring solar photovoltaic (PV) systems for new homes.25
The reductions from the California Energy Code are applied to the energy consumption related emissions for new development and remodeling projects at existing buildings subject to the regulations. The benefits of the standards accrue as buildings subject to the standards are constructed to meet the standard applicable at the time. PG&E provided actual electricity and natural gas usage for 2008 through 2010, which reflect the benefits of all development subject to previous versions of the California Energy Code. New development would provide additional reductions as buildings are constructed to comply with the latest standards.
California Green Building Standard Code. Adopted in 2008 for the first time, CCR Title 24, Part 11 (California Green Building Standard Code [CALGreen]), became effective as a voluntary code on August 1, 2009. The State Building Standards Commission unanimously adopted mandatory requirements in the 2010 California Green Building Standards Code, which went into effect on January 1, 2011. The Code is a comprehensive and uniform regulatory code for all residential, commercial, and school buildings. The 2019 CALGreen went into effect on January 1, 20120. CALGreen is the first Statewide mandatory green building code and significantly raises the minimum environmental standards for construction of new buildings in California. The mandatory provisions in CALGreen will
23 California Public Utilities Commission. 2012. 2013 Building Energy Efficiency Standards. Available online
at: www.energy.ca.gov/2012publications/CEC-400-2012-004/CEC-400-2012-004-CMFREV2. PDF (accessed November 6, 2012).
24 California Energy Commission (CEC). 2018. California Energy Commission: Tracking Progress. Available online at: ww2.energy.ca.gov/renewables/tracking_progress/documents/renewable.pdf (accessed August 10, 2019).
25 California Energy Commission (CEC). 2019. Title 24, Part 6 and Associated Administrative Regulations. Building Energy Efficiency Standards for Residential and Nonresidential Buildings. Available online at: ww2.energy.ca.gov/2018publications/CEC-400-2018-020/CEC-400-2018-020-CMF.pdf (accessed August 8, 2019).

R E C I R C U L A T E D P R O G R A M E N V I R O N M E N T A L I M P A C T R E P O R T P U B L I C R E V I E W D R A F T M A R C H 2 0 2 1
G E N E R A L P L A N F R E S N O , C A L I F O R N I A
4.8-37
reduce the use of VOC-emitting materials, will strengthen water conservation, and will require construction waste recycling.
Refrigerants. The State has adopted several refrigerant management regulations that are anticipated to achieve substantial reductions. For example, CARB predicts that the regulations that will apply to large commercial refrigeration units will reduce emissions by more than 50 percent.
The predicted reduction in emissions from State measures on city of Fresno emissions is shown in Table 4.8.D.
Table 4.8.D: Reductions from Statewide Measures
Sector State Measures Emission Reductions (MT CO2e/year)
2020 2030 2035 Transportation Pavley and Low Carbon Fuel Standard; Low Emission
Vehicle Program III; Tire Tread Program; Tire Pressure Program; Low Friction Oil; HD Aerodynamic/MHD Hybridization
424,559 667,463 836,897
Residential Energy
Renewable Portfolio Standards 164,477 299,049 363,843 Title 24 – Electricity 16,833 79,525 102,708 Title 24 – Natural Gas 7,983 10,762 12,496
Commercial Energy
Renewable Portfolio Standards 174,877 317,958 386,849 Title 24 – Electricity 9,614 5,532 4,196 Title 24 – Natural Gas 17,530 12,933 11,108
Fugitive Emissions
Limit High GWP Use in Consumer Products; Motor Vehicle Air Conditioning; High GWP Refrigerant Management Program for Stationary Sources
144,287 167,658 178,504
Total 960,160 1,560,880 1,896,602 Source: Compiled by LSA Associates, Inc. (2019). GWP = global warming potential HD = Heavy Duty MHD = Medium Heavy Duty MT CO2e/year = metric tons of carbon dioxide equivalent per year
The adjusted business-as-usual (ABAU) inventory applies emission reductions achieved by Statewide regulations, programs, and measures. This inventory identifies the base from which reductions are needed from local strategies and measures to demonstrate consistency with the State-aligned targets. Table 4.8.E shows the emission inventories for each year after the application of State regulatory measures.
The State has set goals for reducing GHG emissions by 2020, 2030, and 2050 through AB 32, SB 32, and EO B-30-15, respectively. The State has also provided guidance to local jurisdictions as “essential partners” in achieving the State’s goals by identifying a 2020 recommended reduction goal. That goal, stated in the AB 32 Scoping Plan, was for local governments to achieve a 15 percent reduction below baseline levels by 2020, which aligns with the State’s goal of not exceeding 1990 emissions levels by 2020. The State’s long-term target is to emit no more than 20 percent of 1990 levels by 2050 (or, a reduction of 80 percent below 1990 levels by 2050). The State has also provided an
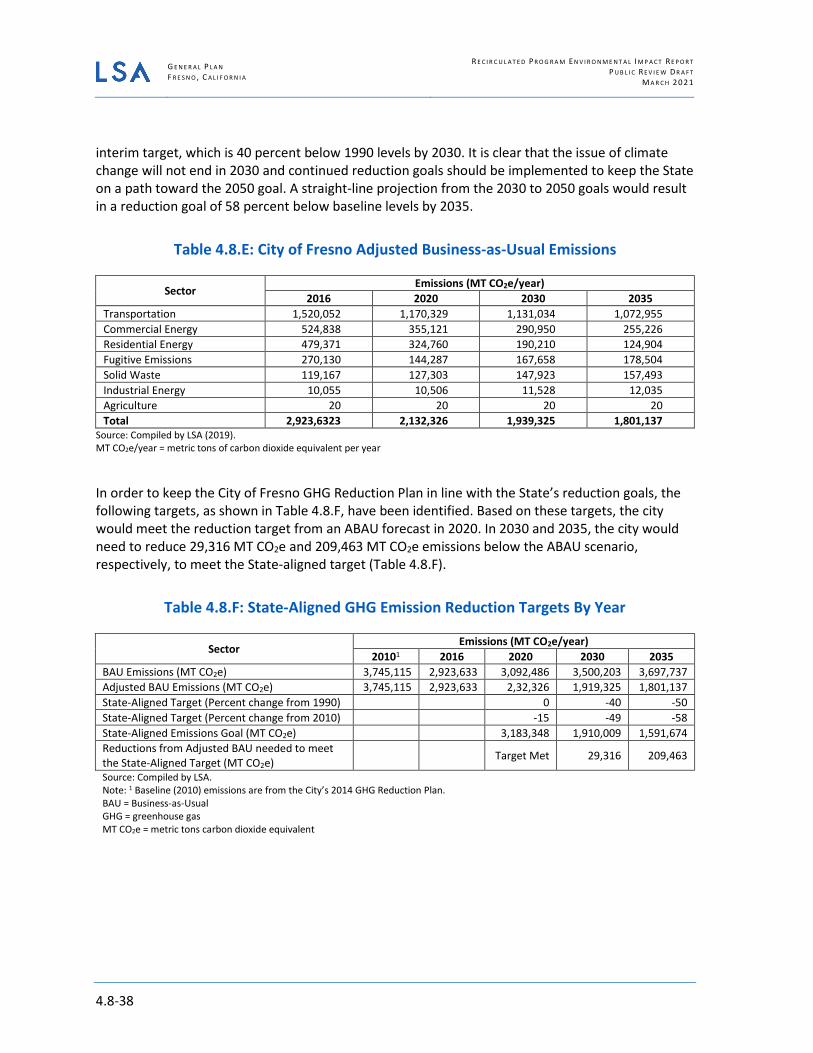
G E N E R A L P L A N F R E S N O , C A L I F O R N I A
R E C I R C U L A T E D P R O G R A M E N V I R O N M E N T A L I M P A C T R E P O R T P U B L I C R E V I E W D R A F T
M A R C H 2 0 2 1
4.8-38
interim target, which is 40 percent below 1990 levels by 2030. It is clear that the issue of climate change will not end in 2030 and continued reduction goals should be implemented to keep the State on a path toward the 2050 goal. A straight-line projection from the 2030 to 2050 goals would result in a reduction goal of 58 percent below baseline levels by 2035.
Table 4.8.E: City of Fresno Adjusted Business-as-Usual Emissions
Sector Emissions (MT CO2e/year)
2016 2020 2030 2035 Transportation 1,520,052 1,170,329 1,131,034 1,072,955 Commercial Energy 524,838 355,121 290,950 255,226 Residential Energy 479,371 324,760 190,210 124,904 Fugitive Emissions 270,130 144,287 167,658 178,504 Solid Waste 119,167 127,303 147,923 157,493 Industrial Energy 10,055 10,506 11,528 12,035 Agriculture 20 20 20 20 Total 2,923,6323 2,132,326 1,939,325 1,801,137
Source: Compiled by LSA (2019). MT CO2e/year = metric tons of carbon dioxide equivalent per year
In order to keep the City of Fresno GHG Reduction Plan in line with the State’s reduction goals, the following targets, as shown in Table 4.8.F, have been identified. Based on these targets, the city would meet the reduction target from an ABAU forecast in 2020. In 2030 and 2035, the city would need to reduce 29,316 MT CO2e and 209,463 MT CO2e emissions below the ABAU scenario, respectively, to meet the State-aligned target (Table 4.8.F).
Table 4.8.F: State-Aligned GHG Emission Reduction Targets By Year
Sector Emissions (MT CO2e/year)
20101 2016 2020 2030 2035 BAU Emissions (MT CO2e) 3,745,115 2,923,633 3,092,486 3,500,203 3,697,737 Adjusted BAU Emissions (MT CO2e) 3,745,115 2,923,633 2,32,326 1,919,325 1,801,137 State-Aligned Target (Percent change from 1990) 0 -40 -50 State-Aligned Target (Percent change from 2010) -15 -49 -58 State-Aligned Emissions Goal (MT CO2e) 3,183,348 1,910,009 1,591,674 Reductions from Adjusted BAU needed to meet the State-Aligned Target (MT CO2e)
Target Met 29,316 209,463
Source: Compiled by LSA. Note: 1 Baseline (2010) emissions are from the City’s 2014 GHG Reduction Plan. BAU = Business-as-Usual GHG = greenhouse gas MT CO2e = metric tons carbon dioxide equivalent
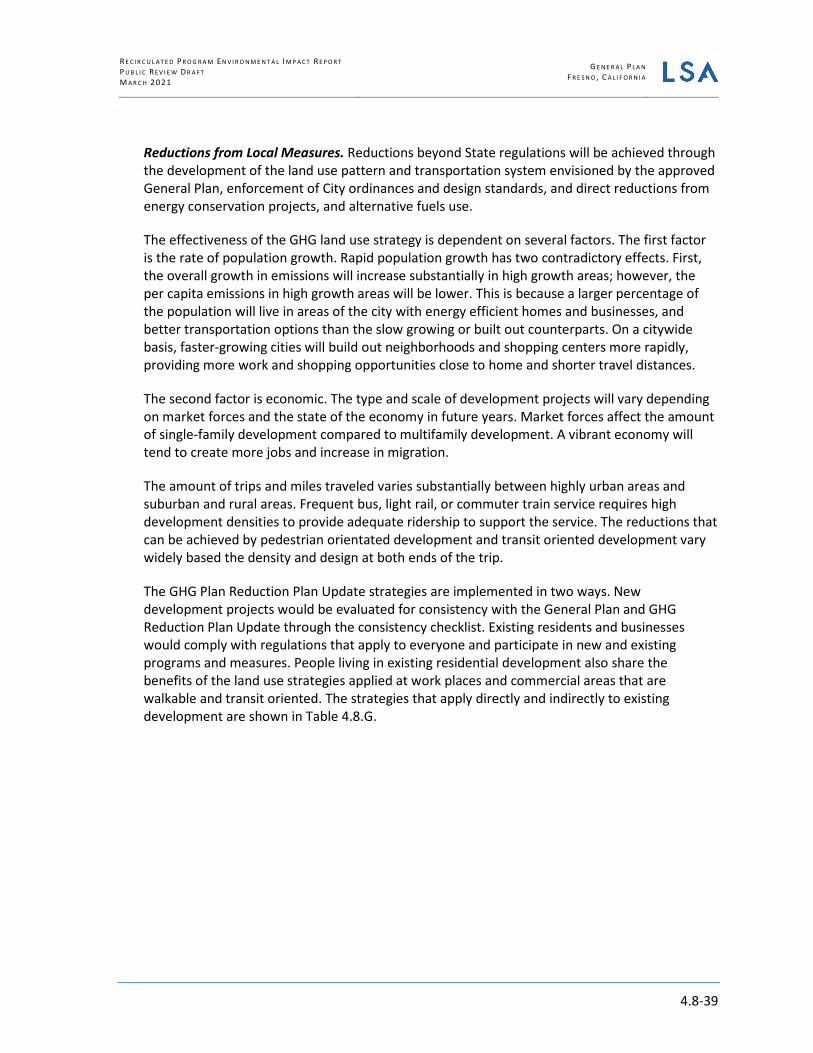
R E C I R C U L A T E D P R O G R A M E N V I R O N M E N T A L I M P A C T R E P O R T P U B L I C R E V I E W D R A F T M A R C H 2 0 2 1
G E N E R A L P L A N F R E S N O , C A L I F O R N I A
4.8-39
Reductions from Local Measures. Reductions beyond State regulations will be achieved through the development of the land use pattern and transportation system envisioned by the approved General Plan, enforcement of City ordinances and design standards, and direct reductions from energy conservation projects, and alternative fuels use.
The effectiveness of the GHG land use strategy is dependent on several factors. The first factor is the rate of population growth. Rapid population growth has two contradictory effects. First, the overall growth in emissions will increase substantially in high growth areas; however, the per capita emissions in high growth areas will be lower. This is because a larger percentage of the population will live in areas of the city with energy efficient homes and businesses, and better transportation options than the slow growing or built out counterparts. On a citywide basis, faster-growing cities will build out neighborhoods and shopping centers more rapidly, providing more work and shopping opportunities close to home and shorter travel distances.
The second factor is economic. The type and scale of development projects will vary depending on market forces and the state of the economy in future years. Market forces affect the amount of single-family development compared to multifamily development. A vibrant economy will tend to create more jobs and increase in migration.
The amount of trips and miles traveled varies substantially between highly urban areas and suburban and rural areas. Frequent bus, light rail, or commuter train service requires high development densities to provide adequate ridership to support the service. The reductions that can be achieved by pedestrian orientated development and transit oriented development vary widely based the density and design at both ends of the trip.
The GHG Plan Reduction Plan Update strategies are implemented in two ways. New development projects would be evaluated for consistency with the General Plan and GHG Reduction Plan Update through the consistency checklist. Existing residents and businesses would comply with regulations that apply to everyone and participate in new and existing programs and measures. People living in existing residential development also share the benefits of the land use strategies applied at work places and commercial areas that are walkable and transit oriented. The strategies that apply directly and indirectly to existing development are shown in Table 4.8.G.

G E N E R A L P L A N F R E S N O , C A L I F O R N I A
R E C I R C U L A T E D P R O G R A M E N V I R O N M E N T A L I M P A C T R E P O R T P U B L I C R E V I E W D R A F T
M A R C H 2 0 2 1
4.8-40
Table 4.8.G: Strategies for Existing Development
Strategy How it Applies Transportation Demand Management (TDM)
TDM is implemented at existing and new businesses and can also reduce trips from new and existing housing where employees live.
Expanded Transit Service Improved transit service will encourage increased ridership from new and existing development.
Improved Transit Stations Transit stations service a wider community area that includes new and existing development.
Traffic Calming Retrofits Traffic calming designs can be retrofitted on existing roads or built-in new development.
Complete Streets Program Complete streets connect existing and new areas. Parking Management Parking management at new and existing employment centers encourages trip
reductions from all residential development Energy Retrofits Educational and incentive programs encourage existing residents and business
owners to install energy retrofits providing large benefits in older structures. Bicycle and Pedestrian Improvements on Existing Roads and near transit stations
Bicycle paths and lanes can be retrofitted on existing roads, near transit stations. Sidewalks and pedestrian paths can connect existing neighborhoods with appropriate destinations including transit stations.
Bicycle Parking Facilities Bicycle parking can be added to existing businesses if needed to satisfy demand by employees and customers.
Water Conservation Programs Educational and incentive programs encourage existing residents and businesses to conserve water.
Recycled Water Use in Existing Parks Recycled water can be piped to any area retrofitted or initially developed with a “purple pipe” system to distribute recycled water.
Energy Retrofits Educational and incentive programs encourage existing residents and business owners to install energy retrofits providing large benefits in older structures.
Bicycle Parking Facilities Bicycle parking can be added to existing businesses if needed to satisfy demand by employees and customers.
Recycling Programs Operational programs such as recycling apply to all residents and businesses in the city.
Electric Vehicle Charging Charging stations can be installed in existing development as a retrofit or in new development.
Measures That Apply to New Development but Indirectly Benefit Existing Development Transit and Pedestrian Oriented Development
Transit and pedestrian oriented development provides destinations that encourage transit use from existing development and walking once people arrive.
Mixed Use Development Mixed-use development creates a more walkable environment conducive to transit use for trips from existing development.
Compact Development Making the city more compact shortens average trip lengths for residents and creates more opportunities for transit.
Traffic Flow Improvements Transportation improvements that reduce congestion and improve flow can reduce emissions from both existing and new development.
Recycling Programs Operational programs such as recycling apply to all residents and businesses in the city.
Electric Vehicle Charging Charging stations can be installed in existing development as a retrofit or in new development.
R E C I R C U L A T E D P R O G R A M E N V I R O N M E N T A L I M P A C T R E P O R T P U B L I C R E V I E W D R A F T M A R C H 2 0 2 1
G E N E R A L P L A N F R E S N O , C A L I F O R N I A
4.8-41
Mobile Source Reductions
Land Use Strategy. SB 375 required the CARB to set regional targets for reductions from light duty passenger vehicle emissions. After a lengthy review process and input from the regional transportation planning agencies, the CARB adopted a Fresno County target reduction in passenger vehicle CO2e per capita of 6 percent by 2020 and 13 percent by 2035 (CARB 2018). The City’s VMT threshold of a 13 percent reduction in VMT per capita is consistent with SB 743 and corresponds to CARB’s 13 percent by 2035 CO2e reduction target. The key strategies envisioned to achieve these CO2e reduction targets4.7 percent by 2020 and 7.6 percent by 2035. The key strategies envisioned include:
○ Combination of density increase, mixed uses, and infill
○ Growth along major transit corridors and activity centers
The land use strategies are expected to reduce trip generation and vehicle miles traveled to achieve the percentage reductions based on modeling results from the regional transportation model for the approved General Plan land use scenario.
Emission reductions at the individual project level would be substantially larger than the amounts estimated for the overall reduction for SB 375 and SB 743 compliance. CAPCOA estimates that land use and transportation measures in a suburban setting can reduce emissions by a global maximum of 15 percent and 20 percent in a suburban center. Projects approaching the maximum reductions would be in locations served by frequent transit with complete pedestrian and bicycle infrastructure and multiple destinations such as retail and commercial service within walking distance.
Transportation Demand Management. The approved General Plan encourages transportation demand management (TDM) at projects that are large employers.26 The SJVAPCD Rule 9410 – Employer Trip Reduction would provide at 1.6 percent emission reduction in 2020 and 2035 through reduced trips and vehicle miles traveled.
The land use strategy and transportation demand management would provide a combined 45,184 MT CO2e/year in emission reductions by 2020, 66,191 MT CO2e/year reduction by 2030, and an 80,114 MT CO2e/year reduction by 2035. The assumptions used for these calculations are based on the 2014 GHG Plan with the adoption of General Plan land use strategy and compliance with SJVAPCD Rule 9410.
To comply with the VMT threshold that the City adopted for SB 743 implementation, the City would implement other TDM strategies outlined in the City’s General Plan policies that will contribute to VMT reduction and will be applicable to both new commercial and residential development projects. The approved General Plan includes several
26 Transportation Demand Management (TDM) is defined by Caltrans as: policies, programs and actions
directed toward decreasing use of single occupant vehicles and shifting travel from peak periods.
G E N E R A L P L A N F R E S N O , C A L I F O R N I A
R E C I R C U L A T E D P R O G R A M E N V I R O N M E N T A L I M P A C T R E P O R T P U B L I C R E V I E W D R A F T
M A R C H 2 0 2 1
4.8-42
policies to reduce VMT such as Policy MT-4a: Active Transportation Plan, Policy MT-4b: Bikeway Improvements, Policy MT-5a: Sidewalk Development. These policies and other policies along with the revisions to the approved General Plan will facilitate the adoption of VMT policies to reduce VMT citywide. The City General Plan objectives and policies that contribute to VMT reduction through implementation of TDM strategies are outlined in Table 2-1 of Appendix A to the GHG Reduction Plan Update.
Electric Vehicle. Hybrid EVs, plug-in hybrid EVs, and all (EVs produce lower emissions than conventional vehicles. Any type of electrified vehicle emits less GHG than conventional vehicles by at least 40 percent. The City could promote EVs by establishing EV incentive programs, installing EV chargers within residential units and commercial building parking lots and providing streamlined permitting ordinance for EV charging stations. Based upon the historic trends in EV ownership and the CARB Zero-Emission Vehicles (ZEV) Action Plan27, it is assumed that by 2030, EV ownership in the city would reach 8.7 percent, and by 2035, 13 percent of the vehicle trips would be made by EVs.
CALGreen, the State green building code (California Code of Regulations [CCR], Title 24, Part 11), sets requirements for installing EV-capable infrastructure in new residential and nonresidential buildings. Starting January 1, 2020, CALGreen requires that new construction of single-family residences, duplexes, and townhouses with private garages must have raceway and panel capacity to support the future installation of level 2 charging stations (CEC 2019, ICC 2019). The City supports increased EVs within the city by encouraging the installation of EV chargers within new and existing multi-family residential and commercial parking areas within the city. The City is launching an EV charging pilot program, designed to assist the State with its goals to increase the number of EVs in California and improve the air quality in our communities. 87 Level 2 EV Chargers locations are currently being installed and almost ready for use throughout the city (see Figure 5-2 of the GHG Reduction Plan Update, included as Appendix G). The majority of the costs to purchase and install the chargers are covered by grants and incentives from the San Joaquin Valley Air Pollution Control District (SJVACD), and the California Electric Vehicle Implementation Program (CAL-EVIP). The grants and incentives obtained by the City were also targeted for disadvantaged communities. A significant number of the EV Chargers will be installed in areas that are currently underserved with EV infrastructure. The EV Chargers will be available for both public use and for City vehicles to allow for optimal usage.
Implementation Support for Zero Emission Buses. To implement the State of California’s Innovative Clean Transit regulation28 of 100 percent zero emission buses by 2040,29 FAX
27 California Air Resources Board (CARB). 2018. Zero Emission Vehicle Action Plan Priorities Update.
Available online at: https://static.business.ca.gov/wp-content/uploads/2019/12/2018-ZEV-Action-Plan-Priorities-Update.pdf (accessed February 19, 2020).
28 To transition successfully to an all zero-emission bus fleet by 2040, each transit agency will submit a rollout plan under the regulation demonstrating how it plans to purchase clean buses, build out necessary infrastructure and train the required workforce. The rollout plans are due in 2020 for large transit

R E C I R C U L A T E D P R O G R A M E N V I R O N M E N T A L I M P A C T R E P O R T P U B L I C R E V I E W D R A F T M A R C H 2 0 2 1
G E N E R A L P L A N F R E S N O , C A L I F O R N I A
4.8-43
needs regulatory and financial support to determine the most viable options for transitioning its fleet to zero emission buses (ZEBs). FAX should consider potential funding mechanisms for this program. Some potential strategies are as follows:
○ Traditional financing methods, such as municipal bonds and local option transportation taxes to finance the purchase and/or operation of new ZEBs.
○ Collaboration with local utilities to obtain beneficial rate structures to reduce charging costs and work with utilities to secure charging infrastructure investments.
○ Federal, State, regional, and local grant and incentive programs to reduce the initial purchase price of ZEBs.
In addition to funding, building the infrastructure necessary to deploy the ZEBs, and procuring electricity, hydrogen, or other alternative fuel sources to operate them pose challenges for FAX that will require innovative approaches and best practices to operate a full fleet of ZEBs in the City by 2040. FAX is currently working on its rollout plan to meet all requirements by 2040.
Energy Efficiency Reductions
Building Energy Efficiency. The City supports the State’s efforts to achieve net zero energy consumption in new residential and non-residential buildings. Achieving net zero is currently possible in some buildings with the use of onsite solar to offset the electricity consumption from the grid. The 2019 Title 24 standards that will go into effect in January 2020 are substantially more stringent than the 2016 Title 24 standards and focus on achieving zero net energy homes.
The City encourages developers to achieve the voluntary tier levels from the CPUC Energy Efficiency Strategic Plan, which ultimately lead to net zero energy consumption for residential development by 2020 and non-residential development by 2030. GHG emission reductions from net zero energy homes have been accounted for under State regulations in Chapter 4 as the 2019 Title 24 standards include this requirement. By achieving net zero energy consumption for non-residential development by 2030, the city would reduce GHG emissions by 70,230 MT CO2e/year by 2030, and 100,237 MT CO2e/year by 2035. Once Title 24 mandates net zero energy consumption, no further reductions beyond regulation can be achieved by projects.
Water Conservation. The California Water Conservation Act mandates a 20 percent reduction in water usage by 2020. The City has a reduction target of per capita water usage
agencies and in 2023 for small agencies. Agencies will then follow a phased schedule from 2023 until 2029, by which date 100 percent of annual new bus purchases will be zero-emission.
29 California Air Resources Board (CARB). California transitioning to all-electric buses by 2040. Website: ww2.arb.ca.gov/news/california-transitioning-all-electric-public-bus-fleet-2040 (accessed June 2019).

G E N E R A L P L A N F R E S N O , C A L I F O R N I A
R E C I R C U L A T E D P R O G R A M E N V I R O N M E N T A L I M P A C T R E P O R T P U B L I C R E V I E W D R A F T
M A R C H 2 0 2 1
4.8-44
in the cCity’s water service area to 230 gallons per day per capita (25 percent below the current consumption rate) in 2035. The cCity will meet the reduction target with measures applicable to new and existing development. Reductions beyond the state mandated 20 percent are possible with the use of building and landscaping water conservation features. The reductions from buildings can be achieved with high-efficiency toilets, low-flow showers and faucets, and water-efficient appliances such as clothes washers and dishwashers. Water savings from landscaping would be achieved primarily through the use of synthetic (‘turf’) lawns, drought-tolerant landscaping or xeriscaping. The City is also proposing General Plan Policy RC-7-b that requires a tiered water cost structure to cover the true cost of the water supply. Example measures and water savings estimates are provided below.
Indoor Water Conservation Measures
○ Hot water pipe insulation. Insulate hot-water pipes, and separation of hot and cold piping to avoid heat exchange. Water savings: 2,400 gallons per residential unit per year. Cost: $50/unit.
○ Pressure reducing valves. Pressure reducing valves maintain pressure below 60 psi reducing volume of any leakage present and preventing excessive flow from all appliances and fixtures. Water savings: 30,000 gallons approximately per residential unit per year. Cost: $100-$150 per unit.30
○ Water-Efficient Dishwashers.Install Energy Star-certified units. Water savings: 5000 gallons per residential unit per year.31
○ Dual Flush Toilets. Provides option to flush with partial (0.8 gallon) flow of water or with a full (1.6 gallons) flow depending on need. Water savings: 13,000 gallons per year per toilet32. Cost: $200 per toilet; however, retrofit kits are available for under $20.
○ High-efficiency Washing Machines. Use front loading and top loading Energy Star-qualified clothes washers that use 35 to 50 percent less water than conventional washing machines. Water savings: 7,000 gallons per year.33 Cost: $800 for a high-efficiency washing machine.
30 Water Pressure Reducing Valves: Frequently Asked Questions: Website: www.watts.com/resources/
references-tools/waterpressurereducingvalvesfaq (accessed February 19, 2020). 31 Energy Star Appliances: Dishwashers Vs. Handwashing Dishes Website: www.energystar.gov/products/
appliances/dishwashers/dishwasher_hand_washing (accessed August 10, 2019). 32 Energy Efficient Toilets Comparison: Constellation Energy. Website:
www.blog.constellation.com/2017/09/25/energy-efficient-toilets-comparison/ (accessed August 10, 2019).
33 Energy Star High Efficiency Clothes Washers. Website: www.energystar.gov/products/appliances/clothes_washers (accessed August 10, 2019).

R E C I R C U L A T E D P R O G R A M E N V I R O N M E N T A L I M P A C T R E P O R T P U B L I C R E V I E W D R A F T M A R C H 2 0 2 1
G E N E R A L P L A N F R E S N O , C A L I F O R N I A
4.8-45
○ Point-of-Use or Tankless Water Heaters. Install small water heaters close to the point of use, such as bathrooms, kitchen, and laundry area. Water savings: 5,300 gallons per residential unit per year.34 Cost: $700 for point of use water heaters. However, the cost is approximately the same for one large unit or three smaller ones.
Outdoor Water Conservation Measures
○ Evapotranspiration (ET) Controllers. Irrigation scheduled by actual plant ET rates. Water savings: 20,000 gallons per single-family unit per year. Cost: $175 per controller and $48 per year in maintenance.
○ Water-Efficient Landscaping. Use drought tolerant plants and compliant irrigation systems and controllers. Water Savings: Up to 50 percent of outdoor use (12,000 gallons/year from a 2,100-square-foot landscaped area). Cost: similar to conventional landscaping.
○ Xeriscape. Xeriscaping is a combination of seven principles, planning and design, practical turf areas, efficient irrigation, soil analysis and improvement, mulching, low-water-use plants, and appropriate maintenance. Water savings: 30 percent reduction in irrigation demand or about 16,000 gallons per year on a typical single-family lot. Cost: similar to conventional landscaping.
Energy Savings from Water Conservation. The combined benefits of indoor and outdoor water conservation program are estimated at 20 percent in 2020 to achieve compliance with state-mandated reductions and 25 percent by 2035 to meet the approved General Plan target, which are consistent with the assumptions in 2014 GHG Plan. Reductions in water use reduce electricity consumed for pumping, treatment, and transport of water by proportional amounts. Reductions in water use by these amounts would provide emission reductions of 5,975 MT CO2e/year by 2020 and 8,891 MT CO2e/year by 2035. Assuming a constant reduction rate, the emission reductions in 2030 would be 7,840 MT CO2e/year.
Waste Diversion and Recycling Reductions. The City of Fresno will meet or exceed the state-mandated 75 percent diversion target in the future. The CARB estimates that statewide reductions of 20 to 30 MMT CO2e will be achieved through this strategy. The City of Fresno has achieved substantial progress to date. The city per capita baseline based on the 2002 to 2004 average is 6.6 pounds per day per person. The 2018 per capita rate was 4.8 pounds per day per person, which was assumed to remain consistent through 2020. The 75 percent diversion target would require a per capita rate of 1.65 pounds per person per day in the future. Achieving net zero waste would provide additional reductions from this sector; however, no reductions are estimated pending
34 Energy Star Point of Contact Heaters. Website: www.energystar.gov/products/water_heaters/
point_use_pou_water_heaters (accessed August 10, 2019).

G E N E R A L P L A N F R E S N O , C A L I F O R N I A
R E C I R C U L A T E D P R O G R A M E N V I R O N M E N T A L I M P A C T R E P O R T P U B L I C R E V I E W D R A F T
M A R C H 2 0 2 1
4.8-46
adoption of a state mandate. The estimated emission reductions from achieving the 75 percent mandated diversion target are 84,677 MT CO2e/year in 2030, and 90,043 MT CO2e/year in 2035.
Summary of Reductions from Local Measures. Table 4.8.H summarizes the local reductions from the measures described above.
Table 4.8.H: Reductions from Local Measures
Sector Local Measures Emissions Reductions
(MT CO2e/year) 2020 2030 2035
Transportation Land Use Strategy and Transportation Demand Management 45,184 66,191 80,114
Transportation Electric Vehicle Charging Stations -- 84,115 116,816 Commercial Energy Net Zero Energy Commercial Building - 70,230 100,237 Industrial Energy (Water) Water Conservation 5,975 7,840 8,981 Solid Waste Waste Diversion and Recycling - 84,677 90,043
Total 51,159 228,938313,053
279,375396,191
Source: Compiled by LSA Associates, Inc. (20192021).
Table 4.8.I summarizes the baseline 2010 and updated 2016 GHG emissions, the projected 2020, 2030, and 2035 emission inventories, as well as the reduced 2020, 2030, and 2035 inventories after implementation of the State and local reduction measures.
By 2020, the Statewide and local measures together would reduce the city’s GHG emissions from the 2020 BAU level to 2,081,167 MT CO2e, which would exceed the 15 percent below baseline levels reduction target of 3,183,348 MT CO2e for 2020. By 2030, the Statewide and local measures together would reduce emissions to 1,710,3861,626,272 MT CO2e, which would exceed the 49 percent below baseline levels reduction target of 1,910,009 MT CO2e for 2030. In 2035, implementation of Statewide and local measures together would reduce emissions from the 2035 BAU level to 1,521,7611,404,946 MT CO2e, which would exceed the 58 percent below baseline levels reduction target of 1,591,674 MT CO2e for 2035.

R E C I R C U L A T E D P R O G R A M E N V I R O N M E N T A L I M P A C T R E P O R T P U B L I C R E V I E W D R A F T M A R C H 2 0 2 1
G E N E R A L P L A N F R E S N O , C A L I F O R N I A
4.8-47
Table 4.8.I: GHG Emissions and Targets Comparison
2010 (MT CO2e)1
2016 (MT CO2e)
2020 (MT CO2e)
2030 (MT CO2e)
2035 (MT CO2e)
BAU Emissions 3,745,115 2,923,633 3,092,486 3,500,204 3,697,738 State Reductions - - 960,160 1,560,880 1,896,602
ABAU Emissions 3,745,115 2,923,633 2,132,326 1,939,324 1,801,137 Local Measures Reductions - - 51,159 313,053
228,938 396,191 297,375
Total Adjusted Emissions - - 2,081,167 1,626,272 1,710,386
1,404,946 1,521,761
Reduction Target - - 3,183,348 1,910,009 1,591,674 Additional Reductions Needed - - Target Met Target Met Target Met Source: Compiled by LSA Associates, Inc. (20192021). Note: 1 Baseline (2010) emissions are from the City’s 2014 GHG Reduction Plan. GHG = greenhouse gas ABAU = Adjusted Business-as-Usual BAU = Business-as-Usual MT CO2e = metric tons of carbon dioxide equivalent
Although the General Plan growth rate would result in buildout by the year 2056, given current methods and the State’s goals and targets, 2035 is a reasonable forecast for GHG and is in-line with the State emission reduction targets. In addition, with the City’s commitment to continue to update the GHG Reduction Plan Update, the future updates will be conducted to align the Plan with State emission reduction targets.
Level of Significance Without Mitigation: Potentially Significant Impact.
Impact GHG-1: The project would generate greenhouse gas emissions, either directly or indirectly, that may have a significant impact on the environment.
Mitigation Measure GHG-1.1 Prior to the City’s approval of subsequent discretionary projects, the Director of the City Planning and Development Department, or designee, shall confirm that Ddevelopment projects that require discretionary approval shall beare consistent with the Recirculated GHG Reduction Plan Update (20212020) and shall implement all measures deemed applicable to the project through the GHG Reduction Plan Update-Project Consistency Checklist (Appendix B to the GHG Reduction Plan Update).
Level of Significance With Mitigation: Less Than Significant Impact.
GHG‐2 The proposed project would conflict with an applicable plan, policy or regulation adopted for the purpose of reducing the emissions of greenhouse gases.
The following discusses the consistency of the proposed project to the State’s GHG reduction goals and the CARB Scoping Plan.

G E N E R A L P L A N F R E S N O , C A L I F O R N I A
R E C I R C U L A T E D P R O G R A M E N V I R O N M E N T A L I M P A C T R E P O R T P U B L I C R E V I E W D R A F T
M A R C H 2 0 2 1
4.8-48
The AB 32 Scoping Plan has a range of GHG reduction actions, which include direct regulations, alternative compliance mechanisms, monetary and non-monetary incentives, voluntary actions, market-based mechanisms such as a cap-and-trade system, and an AB 32 implementation fee to fund the program.
In addition, SB 32 affirms the importance of addressing climate change by codifying into statute the GHG emissions reductions target of at least 40 percent below 1990 levels by 2030 contained in EO B-30-15. SB 32 builds on AB 32 and keeps us on the path toward achieving the State’s 2050 objective of reducing emissions to 80 percent below 1990 levels, consistent with an IPCC analysis of the global emissions trajectory that would stabilize atmospheric GHG concentrations at 450 parts per million CO2e and reduce the likelihood of catastrophic impacts from climate change.
The companion bill to SB 32, AB 197, provides additional direction to CARB in the following areas related to the adoption of strategies to reduce GHG emissions. Additional direction in AB 197, intended to provide easier public access to air emissions data that are collected by CARB, was posted in December 2016. The measures applicable to the proposed project include energy efficiency measures, water conservation and efficiency measures, and transportation and motor vehicle measures. The proposed project includes various policies as described above that would contribute to reduced GHG emissions, consistent with the State’s GHG reduction goals.
In addition, the proposed project includes the GHG Reduction Plan Update for the City (2020), which includes strategies to reduce GHG emissions that align with State targets. The GHG Reduction Plan Update includes inventory projections for 2020, 2030, and 2035. The 2020 and 2030 forecast years are consistent with the goals identified in AB 32 and the 2017 Scoping Plan, which identify Statewide GHG reduction targets by 2020 and 2030. The 2035 forecast year correspond to the approved General Plan horizon and will allow the City to develop long-term strategies to continue GHG reductions.
As shown in Table 4.8.I, the Statewide and local measures together would reduce the city’s GHG emissions from the 2020 BAU level to 2,081,167 MT CO2e, which would exceed the 15 percent below baseline levels reduction target of 3,183,348 MT CO2e for 2020. By 2030, the Statewide and local measures together would reduce emissions to 1,710,386 MT CO2e, which would exceed the 49 percent below baseline levels reduction target of 1,910,009 MT CO2e for 2030. In 2035, implementation of Statewide and local measures together would reduce emissions from the 2035 BAU level to 1,521,761 MT CO2e, which would exceed the 58 percent below baseline levels reduction target of 1,591,674 MT CO2e for 2035. Therefore, implementation of GHG Reduction Plan Update would be required for the continued implementation of the approved General Plan to meet the State’s reduction targets. As shown in Table 4.8.I, with implementation of the Plan Update, emission levels would meet the State’s reduction targets.
CARB Scoping Plan: In accordance with AB 32, CARB developed the Scoping Plan to outline the State’s strategy to achieve 1990-level emissions by year 2020. Since adoption of the 2008 and 2017 Scoping Plans, State agencies have adopted programs identified in the Scoping Plan, and the legislature has passed additional legislation to achieve the GHG reduction targets. Statewide strategies to reduce GHG emissions include the Low Carbon Fuel Standard (LCFS) and changes in the corporate average fuel economy standards (e.g., Pavley I and 2017–2025 Corporate Average Fuel
R E C I R C U L A T E D P R O G R A M E N V I R O N M E N T A L I M P A C T R E P O R T P U B L I C R E V I E W D R A F T M A R C H 2 0 2 1
G E N E R A L P L A N F R E S N O , C A L I F O R N I A
4.8-49
Economy [CAFE] standards). These statewide measures are applicable uniformly throughout the State, and all future developments under the proposed project would be in compliance.
A summary of the Statewide measures and the associated GHG emissions reductions when integrated into the proposed project are described above. In addition to these Statewide strategies, the local measures outlined above would also contribute to reducing GHG emissions. Therefore, the proposed project would be consistent with the Scoping Plan, and impacts are considered less than significant.
Applicable Laws, Regulations, Relevant Land Use Policies
• Refer to the approved General Plan policies and objectives identified in Section 4.8.5.4, Local Policies and Regulations, above; and the Recirculated GHG Reduction Plan Update (20212020).
Level of Significance Without Mitigation: Less Than Significant Impact.
4.8.7.2 Cumulative Impacts
GHG‐3 The proposed project, in combination with past, present, and reasonably foreseeable projects, would result in less than significant cumulative impacts with respect to greenhouse gas emissions.
Greenhouse gas impacts are by their nature cumulative impacts. Localized impacts of climate change are the result of the cumulative impact of global emissions. The combined benefits of reductions achieved by all levels of government help to slow or reverse the growth in greenhouse gas emissions. In the absence of comprehensive international agreements on appropriate levels of reductions achieved by each country, another measure of cumulative contribution is required. This serves to define the State’s share of the reductions regardless of the activities or lack of activities of other areas of the U.S. or the world. Therefore, a cumulative threshold based on consistency with state targets and actions to reduce greenhouse gases is an appropriate standard of comparison for significance determinations at the approved General Plan level.
AB 32 requires CARB to reduce Statewide GHG emissions to 1990 level by 2020. As part of this legislation, CARB was required to prepare a “Scoping Plan” that demonstrates how the State will achieve this goal. The Scoping Plan was first adopted in 2011 and in it local governments were described as “essential partners” in meeting the Statewide goal, recommending a GHG reduction level of 15 percent below 2005 to 2008 levels, depending on when a full emissions inventory is available, by 2020.
Reductions will be achieved by existing development and new projects. Residents of new development projects will achieve lower per capita rates than residents of existing development. This is because of greater energy efficiency in new structures and lower motor vehicle travel resulting from the project designs and higher development densities anticipated from General Plan implementation.
The CARB released the First Update to the Climate Change Scoping Plan on February 10, 2014. The draft update emphasized the need for a mid-term target between 2020 and 2050 to provide a

G E N E R A L P L A N F R E S N O , C A L I F O R N I A
R E C I R C U L A T E D P R O G R A M E N V I R O N M E N T A L I M P A C T R E P O R T P U B L I C R E V I E W D R A F T
M A R C H 2 0 2 1
4.8-50
continuum of action to reduce cumulative emissions. The EO B-30-15 and SB 32 required CARB to reduce Statewide GHG emissions to 40 percent below 1990 levels by 2030. The EO B-30-15 further stated that the emission reduction target of 40 percent below 1990 levels by 2030 is an interim-year goal to make it possible to reach the ultimate goal of reducing emissions 80 percent under 1990 levels by 2050. The order directs CARB to provide a plan with specific regulations to reduce Statewide sources of GHG emissions. The Executive Order does not include a specific guideline for local governments. The 2017 Scoping Plan recommends local plan level GHG emissions reduction goals.
At the growth rates projected for General Plan buildout, the city could continue to grow through 2050 without designating additional land for development. The approved General Plan and the GHG Plan Update ensure that the City of Fresno will do its part of reducing GHG emissions for the short-term (2020) and the long term (2050).
As identified above, the proposed project includes the GHG Reduction Plan Update for the City, which includes strategies to reduce GHG emissions align with State targets. The GHG Reduction Plan Update includes inventory projections for 2020, 2030, and 2035. The 2020 and 2030 forecast years are consistent with the goals identified in AB 32 and the 2017 Scoping Plan, which identify Statewide GHG reduction targets by 2020 and 2030. The 2035 forecast year correspond to the approved General Plan horizon and will allow the City to develop long-term strategies to continue GHG reductions.
As shown in Table 4.8.I, the Statewide and local measures together would reduce the city’s GHG emissions from the 2020 BAU level to 2,081,167 MT CO2e, which would exceed the 15 percent below baseline levels reduction target of 3,183,348 MT CO2e for 2020. By 2030, the Statewide and local measures together would reduce emissions to 1,710,3861,626,272 MT CO2e, which would exceed the reduction target of 49 percent below baseline levels of 1,910,009 MT CO2e for 2030. In 2035, implementation of Statewide and local measures together would reduce emissions from the 2035 BAU level to 1,521,7611,404,946 MT CO2e, which would exceed the 58 percent below baseline levels reduction target of 1,591,674 MT CO2e for 2035. Therefore, with implementation of GHG Reduction Plan Update, continued implementation of the approved General Plan would meet the State’s reduction targets.
Applicable Laws, Regulations, Relevant Land Use Policies
• Refer to the approved General Plan policies and objectives identified in Section 4.8.5.4, Local Policies and Regulations, above.
Level of Significance Without Mitigation: Potentially Significant Impact.
Impact GHG-3: The proposed project, in combination with past, present, and reasonably foreseeable projects, would result in significant cumulative impacts with respect to greenhouse gas emissions.
Mitigation Measure: Refer to Mitigation Measure GHG-1.1.
Level of Significance Without Mitigation: Less Than Significant Impact.

R E C I R C U L A T E D P R O G R A M E N V I R O N M E N T A L I M P A C T R E P O R T P U B L I C R E V I E W D R A F T M A R C H 2 0 2 1
G E N E R A L P L A N F R E S N O , C A L I F O R N I A
4.16-1
4.16 TRANSPORTATION
4.16.1 Introduction
This section evaluates the potential environmental effects related to transportation associated with the continued implementation of the approved General Plan. The analysis includes a review of existing and proposed roadways and vehicle miles traveled (VMT), consistent with Senate Bill 743 which eliminated automobile Level of Service (LOS) from transportation analysis under CEQA and replaced it with VMT. This shift from LOS to VMT is intended to better align with other statewide transportation goals, including reduction of GHG emissions, the creation of multimodal networks, and the promotion of integrated land uses. This section is based on the Traffic Impact Analysis (TIA) prepared in 2019 and included as Appendix J of thisthe Draft Program EIR, and this Recirculated Draft PEIR. The approved General Plan includes policies in the Mobility and Transportation Element that guide future transportation projects in the Planning Area.
4.16.2 CEQA Baseline
The City of Fresno is responsible for preparation of a Program Environmental Impact Report (PEIR) for the approved General Plan that was adopted in December 2014. The intent of this current effort is to convert the Master EIR (MEIR) that was prepared in 2014 to a PEIR, and to update the analysis to be in conformance with State law and to be consistent with recent legislative changes, which include Assembly Bill 32 (2006) and Senate Bill (SB) 32 (2016) regarding climate change, SB 743 (2013) regarding Vehicle Miles Travelled (VMT), and the Sustainable Groundwater Management Act (SGMA) (2014). The Project Description, as described in Chapter 3.0 of this Recirculated Draft PEIR, provides an overview of the content of the approved General Plan, explains that the PEIR will evaluate the continued implementation of the approved General Plan, and identifies specific text changes to the approved General Plan that constitute what is being evaluated in the PEIR (referred to as the “proposed project”). In addition, the Greenhouse Gas Reduction Plan, included as an Appendix to the MEIR, has also been updated and included as Appendix G of the PEIR to take into account the requirements of SB 32. The text changes analyzed as the proposed project are limited to technical revisions to the Mobility and Transportation Element and include the addition of VMT policies consistent with the requirements of Senate Bill (SB) 743 and the revision of text relating to Level of Service (LOS) metrics. These changes are narrow in scope and do not result in direct physical changes to the environment. Therefore, the physical environmental effects of the proposed project would be essentially the same as if the text changes to the General Plan were not proposed (referred to as the “No Project scenario”).
Since the General Plan was adopted and the MEIR was certified in 2014, several amendments to the General Plan have been adopted, and new local, State, and/or federal regulations have been enacted. Accordingly, use of a baseline consistent with the date of issuance of the Notice of Preparation (NOP) in 2019, as required by CEQA Guidelines Section 15125, presents the most accurate and understandable picture possible of the project’s expected impacts on current physical conditions of the General Plan as amended.
The No Project scenario assumes continuation of the approved General Plan (2014) without the Mobility and Transportation Element changes or updates to the Greenhouse Gas Reduction Plan just described. In this scenario, future development in the city would occur as currently set forth under

G E N E R A L P L A N F R E S N O , C A L I F O R N I A
R E C I R C U L A T E D P R O G R A M E N V I R O N M E N T A L I M P A C T R E P O R T P U B L I C R E V I E W D R A F T
M A R C H 2 0 2 1
4.16-2
the General Plan. Text changes related to the Mobility and Transportation Element, including the addition of VMT policies, would not occur. The General Plan would not be updated to reflect conformance with SB 743, and no updates to the Greenhouse Gas Reduction Plan would occur. Despite the lack of an update under the No Project scenario, the distribution and location of projected growth would occur in a manner that is consistent with the approved General Plan and zoning documents, as no changes to the proposed land uses are proposed. Development under the approved General Plan would be the same as compared to the proposed project analyzed in the PEIR, and the physical changes to the environment would be the same under both scenarios. The baseline for the analysis of potential transportation impacts and the TIA does not change from that of the Draft PEIR.
4.16.3 Existing Environmental Setting
4.16.3.1 Roadway Network
The roadway network in Fresno is generally a traditional grid-based network of north/south and east/west streets, except for the Downtown area, where the grid-based network is northeast/southwest. Build out of the street and roadway system within Fresno is not completed, and there is potential for expanding vehicle capacity on some roadways, which would increase opportunities for economic development, encourage a diversity of development types, and promote multi-modal mobility options.
The functionality of a street is related to traffic mobility and land access. Access to a roadway is correlated to the potential for conflicting vehicles and therefore the speed and capacity of the roadway. As such, higher-level facilities, such as freeways and expressways, have lower access and therefore fewer conflicting vehicles, which allows for higher speeds and capacities. Conversely, lower-level facilities, such as local streets, collectors, and minor arterials, have greater access and therefore greater potential for conflicting vehicles, which enforces lower speeds and capacities.
The following is a description of the functional classification groups of roadways according to the type of service they are intended to provide.
State Facilities. A State facility is a highway, or State Route (SR), upon which the rights of access are controlled and that provides separated grades at intersecting streets. The minimum right-of-way width and number of lanes are determined by the California Department of Transportation (Caltrans).
• SR-99 is a northwest to southeast freeway that links Sacramento to Bakersfield, and the Central Valley to the Los Angeles area. SR-99 extends through Fresno from the southeastern city limits to the northwestern city limits. The freeway includes three lanes in each direction. Through Fresno, the southbound direction toward Downtown is generally the peak morning commute direction and northbound is the peak evening commute direction.
• SR-41 is a north-south freeway in Fresno, connecting Kings County to the south and Madera County to the north, that extends from the southern city limits to the northern city limits. SR-41 is the main freeway that connects north Fresno with Downtown Fresno. The freeway includes three lanes in each direction. Through Fresno, the southbound direction toward Downtown is

R E C I R C U L A T E D P R O G R A M E N V I R O N M E N T A L I M P A C T R E P O R T P U B L I C R E V I E W D R A F T M A R C H 2 0 2 1
G E N E R A L P L A N F R E S N O , C A L I F O R N I A
4.16-3
generally the peak morning commute direction and northbound is the peak evening commute direction.
• SR-168 is a north-south freeway that connects northeastern Fresno and Clovis with Downtown Fresno. SR-168 connects Downtown Fresno to its terminus at the SR-180 interchange. The freeway includes three lanes in each direction. Through Fresno, the southbound direction is the peak morning commute direction and northbound is the peak evening commute direction.
• SR-180 is an east-west freeway that connects southeast and southwest Fresno with Downtown Fresno. The freeway includes three lanes in each direction. The direction toward Downtown from both the eastern and western outer fringes of the Ccity is the peak morning commute direction and the opposite direction is the peak evening commute direction.
Expressways. Expressways are generally four- or six-lane divided roadways primarily serving through and crosstown vehicle traffic, with major street intersections located at approximately 0.5-mile intervals and no driveways for direct motor vehicle access to abutting property. The posted speed limit along Expressways is generally 50 miles per hour (mph). Expressways typically experience high capacities and low accessibility. According to the Fresno General Plan Mobility and Transportation Element and Circulation Element, Expressways provided within Fresno are Friant Road and Herndon Avenue.
Super Arterials. Super Arterials are generally four- or six-lane divided roadways with a primary purpose of moving multiple modes of travel traffic to and from major traffic generators and among subregions. Super Arterials provide a select number of motor vehicle access points to adjacent properties or local streets between the major street intersections. The posted speed limit along Super Arterials is typically 50 mph. According to the Fresno General Plan Mobility and Transportation Element, Super Arterials include Herndon Avenue, Friant Road, Veterans Boulevard, Willow Avenue, Grantland Avenue, Copper Avenue, Temperance Avenue, and Jensen Avenue.
Arterials. Arterials are generally two-, four-, or six-lane divided roadways, with the primary purpose of moving traffic within and between neighborhoods and to and from freeways and expressways. The typical posted speed limit along an Arterial is generally 40 mph.
Collectors. Collectors are generally two- or four-lane undivided roadways, with the primary function of connecting local streets and arterials and neighborhood traffic generators and providing access to abutting properties. Collectors typically have a center two-way left-turn lane. The posted speed limit of a Collector is commonly 40 mph.
Local Streets. Local streets are generally two-lane undivided roadways that are used for the principal purpose of serving as access to abutting property. The posted speed limit of a Local Street is commonly 25 mph.
4.16.3.2 Study Area Roadways
The TIA, included as Appendix J of theis Draft PEIR and this Recirculated Draft PEIR, includes a traffic operations analysis that was conducted on roadway segments generally reflective of the patterns of
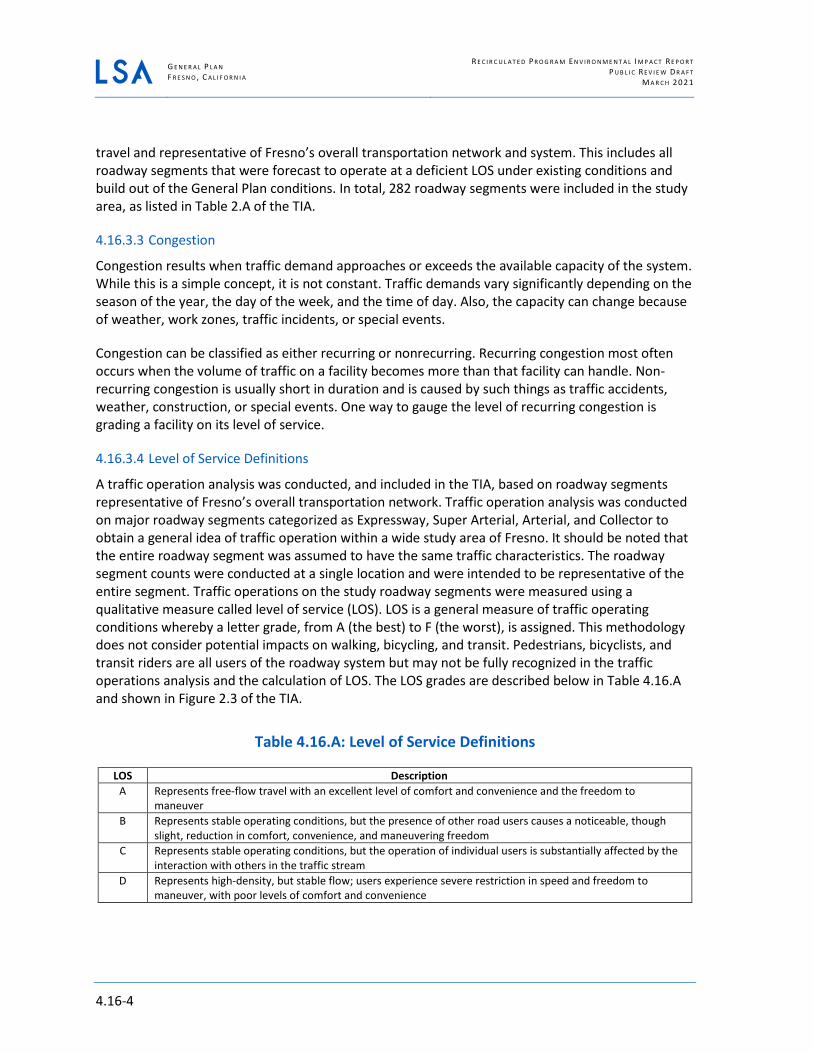
G E N E R A L P L A N F R E S N O , C A L I F O R N I A
R E C I R C U L A T E D P R O G R A M E N V I R O N M E N T A L I M P A C T R E P O R T P U B L I C R E V I E W D R A F T
M A R C H 2 0 2 1
4.16-4
travel and representative of Fresno’s overall transportation network and system. This includes all roadway segments that were forecast to operate at a deficient LOS under existing conditions and build out of the General Plan conditions. In total, 282 roadway segments were included in the study area, as listed in Table 2.A of the TIA.
4.16.3.3 Congestion
Congestion results when traffic demand approaches or exceeds the available capacity of the system. While this is a simple concept, it is not constant. Traffic demands vary significantly depending on the season of the year, the day of the week, and the time of day. Also, the capacity can change because of weather, work zones, traffic incidents, or special events.
Congestion can be classified as either recurring or nonrecurring. Recurring congestion most often occurs when the volume of traffic on a facility becomes more than that facility can handle. Non-recurring congestion is usually short in duration and is caused by such things as traffic accidents, weather, construction, or special events. One way to gauge the level of recurring congestion is grading a facility on its level of service.
4.16.3.4 Level of Service Definitions
A traffic operation analysis was conducted, and included in the TIA, based on roadway segments representative of Fresno’s overall transportation network. Traffic operation analysis was conducted on major roadway segments categorized as Expressway, Super Arterial, Arterial, and Collector to obtain a general idea of traffic operation within a wide study area of Fresno. It should be noted that the entire roadway segment was assumed to have the same traffic characteristics. The roadway segment counts were conducted at a single location and were intended to be representative of the entire segment. Traffic operations on the study roadway segments were measured using a qualitative measure called level of service (LOS). LOS is a general measure of traffic operating conditions whereby a letter grade, from A (the best) to F (the worst), is assigned. This methodology does not consider potential impacts on walking, bicycling, and transit. Pedestrians, bicyclists, and transit riders are all users of the roadway system but may not be fully recognized in the traffic operations analysis and the calculation of LOS. The LOS grades are described below in Table 4.16.A and shown in Figure 2.3 of the TIA.
Table 4.16.A: Level of Service Definitions
LOS Description A Represents free-flow travel with an excellent level of comfort and convenience and the freedom to
maneuver B Represents stable operating conditions, but the presence of other road users causes a noticeable, though
slight, reduction in comfort, convenience, and maneuvering freedom C Represents stable operating conditions, but the operation of individual users is substantially affected by the
interaction with others in the traffic stream D Represents high-density, but stable flow; users experience severe restriction in speed and freedom to
maneuver, with poor levels of comfort and convenience

R E C I R C U L A T E D P R O G R A M E N V I R O N M E N T A L I M P A C T R E P O R T P U B L I C R E V I E W D R A F T M A R C H 2 0 2 1
G E N E R A L P L A N F R E S N O , C A L I F O R N I A
4.16-5
Table 4.16.A: Level of Service Definitions
LOS Description E Represents operating conditions at or near capacity; speeds are reduced to a low but relatively uniform
value; freedom to maneuver is difficult with users experiencing frustration and poor comfort and convenience; unstable operation is frequent, and minor disturbances in traffic flow can cause breakdown conditions
F Defines forced or breakdown conditions; this condition exists wherever the volume of traffic exceeds the capacity of the roadway. Long queues can form behind these bottleneck points with queued traffic traveling in a stop-and-go fashion
Source: City of Fresno (2014).
4.16.3.5 Level of Service Standard
The Ccity includes four Traffic Impact Zones (TIZ), as shown in Figure 2.4 of the TIA, and each zone has a different LOS threshold standard. The four TIZs and their LOS threshold standards are defined below:
• TIZ I: TIZ I represents the Downtown Planning Area, and maintains a peak hour LOS standard of F or better for all the roadway segments.
• TIZ II: TIZ II represents the areas of the Ccity that are generally built up, and maintains a peak hour LOS standard of E or better for all the roadway segments.
• TIZ III: TIZ III represents the areas near or outside the Ccity limits but within the Sphere of Influence (SOI), and maintains a peak hour LOS standard of D or better for all the roadway segments.
• TIZ IV: TIZ IV represents the southern part of the Ccity, and maintains a peak hour LOS standard of E or better for all the roadway segments.
Additionally, several roadway segments are within the City’s SOI but are currently under the County of Fresno’s (County) jurisdiction. The County maintains an LOS standard of D. Therefore, LOS D was used as the threshold for these roadway segments.
4.16.3.6 Existing Roadway Segment Traffic Volumes
The existing traffic volumes at the majority of the study area roadway segments (235 roadway segments out of 282 roadway segments) are based on the a.m. and p.m. peak-hour counts conducted by LSA and provided by the City in non-summer months between 2017 and 2019. Existing a.m. and p.m. traffic counts were taken from the average daily traffic counts where the peak-hour counts were not available. Existing traffic counts are provided in the TIA (Appendix A). In order to represent existing conditions in 2019 when updated traffic counts were taken, an annual growth rate was applied to the 2017 and 2018 counts. Growth rates for each of these roadway segments were determined based on the per year growth as calculated using the Fresno Council of Governments Regional Travel Demand Model (Fresno COG ABM).

G E N E R A L P L A N F R E S N O , C A L I F O R N I A
R E C I R C U L A T E D P R O G R A M E N V I R O N M E N T A L I M P A C T R E P O R T P U B L I C R E V I E W D R A F T
M A R C H 2 0 2 1
4.16-6
To develop traffic volumes for the remaining 47 segments where existing traffic counts were not available, traffic count data provided by the City was adjusted to reflect existing (2019) roadway segment volumes. Roadway segments where traffic counts were available for existing (2019) conditions were compared with the existing volumes for the same roadway segments previously analyzed in the 2014 MEIR. This comparison establishes the growth along those roadway segments between the 2014 MEIR and existing (2019) conditions. The growth from those roadway segments is applied to the subject segment and the adjacent missing roadway segments to develop a citywide roadway segment dataset for existing (2019) conditions.
Table 2.D of the TIA shows the existing peak-hour traffic volumes at study area roadway segments.
4.16.3.7 Existing Roadway Segment Levels of Service
An LOS analysis was conducted at study area roadway segments to determine current roadway segment performance. As shown in Table 2.D of the TIA, all roadway segments are currently operating at their respective satisfactory LOS in both a.m. and pm. peak hours, with the exception of the following 12 roadway segments:
• Figarden Drive between San Jose Avenue and Bullard Avenue (LOS E in the p.m. peak hour).
• Marks Avenue between Dakota Avenue and Weber Avenue (LOS F in the p.m. peak hour).
• Maroa Avenue between Sample Avenue and Bullard Avenue (County of Fresno) (LOS E in the a.m. peak hour).
• Friant Road between SR-41 southbound off-ramp and SR-41 northbound off-ramp (LOS E in the p.m. peak hour).
• Friant Road between SR-41 northbound off-ramp and Audubon Drive (LOS D in the p.m. peak hour)
• Fowler Avenue between Kings Canyon Road and Belmont Avenue (LOS E in the a.m. peak hour)
• Fowler Avenue between SR-180 westbound ramps and Olive Avenue (LOS E in the a.m. peak hour).
• Temperance Avenue between Butler Avenue and Lowe Avenue (LOS F in the a.m. peak hour).
• Temperance Avenue between McKinley Avenue and Shields Avenue (LOS F in both peak hours).
• Gettysburg Avenue between Maple Avenue and Winery Avenue (LOS F in both peak hours).
• Dakota Avenue between Maroa Avenue and Del Mar Avenue (LOS F in the p.m. peak hour).
• Dakota Avenue between Angus Street and First Street (LOS F in the p.m. peak hour).

R E C I R C U L A T E D P R O G R A M E N V I R O N M E N T A L I M P A C T R E P O R T P U B L I C R E V I E W D R A F T M A R C H 2 0 2 1
G E N E R A L P L A N F R E S N O , C A L I F O R N I A
4.16-7
Figure 2.5 of the TIA (pages 1 through 7) illustrates the locations of the roadway segments and corresponding existing LOS for the a.m. peak hour. Figure 2.6 of the TIA (pages 1 through 7) illustrates the locations of the roadway segments and corresponding existing LOS for the p.m. peak hour.
4.16.3.8 Public Transportation
The City operates the Fresno Area Express (FAX), its primary transportation service provider. FAX’s role is to provide dependable transit that runs smoothly and efficiently to serve the people of Fresno. FAX operates 17 fixed-route buses, including the Bus Rapid Transit (known as the “Q”) and the FAX 15 routes, as well as paratransit services (Handy Ride), extended late-night services, and service to major regional destinations, including colleges, universities, shopping malls, and major employment centers. The FAX fixed-route system integrates with the City of Clovis’ fixed-route system and other incorporated cities within the County through the Fresno County Rural Transit Agency (FRCTA) to serve the region. The FAX fixed-route system comprises routes that typically follow many of Fresno’s major roadways, which are generally spaced with a one-half mile separation. Most of the FAX routes operate at 30-minute frequencies, with exception of the following:
• The Q providing 10-minute frequencies during peak periods and 15-minute frequencies during off-peak periods.
• Two routes providing 15-minute frequencies (the FAX 15 Routes 9 and 38).
• Several additional routes providing 20-minute frequencies all day.
Additionally, the FAX bus system provides connections to the Amtrak passenger rail station and the Greyhound bus station, both of which are located in Downtown. The FAX bus system will establish future connections to the approved High-Speed Rail Fresno station also located in Downtown. Public transportation serving Fresno is shown in Figure 2.7 of the TIA.

G E N E R A L P L A N F R E S N O , C A L I F O R N I A
R E C I R C U L A T E D P R O G R A M E N V I R O N M E N T A L I M P A C T R E P O R T P U B L I C R E V I E W D R A F T
M A R C H 2 0 2 1
4.16-8
Demand-Response Service. Serviced through FAX, the demand-response service (Handy Ride) provides transportation for persons with disabilities. It is responsible for meeting the needs of eligible persons with disabilities who cannot functionally use the FAX fixed route bus system. The service area boundaries are generally Copper Avenue to the north, east to Willow Avenue, south to Ashlan Avenue, east to Temperance Avenue, south to Central Avenue, west to Polk Avenue, north to Griffith Way, west to Fair Street, east to Browning, north to the Fresno County line, and east to Copper Avenue.
Bus Rapid Transit. A first-phase Bus Rapid Transit (BRT) system began operating in 2018 to run along the Ventura Street/Kings Canyon Road and the Blackstone Avenue corridors, meeting in Downtown Fresno at Courthouse Park. The General Plan supports the proposed BRT system through its designation of complementary land uses and higher densities along key portions of its routes, such as higher-density development and mixed land uses that may gravitate toward use of BRT.
High-Speed Rail. The California High-Speed Rail (HSR) System will be a statewide system that will serve as a regional transportation system for Fresno and the surrounding communities. The HSR system would extend through the San Joaquin Valley, linking San Francisco with Los Angeles. Construction began in March 2018 in Madera County just north of Fresno, with a station to be located in Fresno’s Downtown, along Mariposa Street. The HSR tracks through Fresno-Clovis Metropolitan Area would run generally parallel to the Union Pacific Railroad tracks.
Once implemented, the HSR system will increase the accessibility of Fresno to the major population and economic hubs of California. It will also provide an opportunity for redevelopment and infill development of the area around the HSR station that takes advantage of the proximity of the HSR station.
The City has proposed to accommodate the access and space requirements and the potential effects upon surrounding properties and land uses through Specific Plans in the Downtown Planning Area and a HSR Station Area Master Plan (incorporated into the Fulton Corridor Specific Plan, adopted in October 2016). As stated in the General Plan, when the HSR system is fully built, the City ultimately plans to link the FAX and BRT systems with the HSR station.
4.16.3.9 Pedestrian and Bicycle Circulation
Fresno has made a strong commitment to improving non-motorized travel. The City established a Bicycle-Pedestrian Advisory Committee in 2002 and subsequently completed the Bicycle, Pedestrian, and Trails Master Plan (BMP), which was presented to the City Council in 2010. Although the BMP was a separate document and not a part of the General Plan, the General Plan supported the BMP’s aspirations for a comprehensive bicycle and pedestrian facilities network consisting of sidewalks, lanes, paths, and trails while recognizing that the BMP identified more facilities and programs than discussed in the General Plan.
Subsequent to the BMP (2010) and the General Plan (2014), the City Council adopted the Active Transportation Plan (ATP) in March 2017 as an update to the BMP. The ATP is a comprehensive guide outlining the vision for active transportation in Fresno and includes more robust planning for

R E C I R C U L A T E D P R O G R A M E N V I R O N M E N T A L I M P A C T R E P O R T P U B L I C R E V I E W D R A F T M A R C H 2 0 2 1
G E N E R A L P L A N F R E S N O , C A L I F O R N I A
4.16-9
pedestrian travel and infrastructure than is presented in the BMP. The City has established the following goals as part of the ATP:
• To equitably improve the safety and perceived safety of walking and bicycling in the Ccity;
• To achieve an increased number of walking and bicycling trips by creating user-friendly facilities;
• To improve the geographic equity of access to walking and bicycling facilities in the Ccity; and
• To fill key gaps in the City’s walking and bicycling networks.
Pedestrian Circulation. The presence of sidewalks and the quality of the pedestrian realm is a critical factor in the ability to walk around Fresno. Certain areas of Fresno lack continuous sidewalks, leaving pedestrians to share road space with cars. The City began addressing this problem with the “No Neighborhood Left Behind” program in 2005, which added new gutters, curbs, sidewalks, and streetlights to inner-city neighborhoods at a budget of $45 million over six years starting in fiscal year 2005 and has since been completed. With the integration of the ATP, the City has begun providing pedestrian treatments and supportive facilities. Strategies for a comprehensive pedestrian system include the implementation of interconnected sidewalks, continued addition of controlled crosswalks at traffic-controlled intersections, median refuge islands, bulb-outs, in-street and overhead pedestrian crossing signs, and rectangular rapid flashing beacons.
Accessible Design. Most of the city was built before the Federal Americans with Disabilities Act (ADA), which required streets to be accessible to persons in wheelchairs or with impaired mobility. In accordance with the ADA (1990), the City has been committed to ongoing efforts to ensure accessibility for all. In 2016, the ADA Transition Plan for the Right of Way (ROW) and the ADA Facilities Transition Plan were adopted, which set action plans and standards for ADA facilities within Fresno. Additional details on sidewalks and pedestrian treatments and support facilities in Fresno are provided in the ATP.
Bicycle Circulation. Bicycle facilities consist of the following four classifications:
• Bike Paths (Class I) are often referred to as shared-use paths or trails, or multiuse paths, which are off-street facilities that provide exclusive use for non-motorized travel, including bicyclists and pedestrians. Class I facilities are typically 10- to 12-foot wide concrete/asphalt paved surfaces with 2-foot wide shoulders. Bike paths have minimal cross flow with motorists and are typically located along landscaped corridors. Bike paths can be utilized for both recreational and commute trips. These paths provide an important recreational amenity for bicyclists, pedestrians, dog walkers, runners, skaters, and all residents using other non-motorized forms of travel.
• Bike Lanes (Class II) are designated on-street facilities that use striping, stencils, and signage to denote preferential or exclusive use by bicyclists. On-street bikes lanes are typically 5 feet wide and are adjacent to motor vehicle traffic. Bike lanes are intended to alert drivers about the predictable movements of bicyclists and provide adequate space for comfortable bicycle riding.

G E N E R A L P L A N F R E S N O , C A L I F O R N I A
R E C I R C U L A T E D P R O G R A M E N V I R O N M E N T A L I M P A C T R E P O R T P U B L I C R E V I E W D R A F T
M A R C H 2 0 2 1
4.16-10
Current City standards require Class II bike lanes on all new Collectors and Arterials; many existing Collectors are already constructed with Class II bike lanes.
• Bike Routes (Class III) are on-street pavement markings or signage that connect the bicycle roadway network. Class III bike routes can be utilized to connect bicycle lanes or paths along corridors that do not provide enough space for dedicated lanes on low-speed and low-volume streets.
• Separated Bikeways (Class IV) are designated on-street bicycle facilities separated by a physical boundary such as a vertical curb, a painted buffer with flexible posts, parked cars, a landscape area, or a fixed barrier. Separate Bikeways (Class IV), also called Ccycle tracks, are typically 7 feet wide with 3-foot wide shoulders and can include one-way or two-way lanes, accommodating a single direction of travel or both. Cycle tracks can be utilized along streets with high vehicular volumes and speeds and located in areas with fewer driveways.
The ATP includes existing (2016) and 2010 citywide bicycle lane mile coverage identified for all bicycle classifications. As illustrated, Bike Paths (Class I) include 38 miles of coverage in 2016, compared to 14 miles during 2010. Bike Lanes (Class II) include 431 miles of coverage in 2016 compared to 226 miles in 2010. Bike Routes (Class III) include 22 miles of coverage in 2016 compared to 14 miles in 2010. Three Cycle Tracks (Class IV) projects are planned but not yet constructed within the Cityand the first Class IV project has been installed on R Street between Tulare Street and Ventura Street. Additional details on bicycle facilities in the Ccity are provided in the ATP.
Rail/Highway Freight. Fresno is served by The San Joaquin Line, one of Amtrak’s passenger rail services with connections between the San Joaquin Valley, the Sacramento Valley, the San Francisco Bay Area, and Los Angeles. Greyhound provides similar (more frequent) bus service to these regions. In 2019, the San Joaquin Line carried 1.1 million passengers.1
The city is served by two freight lines:
• Burlington Northern and Santa Fe Railway Company (BNSF). This rail corridor has one track and travels through northwest Fresno and the middle of Downtown.
• Union Pacific Railroad (UPRR). This corridor has two tracks and generally runs parallel to SR-99.
According to the 2007 City of Fresno Downtown Transportation and Infrastructure Study, about 50 freight trains pass through the two rail corridors daily as they travel through Downtown. SR-99 and the UPRR are both international trade facilities. Peak shipping months in the San Joaquin Valley are May through October.
1 Amtrak, Amtrak FY19 Ridership, Amtrak Route Ridership FY19 vs FY18. 2019. Available online at: media
.amtrak.com/wp-content/uploads/2019/11/FY19-Year-End-Ridership.pdf (accessed February 7, 2020).

R E C I R C U L A T E D P R O G R A M E N V I R O N M E N T A L I M P A C T R E P O R T P U B L I C R E V I E W D R A F T M A R C H 2 0 2 1
G E N E R A L P L A N F R E S N O , C A L I F O R N I A
4.16-11
Aviation. Fresno is served by three airports: Fresno Yosemite International Airport (FYI), Fresno Chandler Executive Airport, and Sierra Sky Park. Each of the three airports is described below.
• Fresno Yosemite International Airport. The City manages Fresno Yosemite International Airport (FYI) which is located in the eastern portion of the city along East Clinton Way, and is a joint use civilian/military airport. It is used by commercial air carriers, air cargo operators, charter operators, the State of California, general aviation, and the United States military. In 2019, the airport served approximately 1.6 million passengers.2
• Fresno Chandler Executive Airport. Fresno Chandler Executive Airport is located in the southwestern portion of the city, northwest of the intersection of West Kearny Boulevard and South Thorne Avenue. The airport is designated as a general aviation reliever airport for FYI. One small cargo carrier operates out of the facility, and nine general aviation businesses operate out of the airport. Approximately 180 general aviation aircraft are based at Fresno Chandler Executive Airport.
• Sierra Sky Park. Sierra Sky Park airport is located in the northern portion of the city adjacent to the San Joaquin River north of Herndon Avenue. The facility is a privately owned public use general aviation airport. Sierra Sky Park functions as a reliever airport for small general aviation aircraft, and includes a hangar and office complex.
4.16.4 Regulatory Setting
4.16.4.1 Federal Regulatory Setting
Federal Highway Administration. The Federal Highway Administration (FHWA) is a major agency of the United States Department of Transportation. In partnership with State and local agencies, the FHWA carries out federal highway programs to meet the nation’s transportation needs. The FHWA administers and oversees federal highway programs to ensure that federal funds are used efficiently.
2 Bureau of Transportation Statistics, Fresno Yosemite International. 2020. Website: transtats.bts.gov/
airports.asp?pn=1&Airport=FAT&Airport_Name=Fresno (accessed February 7, 2020).

G E N E R A L P L A N F R E S N O , C A L I F O R N I A
R E C I R C U L A T E D P R O G R A M E N V I R O N M E N T A L I M P A C T R E P O R T P U B L I C R E V I E W D R A F T
M A R C H 2 0 2 1
4.16-12
Americans with Disabilities Act of 1990. Titles I, II, III, IV, and V of the ADA have been codified in Title 42 of the United States Code, beginning at Section 12101. Title III prohibits discrimination on the basis of disability in “places of public accommodation” (businesses and nonprofit agencies that serve the public) and “commercial facilities” (other businesses). The regulation includes Standards for Accessible Design, which establish minimum standards for ensuring accessibility when designing and constructing a new facility or altering an existing facility.
Federal Transit Administration. The Federal Transit Administration (FTA) is an authority that provides financial and technical assistance to local public transit systems, including buses, subways, light rail, commuter rail, trolleys, and ferries. The FTA is funded by Title 49 of the United States Code, which states the FTA’s interest in fostering the development and revitalization of public transportation systems. The FTA invests approximately $12 billion annually to support and expand public transit.
4.16.4.2 State Regulatory Setting
Assembly Bill 32 (Global Warming Act of 2006) and Senate Bill 375. Assembly Bill (AB) 32, the California Global Warming Solutions Act of 2006 (Act), requires California to reduce its greenhouse gas (GHG) emissions to levels presented in the year 1990 by 2020. In response, the California Air Resources Board (CARB) is responsible for creating guidelines for this Act. In 2008, CARB adopted its proposed Scoping Plan, which included the approval of Senate Bill (SB) 375 as a means of achieving regional transportation-related GHG targets. SB 375 provides guidance on how curbing emissions from cars and light trucks helps the State comply with AB 32.
Established through CARB, SB 375 lists four major components and requirements: (1) it requires regional GHG emissions targets; (2) it requires creating a Sustainable Communities Strategy (SCS) that provides a plan for meeting the regional targets; (3) it requires that regional housing elements and transportation plans be synchronized on 8-year schedules; and (4) it requires transportation and air pollutant emissions modeling techniques consistent with guidelines prepared by the California Transportation Commission (CTC).
California Air Resources Board. As previously described, as part of SB 375 compliance, CARB was required to set targets for GHG reductions for each Metropolitan Planning Organization (MPO) within California. CARB provides targets and thresholds for MPOs and assists with regional efforts to achieve the GHG emission reductions contained in each MPO’s SCS. It should be noted that CARB does not provide a threshold for reducing VMT; however, reducing VMT is a strategy for achieving CARB GHG reduction targets.
The City has been committed to climate change and GHG/VMT reduction strategies; as such, both the Fresno Council of Governments (COG) and CARB authorities have teamed up to present thresholds with the goal of reducing GHG emissions. Fresno COG’s current SCS, adopted in 2018, includes goals to achieve a 5 percent per capita GHG emissions reduction by 2020 and a 10 percent reduction by 2035, compared to 2005 levels. The SCS includes strategies for encouraging the achievement of these targets. Strategies include increasing transit and active transportation improvements, such as identifying future funding for additional BRT lines within Fresno and over 500 new lane miles of bicycle facilities. These improvements are intended to decrease distances
R E C I R C U L A T E D P R O G R A M E N V I R O N M E N T A L I M P A C T R E P O R T P U B L I C R E V I E W D R A F T M A R C H 2 0 2 1
G E N E R A L P L A N F R E S N O , C A L I F O R N I A
4.16-13
between residents and bicycle/walking facilities and therefore increase infill development. As stated in CARB’s MPO Target Recommendations memo,3 these improvements will result in an increase from 4.0 dwelling units per acre (du/ac) to 9.3 du/ac, caused by the projected increase in multifamily housing development from 22 percent to 47 percent by 2035.
The Fresno COG will be working on its third SCS, proposed for adoption in 2022, which will include goals and polices from the City of Fresno General Plan. In 2018, CARB adopted more aggressive SB 375 targets to support progress toward the 2017 Scoping Plan goals. As a result, the third SCS will include more ambitious SB 375 GHG emission reduction targets within Fresno consisting of 6 percent per capita reductions by 2020 and 13 percent reductions by 2035.
Assembly Bill 1358 (Complete Streets). The California Complete Streets Act (Act) requires general plans updated after January 30, 2011, to include Complete Streets policies so that roadways are designed to safely accommodate all users, including bicyclists, pedestrians, transit riders, children, the elderly, and persons with disabilities, as well as motorists. The goal of this Act is to encourage cities to rethink policies that emphasize automobile circulation and prioritize motor vehicle improvements, and come up with creative solutions that emphasize all modes of transportation. Complete Streets roadways allow for more transportation options, more non-single-occupancy vehicles, and less traffic congestion. Additionally, increased transit ridership, walking, and biking can reduce air pollution while improving the overall travel experience for road users.
While there is no standard for a Complete Streets design, it generally includes one or more of the following features: bicycle lanes, wide shoulders, well-designed and well-placed crosswalks, crossing islands in appropriate mid-block locations, bus pullouts or special bus lanes, audible and accessible pedestrian signals, sidewalk bulb-outs, center medians, street trees, planter strips, and groundcover. The City adopted a Complete Streets Policy on September 26October 10, 2019.
Senate Bill (SB) 743. On September 27, 2013, Governor Jerry Brown signed SB 743 into law and codified a process that changed transportation impact analysis as part of CEQA compliance. SB 743 directs the California Office of Planning and Research (OPR) to administer new CEQA guidance for jurisdictions that removes automobile vehicle delay and LOS or other similar measures of vehicular capacity or traffic congestions from CEQA transportation analysis. Rather, it requires the analysis of VMT or other measures that “promote the reduction of greenhouse gas emissions, the development of multi-modal transportation networks, and a diversity of land uses,” to be used as a basis for determining significant impacts to circulation in California. The goal of SB 743 is to appropriately balance the needs of congestion management with statewide goals related to reducing GHG emissions, encourage infill development, and promote public health through active transportation.
4.16.4.3 Regional Regulatory Setting
Fresno County Council of Governments. The Fresno COG is a voluntary association of local governments and a regional planning agency comprised of 16 member jurisdictions, including the
3 CARB. 2018. Updated Final Staff Report, Proposed Update to the SB 375 Greenhouse Gas Emission
Reduction Targets, February 2018, Appendix A, MPO Target Recommendations and CARB Staff Recommendations.

G E N E R A L P L A N F R E S N O , C A L I F O R N I A
R E C I R C U L A T E D P R O G R A M E N V I R O N M E N T A L I M P A C T R E P O R T P U B L I C R E V I E W D R A F T
M A R C H 2 0 2 1
4.16-14
City of Fresno. The members are represented by a Policy Board consisting of mayors of each incorporated city, and the Chairman of the County Board of Supervisors, or their designated elected official. The Policy Advisory Committee (PAC), composed of the Chief Administrative Officer of each member agency, assists the Board in its decision-making process. Others involved in the decision process include expert staff from member agencies, citizen and interest groups, and other stakeholders. The Fresno COG’s purpose is to establish a consensus on the needs of the Fresno County area and further action plans for issues related to the Fresno County region. The current regional transportation plan, known as the Fresno County Regional Transportation Plan (RTP) (2042), was adopted in 2018. The RTP addresses GHG emissions reductions and other air emissions related to transportation, with the goal of preparing for future growth in a sustainable way. The plan specifies how funding will be sourced and financed for the region’s planned transportation investments, ongoing operations, and maintenance. The goals, objectives, and policies of the RTP are established to direct the courses of action that will provide efficient, integrated multi-modal transportation systems to serve the mobility needs of people, including accessible pedestrian and bicycle facilities, and freight, while fostering economic prosperity and development, and minimizing mobile sources of air pollution. They are organized into six broad transportation mode based categories:
• General Transportation;
• Highway, Streets, and Roads;
• Mass Transportation;
• Aviation;
• Active Transportation; and
• Rail.
San Joaquin Valley Air Pollution Control District. The San Joaquin Valley Air Pollution Control District is the regional agency with the authority to develop and enforce regulations for the control of air pollution throughout the California Central Valley including emissions generated by transportation. The Central Valley is made up of eight counties: San Joaquin, Stanislaus, Merced, Madera, Fresno, Kings, Kern, and Tulare. The San Joaquin Valley Air Pollution Control District’s goal is to improve the health and quality of life for all Valley residents through efficient, effective, and entrepreneurial air quality management strategies. The District’s Governing Board approved the 2016 Plan for the 2008 8-Hour Ozone standard on June 16, 2016. The comprehensive strategy of this plan will reduce nitrogen oxide (NOx) emissions by over 60 percent between 2012 and 2031, and intends to bring the San Joaquin Valley into attainment of the Federal Environmental Protection Agency (EPA) 2008 8-Hour ozone standards.
Assembly Bill 617. In 2017 Governor Jerry Brown signed the Assembly Bill 617 (AB 617) into law to develop a new community focused program to more efficiently reduce exposure to air pollution, including air pollution generated by transportation, and to preserve public health. This Bill is administered by CARB and directs all local air districts to take measures to protect communities

R E C I R C U L A T E D P R O G R A M E N V I R O N M E N T A L I M P A C T R E P O R T P U B L I C R E V I E W D R A F T M A R C H 2 0 2 1
G E N E R A L P L A N F R E S N O , C A L I F O R N I A
4.16-15
disproportionally impacted by air pollution. Components of this Bill include: (1) Community-level air monitoring, (2) State strategy and community-specific emission reduction plans, (3) Accelerated review of retrofit pollution control technologies on industrial facilities subject to Cap-and-Trade, (4) Enhance emission reporting requirements, and (5) increase penalty provisions for polluters. The Fresno Community Emissions Reduction Plan was adopted by the San Joaquin Valley Air Pollution Control District in the fall of 2019.
Fresno County Transportation Authority and Measure C. The Fresno County Transportation Authority (FCTA) is a regional agency that was created to administer the voter-passed Measure C program in 1986. Measure C was a 20-year program that achieved a half-cent sales tax for transportation expenditures and infrastructure. After its 20-year duration, the program was extended for another 20 years in 2006 and named the Measure C Extension Expenditure Plan. Through this funding, the FCTA established goals and core values for utilizing these funds for not only building roads but also completion of added bike lanes; expansion of Fresno and Clovis transit; and support for transit, ridesharing, and vanpools.
Fresno County Congestion Management Process. The Fresno County Congestion Management Process (CMP) is an effective systematic and regionally acceptable approach for managing congestion. Its responsibilities are to provide information on transportation system performance and assess alternative strategies for alleviating congestion and improving mobility for people and goods to levels that meet State and local needs. The Fresno County CMP identifies four general objectives: (1) optimize the transportation facilities through efficient system management; (2) invest in strategies that reduce travel demand, improve system performance, increase safety, and provide effective incident management; (3) reduce VMT by encouraging alternative modes of transportation and promotion of sustainable land use development; and (4) improve public transit, extend bicycle and pedestrian systems, and promote car-sharing and bike-sharing programs to facilitate the development of an integrated multi-modal transportation system in the Fresno region. Using these objectives, the CMP has identified a CMP network that includes SR-41 from the SR-99 interchange to the Madera/Fresno County line, SR-99 from the Madera/Fresno County line to the Jensen Avenue interchange, SR-168 from the SR-180 interchange to the Herndon Avenue interchange, and SR-180 from the SR-99 interchange to the SR-168 interchange.
Guide for the Preparation of Traffic Impact Studies. Caltrans’ “Guide for the Preparation of Traffic Impact Studies”4 (Caltrans 2002) provides general guidance regarding the preparation of traffic impact studies for projects that may have an impact on the State Highway System. The guidance includes when a traffic study should be prepared and the methodology to use when evaluating operating conditions on the State highway system.
The “Guide for the Preparation of Traffic Impact Studies” states, “Caltrans endeavors to maintain a target LOS at the transition between LOS “C” and LOS “D” on state highway facilities, however, Caltrans acknowledges that this may not always be feasible and recommends that the lead agency consult with Caltrans to determine the appropriate target LOS.” In accordance with this recommendation, consultation with Caltrans staff indicated that Caltrans would be willing to
4 California Department of Transportation. 2002. Guide for the Preparation of Traffic Impact Studies.
December.
G E N E R A L P L A N F R E S N O , C A L I F O R N I A
R E C I R C U L A T E D P R O G R A M E N V I R O N M E N T A L I M P A C T R E P O R T P U B L I C R E V I E W D R A F T
M A R C H 2 0 2 1
4.16-16
consider LOS D at the LOS D/E threshold when improvements become infeasible for State facilities. The Guide for the Preparation of Traffic Impact Studies also states that where “an existing State highway facility is operating at less than the appropriate target LOS, the existing [measure of effectiveness (MOE)] should be maintained.”
California Public Utilities Commission (CPUC). The California Public Utilities Commission (CPUC) sets guidelines for interactions between railroad facilities and ground transportation facilities. This includes location and type of crossing guards, design of railroad crossings, and other design criteria in and around railroad facilities. The guidelines come in the form of General Orders (GO).
Guidelines for the Preparation of Traffic Impact Studies within the County of Fresno. Fresno County has established general procedures and requirements for the preparation of traffic impact studies associated with development within the County of Fresno. The guidelines help ensure that traffic impact studies evaluate the impact of proposed new development in a consistent manner, utilize assumptions consistent with the County’s generally accepted methodologies and parameters and will be comparable to other traffic studies submitted to the County for review, provide a standard approach and will reduce confusion and delay in processing development applications, and assist staff in reviewing traffic studies and reduce revisions and resubmissions.
4.16.4.4 Local Regulatory Setting
City of Fresno Active Transportation Plan. The City’s Active Transportation Plan (ATP), adopted in March 2017, provides a comprehensive guide outlining the vision for active transportation in Fresno. The ATP supersedes the Bicycle, Pedestrian, and Trails Master Plan that was adopted in 2010. The ATP envisions a complete, safe, and comfortable network of trails, sidewalks, and bikeways that serves all residents of Fresno. This plan lays out specific goals to improve bicycle and pedestrian access and connectivity in Fresno. These goals include the following:
• Equitably improve the safety and perceived safety of walking and bicycling in Fresno;
• Increase walking and bicycling trips in Fresno by creating user-friendly facilities;
• Improve the geographical equity of access to walking and bicycling facilities in Fresno; and
• Fill key gaps in Fresno’s walking and bicycling networks.
Bus Rapid Transit Master Plan and Southern Blackstone Avenue Smart Mobility Strategy. The BRT Master Plan, adopted in June 2008 by the Fresno COG, provides a vision demonstrating how improved efficiency, speed, and service can attract new transit ridership, improve customer satisfaction, and benefit the broader community by providing a quality of service similar to light rail systems through the use of bus technology. As a result, the City initiated the now operational BRT system service, also known as the “Q.” The “Q” spans 15.7 miles and provides connections to the River Park shopping mall in northern Fresno to Courthouse Park in Downtown Fresno along Blackstone Avenue, and then heads east along Ventura/Kings Canyon Road to Clovis Avenue. To further implement the BRT Master Plan, the City is focused on the revitalization of the central core area and corridors leading into Downtown as illustrated in the Southern Blackstone Avenue Smart

R E C I R C U L A T E D P R O G R A M E N V I R O N M E N T A L I M P A C T R E P O R T P U B L I C R E V I E W D R A F T M A R C H 2 0 2 1
G E N E R A L P L A N F R E S N O , C A L I F O R N I A
4.16-17
Mobility Strategy, adopted in 2019, which identifies the Blackstone Avenue Corridor as Fresno’s most prominent street. The Smart Mobility Strategy addresses the following objectives:
1. Increase access and safety along the Corridor for all travel modes and users, including the elderly, disabled, low-income, and youth;
2. Address deficiencies in the existing street design that are incompatible with the planned land uses outlines in the General Plan and impact business opportunities and performance in the identified activity centers along the Corridor;
3. Recommend multi-modal access and safety improvements for pedestrians and bicyclists as well as transit riders;
4. Recommend potential sidewalk and streetscape enhancements to support pedestrian comfort, access to transit, and access to businesses and services;
5. Identify potential treatments that support the management of traffic speeds within activity centers along the corridor;
6. Consider on-street and off-street parking in the context of recommended multi-modal improvements;
7. Identify opportunities for gateway improvements and wayfinding signage; and
8. Recommend locally feasible implementation and funding strategies for recommended multi-modal improvements.
Transform Fresno. In November 2016, Fresno was selected by the California Strategic Growth Council for their new Transformative Climate Communities Program (TCC) to fund the development and implementation of neighborhood-level transformative climate community plans including greenhouse gas emission reduction projects that provide local economic, environmental, and health benefits to disadvantaged communities. Through this initiative, the Fresno Transformative Climate Communities Collaborative (FTCCC) was established to identify specific projects within Fresno to invest in that will significantly benefit the environment by reducing environmental impacts including vehicle emissions, and benefit the economy of areas within the Downtown, Chinatown, and southwest Fresno.
Complete Streets Policy. The Complete Streets Policy was adopted by the City Council on October 10, 2019, to guide the implementation of the City’s complete streets and multi-modal objectives and policies included within the Fresno General Plan.
The City has integrated Complete Streets designs into its policies in compliance with AB 1358. One example is Policy MT-1-g (Complete Streets Concept Implementation), which calls for providing transportation facilities based upon a Complete Streets concept that facilitates the balanced use of all viable travel modes meeting the transportation needs of all ages, income groups, and abilities. An example of this policy at work is found in the Ventura/Kings Canyon Corridor Complete Streets Plan,

G E N E R A L P L A N F R E S N O , C A L I F O R N I A
R E C I R C U L A T E D P R O G R A M E N V I R O N M E N T A L I M P A C T R E P O R T P U B L I C R E V I E W D R A F T
M A R C H 2 0 2 1
4.16-18
accepted in 2015, as well as the Downtown Neighborhoods Community Plan (2016), the Fulton Corridor Specific Plan (2016), and the Southwest Fresno Specific Plan (2017).
City of Fresno Traffic Impact Study Report Guidelines. The City established general procedures and requirements for the preparation of traffic impact studies associated with development within the City of Fresno. The guidelines include, but are not limited to, discussion of study areas of traffic impact studies, the use of LOS as a metric for determining impacts, traffic analysis scenarios, traffic counts, and trip generation.
City of Fresno CEQA Guidelines for Vehicle Miles Traveled Thresholds. In June 2020, the City adopted VMT thresholds and guidelines to address the shift from delay-based LOS CEQA traffic analyses to VMT CEQA traffic analyses, as required by SB 743. The City’s document serves as a detailed guideline for preparing VMT analyses consistent with SB 743 requirements for development projects, transportation projects, and plans. Project applicants will be required to follow the guidance provided in the City’s document for preparation of CEQA VMT analysis. The document includes the following:
• Definition of region for VMT analysis
• Standardized screening methods for VMT threshold compliance data
• Recommendations for appropriate VMT significance thresholds for development projects, transportation projects, and plans
• Feasible mitigation strategies applicable for development projects, transportation projects, and plans
• For purposes of this analysis, the Fresno COG ABM5 was used to develop screening maps. The Fresno COG ABM base year was updated from 2014 to 2019 based on consultation with Fresno COG staff. The appropriate use of the ABM for VMT calculations has been further elaborated in subsequent chapters of the VMT thresholds and guidelines document.
Policies Related to Implementation of SB 743. As shown in Table 2.E of the TIA, the City has already initiated its incorporation of these SB 743 goals into transportation policies in the Mobility and Transportation Element of the Fresno General Plan.
These policies, in compliance with SB 743, have been represented in projects, plans, and programs throughout Fresno as follows:
• Multi-modal Transportation Networks
○ Construction and launch of a new BRT system on Blackstone Avenue and Kings Canyon Road;
5 LSA. 2020. Fresno County SB 743 Implementation Regional Guidelines. July .Available online at:
www.fresnocog.org/wp-content/uploads/2017/06/Fresno-COGABM-Report.pdf

R E C I R C U L A T E D P R O G R A M E N V I R O N M E N T A L I M P A C T R E P O R T P U B L I C R E V I E W D R A F T M A R C H 2 0 2 1
G E N E R A L P L A N F R E S N O , C A L I F O R N I A
4.16-19
○ Initiation of the Midtown Trail, a Class I bike/pedestrian trail that connects Fresno to Clovis’ existing bike/pedestrian trail system;
○ Installation of new streetscape improvements at Fulton Street located in Downtown Fresno;
○ Road diet implementation throughout Fresno to reduce vehicular travel lanes for addition of bike paths and parking;
○ Adoption of New Development Code standards for sidewalks and pedestrian corridors;
○ Adoption of the Active Transportation Plan (2017);
○ Adoption of the Southern Blackstone Smart Mobility Strategy (2019); and
○ Adoption of Complete Streets Policy (October 2019).
• Reduction in Greenhouse Gases
○ Continuation of implementing citywide and region-wide transportation impact fees;
○ New development of Fresno Green-certified facilities;
○ Addition of new fleet vehicles and buses that are clean-energy vehicles;
○ Addition of light-emitting diode (LED) lighting for Fresno streets; and
○ Addition of tree-planting projects throughout Fresno.
• Diversity of Land Uses
○ Adoption of Traffic Impact Zones to reduce traffic study requirements for priority infill areas;
○ Economic incentives for higher-density development, such as an Affordable Housing density bonus and a Transit-Oriented Development (TOD) density bonus adopted as part of a new Development Code in 2016;
○ Adoption of mixed-use zoning around transit corridors and activity centers as part of the Development Code (2016);
○ Construction of CityView, a four-story mixed-use project on Van Ness Avenue and Inyo Street that contains ground-floor retail and 45 dwelling units above;
○ Construction of approximately 600 units of mixed-use housing above ground-floor retail in Downtown;
○ Adoption of new Development Code standards for streamlining Downtown housing projects; and

G E N E R A L P L A N F R E S N O , C A L I F O R N I A
R E C I R C U L A T E D P R O G R A M E N V I R O N M E N T A L I M P A C T R E P O R T P U B L I C R E V I E W D R A F T
M A R C H 2 0 2 1
4.16-20
○ Adoption of new Development Code standards for three Downtown districts.
City of Fresno General Plan. The following are objectives and policies from the approved General Plan that are relevant to transportation. Figures referenced below are contained in the approved General Plan.
Urban Form, Land Use, and Design Element
Policy LU-1-a: Promote Development within the Existing City Limits as of December 31, 2012. Promote new development, infill, and rehabilitation of existing building stock in the Downtown Planning Area, along BRT corridors, in established neighborhoods generally south of Herndon Avenue, and on other infill sites and vacant land within the City.
Policy LU-1-c: Provision of Public Facilities and Services. Promote orderly land use development in pace with public facilities and services needed to serve development.
Commentary: Proposed school sites, parks, and storm water retention basin sites are shown in their most probable location, but the General Plan Land Use Diagram only represents probable placement for many of these prospective future public uses, and these various future public facility sites may be relocated or purchased in alternate locations.
Policy LU-1-g: SOI Expansion. Maintain the City’s current SOI boundaries without additional expansion, except to allow for the siting of a maintenance yard for the California High Speed Train project and related industrial and employment priority areas proximate to and south of the SOI boundary between State Route 41 and State Route 99. Prohibit residential uses in the expansion area.
Mobility and Transportation Element
Objective MT-1: Create and maintain a transportation system that is safe, efficient, provides access in an equitable manner, and optimizes travel by all modes.
Policy MT-1-a: Transportation Planning Consistent with the General Plan. Continue to review local, regional and inter-regional transportation plans and capital improvement plans, and advocate for the approval and funding of State highway and rail projects, consistent with the General Plan and discourage projects inconsistent with the General Plan.
Policy MT-1-b: Circulation Plan Diagram Implementation. Design and construct planned streets and highways that complement and enhance the existing network, as well as future improvements to the network consistent with the goals, objectives and policies of the General Plan, as shown on the Circulation Diagram (Figure MT-1), to ensure that each new and existing roadway continues to function as intended.
Policy MT-1-c: Plan Line Adoption. Prepare and adopt Official Plan Lines, or other appropriate documentation such as Director Determinations, for transportation corridors,
R E C I R C U L A T E D P R O G R A M E N V I R O N M E N T A L I M P A C T R E P O R T P U B L I C R E V I E W D R A F T M A R C H 2 0 2 1
G E N E R A L P L A N F R E S N O , C A L I F O R N I A
4.16-21
roadways, and bicycle/pedestrian paths/trails, as necessary to preserve and/or obtain right-of-way needed for planned circulation improvements.
Policy MT-1-d: Integrate Land Use and Transportation Planning. Plan for and maintain a coordinated and well integrated land use pattern, local circulation network and transportation system that accommodates planned growth, reduces impacts on adjacent land uses, and preserves the integrity of established neighborhoods.
Policy MT-1-e: Ensure Interconnectivity Across Land Uses. Update development standards and design guidelines applicable to public and private property to achieve Activity Centers, neighborhoods and communities which are well connected by pedestrian, bicycle, appropriate public transportation and automobile travel facilities.
Policy MT-1-f: Match Travel Demand with Transportation Facilities. Designate the types and intensities of land uses at locations such that related travel demands can be accommodated by a variety of viable transportation modes and support Complete Neighborhoods while avoiding the routing of excessive or incompatible traffic through local residential streets.
Policy MT-1-g: Complete Streets Concept Implementation. Provide transportation facilities based upon a Complete Streets concept that facilitates the balanced use of all viable travel modes (pedestrians, bicyclists, motor vehicle and transit users), meeting the transportation needs of all ages, income groups, and abilities and providing mobility for a variety of trip purposes, while also supporting other City goals.
Implementation actions will include:
• Meeting the needs of all users within the street system as a whole; each individual street does not need to provide all modes of travel, but travel by all modes must be accommodated throughout the Planning Area;
• Continuing to adopt refined street cross-section standards as appropriate in response to needs identified;
• Encouraging conversion of one-way streets to two-way streets to improve location circulation, access, and safety;
• Considering the impact of streets on public health by addressing storm water runoff quality, air quality, and water conservation among other factors; and
• Adhering to the water efficient landscape standards adopted by the City for median and streetscape plantings and irrigation methods.
Policy MT-1-h: Update Standards for Complete Streets. Update the City’s Engineering and Street Design Standards to ensure that roadway and streetscape design specifications reflect the Complete Streets concept, while also addressing the needs of through traffic,
G E N E R A L P L A N F R E S N O , C A L I F O R N I A
R E C I R C U L A T E D P R O G R A M E N V I R O N M E N T A L I M P A C T R E P O R T P U B L I C R E V I E W D R A F T
M A R C H 2 0 2 1
4.16-22
transit stops, bus turnouts, passenger loading needs, bike lanes, pedestrian accommodation, and short- and long-term parking.
Commentary: For instance, transit stops and bus turnouts may have higher priority than through traffic on important transit corridors; through traffic may have higher priority than parking on Arterials; and pedestrian and bicycle movement may have high priority in areas with high pedestrian interest and activity such as the Downtown Planning Area.
Policy MT-1-i: Local Street Standards. Establish and implement local roadway standards addressing characteristics such as alignment, width, continuity and traffic calming, to provide efficient neighborhood circulation; to allow convenient access by residents, visitors, and public service and safety providers; and to promote neighborhood integrity and desired quality of life by limiting intrusive pass-through traffic.
Policy MT-1-j: Transportation Improvements Consistent with Community Character. Prioritize transportation improvements that are consistent with the character of surrounding neighborhoods and supportive of safe, functional and Complete Neighborhoods; minimize negative impacts upon sensitive land uses such as residences, hospitals, schools, natural habitats, open space areas, and historic and cultural resources.
In implementing this policy, the City will design improvements to:
• Facilitate provision of multi-modal transportation opportunities;
• Provide added safety, including appropriate traffic calming measures;
• Promote achievement of air quality standards;
• Provide capacity in a cost effective manner; and
• Create improved and equitable access with increased efficiency and connectivity.
Policy MT-1-l: Level of Service in the Downtown Area. Within the Downtown Planning Area accept vehicle LOS F conditions during peak hours for street segments and intersections specified in community and Specific Plans as may be adopted by the City. Where there is an overlap in policies regarding LOS in the Downtown Planning Area, this policy shall supersede.
Policy MT-1-o: LOS Deviations Outside of Activity Centers and Areas Designated for Mixed-Use. Accept vehicle LOS E or F conditions outside of identified multi-modal districts only if provisions commensurate with the level of impact and approved by the City Traffic Engineer are made to sufficiently improve the overall transportation system and/or promote non-vehicular transportation as part of a development project or City-initiated project.
Policy MT-1-p: Participate in Sustainable Communities Strategy/Regional Transportation Plan. Continue to work with the Fresno Council of Governments in developing and updating

R E C I R C U L A T E D P R O G R A M E N V I R O N M E N T A L I M P A C T R E P O R T P U B L I C R E V I E W D R A F T M A R C H 2 0 2 1
G E N E R A L P L A N F R E S N O , C A L I F O R N I A
4.16-23
the Sustainable Communities Strategy and Regional Transportation Plan, consistent with the goals, objectives and policies of the General Plan.
Objective MT-2: Make efficient use of the City's existing and proposed transportation system and strive to ensure the planning and provision of adequate resources to operate and maintain it.
Policy MT-2-a: Intensification of Bus Rapid Transit Corridors. Where traffic has previously been diverted to freeways, encourage incentives for more intense development along transportation corridors, such as the Blackstone Corridor, where there is now additional capacity.
Commentary: The General Plan Land Use Diagram (Figure LU-1) shows corridors where increases in allowable densities are permitted.
Policy MT-2-b: Reduce Vehicle Miles Traveled and Trips. Partner with major employers and other responsible agencies, such the San Joaquin Valley Air Pollution Control District and the Fresno Council of Governments, to implement trip reduction strategies, such as eTRIP, to reduce total vehicle miles traveled and the total number of daily and peak hour vehicle trips, thereby making better use of the existing transportation system.
Policy MT-2-c: Reduce VMT through Infill Development. Provide incentives for infill development that would provide jobs and services closer to housing and multi-modal transportations corridors in order to reduce citywide vehicle miles travelled (VMT).
Commentary: This policy is intended to reduce regional trips and citywide congestion. Even if local congestion increases due to an increase in population from infill, this will eventually improve air quality by reducing per capita vehicle emissions and VMT through shorter commutes and increase in transit and non-motorized modes of travel. This will also reduce the need for regional travel demand transportation improvements.
Policy MT-2-d: Street Redesign where Excess Capacity Exists. Evaluate opportunities to reduce right of way and/or redesign streets to support non-automobile travel modes along streets with excess roadway capacity where adjacent land use is not expected to change over the planning period.
Commentary: Such strategies could include narrowing roads (road diets), adding landscape medians, adding street parking, and adding bike lanes.
Policy MT-2-e: Driveway and Access Consolidation. Take advantage of opportunities to consolidate driveways, access points, and curb cuts along designated major roadways when a change in development or a change in intensity occurs or when traffic operation or safety warrants.
Policy MT-2-f: Optimization of Roadway Operations. Optimize roadway operations by continuing to expand the use of techniques such as the City’s intelligent transportation

G E N E R A L P L A N F R E S N O , C A L I F O R N I A
R E C I R C U L A T E D P R O G R A M E N V I R O N M E N T A L I M P A C T R E P O R T P U B L I C R E V I E W D R A F T
M A R C H 2 0 2 1
4.16-24
system (ITS) to manage traffic signal timing coordination in order to improve traffic operations and increase traffic-carrying capacity, while reducing unnecessary congestion and decreasing air pollution emissions. In order to facilitate roadway optimization and as a potential revenue source for the optimization, the following strategies need to be implemented:
• Dig Once Policy. Install conduit for telecommunications use when trenching or construction occurs.
• Telecommunications Strategy. Develop a costing mechanism for allowing the use of excess conduit within the City for use by communication carriers. The Policy shall follow regulations of the California Public Utilities Commission.
• Grant Funding. Pursue grant funding to assist in construction and/or implementation of fiber-optic or other telecommunication infrastructure for additional public services such as education, economic development, reaching underserved populations, and public safety communications.
Policy MT-2-g: Transportation Demand Management and Transportation System Management. Pursue implementation of Transportation Demand Management and Transportation System Management strategies to reduce peak hour vehicle traffic and supplement the capacity of the transportation system.
Commentary: The City anticipates these strategies will reduce demand on the regional transportation system, limiting the need for major capital investments in those systems.
Policy MT-2-h: Update TIS. Update the City’s Traffic Impact Study guidelines to address all modes of transportation and Complete Streets concepts consistent with the General Plan. The name should be expanded to encompass its assessment of various modes of transportation and connectivity in addition to traffic impacts. Once a regional fee plan or program is in place, the TIS may be used to carry out that plan or program.
Policy MT-2-i: Transportation Impact Studies. Require a Transportation Impact Study (currently named Traffic Impact Study) to assess the impacts of new development projects on existing and planned streets for projects meeting one or more of the following criteria, unless it is determined by the City Traffic Engineer that the project site and surrounding area already has appropriate multi-modal infrastructure improvements.
• When a project includes a General Plan amendment that changes the General Plan Land Use Designation.
• When the project will substantially change the off-site transportation system (auto, transit, bike or pedestrian) or connection to the system, as determined by the City Traffic Engineer.

R E C I R C U L A T E D P R O G R A M E N V I R O N M E N T A L I M P A C T R E P O R T P U B L I C R E V I E W D R A F T M A R C H 2 0 2 1
G E N E R A L P L A N F R E S N O , C A L I F O R N I A
4.16-25
• Transportation impact criteria are tiered based on a project’s location within the City’s Sphere of Influence. This is to assist with areas being incentivized for development. The four zones, as defined on Figure MT-4 (of the approved General Plan), are listed below. The following criteria apply:
○ Traffic Impact Zone I (TIZ-I): TIZ-I represents the Downtown Planning Area. Maintain a peak hour LOS standard of F or better for all intersections and roadway segments. A TIS will be required for all development projected to generate 200 or more peak hour new vehicle trips.
○ Traffic Impact Zone II (TIZ-II): TIZ-II generally represents areas of the City currently built up and wanting to encourage infill development. Maintain a peak hour LOS standard of E or better for all intersections and roadway segments. A TIS will be required for all development projected to generate 200 or more peak hour new vehicle trips.
○ Traffic Impact Zone III (TIZ-III): TIZ-III generally represents areas near or outside the City Limits but within the SOI as of December 31, 2012. Maintain a peak hour LOS standard of D or better for all intersections and roadway segments. A TIS will be required for all development projected to generate 100 or more peak hour new vehicle trips.
○ Traffic Impact Zone IV (TIZ-IV): TIZ-IV represents the southern employment areas within and planned by the City. Maintain a peak hour LOS standard of E or better for all intersections and roadway segments. A TIS will be required for all development projected to generate 200 or more peak hour new vehicle trips.
Policy MT-2-j: Funding for Multi-Modal Transportation System. Continue to seek and secure adequate financing to construct and maintain a complete multi-modal system through such measures as development impact fees, local sales tax measures, special tax measures, assessment/improvement districts, and regional, state and federal transportation funds and grants.
Commentary: This policy will be coordinated with policies and objectives for fiscal sustainability in the Economic Development and Fiscal Sustainability Element.
Policy MT-2-k: Funding for Complete Streets Retrofits. Continue to participate in a comprehensive analysis of transportation needs and the funding of transportation improvements, including State and federal grant funding to support Complete Street retrofit improvements, within the Fresno-Clovis Metropolitan Area.
Commentary: This will be done cooperatively with the Fresno Council of Governments, other government agencies, and public interest groups.
Policy MT-2-l: Region-Wide Transportation Impact Fees. Continue to support the implementation of metropolitan-wide and region-wide transportation impact fees sufficient

G E N E R A L P L A N F R E S N O , C A L I F O R N I A
R E C I R C U L A T E D P R O G R A M E N V I R O N M E N T A L I M P A C T R E P O R T P U B L I C R E V I E W D R A F T
M A R C H 2 0 2 1
4.16-26
to cover the proportional share of a development's impacts and need for a comprehensive multi-modal transportation system that is not funded by other sources. Work with the Council of Fresno County Governments, transportation agencies (e.g. Caltrans, Federal Transportation Agency) and other jurisdictions in the region to develop a method for determining:
• Regional transportation impacts of new development;
• Regional highways, streets, rail, trails, public transportation, and goods movement system components, consistent with the General Plan, necessary to mitigate those impacts and serve projected demands;
• Projected full lifetime costs of the regional transportation system components, including construction, operation, and maintenance; and
• Costs covered by established funding sources.
Commentary: This policy is consistent with and supports policies and objectives for fiscal sustainability in the Economic Development and Fiscal Sustainability Element.
Objective MT-3: Identify, promote and preserve scenic or aesthetically unique corridors by application of appropriate policies and regulations.
Policy MT-3-a: Scenic Corridors. Implement measures to preserve and enhance scenic qualities along scenic corridors or boulevards, including:
• Van Ness Boulevard - Weldon to Shaw Avenues
• Van Ness Extension - Shaw Avenue to the San Joaquin River Bluff
• Kearney Boulevard - Fresno Street to Polk Avenue
• Van Ness/Fulton couplet - Weldon Avenue to Divisadero
• Butler Avenue - Peach to Fowler Avenues
• Minnewawa Avenue - Belmont Avenue to Central Canal
• Huntington Boulevard - First Street to Cedar Avenue
• Shepherd Avenue - Friant Road to Willow Avenue
• Audubon Drive - Blackstone to Herndon Avenues
• Friant Road - Audubon to Millerton Roads

R E C I R C U L A T E D P R O G R A M E N V I R O N M E N T A L I M P A C T R E P O R T P U B L I C R E V I E W D R A F T M A R C H 2 0 2 1
G E N E R A L P L A N F R E S N O , C A L I F O R N I A
4.16-27
• Tulare Avenue - Sunnyside to Armstrong Avenues
• Ashlan Avenue - Palm to Maroa Avenues
Policy MT-3-b: Preserve street trees lining designated scenic corridors or boulevards. Replace trees of the predominant type and in a comparable pattern to existing plantings if there is no detriment to public safety.
Objective MT-4: Establish and maintain a continuous, safe, and easily accessible bikeways system throughout the metropolitan area to reduce vehicle use, improve air quality and the quality of life, and provide public health benefits.
Policy MT-4-a: Active Transportation Plan. To the extent consistent with this General Plan, continue to implement and periodically update the Active Transportation Plan to meet State standards and requirements for recommended improvements and funding proposals as determined appropriate and feasible.
Policy MT-4-b: Bikeway Improvements. Establish and implement property development standards to assure that projects adjacent to designated bikeways provide adequate right-of-way and that necessary improvements are constructed to implement the planned bikeway system shown on Figure MT-2 to provide for bikeways, to the extent feasible, when existing roadways are reconstructed; and alternative bikeway alignments or routes where inadequate right-of-way is available.
Policy MT-4-c: Bikeway Linkages. Provide linkages between bikeways, trails and paths, and other regional networks such as the San Joaquin River Trail and adjacent jurisdiction bicycle systems wherever possible.
Policy MT-4-d: Prioritization of Bikeway Improvements. Prioritize bikeway components that link existing separated sections of the system, or that are likely to serve the highest concentration of existing or potential cyclists, particularly in those neighborhoods with low vehicle ownership rates, or that are likely to serve destination areas with the highest demand such as schools, shopping areas, recreational and park areas, and employment centers.
Policy MT-4-e: Minimum Bike Lane Widths. Provide not less than 10 feet of street width (five feet for each travel direction) to implement bike lanes for designated Class II bikeways along roadways. Strive for 14 feet of street width (seven feet for each travel direction) for curbside bike lanes where right-of-way is available.
Policy MT-4-f: Bike Detection Devices. Include bicycle detection devices when new intersection traffic control signals are installed and strive to retrofit existing traffic control signals to provide bicycle detection and retiming of signal phases to make them more bicycle friendly.

G E N E R A L P L A N F R E S N O , C A L I F O R N I A
R E C I R C U L A T E D P R O G R A M E N V I R O N M E N T A L I M P A C T R E P O R T P U B L I C R E V I E W D R A F T
M A R C H 2 0 2 1
4.16-28
Policy MT-4-h: Bicycle Parking Facilities. Promote the installation of bicycle locking racks and bicycle parking facilities at public buildings, transit facilities, public and private parking lots, and recreational facilities. Establish standards for bicycle parking in the Development Code.
Policy MT-4-i: Bicycling and Public Transportation. Promote the integration of bicycling with other forms of transportation, including public transit. Continue to provide bike racks or space for bicycles on FAX buses.
Policy MT-4-j: Street Maintenance for Bicycle Safety. Provide regular sweeping and other necessary maintenance to clear bikeways of dirt, glass, gravel, and other debris and maintain the integrity of the bicycling network.
Policy MT-4-k: Bicycle Safety, Awareness, and Education. Promote bicycle ridership by providing secure bicycle facilities, promoting traffic safety awareness for both bicyclists and motorists, promoting the air quality benefits, promoting non-renewable energy savings, and promoting the public health benefits of physical activity.
Objective MT-5: Establish a well-integrated network of pedestrian facilities to accommodate safe, convenient, practical, and inviting travel by walking, including for those with physical mobility and vision impairments.
Policy MT-5-a: Sidewalk Development. Pursue funding and implement standards for development of sidewalks on public streets, with priority given to meeting the needs of persons with physical and vision limitations; providing safe routes to school; completing pedestrian improvements in established neighborhoods with lower vehicle ownership rates; or providing pedestrian access to public transportation routes.
Policy MT-5-b: Sidewalk Requirements. Assure adequate access for pedestrians and people with disabilities in new residential developments per adopted City policies, consistent with the California Building Code and the Americans with Disabilities Act.
Policy MT-5-c: New Subdivision Design. Do not approve new single-family residential subdivisions with lots that front and access onto a major roadway, unless the City Traffic Engineer determines that no other feasible alternative means of vehicle access can be provided and that sufficient design measures can be implemented, such as an on-site driveway turnaround, landscaped buffering, or an on-street parking lane to assure a desirable and enduring residential environment.
Commentary: To make this determination, the City Traffic Engineer may require an evaluation of alternative means of access, including frontage roads, backup treatment, and substantial redesign of the subdivision proposal.
Policy MT-5-d: Pedestrian Safety. Minimize vehicular and pedestrian conflicts on both major and non-roadways through implementation of traffic access design and control standards addressing street intersections, median island openings and access driveways to

R E C I R C U L A T E D P R O G R A M E N V I R O N M E N T A L I M P A C T R E P O R T P U B L I C R E V I E W D R A F T M A R C H 2 0 2 1
G E N E R A L P L A N F R E S N O , C A L I F O R N I A
4.16-29
facilitate accessibility while reducing congestion and increasing safety. Increase safety and accessibility for pedestrians with vision disabilities through the installation of Accessible Pedestrian Signals at signalized intersections.
Policy MT-5-e: Traffic Management in Established Neighborhoods. Establish acceptable design and improvement standards and provide traffic planning assistance to established neighborhoods to identify practical traffic management and calming methods to enhance the pedestrian environment with costs equitably assigned to properties receiving the benefits or generating excessive vehicle traffic.
Policy MT-5-f: Modifications to Street Standards. Continue to evaluate and adopt modifications to City street standards to achieve overall objectives of providing good access and travel opportunities while calming traffic, promoting pedestrian and other transportation options, and reducing the amount of land devoted to streets.
Objective MT-6: Establish a network of multi-purpose pedestrian and bicycle paths, as well as limited access trails, to link residential areas to local and regional open spaces and recreation areas and urban Activity Centers in order to enhance Fresno's recreational amenities and alternative transportation options.
Policy MT-6-a: Link Residences to Destinations. Design a pedestrian and bicycle path network that links residential areas with Activity Centers, such as parks and recreational facilities, educational institutions, employment centers, cultural sites, and other focal points of the city environment.
Policy MT-6-b: Multi-Agency Planning for Paths and Trail System. Continue to participate in multi-agency planning and implementation partnerships for the coordinated development of the Fresno-Clovis Metropolitan Area planned path and trail system and with Madera County for the San Joaquin River Parkway trail system.
Policy MT-6-c: Link Paths and Trails and Recreational Facilities. Strive to provide path or trail connections to recreational facilities, including parks and community centers where appropriate, and give priority to pathway improvements within neighborhoods characterized by lower vehicle ownership rates and lower per capita rates of parks and public open space.
Policy MT-6-d: Link Paths and Trails and Cultural Resources. Strive to designate and implement paths and trails to pass by environmental amenities, historic sites, and other cultural resources, where appropriate, and provide informational signage or other interpretation of those resources to the public.
Policy MT-6-e: Utilize Public Rights of Way. Pursue the attainment of path and trail corridors within abandoned railroad rights-of-way, canal alignments, PG&E transmission tower easements, limited access streets (Expressways, freeways), riverbottom/bluff areas, or other such rights-of-ways. Offer existing easements and rights-of-way to local agencies before selling them to private parties.

G E N E R A L P L A N F R E S N O , C A L I F O R N I A
R E C I R C U L A T E D P R O G R A M E N V I R O N M E N T A L I M P A C T R E P O R T P U B L I C R E V I E W D R A F T
M A R C H 2 0 2 1
4.16-30
Policy MT-6-f: Path and Trail Designation Process. Develop a network of multi-purpose path and trail corridors by using the Official Plan Line process or other processes as provided by the Development Code to obtain appropriate linear rights-of-way along riparian corridors, drainage and irrigation easements, utility easements, abandoned railroad rights-of-way, and major street corridors.
Policy MT-6-g: Path and Trail Development. Require all projects to incorporate planned multi-purpose path and trail development standards and corridor linkages consistent with the General Plan, applicable law and case-by-case determinations as a condition of project approval.
Commentary: This should be done pursuant to Figure MT-2: Paths and Trails, and the adopted ATP, as may amended.
Policy MT-6-h: Preference for Public Ownership. Avoid path and trail alignments that involve private ownership of sections of public path or trail right-of-way. Use the Director Determination process, if necessary, to adjust planned path or trail rights-of-way to avoid these situations by realigning along more visible, publicly owned routes.
Policy MT-6-i: Path and Trail Design Standards. Designate and design paths and trails in accordance with design standards established by the City that give consideration to all path and trail users (consistent with design, terrain and habitat limitations) and provide for appropriate widths, surfacing, drainage, design speed, barriers, fences, signage, visibility, intersections, bridges, and street cleaning.
Commentary: Trail improvements and characteristics (e.g. accessibility, continuity, width and location, and surface treatment) within the Fancher Creek water conveyance and riparian corridor, and other alignments immediately adjacent to existing or planned residential land, will be determined by the City Council after providing for appropriate public participation.
Policy MT-6-j: Variety in Path and Trail Design. Provide for different levels and types of usable pedestrian and bicycle corridors, including broad, shaded sidewalks; jogging paths; paved and all terrain bicycle paths; through-block passageways; and hiking trails. Where a designated multi-purpose path route is adjacent to a public right-of-way which accommodates bike lane, allow for flexibility in path design, so that bike lanes may be substituted for the bicycle component of the multi-purpose path where it is safe and appropriate to do so.
Commentary: This should be done pursuant to Figure MT-2: Paths and Trails, and the adopted ATP, as amended.
Policy MT-6-k: Path and Trail Buffers. Use landscaping with appropriate and adequate physical and visual barriers (e.g., masonry walls, wrought-iron, or square-tube fencing) to screen path and trail rights-of ways and separate paths and trails from mining operations, drainage facilities, and similar locations as warranted.

R E C I R C U L A T E D P R O G R A M E N V I R O N M E N T A L I M P A C T R E P O R T P U B L I C R E V I E W D R A F T M A R C H 2 0 2 1
G E N E R A L P L A N F R E S N O , C A L I F O R N I A
4.16-31
Policy MT-6-l: Environmentally Sensitive Path and Trail Design. Develop paths and trails with minimum environmental impact by taking the following actions:
• Surface paths and trails with materials that are conducive to maintenance and safe travel, choosing materials that blend in with the surrounding area;
• Design paths and trails to follow contour lines where the least amount of grading (fewest cuts and fills) and least disturbance of the surrounding habitat will occur;
• Beautify path and trail rights-of-way in a manner consistent with intended use, safety, and maintenance;
• Use landscaping to stabilize slopes, create physical or visual barriers, and provide shaded areas; and
• Preserve and incorporate native plant species into the landscaping.
Policy MT-6-m: Path and Trail Crossings. Limit vehicle access, to the extent feasible, where paths or trails are designated parallel and adjacent to roadways, with consideration given to other transportation, land use, and site design priorities and constraints.
Policy MT-6-n: Emergency Vehicle Access along Paths and Trails. Provide points of emergency vehicle access within the path and trail corridors, via parking areas, service roads, emergency access gates in fencing, and firebreaks.
Commentary: Service roads will be interconnected, where possible, to permit through travel by emergency vehicles.
Objective MT-7: Pursue a variety of funding sources to maximize implementation and development of the City's path and trail system.
Policy MT-7-a: Urban Path and Trail Development Funds. Continue to seek grants and other funding sources for trail construction and maintenance, and support the enactment of State and federal legislation that will expand urban path and trail development funds.
Policy MT-7-b: Supporting Nonprofit Organizations. Support and assist nonprofit organizations whose purpose or charter is to promote and support public path and trail construction and maintenance. Establish an “Adopt a Path/Trail” program that allows private entities to maintain segments.
Policy MT-7-c: Citywide Funding Program for Path and Trail Network. Strive to establish an equitable citywide funding program for construction and maintenance of the path and trail network, in order to:
G E N E R A L P L A N F R E S N O , C A L I F O R N I A
R E C I R C U L A T E D P R O G R A M E N V I R O N M E N T A L I M P A C T R E P O R T P U B L I C R E V I E W D R A F T
M A R C H 2 0 2 1
4.16-32
• Acquire right-of-way needed for paths and trails in already-developed neighborhoods and other areas, as identified in community plans, Specific Plans, and neighborhood plans;
• Reimburse developers for public path and trail development costs that they may incur in excess of the trail cost attributable to the impact of their development project (this may require a citywide nexus study); and
• Seek funding sources to add to and adequately maintain the citywide path and trail network.
Commentary: This program could be folded into a comprehensive parks and trails funding program, supported by voter-approved sales tax revenues.
Objective MT-8: Provide public transit options that serve existing and future concentrations of residences, employment, recreation and civic uses and are feasible, efficient, safe, and minimize environmental impacts.
Commentary: Public transit services must meet accessibility standards for individuals with disabilities as required by applicable state and federal regulations.
Policy MT-8-a: Street Design Coordinated with Transit. Coordinate the planning, design, and construction of the major roadway network with transit operators to facilitate efficient direct transit routing throughout the Planning Area.
Commentary: Neighborhoods with circuitous and discontinuous streets are more difficult for public transit to serve efficiently than those with consistently spaced linear or semi-grid patterns.
Policy MT-8-b: Transit Serving Residential and Employment Nodes. Identify the location of current and future residential and employment concentrations and Activity Centers throughout the transit service area in order to facilitate planning and implementation of optimal transit services for these uses. Work with California State University, Fresno to determine locations within the campus core for bus stops.
Policy MT-8-c: New Development Facilitating Transit. Continue to review development proposals in transportation corridors to ensure they are designed to facilitate transit. Coordinate all projects that have residential or employment densities suitable for transit services, so they are located along existing or planned transit corridors or that otherwise have the potential for transit orientation to FAX, and consider FAX’s comments in decision-making.
Policy MT-8-d: Coordination of Transportation Modes. Plan, design, and implement transportation system improvements promoting coordination and continuity of transportation modes and facilities, such as shared parking or park and ride facilities at Activity Centers.

R E C I R C U L A T E D P R O G R A M E N V I R O N M E N T A L I M P A C T R E P O R T P U B L I C R E V I E W D R A F T M A R C H 2 0 2 1
G E N E R A L P L A N F R E S N O , C A L I F O R N I A
4.16-33
Policy MT-8-e: Regional Coordination. Continue to work with local and regional governmental institutions to promote efficient transportation policies and coordinated programs.
Policy MT-8-f: Multi-modal Downtown Transportation Facility. Support the development of a multi-modal transportation facility in Downtown.
Commentary: Additional details for the facility are anticipated to be addressed in a future community or Specific Plan, such as the proposed DNCP or FCSP.
Policy MT-8-g: High Speed Train. If the State moves forward with HST, ensure it is constructed through Fresno in a manner that minimizes impacts to surrounding property owners and creates the most opportunity for redevelopment around the HST station.
Policy MT-8-h: Move Forward with High Speed Train Station Area Planning. Work with local residents, property and business owners, and other stakeholders to develop a station area plan to provide the most opportunity for growth and prosperity in concert with development of the Fresno HST station.
Policy MT-8-i: Legislative Support. Monitor State and federal legislation that creates incentives to reduce auto dependency and support the use of alternatives to the single occupant vehicle and support legislation that is consistent with the General Plan.
Policy MT-8-j: Transit Services. Emphasize expansion of transit service in low income neighborhoods that lack appropriate service levels.
Objective MT-9: Provide public transit opportunities to the maximum number and diversity of people practicable in balance with providing service that is high in quality, convenient, frequent, reliable, cost- effective, and financially feasible.
Policy MT-9-a: Equitable Transit Provision. Provide transit that can serve all residents, including older residents and persons with disabilities.
Policy MT-9-b: Transit Service Productivity Evaluation. Continue to evaluate transit service productivity and cost efficiency indicators in the City’s Short-Range Transit Plan, and make necessary and appropriate service adjustments when operationally and financially feasible.
Commentary: Short-range transportation planning is a federal requirement for continued funding.
Policy MT-9-c: Addressing Unmet Transit Needs. Continue to participate in the Council of Fresno County Governments’ annual unmet transit needs evaluation process, particularly with respect to identifying need for access to medical and educational services; perform market analysis to identify potential transit choice riders; and pursue public education and information programs to identify changes in demand characteristics and opportunities to increase ridership.

G E N E R A L P L A N F R E S N O , C A L I F O R N I A
R E C I R C U L A T E D P R O G R A M E N V I R O N M E N T A L I M P A C T R E P O R T P U B L I C R E V I E W D R A F T
M A R C H 2 0 2 1
4.16-34
Policy MT-9-d: Long-Range Transit Options. Advocate and participate in regional transportation analyses and identify appropriate long-range measures to support incorporation of light rail transit and other advanced transit service within major transportation corridors, freeway and railroad alignments.
Policy MT-9-e: Area Specific Transit Improvements. Continue to evaluate and pursue the planning and implementation of area specific transit improvements, such as street car facilities.
Policy MT-9-f: Encourage Telecommuting. Support measures that will facilitate expanded use of telecommunications technologies to reduce congestion, expansion of regional transportation facilities consistent with this General Plan, energy use, and air emissions (i.e., work at home, dispersed telecommute work centers, teleconferencing).
Objective MT-10: Establish parking standards that are strategically tuned to support neighborhoods, shopping districts and employment centers that have a complete range of transportation choices.
Policy MT-10-a: Updating Parking Standards. Update off-street parking standards to reflect the context and location within activity areas of multiple uses and reductions appropriate for mixed residential and non-residential uses and proximity to existing or planned transit service.
Policy MT-10-b: Shared Parking. Establish a strategy to promote the sharing of excess parking between uses within Activity Centers and BRT corridors, including specific provisions for this in the Development Code.
Policy MT-10-c: Transportation Demand Management Guidelines. Establish transportation demand management guidelines to allow for reduced off-street parking requirements.
Policy MT-10-d: Parking Maximums. Explore maximum off-street parking limits within Activity Centers proximate to BRT corridors, if such an Activity Center is determined compatible with promotion of a healthy and vigorous business environment.
Policy MT-10-e: Parking Cash-Out. Educate employers of 50 or more persons on their obligation to provide a “parking cash-out program” under State law and enforce compliance.
Commentary: Under such a program, an employer offers a cash allowance to an employee equivalent to the cost of parking the employer would otherwise provide, as an incentive to using alternative modes of transportation for commuting. These programs must be offered in any non-attainment area for air quality.
A 2009 amendment to State law on parking cash-out provides authority for cities to enforce these requirements, including penalties to be imposed on employers who do not provide the “parking cash-out” allowance to employees.

R E C I R C U L A T E D P R O G R A M E N V I R O N M E N T A L I M P A C T R E P O R T P U B L I C R E V I E W D R A F T M A R C H 2 0 2 1
G E N E R A L P L A N F R E S N O , C A L I F O R N I A
4.16-35
Policy MT-10-f: Parking Benefit Districts. Establish parking benefit districts to fund consolidated public parking where supported by local businesses.
Commentary: Net revenues collected from on-street parking pricing and permit revenues can be dedicated to funding public improvements within designated Parking Benefit Districts, ensuring that revenue is used to benefit the blocks where the money is collected. State laws provide for public parking facility construction, operation and maintenance.
General Plan Policy Revisions. The following General Plan policies are proposed to be revised as a part of this project. Specific text changes are shown below; double-underlined text represents language that will be added to the General Plan, and text with strikethrough represents language that will be deleted from the General Plan.
Policy MT-1-k: Multi-Modal Level of Service Standards. Develop and use a tiered system of flexible, multi-modal Level of Service standards for streets designated by the Circulation Diagram (Figure MT-1). Strive to accommodate a peak hour vehicle LOS of D or better on street segments and at intersections, except where Policies MT-1-m through MT-1-p provide greater specificity. Establish minimum acceptable service levels for other modes and use them in the development and environmental review process.
Policy MT-1-m: Standards for Planned Bus Rapid Transit Corridors and Activity Centers. Independent of the Traffic Impact Zones identified in MT-2-i and Figure MT-4, strive to maintain the following vehicle LOS standards on major roadway segments and intersections along Bus Rapid Transit Corridors and in Activity Centers:
• LOS E or better at all times, including peak travel times, unless the City Traffic Engineer determines that mitigation to maintaining this LOS would be infeasible and/or conflict with the achievement of other General Plan policies.
• Accept LOS F conditions in Activity Centers and Bus Rapid Transit Corridors only if provisions are made to improve the overall system and/or promote non-vehicular transportation and transit as part of a development project or a City-initiated project. In accepting LOS F conditions, the City Traffic Engineer may request limited analyses of operational issues at locations near Activity Centers and along Bus Rapid Transit Corridors, such as queuing or left-turn movements.
• Give priority to maintaining pedestrian service first, followed by transit service and then by vehicle LOS, where conflicts between objectives for service capacity between different transportation modes occur.
• Identify pedestrian-priority and transit-priority streets where these modes would have priority in order to apply a multi-modal priority system, as part of the General Plan implementation.
G E N E R A L P L A N F R E S N O , C A L I F O R N I A
R E C I R C U L A T E D P R O G R A M E N V I R O N M E N T A L I M P A C T R E P O R T P U B L I C R E V I E W D R A F T
M A R C H 2 0 2 1
4.16-36
Policy MT-1-n: Peak Hour Vehicle LOS. For planning purposes and implementation of Capital Improvement Projects, Mmaintain a peak-hour vehicle LOS standard of D or better for all roadway areas outside of identified Activity Center and Bus Rapid Transit Corridor districts, unless the City Traffic Engineer determines that mitigation to maintaining this LOS would be infeasible and/or conflict with the achievement of other General Plan policies.
Policy MT-2-m: Use VMT analysis for CEQA. Use Vehicle Miles Traveled (VMT) as the criteria for evaluating transportation impacts under the California Environmental Quality Act (CEQA), pursuant to Senate Bill 743. Level of Service (LOS) may still be used for planning purposes and implementation of Capital Improvement Projects; however, VMT shall be used for determining impacts and mitigation under CEQA beginning in July of 2020.
Commentary: In 2013, the State of California passed Senate Bill 743, which eliminated automobile Level of Service (LOS) from transportation analysis under CEQA and replaced it with VMT. This shift from LOS to VMT is intended to better align with other statewide transportation goals, including reduction of GHG emissions, the creation of multimodal networks, and the promotion of integrated land uses.
Policy MT-4-g: Advocacy for Bike Accommodation. Advocate for the accommodation of bike facilities in new or upgraded State Route interchanges and railroad construction projects, and construction of bicycle crossings of freeways and railroads.
Caltrans has indicated that California’s transportation system cannot meet the State’s needs with just highways and supports guidelines meant to improve Caltrans’ design of bicycle facilities. The guidelines were developed by the American Association of State Highway Transportation Officials and the National Association of City Transportation Officials. These guidelines promote a network of Class I bicycle facilities that connect major origins and destinations linked with a network of Class II facilities on all possible streets. A Class I bicycle facility is situated on a separate right-of-way or with some sort of physical barrier placed on the street between the bicycle and motor vehicle, while a Class II facility shares the travel way with motor vehicles separated by striping. These standards should be considered as transportation system developments so as not to preclude future design options.
4.16.5 Significance Criteria
The thresholds for impacts related to transportation used in this analysis are consistent with Appendix G of the State CEQA Guidelines. Continued implementation of the approved General Plan, text changes to the Mobility and Transportation Element, and the updates to the Greenhouse Gas Reduction Plan would result in a significant impact related to transportation if they would:
TRA-1 Conflict with a program, plan, ordinance or policy addressing the circulation system, including transit, roadway, bicycle and pedestrian facilities;
TRA-2 Conflict or be inconsistent with CEQA Guidelines section 15064.3, subdivision (b);
R E C I R C U L A T E D P R O G R A M E N V I R O N M E N T A L I M P A C T R E P O R T P U B L I C R E V I E W D R A F T M A R C H 2 0 2 1
G E N E R A L P L A N F R E S N O , C A L I F O R N I A
4.16-37
TRA-3 Substantially increase hazards due to a geometric design feature (e.g., sharp curves or dangerous intersections) or incompatible uses (e.g., farm equipment);
TRA-4 Result in inadequate emergency access.
4.16.6 Impacts and Mitigation Measures
4.16.6.1 Project Impacts
The following discussion describes the potential impacts related to transportation that could result from continued implementation of the General Plan. The proposed text changes to the Mobility and Transportation Element and the updates to the Greenhouse Gas Reduction Plan are not anticipated to result in impacts related to transportation because these changes are narrow in scope and do not result in direct physical changes to the environment.
TRA-1 Conflict with a program, plan, ordinance or policy addressing the circulation system, including transit, roadway, bicycle and pedestrian facilities.
The City’s long-term mobility system goals and policies are closely correlated to the Urban Form, Land Use, and Design Element of the approved General Plan. These goals and policies are intended to provide a balance between Fresno’s future growth and land use development, roadway size, traffic LOS, and VMT. The LOS analysis included below and in the TIA is included because the General Plan Mobility and Transportation Element requires traffic planning to assess LOS for future traffic planning.
The analysis included below is a summary of the TIA and describes the roadway network traffic volumes and LOS under forecast build out conditions. Build out traffic has been assessed over existing roadway geometry to identify circulation deficiencies that are forecast to occur under build out conditions. This would assist in identifying improvements required to support growth anticipated for Fresno and the region. Identification of these improvements would help in developing the recommended citywide General Plan circulation system.
General Plan (2035) Conditions Traffic. The General Plan conditions include the land use data from the City’s Urban Form, Land Use, and Design Element.
The Fresno COG ABM is the most current travel demand model for the region. The model’s base year is 2014 and includes socioeconomic data (SED) corresponding to year 2014 conditions. Therefore, information regarding all land development occurring between 2014 and 2019 was collected from the City to update the model’s base year to 2019. The land development information was provided to Fresno COG staff who then updated the model’s base year SED to year 2019. The updated SED were used to develop base year (2019) model runs from the ABM.
The future year in the ABM is year 2035. The SED included in the year 2035 scenario are based on the year 2035 projections as included in the 2050 Fresno County Growth Projections report prepared for Fresno COG. The 2035 SED projections present a conservative estimate of regional growth in population and employment based on multiple data sources as included in the report. Therefore, year 2035 was considered as the General Plan condition for purposes of this analysis.

G E N E R A L P L A N F R E S N O , C A L I F O R N I A
R E C I R C U L A T E D P R O G R A M E N V I R O N M E N T A L I M P A C T R E P O R T P U B L I C R E V I E W D R A F T
M A R C H 2 0 2 1
4.16-38
Additionally, the SED included in the ABM under year 2035 conditions includes a slightly higher intensity of land uses compared to the City’s General Plan land uses. Therefore, the ABM year 2035 SED data present a more conservative estimate of the General Plan land uses. As such, based on discussions with Fresno COG and City staff, the ABM year 2035 scenario was used as is to develop General Plan (2035) traffic volumes.
Traffic volumes were developed by post-processing existing traffic volumes using the National Cooperative Highway Research Program (NCHRP) difference method between the model base (2019) and future year (2035) conditions. Detailed volume development worksheets are contained in Appendix B of the TIA. The refined forecasts were used to conduct a citywide analysis to determine areas of congestion and LOS.
Roadway Segment Levels of Service. An LOS analysis was conducted at study area roadway segments to determine the projected roadway segment performance under General Plan (2035) conditions using existing roadway configuration. As shown in Table 3.A of the TIA, all roadway segments are forecast to operate at their respective satisfactory LOS (which range from LOS D to LOS F), with the exception of 21 roadway segments.
Figure 3.1 of the TIA (pages 1 through 7) illustrates the locations of the roadway segments and corresponding LOS for the a.m. peak hour under General Plan (2035) conditions with existing configurations. Figure 3.2 of the TIA (pages 1 through 7) illustrates the locations of the roadway segments and corresponding LOS for the p.m. peak hour under General Plan (2035) conditions with existing configurations.
General Plan (2035) Conditions with Mobility and Transportation Element. The analysis in the General Plan (2035) conditions identified forecast LOS deficiencies at study area roadway segments within Fresno. Of the 282 roadway segments analyzed in this study, 21 segments are anticipated to operate at deficient LOS due to traffic volume increase between existing and future conditions. Therefore, the City’s General Plan Mobility and Transportation Element configuration, as included in the 2014 MEIR, is intended to create a network of roadways to accommodate the future growth while providing safe travel at acceptable operating conditions. This section evaluates the Mobility and Transportation configuration implementation and reduction in congestion when the future Urban Form, Land Use, and Design Element may be built out.
The General Plan (2035) conditions include implementation of the Mobility and Transportation Element configuration to the existing roadway network to reflect the City’s Mobility goals. The Mobility and Transportation Element proposes to widen the right-of-way at the roadway segments that are mainly located on the undeveloped areas to the west, southwest, and southeast of Fresno. Based on the General Plan Mobility and Transportation Element and the roadway segments analyzed in this TIA, the following modifications are some of the major improvements that are proposed to be implemented to Fresno’s roadway network to maintain the City’s LOS standard:
• Grantland Avenue: This roadway segment is proposed to be widened to a four-lane Super Arterial between Belmont Avenue and Shaw Avenue.

R E C I R C U L A T E D P R O G R A M E N V I R O N M E N T A L I M P A C T R E P O R T P U B L I C R E V I E W D R A F T M A R C H 2 0 2 1
G E N E R A L P L A N F R E S N O , C A L I F O R N I A
4.16-39
• Polk Avenue: This roadway segment is proposed to be widened to a four-lane Arterial between Belmont Avenue and Shaw Avenue.
• Brawley Avenue: This roadway segment is proposed to be widened to a four-lane Collector between Madison Avenue and Clinton Avenue.
• Marks Avenue: This roadway segment is proposed to be widened to a four-lane Arterial between Jensen Avenue and Whitesbridge Avenue, and between Belmont Avenue and Dakota Avenue.
• Willow Avenue: This roadway segment is goingproposed to be widened to a six-lane Super Arterial between Herndon Avenue and International Avenue.
• Fowler Avenue: This roadway segment is goingproposed to be widened to a four-lane Arterial between Kings Canyon Road and Clinton Avenue, and from Jensen Avenue to Hamilton Avenue.
• Temperance Avenue: This roadway segment is goingproposed to be widened to a six-lane Super Arterial between Jensen Avenue and Shaw Avenue.
• Shaw Avenue: This roadway segment is goingproposed to be widened to a four-lane Arterial between Grantland Avenue and Polk Avenue.
• Ashlan Avenue: This roadway segment is goingproposed to be widened to a four-lane Arterial between Grantland Avenue and Cornelia Avenue.
• McKinley Avenue: This roadway segment is goingproposed to be widened to a four-lane Arterial between Polk Avenue and Hughes Avenue.
• Jensen Avenue: This roadway segment is goingproposed to be widened to a four-lane Arterial between Marks Avenue and Martin Luther King Boulevard, and a six-lane Super Arterial between Orange Avenue and Highland Avenue.
• North Avenue: This roadway segment is goingproposed to be widened to a four-lane Arterial between Orange Avenue and Clovis Avenue.
• Veterans Boulevard: This roadway segment is proposed to be constructed on the west side of the Ccity as a six-lane Super Arterial.
As such, the proposed configuration as included in the Mobility and Transportation Element has been considered for all of the 282 analyzed roadway segments in this TIA.
Undeveloped Areas of Fresno. With continued implementation of the approved General Plan, several of the deficient roadway segments would operate at satisfactory LOS. Figure 4.1 of the TIA illustrates the Recommended General Plan Circulation System for the roadway segments analyzed in the TIA. The Mobility and Transportation Element would provide satisfactory roadway performance, correlating the Urban Form, Land Use, and Design Element and the

G E N E R A L P L A N F R E S N O , C A L I F O R N I A
R E C I R C U L A T E D P R O G R A M E N V I R O N M E N T A L I M P A C T R E P O R T P U B L I C R E V I E W D R A F T
M A R C H 2 0 2 1
4.16-40
Mobility and Transportation Element for a majority of the analyzed roadway segments. However, 12 roadway segments are forecast to operate at a deficient LOS when compared to the City’s General Plan LOS standard.General Plan (2035) Condition Roadway Segment Levels
of Service Comparison – Existing Configuration vs. General Plan Configuration. An LOS analysis was conducted at study area roadway segments to determine the projected roadway segment performance under the General Plan (2035) conditions with the previously described Mobility and Transportation Element. As shown in Table 4.A of the TIA, with the implementation of the Mobility and Transportation Element configuration, all roadway segments are forecast to operate at satisfactory LOS, with the exception of the following 12 roadway segments:
• Grantland Avenue between Bullard Avenue and Parkway Drive (LOS E in the a.m. and p.m. peak hours);
• Cornelia Avenue between Cortland Avenue and Clinton Avenue (LOS E in the a.m. peak hour);
• Maroa Avenue between Sample Avenue and Bullard Avenue (LOS F in the a.m. and p.m. peak hours);
• Friant Road between Audubon Drive and Shepherd Avenue (LOS E in the a.m. peak hour and LOS F in the p.m. peak hour);
• Friant Road between SR-41 southbound off-ramp and SR-41 northbound off-ramp (LOS F in the p.m. peak hour);
• Friant Road between SR-41 northbound off-ramp and Audubon Drive (LOS F in the p.m. peak hour);
• Audubon Drive between Del Mar Avenue and Nees Avenue (LOS E in the p.m. peak hour);
• Figarden Drive between San Jose Avenue and Bullard Avenue (LOS F in the p.m. peak hour);
• Gettysburg Avenue between Maple Avenue and Winery Avenue (LOS F in the a.m. and p.m. peak hours);
• Ashlan Avenue between Cornelia Avenue and Blyth Avenue (LOS F in the p.m. peak hour);
• Dakota Avenue between Maroa Avenue and Del Mar Avenue (LOS F in the p.m. peak hour); and
• Dakota Avenue between Angus Street and First Street (LOS F in the p.m. peak hour).
Table 4.B of the TIA illustrates a comparison between the General Plan LOS with the existing roadway configurations and General Plan Mobility and Transportation Element configurations. As shown in Table 4.B of the TIA, after implementation of the General Plan Mobility and Transportation Element, the number of deficient segments would be reduced from 21 segments to 12 segments, as listed above. These 12 segments are forecast to continue to operate at a deficient LOS under

R E C I R C U L A T E D P R O G R A M E N V I R O N M E N T A L I M P A C T R E P O R T P U B L I C R E V I E W D R A F T M A R C H 2 0 2 1
G E N E R A L P L A N F R E S N O , C A L I F O R N I A
4.16-41
General Plan (2035) conditions with the 2014 MEIR Mobility and Transportation Element configuration.
Figure 4.2 of the TIA (pages 1 through 7) illustrates the locations of the roadway segments and corresponding LOS for the a.m. peak hour under General Plan (2035) conditions with the Mobility and Transportation Element. Figure 4.3 of the TIA (pages 1 through 7) illustrates the locations of the roadway segments and corresponding LOS for the p.m. peak hour under General Plan (2035) conditions with the Mobility and Transportation Element.
As described above, full build out of the General Plan would create as many as 21 deficiencies (i.e., LOS E or F) for the 282 analyzed segments under existing roadway configurations. Implementation of the Mobility and Transportation Element designation to the roadway system would result in 9 deficient roadways receiving additional capacity and operating at acceptable LOS. However, 12 roadway segments, listed above and shown in Table 4.B of the TIA, are forecast to exceed the General Plan LOS standard even when the Mobility and Transportation Element is completed. As a result, a significant impact would occur at these 12 roadway segments.
Applicable Laws, Regulations, Relevant Land Use Policies
• Refer to the approved General Plan policies and objectives identified in Section 4.16.4.4, Local Regulatory Setting, above.
Level of Significance Without Mitigation: Potentially Significant Impact.
Impact TRA-1: Continued Implementation of the approved General Plan would increase vehicle traffic and would result in 12 roadway segments to exceed General Plan LOS standards, which is in conflict with LOS-related policies in the Mobility and Transportation Element of the approved General Plan.
Mitigation: Mitigation is not feasible to address the exceedance of General Plan LOS standards because the mitigation would be limited to re-designating the affected arterials to a higher classification, creating a new General Plan LOS goal, widening the roads, or identifying the infeasibility of acquiring the affected right-of-way and implementing road widening. As a result, there are no feasible mitigation measures to address the exceedance of LOS standards identified in the General Plan, and therefore, continued implementation of the approved General Plan would result in conflicts to General Plan polices establishingof General Plan LOS standards, and a significant and unavoidable impact would result.
Level of Significance Without Mitigation: Significant and unavoidable as there is no feasible mitigation.
TRA-2 The project would not conflict orand would be inconsistent with CEQA Guidelines section 15064.3, subdivision (b).
On December 28, 2018, the California Office of Administrative Law cleared the revised CEQA guidelines for use. Among the changes to the guidelines was removal of vehicle delay and LOS from

G E N E R A L P L A N F R E S N O , C A L I F O R N I A
R E C I R C U L A T E D P R O G R A M E N V I R O N M E N T A L I M P A C T R E P O R T P U B L I C R E V I E W D R A F T
M A R C H 2 0 2 1
4.16-42
consideration under CEQA. LOS is a qualitative measure that would assess the level of congestion and delay of a roadway segment. With the adopted guidelines, transportation impacts are to be evaluated based on a project’s effect on VMT. VMT is calculated by multiplying the number of vehicle trips by the estimated number of miles driven per trip. Projects that create significant impacts under VMT would be required to mitigate address their impacts through TDM measures such as car sharing, improved transit, and enhanced bicycle infrastructure, design modifications or mitigation fees, among other measures. Lead agencies are allowed to opt into the revised transportation guidelines, but the new guidelines must be used starting July 1, 2020.
In accordance with updated guidelines, the Mobility and Transportation Element of the approved General Plan began a departure from considering LOS as the only measure of a transportation system’s effectiveness.
The City adopted VMT thresholds to be effective on July 1, 2020. With adopted VMT thresholds for the City, the project impacts would be evaluated to determine the significance and identify mitigation measures, similar to LOS methodology.
The State law provides guidance to evaluate the impacts related to vehicles miles traveled.
California Public Resources Code Section 15064.3(b)(4) states (in part) that:
A lead agency has discretion to choose the most appropriate methodology to evaluate a project’s vehicle miles traveled, including whether to express the change in absolute terms, per capita, per household, or in any other measure.
To provide an abundance of information on the effects of the continued implementation of the Land Use and Circulation Elements, this analysis includes Total Population VMT, Total Employment VMT, VMT per capita (population), and VMT per employee. For context, Fresno VMT is compared to the larger Fresno County.
VMT calculations for this Program EIR were derived from the Regional Travel Demand Model (Fresno COG ABM). The data are presented in terms of total daily VMT, daily VMT per capita, and VMT per employee for the entire County and the City for the existing (2019) and General Plan (2035) conditions. Table 4.16.B summarizes this VMT data.

R E C I R C U L A T E D P R O G R A M E N V I R O N M E N T A L I M P A C T R E P O R T P U B L I C R E V I E W D R A F T M A R C H 2 0 2 1
G E N E R A L P L A N F R E S N O , C A L I F O R N I A
4.16-43
Table 4.16.B: County and City of Fresno VMT
VMT Category Existing (2019) General Plan (2035) Fresno County Total Household VMT 16,089,070 21,549,479 Fresno County Total Employment VMT 10,513,749 15,966,357 Fresno City Total Household VMT 7,404,806 10,620,261 Fresno City Total Employment VMT 5,533,473 8,911,472 Fresno County VMT per Capita 16.2 19.9 Fresno City VMT per Capita 13.1 16.5 Fresno County VMT per Employee 27.9 36.2 Fresno City VMT per Employee 23.8 31.4 Source: Fresno Council of Governments Regional Travel Demand Model (2019). VMT = vehicle miles traveled
As shown in Table 4.16.B, both VMT per capita and VMT per employee are anticipated to increase countywide in the future. However, both VMT per capita and VMT per employee within the Ccity are lower under existing conditions compared to the County and will continue to be lower than the County under General Plan (2035) conditions.
The average VMT per capita under existing conditions for the City is 13.1 miles compared to 16.2 miles for the County (approximately 19 percent less than the County average). In 2035, the VMT per capita for the City is forecast to be 16.5 miles (approximately 2 percent higher than the existing County average). Similarly, average VMT per employee for the City under existing conditions is 23.8 miles, compared to 27.9 miles for the County (approximately 15 percent lower), and is forecast to increase to 31.4 miles (approximately 12 percent greater than the existing County average).
Under General Plan (2035) conditions, the City VMT per capita (16.5 miles) is forecast to be 17 percent less than the County VMT per capita (19.9 miles). Corresponding numbers for VMT per employee indicate that the City average is forecast to be 13 percent lower than the General Plan (2035) County average. This is a greater reduction in VMT than forecast by the Fresno COG in the RTP, a 12 percent reduction in VMT for the RTP project.
Because the measures of VMT in per capita and per employee increase with the City’s General Plan (2035) compared to existing (2019) conditions, it is determined that continued implementation of the approved General Plan may be considered towould result in a significant impact related to State CEQA Guidelines Section 15064.3 subdivision (b), analyzing transportation impacts consistent with SB 743. As such, it is recommended that when the City plans to update its General Plan Mobility and Transportation Element, it should strive to lower the General Plan (2035) VMT per capita compared to existing conditions. This can be achieved through efficient planning of the General Plan Urban Form, Land Use, and Design Element, including promotion of transit-oriented development, infill development, and high density mixed-use development. In conjunction, implementation of the ATP, Complete Streets Policy, Transportation Demand Management strategies, and multi-modal transportation would also help in reducing the City’s General Plan (2035) VMT.
In addition, the proposed project includes updates to the Mobility and Transportation Element of the approved General Plan, and the addition of the following policy:

G E N E R A L P L A N F R E S N O , C A L I F O R N I A
R E C I R C U L A T E D P R O G R A M E N V I R O N M E N T A L I M P A C T R E P O R T P U B L I C R E V I E W D R A F T
M A R C H 2 0 2 1
4.16-44
Policy MT-2-m: Use VMT analysis for CEQA. Use Vehicle Miles Traveled (VMT) as the criteria for evaluating transportation impacts under the California Environmental Quality Act (CEQA), pursuant to Senate Bill 743. Level of Service (LOS) may still be used for planning purposes and implementation of Capital Improvement Projects; however, VMT shall be used for determining impacts and mitigation under CEQA beginning in July of 2020.
Commentary: In 2013, the State of California passed Senate Bill 743, which eliminated automobile Level of Service (LOS) from transportation analysis under CEQA and replaced it with VMT. This shift from LOS to VMT is intended to better align with other statewide transportation goals, including reduction of GHG emissions, the creation of multimodal networks, and the promotion of integrated land uses.
In June 2020, the City adopted thresholds for which to evaluate potential VMT impacts related to proposed projects or continued implementation of the approved General Plan. Although Iimplementation of Policy MT-2-m would allow the City to address potential VMT impacts for future projects as they are proposed, because per capita and per employee VMT increase with the City’s implementation of the General Plan (2035) compared to existing (2019) conditions, a significant impact related to State CEQA Guidelines Section 15064.3 subdivision (b) would occur. At the time this program EIR was prepared, consistent with CEQA Sections 15064.3(c) and 15007, no determination regarding VMT was made because the City did not have adopted thresholds and guidelines when the Draft PEIR was circulated for public comment. However, as future projects are proposed under the approved General Plan, VMT analyses consistent with CEQA Guidelines section 15064.3, subdivision (b) would be required to determine if the future project conflicts with the adopted thresholds.
Applicable Laws, Regulations, Relevant Land Use Policies
• Refer to the approved General Plan policies and objectives identified in Section 4.16.4.4, Local Regulatory Setting, above.
• City of Fresno CEQA Guidelines for Vehicle Miles Traveled Thresholds.
Level of Significance Without Mitigation: Significant and unavoidable. Continued implementation of the approved General Plan would result in an increase in VMT per capita and per employee. The City’s Guidelines for VMT Thresholds includes a summary of the VMT mitigation measures and project alternatives that could be used to reduce VMT at a project-level. However, these efforts would take place through continued implementation of the approved General Plan and as discretionary projects are proposed. Therefore, because these future projects are unknown at this time, VMT impacts remain significant and unavoidable at a plan levelLess Than Significant Impact. VMT Thresholds were not adopted prior to publication of this Draft PEIR. With the adoption of Policy MT-2-m, the City will use VMT as the criteria for transportation impacts as the approved General Plan is continued to be implemented. Therefore, impacts related to VMT are considered LTS at this time.
R E C I R C U L A T E D P R O G R A M E N V I R O N M E N T A L I M P A C T R E P O R T P U B L I C R E V I E W D R A F T M A R C H 2 0 2 1
G E N E R A L P L A N F R E S N O , C A L I F O R N I A
4.16-45
TRA-3 The project would not substantially increase hazards due to a geometric design feature (e.g., sharp curves or dangerous intersections) or incompatible uses (e.g., farm equipment).
Continued implementation of the approved General Plan would increase the amount of vehicle traffic, which would require the improvement and expansion of the City’s roadway system. The approved General Plan identifies a roadway system, bikeway and trail connections, and transit system that would be constructed to facilitate transportation in the Ccity. However, new transportation facilities would be designed according to applicable federal, state, and local design appropriate standards, which would minimize traffic hazards.
The approved General Plan includes Policies MT-1-h, MT-1-j, MT-5-d, Objective MT-11, Policy MT-11-b, MT-11-d and policy MT-11-e related to the implementation of the land use and transportation system. These policies are related to the implementation of complete streets, the design of transportation facilities consistent with community character, and design of facilities to support economic development, including railroad, truck route design and safety. Policy MT-1-h supports development of the transportation system based on complete street concepts that accommodate mobility of all system users and trip purposes. As a result, continued implementation of the approved General Plan would result in a less-than-significant impact related to hazards due to roadway design features or incompatible uses. No mitigation is required.
Applicable Laws, Regulations, Relevant Land Use Policies
• Refer to the approved General Plan policies and objectives identified in Section 4.16.4.4, Local Regulatory Setting, above.
Level of Significance Without Mitigation: Less Than Significant Impact.
TRA-4 The project would not result in inadequate emergency access.
Continued implementation of the approved General Plan would increase the amount of vehicle traffic, which would require the improvement and expansion of the City’s roadway system. An enhanced roadway network that accommodates forecasted travel demand would also provide adequate emergency access. In addition, the approved General Plan would accommodate planned population and employment growth without expanding its current SOI. This would be achieved through intensification of the Downtown planning area, high capacity transit corridors, intensive urban activity centers, and multi-modal districts, which would help to locate population and employment closer to services, serving to minimize the need to expand emergency response service areas (i.e., compared to conditions with an expanding SOI).
The approved General Plan includes Policies LU-1-a, LS-1-c, LU-1-g, Objective MT-1, Policy MT-1-k, Objective MT-2, Policies MT-2-f, MT-2-j, and MT-6-n related to adequate emergency access. As a result, continued implementation of the approved General Plan would result in a less-than-significant impact related to emergency access.

G E N E R A L P L A N F R E S N O , C A L I F O R N I A
R E C I R C U L A T E D P R O G R A M E N V I R O N M E N T A L I M P A C T R E P O R T P U B L I C R E V I E W D R A F T
M A R C H 2 0 2 1
4.16-46
Applicable Laws, Regulations, Relevant Land Use Policies
• Refer to the approved General Plan policies and objectives identified in Section 4.16.4.4, Local Regulatory Setting, above.
Level of Significance Without Mitigation: Less Than Significant Impact.
4.16.6.2 Cumulative Impacts
TRA-5 The proposed project, in combination with other projects, would contribute to a significant cumulative impact related to transportation.
Cumulative transportation impacts resulting from increases in peak hour traffic volumes are discussed above in TRA-1. Based on build-out of the General Plan and cumulative development in Fresno County, which is accounted for in the Fresno COG ABM, traffic volumes would increase and would conflict with LOS-related policies in the Mobility and Transportation Element of the approved General Plan. As a result, cumulatively significant and unavoidable impacts would occur under TRA-1.
A discussion of VMT resulting from build out of the General Plan along with cumulative development is discussed above in TRA-2. Cumulative development is accounted for in the Fresno COG ABM, however, as discussed, the City established thresholds related to VMT in June 2020. Effective July 1, 2020, the City will have VMT thresholds, and future project impacts would be evaluated against established thresholds to determine the significance and identify mitigation measures, similar to LOS methodology. Because thresholds and methodologies for project impact evaluation were not established prior to distribution of this Draft PEIR, VMT is provided in this Draft PEIR for disclosure purposes only. However, within implementation of the City’s VMT Guidelines, effective July 1, 2020, impacts related to VMT would be reduced through mitigation measures identified in the City’s VMT Guidelines that include, but are not limited to, improving or increasing access to transit, implementing employer-based trip reduction programs, and increasing development density. With implementation of the City’s VMT Guidelines and mitigation measures associated with VMT, the impacts related to VMT would be considered less than significant.
As discussed in TRA-3, continued implementation of the approved General Plan would not result in significant impacts related to increased hazards due to geometric design features or incompatible uses. All cumulative development would require the construction of transportation facilities that would be designed according to applicable federal, state, and local design appropriate standards, which would minimize traffic hazards. As a result a less-than-significant cumulative impact would occur.
As discussed in TRA-4, continued implementation of the approved General Plan would increase the amount of vehicle traffic, which would require the improvement and expansion of the City’s roadway system. As a result, an enhanced roadway network that accommodates forecasted travel demand would also provide adequate emergency access. Although cumulative development would result in a larger population, the approved General Plan would accommodate planned population and employment growth without expanding its current SOI, thus intensifying the downtown

R E C I R C U L A T E D P R O G R A M E N V I R O N M E N T A L I M P A C T R E P O R T P U B L I C R E V I E W D R A F T M A R C H 2 0 2 1
G E N E R A L P L A N F R E S N O , C A L I F O R N I A
4.16-47
planning area, high capacity transit corridors, urban activity centers, and multi-modal districts. An intensification would help to locate population and employment closer to services, serving to minimize the need to expand emergency response service areas. As a result, a less-than-significant cumulative impact related to emergency access would occur.
Applicable Laws, Regulations, Relevant Land Use Policies
• Refer to the approved General Plan policies and objectives identified in Section 4.16.4.4, Local Regulatory Setting, above.
Level of Significance Without Mitigation: Potentially Significant Impact.
Impact TRA-5: Continued Implementation of the approved General Plan would result in a cumulative impact related to an increase in vehicle traffic that would result in 12 roadway segments exceeding General Plan LOS standards, and thereby conflicting with LOS-related policies in the Mobility and Transportation Element of the approved General Plan.
Mitigation: Mitigation is not feasible to address the exceedance of General Plan LOS standards because the mitigation would be limited to re-designating the affected arterials to a higher classification, creating a new General Plan LOS goal, widening the roads, or identifying the infeasibility of acquiring the affected right-of-way and implementing road widening. As a result, there are no feasible mitigation measures to address the exceedance of General Plan LOS standards, and a significant and unavoidable cumulative impact would result.
Level of Significance Without Mitigation: Significant and unavoidable as there is no feasible mitigation.

G E N E R A L P L A N F R E S N O , C A L I F O R N I A
R E C I R C U L A T E D P R O G R A M E N V I R O N M E N T A L I M P A C T R E P O R T P U B L I C R E V I E W D R A F T
M A R C H 2 0 2 1
4.16-48
This page intentional left blank