freshfacts - freshvegetables.co.nz · vegetables - processed fruit - fresh fruit - processed 0 1000...
TRANSCRIPT

FreshFactsNEW ZEALAND HORTICULTURE
TM
2017

New Zealand horticulture – reaching new highsThe value of New Zealand’s horticultural products continues to rise, and now exceeds $8.8 billion. This includes more than $5.1 billion of exports, keeping the sector on track to meet Horticulture New Zealand’s ambitious $10 billion by 2020 target.
Our horticultural produce is exported to 128 countries around the world. Five markets account for more than two-thirds of New Zealand’s total exports – Australia, Continental Europe, the USA, Japan and China. Exports to Asian markets total $1.9 billion – around 40% of total horticultural exports, compared to 30% of exports in 2007.
Exports of wine, kiwifruit and apples dominate New Zealand’s horticultural exports, but there has been significant growth in other crops. Avocado exports have increased from $82 million in 2016 to $147 million in 2017, likely in part to the biennial nature of avocado production – in 2015, avocado exports were valued at $115 million.
The success of New Zealand’s horticulture is due to its reputation for delivering high quality produce that commands a premium in overseas markets. To maintain our position in the marketplace, the industry must continue to enhance quality and innovate – delivering new products with characteristics desired by the consumer and new technologies that allow us to deliver high quality with minimal environmental and social impacts.
Plant & Food Research is proud to support the horticulture industry with research across the value chain. By working together, we help identify new opportunities that ensure New Zealand’s horticultural sector remains sustainable into the future.
Exports/imports 2-5
Export destinations 6-7
Sector profiles
wine 8-9
kiwifruit 10-11
apples 12-13
other fruits 14-15
vegetables 16-18
organics 19
flowers & seeds 20-21
Bees 22
Horticultural training 23
Household spend 24
Investment in horticulture 25
Regional resources 26-29
Supporting organisations 30-31
Sponsors 32-39
Reporting basis: unless stated otherwise, all statistics are for the year ending 30 June 2017 and expressed as $NZ. Exports are given as free-on-board (fob) values. Imports are given as cost, insurance and freight included (cif). Historical values have not been adjusted for inflation.
Fresh Facts has been published annually since 1999 by The New Zealand Institute for Plant & Food Research Ltd. Further copies are available from: Plant & Food Research, Corporate Communications, Private Bag 92169, Mt Albert, Auckland, Tel: 09 925 7000, plantandfood.co.nz
Compiled by: A G Aitken & I J Warrington, Martech Consulting Group Ltd, PO Box 31 308, Milford, Auckland 0741, Tel: 021 727 148, www.martech.co.nz
ISSN 1177-2190
Cover image: ‘Wakefield’ raspberries are a new cultivar bred by Plant & Food Research.
David Hughes CEO, Plant & Food Research

32
→ New Zealand horticultural produce exports in 2017 again exceeded $5.1b fob value and represent a 91% increase in the total value of New Zealand horticultural exports of a decade earlier (2007: $2.7b). New Zealand’s horticultural produce exports were $3b in 2008 and only exceeded $4b fob value in 2015.
→ In 2017 five markets each exceeding $500m (fob) value accounted for close to $3.5b of New Zealand fruit and vegetable exports and more than two-thirds (67.7%) of New Zealand’s total horticultural exports: Australia $855m (2016: $806m), Continental Europe $778m ($742m), the USA $726m ($685m), Japan $606m ($597m), and China $502m ($498m).
→ Fresh and processed fruit exports were comparable to values in 2016 with the exception of avocado exports which achieved a record $147.5m (fob) (26,000t) of which $125m (22,000t) was to Australia.
→ The value of vegetable exports was unchanged. However, an increase in processed vegetables offset a 3% lesser value in fresh vegetable exports.
Horticultural exports 2017 ($ million, fob)
Exports/imports
Horticultural exports, year ended June ($ million, fob)1985a 1995b 2005b 2015b 2016b 2017b
Fresh fruit- Apples 108.2 343.6 387.0 561.8 691.8 691.1 - Kiwifruit 171.9 320.8 720.2 1,181.9 1,673.1 1,663.9 - Avocados n/a n/a 29.0 115.5 82.6 147.5 - Other fresh fruit 28.4 57.6 51.5 122.9 154.5 155.9
Total fresh fruit 308.5 722.0 1,187.7 1,982.1 2,602.0 2,658.4 Processed fruit- Wine 3.0 42.0 432.7 1,406.2 1,556.1 1,539.0 - Fruit juices 9.6 30.5 34.5 46.5 51.5 60.9 - Jams n/a n/a 18.1 29.9 34.7 4.8 - Other processed fruit 40.3 44.3 49.2 84.7 90.2 101.2
Total processed fruit 52.9 116.8 534.5 1,567.3 1,732.5 1,705.9 Fresh vegetables- Onions 17.7 92.6 61.6 81.5 112.5 111.9 - Squash 14.6 57.7 72.1 58.7 58.2 56.2 - Other fresh vegetables 11.6 49.8 66.3 75.8 88.3 82.9
Total fresh vegetables 43.9 200.1 200.0 216.0 259.0 251.0 Processed vegetables (frozen/dried/other processes)- Peas 22.0 34.3 36.9 84.8 84.3 84.6 - Potatoes 14.1 56.9 92.5 83.6 93.8 - Sweetcorn 9.5 30.6 43.4 38.5 41.8 41.5 - Mixed vegetables (frozen) 4.6 23.9 36.0 34.2 32.5 25.6 - Other vegetables (frozen) 16.4 21.2 21.8 22.0 - Other vegetables (dried) 25.5 7.8 9.5 10.9 - Vegetable juices 6.6 30.3 23.8 28.8 - Other processed vegetables 20.9 75.6 42.6 65.8 58.6 59.2
Total processed vegetables 57.0 178.5 264.3 375.1 355.9 366.4 Other horticultural exportsFlowers & foliage 10.5 49.9 38.5 22.9 27.1 21.1Vegetable seeds n/a n/a 30.2 62.2 74.2 64.4Seeds, plants & bulbs etc. 2.1 17.4 42.1 43.7 48.8 46.0Sphagnum moss 6.3 17.3 8.8 5.2 5.4 5.4*Total other horticultural exports 18.9 84.6 119.6 134 155.5 136.9Total exports in current $ 481.2 1,302.0 2,306.1 4,274.5 5,104.9 5,118.6 Horticultural exportsas % of NZ merchandise exports 4.4 7.0 7.5 8.8 10.3 10.3
Source: aBollard (1996) bStatistics New Zealand *Estimate
Source: Statistics New Zealand
0
1000
2000
3000
4000
5000
6000
Wine
Flowers, seeds & plants
Vegetables - processed
Vegetable - fresh
Fruit - processsed
Fruit - Fresh
2017201620152010200519951985
Flowers, seeds & plants
Wine
Vegetables - fresh
Vegetables - processed
Fruit - fresh
Fruit - processed
0
1000
2000
3000
4000
5000
6000
2017201620152010200519951985
0 500 1000 1500 2000
Other fresh vegetablesOther fresh vegetables
Flowers, foliage & mossCapsicums & pimento
Other frozen vegetablesBeans (frozen & dried)
Carrot (fresh, frozen, juiced)Other veg. (proc & juiced)
Sweetcorn (frozen, dried +)Other seeds, plants & bulbs
SquashBerryfruit (fresh, frozen & preps)
Vegetable seeds Other fruit (fresh & juiced)
Other processed fruit & nutsSummerfruit (cherries, apricots +)
Peas (frozen, dried +)Onions
Potatoes (fresh, frozen, proc.)Avocados
Apples (fresh & processed)Wine
Kiwifruit
Other fresh vegetablesFlowers, foliage & mossCapsicums & pimentoOther frozen vegetablesBeans (frozen & dried)Carrot (fresh, frozen, juiced)Other veg. (proc & juiced)Sweetcorn (frozen, dried +)Other seeds, plants & bulbsSquashBerryfruit (fresh, frozen & preps)Vegetable seeds Other fruit (fresh & juiced)Other processed fruit & nutsSummerfruit (cherries, apricots +)Peas (frozen, dried +)OnionsPotatoes (fresh, frozen, proc.)
AvocadosApples (fresh & processed)
WineKiwifruit
0 500 1000 1500 2000
→ Total investment in New Zealand’s horticultural sector is estimated to be in excess of $52b (2015: $40b) inclusive of off-farm postharvest facilities:
– since 2015, apple orchards have increased in value by approx. 70% reflecting the strong performance of New Zealand apples in international markets
– kiwifruit orchards also increased by approx. 70% in value, reflecting the strong performance of the new gold kiwifruit cultivars
– wine grape vineyards had a lesser increase. New Zealand wine continues to receive accolades from international markets
– avocado orchards increased in value by approx. 180%, reflecting that sector’s strong performance.
These four fruit types are collectively 84% of fruit crop hectares in New Zealand.
Horticultural exports – Years to June ($ million, fob)
($ million, fob)Source: Statistics New Zealand
0
1000
2000
3000
4000
5000
6000
Wine
Flowers, seeds & plants
Vegetables - processed
Vegetable - fresh
Fruit - processsed
Fruit - Fresh
2016201520142010200519951985
Flowers, seeds & plants
Wine
Vegetables - fresh
Vegetables - processed
Fruit - fresh
Fruit - processed
0
1000
2000
3000
4000
5000
6000
2016201520142010200519951985
0
1000
2000
3000
4000
5000
6000
Wine
Flowers, seeds & plants
Vegetables - processed
Vegetable - fresh
Fruit - processsed
Fruit - Fresh
2016201520142010200519951985
Flowers, seeds & plants
Wine
Vegetables - fresh
Vegetables - processed
Fruit - fresh
Fruit - processed
0
1000
2000
3000
4000
5000
6000
2016201520142010200519951985

54
The origin of fruit and vegetable imports, 2017
Source: Statistics New Zealand; Overseas Trade statistics for year ended June 2017.
($ million, cif)
Source: Statistics New Zealand merchandise exports, with domestic market figures derived from the triennial Household Economic Survey (HES) 2016 and Statistics New Zealand estimate of mean number of private dwellings year to 30 June 2017.
Produce from New Zealand’s horticultural industries is calculated to exceed $8.8 billion.
New Zealand horticulture exports are assisted by a strong domestic market base.
Top 10 export destinations ($ million, fob)2010 2016 2017
Australia 702 804 855 Wine, avocados, processed veg, potatoes, kiwifruit, beans, blueberries, honey*, peas, fruit preparations, sweetcorn, fruit juices
Continental Europe
618 742 778 Kiwifruit, apples, wine, onions, honey*, carrot seed, radish seed
USA 352 679 726 Wine, apples, kiwifruit, honey*
Japan 483 594 605 Kiwifruit, squash, honey*, veg. juice, capsicums, other frozen veg, onions, sweetcorn, wine
China 100 498 502 Kiwifruit, honey*, apples, wine, cherries, frozen peas, fruit juices
UK 367 471 484 Wine, apples, honey*
Taiwan 108 273 250 Kiwifruit, apples, cherries
Canada 74 135 134 Wine, kiwifruit, apples
Korea 85 83 116 Kiwifruit, squash
Thailand 30 98 92 Apples
Exports to European ports are combined as ‘Continental Europe’ because of cross-border distribution within the EU and neighbours. UK reported separately, recognising Brexit pending. Products listed in descending order of value and if value to the destination exceeded NZ $10 million fob. * Consistent with other entries in Fresh Facts, honey exports are not included in totals (Source: Statistics New Zealand).
Other hort. exports $0.14b
Other hort. domestic spend $0.61b
Vegetable exports fresh & processed $0.62b
Wine domestic spend $0.82m
Wine exports $1.56m
Other hort exports $0.15m
Other hort domestic spend $0.60m
Vegetable exports fresh & processed $0.61m
Vegetable domestic spend $1.26
Fruit domestic spend $0.96m
Fruit exports fresh & processed $2.78m
Wine exports $1.54b
Vegetable domestic
spend $1.27b
Fruit domestic
spend $0.97b
Wine domestic
spend $0.83b
Fruit exports fresh & processed
$2.82b
Comparisons of imports and exports 2017 ($ million)
Source: Statistics New Zealand; Overseas Trade Statistics
Imports Exports
-500 0 500 1000 1500 2000
EXPORTS
IMPORTS
BananasOlive oilTable grapesCoffeeNutsOther processed fruitCitrusFrozen fruitCut flowersVeg. juiceFruit preparationsFruit juiceVegetable seedsOther seeds, plants, etcOther processed vegetablesFrozen vegetablesFresh vegetablesOther Fresh fruitApplesWineKiwifruit
BananasOlive oilTable grapesCoffeeNutsOther processed fruitCitrusFrozen fruitCut flowersVeg. juiceFruit preparationsFruit juiceVegetable seedsOther seeds, plants, etc.
Other processed vegetablesFrozen vegetables
Fresh vegetablesOther fresh fruit
ApplesWine
Kiwifruit
-500 0 500 1000 1500 2000
(Year to 30 June 2017) ($ million: imports:
cif; exports: fob)
0 50 100 150 200 250
MexicoBelguimSpainBrazilArgentinaFijiCanadaIndiaThe NetherlandsSouth AfricaTurkeyThailandPhilippinesChileItalyVietnamFranceChinaEcuadorUSAAustralia
MexicoBelgiumSpain (olive oil)Brazil (orange juice)Argentina (nuts)FijiCanada (dried beans)IndiaThe Netherlands (flower bulbs, vegetable seeds) South Africa (fruit preparations)
Turkey (dried fruit)Thailand (fruit preparations, fruit juices)
Philippines (bananas, pineapples)Chile (frozen blueberries and frozen raspberries)Italy (olive oil, preserved tomatoes, wine, veg. preparations)Vietnam (cashew nuts)
France (wine)China (frozen veg., nuts, dried veg., frozen fruit, garlic)
Ecuador (bananas)USA*
0 50 100 150 200 250 300
Australia (wine, nuts, grapes, mandarins, frozen potatoes, melons, fruit juices)
*(nuts, table grapes, oranges, dried fruit, preserved tomatoes, lemons, frozen potatoes, fruit preparations)
The countries listed in this diagram send us more than $10m (cif) of fruit and vegetables.Many of these crops are not grown in New Zealand. Others complement availability gaps in New Zealand’s own seasonal production. Products named when import value exceeds $5m.
Exports/imports
76
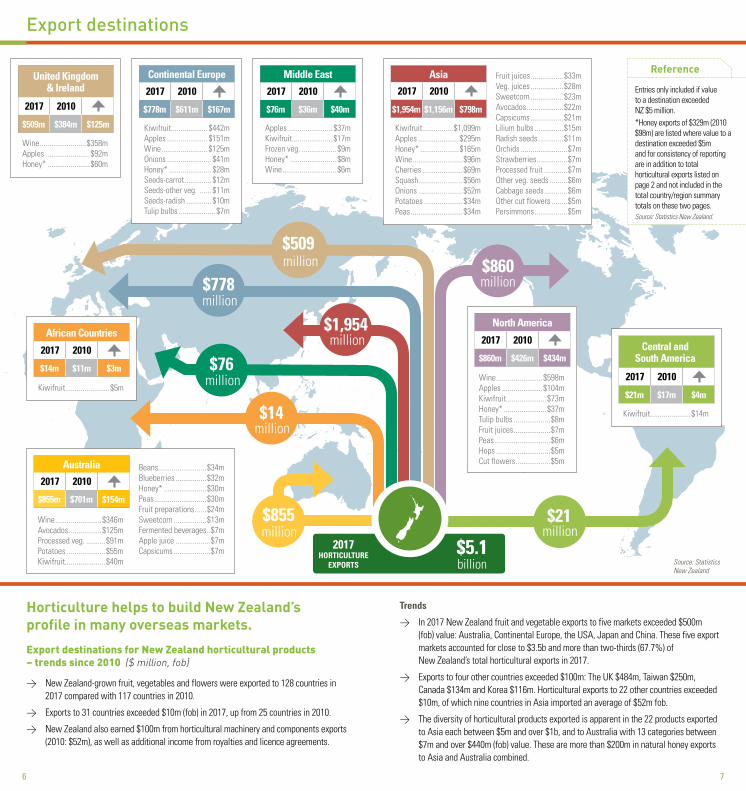
Export destinations for New Zealand horticultural products – trends since 2010 ($ million, fob)
→ New Zealand-grown fruit, vegetables and flowers were exported to 128 countries in 2017 compared with 117 countries in 2010.
→ Exports to 31 countries exceeded $10m (fob) in 2017, up from 25 countries in 2010.
→ New Zealand also earned $100m from horticultural machinery and components exports (2010: $52m), as well as additional income from royalties and licence agreements.
Trends
→ In 2017 New Zealand fruit and vegetable exports to five markets exceeded $500m (fob) value: Australia, Continental Europe, the USA, Japan and China. These five export markets accounted for close to $3.5b and more than two-thirds (67.7%) of New Zealand’s total horticultural exports in 2017.
→ Exports to four other countries exceeded $100m: The UK $484m, Taiwan $250m, Canada $134m and Korea $116m. Horticultural exports to 22 other countries exceeded $10m, of which nine countries in Asia imported an average of $52m fob.
→ The diversity of horticultural products exported is apparent in the 22 products exported to Asia each between $5m and over $1b, and to Australia with 13 categories between $7m and over $440m (fob) value. These are more than $200m in natural honey exports to Asia and Australia combined.
Horticulture helps to build New Zealand’s profile in many overseas markets.
Source: Statistics New Zealand
Export destinations
$5.1 billion
$509million
$778million
$1,954million
$860million
$14million
$855million
$21million
Reference
Entries only included if value to a destination exceeded NZ $5 million.*Honey exports of $329m (2010 $98m) are listed where value to a destination exceeded $5m and for consistency of reporting are in addition to total horticultural exports listed on page 2 and not included in the total country/region summary totals on these two pages. Source: Statistics New Zealand.
2017 HORTICULTURE
EXPORTS
African Countries
2017 2010
Kiwifruit.......................$5m
$14m $11m $3m
Central andSouth America
2017 2010
Kiwifruit.....................$14m
$21m $17m $4m
United Kingdom & Ireland
2017 2010
Wine ........................$358m Apples .......................$92m Honey* ......................$60m
$509m $384m $125m
Continental Europe
2017 2010
Kiwifruit................... $442m Apples ..................... $151m Wine ........................ $125m Onions ....................... $41mHoney* ...................... $28m Seeds-carrot .............. $12m Seeds-other veg. ...... $11m Seeds-radish ............. $10m Tulip bulbs ................... $7m
$778m $611m $167m
Middle East
2017 2010
Apples ....................... $37m Kiwifruit..................... $17m Frozen veg. .................. $9m Honey* ........................ $8m Wine ............................ $6m
$76m $36m $40m
Kiwifruit................$1,099m Apples .....................$295m Honey* ....................$165m Wine ..........................$96m Cherries .....................$69mSquash.......................$56m Onions .......................$52m Potatoes ....................$34m Peas ...........................$34m
Fruit juices .................$33m Veg. juices .................$28mSweetcorn .................$23mAvocados ...................$22m Capsicums .................$21m Lilium bulbs ...............$15m Radish seeds .............$11m Orchids ........................$7m Strawberries................$7m Processed fruit ............$7m Other veg. seeds .........$6m Cabbage seeds ............$6m Other cut flowers ........$5mPersimmons .................$5m
Asia
2017 2010
$1,954m $1,156m $798m
Wine ........................$346m Avocados .................$125m Processed veg. ..........$91m Potatoes ....................$55m Kiwifruit.....................$40m
Beans.........................$34m Blueberries ................$32m Honey* ......................$30m Peas ...........................$30m Fruit preparations ......$24m Sweetcorn .................$13m Fermented beverages..$7m Apple juice ..................$7m Capsicums ...................$7m
Australia
2017 2010
$855m $701m $154m
North America
2017 2010
Wine ........................$598m Apples .....................$104m Kiwifruit.....................$73m Honey* ......................$37m Tulip bulbs ...................$8mFruit juices ...................$7m Peas .............................$6mHops ............................$5mCut flowers ..................$5m
$860m $426m $434m$76million
98
Sector profiles
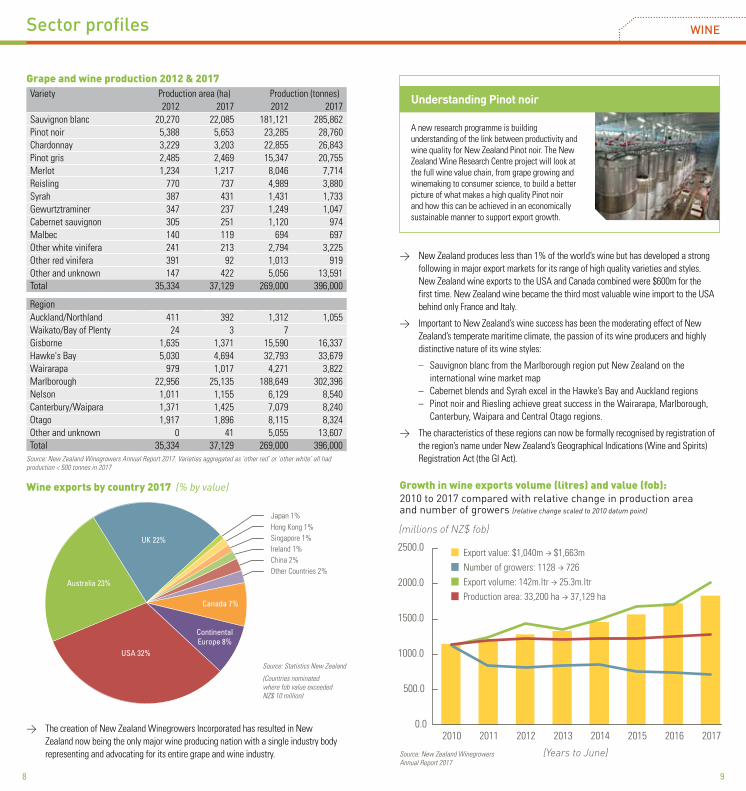
Grape and wine production 2012 & 2017Variety Production area (ha) Production (tonnes)
2012 2017 2012 2017Sauvignon blanc 20,270 22,085 181,121 285,862Pinot noir 5,388 5,653 23,285 28,760Chardonnay 3,229 3,203 22,855 26,843Pinot gris 2,485 2,469 15,347 20,755Merlot 1,234 1,217 8,046 7,714Reisling 770 737 4,989 3,880Syrah 387 431 1,431 1,733Gewurtztraminer 347 237 1,249 1,047Cabernet sauvignon 305 251 1,120 974Malbec 140 119 694 697Other white vinifera 241 213 2,794 3,225Other red vinifera 391 92 1,013 919Other and unknown 147 422 5,056 13,591Total 35,334 37,129 269,000 396,000
RegionAuckland/Northland 411 392 1,312 1,055Waikato/Bay of Plenty 24 3 7Gisborne 1,635 1,371 15,590 16,337Hawke's Bay 5,030 4,694 32,793 33,679Wairarapa 979 1,017 4,271 3,822Marlborough 22,956 25,135 188,649 302,396Nelson 1,011 1,155 6,129 8,540Canterbury/Waipara 1,371 1,425 7,079 8,240Otago 1,917 1,896 8,115 8,324Other and unknown 0 41 5,055 13,607Total 35,334 37,129 269,000 396,000
Source: New Zealand Winegrowers Annual Report 2017. Varieties aggregated as ‘other red’ or ‘other white’ all had production < 500 tonnes in 2017
→ The creation of New Zealand Winegrowers Incorporated has resulted in New Zealand now being the only major wine producing nation with a single industry body representing and advocating for its entire grape and wine industry.
Wine exports by country 2017 (% by value)
→ New Zealand produces less than 1% of the world’s wine but has developed a strong following in major export markets for its range of high quality varieties and styles. New Zealand wine exports to the USA and Canada combined were $600m for the first time. New Zealand wine became the third most valuable wine import to the USA behind only France and Italy.
→ Important to New Zealand’s wine success has been the moderating effect of New Zealand’s temperate maritime climate, the passion of its wine producers and highly distinctive nature of its wine styles:
– Sauvignon blanc from the Marlborough region put New Zealand on the international wine market map
– Cabernet blends and Syrah excel in the Hawke’s Bay and Auckland regions– Pinot noir and Riesling achieve great success in the Wairarapa, Marlborough,
Canterbury, Waipara and Central Otago regions.
→ The characteristics of these regions can now be formally recognised by registration of the region’s name under New Zealand’s Geographical Indications (Wine and Spirits) Registration Act (the GI Act).
WINE
Other Countries 2%China 2%Ireland 1%Singapore 1%Hong Kong 1%Japan 1%
USA
UK
Australia
Canada
The Netherlands
Other countryChina
Others EuropeanSingaporeIrelandHong KongJapanFranceSwedenBelgiumGermany
Australia 23%
UK 24%
USA 30%
Canada 7%
Other Countries 2%Other European 2%Singapore 1%Ireland 1%
The Netherlands 3%China 2%
Hong Kong 1%Japan 1%France 1%Sweden 1%Belgium 1%Germany 1%
Australia 23%
UK 22%
USA 32%
Canada 7%
ContinentalEurope 8%
Source: Statistics New Zealand
(Countries nominated where fob value exceeded NZ$ 10 million)
Source: New Zealand Winegrowers Annual Report 2017
Growth in wine exports volume (litres) and value (fob): 2010 to 2017 compared with relative change in production area and number of growers (relative change scaled to 2010 datum point)
0
500
1000
1500
2000
201620152014201320122011201020050
500
1000
1500
2000
20162015201420132012201120102005
Number of wineriesExport value ($ million)
0.0
500.0
1000.0
1500.0
2000.0
2500.0
2010 2011 2012 2013 2014 2015 2016 2017
Number of growers: 1128 → 726Export volume: 142m.ltr → 25.3m.ltrProduction area: 33,200 ha → 37,129 ha
Export value: $1,040m → $1,663m
(Years to June)
(millions of NZ$ fob)
Understanding Pinot noir
A new research programme is building understanding of the link between productivity and wine quality for New Zealand Pinot noir. The New Zealand Wine Research Centre project will look at the full wine value chain, from grape growing and winemaking to consumer science, to build a better picture of what makes a high quality Pinot noir and how this can be achieved in an economically sustainable manner to support export growth.

1110
Kiwifruit industry: Zespri Group Ltd New Zealand grower and chain statistics to 2017Season (ends 31 March) 2000 2005 2010 2016 2017Crop volumes (million)Trays submitted* 54.2 85.8 107.0 123.8 148.9Trays sold 51.8 79.7 96.5 117.1 137.7General StatisticsYield (trays/ha) 5,295 7,847 8,546 10,157 11,838Area planted# (ha) 10,234 10,934 12,525 12,185 12,578Growers/suppliers‡ (no.) 2,681 2,760 2,711 2,516 2,435Packhouses (no.) 118 88 71 51 50Coolstores (no.) 106 89 77 64 73Orchard Gate Return ($/ha) 15,366 34,738 39,142 60,758 68,868
Sector profiles
A report from the University of Waikato concluded that the kiwifruit industry contribution to GDP will increase from $2.6 billion in 2015/16 to $6.14 billion in 2030. This industry growth is based primarily on the success of Zespri SunGold® Kiwifruit, released from the joint Plant & Food Research-Zespri breeding programme in 2011. The report also suggests that a further 29,000 jobs will be created nationwide by 2030.
*A tray weighs 3.6 kg. # Producing hectares ‡ Refers to number of submitters Source : Zespri International Ltd Annual Review 2016/17.
KIWIFRUIT
(Year to March)
Zespri Group Ltd production profile (TEs) 2000 - 2016
Sources: Zespri International Annual Reviews, years to 31 March
0
30
60
90
120
150
Other kiwifruit
Organic
Gold
Green
2017201620152014201320122011201020052000
Zespri® Green kiwifruit Zespri® Green Organic kiwifruitNon standard & other kiwifruitZespri® Gold kiwifruit
0
20
40
60
80
100
120
Other kiwifruit
Organic
Gold
Green
20152014201320122011201020052000
Zespri® Green kiwifruit Zespri® Green Organic kiwifruitNon standard & other kiwifruitZespri® gold kiwifruit
(tray equivalents, millions)
Economic value of kiwifruit
→ The value of New Zealand kiwifruit exports in 2017, at $1.664b fob, was similar to that in 2016, but 41% above 2015 export value.
→ In 2017, New Zealand-produced kiwifruit were exported to more than 50 countries and of the $1.091b that went to Asian countries, two imported more than $300m: Japan $381m (2016: $390m) and China $365m ($373m). Kiwifruit to the value of $422m ($435m) went to countries in Continental Europe.
→ The average orchard gate return per hectare increased in 2017 to more than $68,868 (2016: $60,750).
→ ‘Zesy002’, the gold-fleshed kiwifruit marketed as Zespri® SunGold Kiwifruit, continued to receive strong customer and consumer support with volume increasing from 32.6m trays 2015/16 to 48.5m trays 2016/17 and the average per-hectare return increasing 39% to $98,838. In addition to the 400ha of SunGold licensed in 2016, Zespri allocated a further 400ha in 2017.
→ The ‘Zespri Global Supply’ initiative aims to fill the gaps in New Zealand supply to international markets and provide consumers with year-round Zespri-branded kiwifruit. In addition to exports from New Zealand of 490,755t* (2016: 487,630t*), Zespri procured a further 59,760t (2016: 52,200t) from contracted producers in Italy, France, Korea, Japan, and Australia to maintain year-round availability of its brand.
→ Zespri expanded production outside New Zealand to meet demand primarily for SunGold with the release in Europe of 1,880 ha of licences over the next three years, adding to the 1,650ha already planted in Italy and 270ha in France, expecting to quadruple European volumes of SunGold from the 2016/17 non-New Zealand sourced supply of 16,000t.
Other S.E. Asia 5%Korea 3%
USA 3%
Australia 3%Other 4%Italy 2%
Hong Kong 2%
Other S.E. Asia 5%
USA 4%Australia 2%Other 3%
Hong Kong 2%
Japan
EU
China
Taiwan
Spain
Korea
Other S.E
Australia
Other
Italy
USA
Hong Kong
EU (centraldistribution)
17%
Japan23%
China22% Taiwan
9%
Spain7%
Taiwan9%
Korea 5%
ContinentalEurope
25%
Japan23%
China22%
Source: Statistics New Zealand
New Zealand kiwifruit export markets (year to 30 June 2017)
Sources: Zespri International Annual Reviews, y/e March; * data Statistics New Zealand exports, all exporters year ending June

1312
Pacific 2%Africa 6%
Middle East 6%
Braeburn31.8%
U.K & Ireland15%
Americas19%
Asia23%
ContinentalEurope37%
Royal Gala35.1%
Fuji 9.1%
Africa 6%
Paci�c 2%
Middle East 4%Americas 12%
Continental Europe 23%Asia 36%
U.K & Ireland 14%
ContinentalEurope
24%
Asia36% UK & Ireland
14%
Americas12%
Apple statisticsYear ending 31 Dec. 2010 2013 2014 2015 2016 2017Crop volumes (’000 tonnes)National export production 260 320 311 331 350 343Growing method: IFP 94% 95% 94% 94% 93% 93%Certified organic 6% 5% 6% 6% 7% 7%General statisticsExport FOB $/TCE (*) $22.93 $27.69 $29.64 $32.83 $37.15 $35.72Area planted (ha) 8,630 8,372 8,429 8,566 8,809 9,535Export orchards (no.) 985 953 921 919 953 1,015 Export packhouses (no.) 62 61 56 56 55 58No. of exporters 95 84 76 79 77 75
IFP: Integrated Fruit Production sustainability; TCE: tray equivalents 18 kg sale weight. Source: New Zealand Apples & Pears Inc., (*) Statistics New Zealand, export fob. Year ending June 2017
Sector profiles
In 2017 New Zealand exported 343,000t of apples (total production of 384,000t) and although only 4.4% of global fresh apple export volume, it was globally the eighth largest exporter.
→ ‘World Apple Review 2017’ ranked New Zealand #1 amongst 33 major apple– producing countries after measuring 23 criteria covering production efficiency, industry infrastructure and financial and market factors. The review cited New Zealand’s 80.5% production in new varieties and average yield 2014-2016 of 62.0t/ha compared with all other apple-producing countries average of 23.9t/ha. The next highest yields were four countries achieving yields of 40 to 46 t/ha, with all others being less than 40t/ha.
→ “Our (New Zealand’s) world leading growing systems which produce apples and pears with the lowest levels of residues of any other exporting country gives New Zealand priority market access, and New Zealand developed world leading post-harvest technology ensures only the highest quality fruit enters the market … leading to increased employment opportunities with more skilled labour demand in Gisborne, Waikato, Hawke’s Bay, Wairarapa, Nelson, South Canterbury and Central Otago” Source: New Zealand Apples & Pears Inc. Chief Executive Allan Pollard.
Apple export destinations by region
→ “The New Zealand apple industry has long recognized that the key to overcoming its distance from major markets is innovation, in new varieties, in superior quality, and in branded promotions.” Source: World Apple Review 2017. Significantly, New Zealand exported 16,800t of apples to China (year ending Dec. 2017), despite difficult import requirements and China itself being the world’s largest producer at 42.6m tonnes and 50% of 2015 global production of 85.3m tonnes. China exported 830,000t apples in 2015.
Source for above charts: New Zealand Apples & Pears Inc. (Weight basis, year ending Dec. 2017)Source: New Zealand Apples & Pears Inc. Year ending 31 Dec. 2017
Apple export production by variety: 2010 – 2017
‘Braeburn’ ‘Fuji’ Pacific Queen™
‘Cox’ ‘Granny Smith’ Pacific Rose™
Pink Lady® Jazz™ ‘Royal Gala’Other applesEnvy™ Pacific Beauty™
0
50
100
150
200
250
300
350Breaburn
Cox
Cripps Pink
Envy
Fuji
Granny Smith
Jazz TM
Paci�c Beauty TM
Paci�c Queen TM
Paci�c Rose TM
Royal Gala
Other apples
201720162015201420132010
0
50
100
150
200
250
300
350Breaburn
Cox
Cripps Pink
Envy
Fuji
Granny Smith
Jazz TM
Paci�c Beauty TM
Paci�c Queen TM
Paci�c Rose TM
Royal Gala
Other apples
201720162015201420132010
(tonnes x 000)
Apple exports by variety
Braeburn
Royal Gala
Fuji
Jazz
Other varieties
Pacific Rose
Envy
Cripps Pink
Coxs Orange Pippin
Granny Smith
Pacific Queen
Pacific Beauty
Braeburn
Royal Gala
Fuji
Jazz
Other varieties
Pacific Rose
Envy
Cripps Pink
Coxs Orange Pippin
Granny Smith
Pacific Queen
Pacific Beauty
Braeburn
Royal Gala
Fuji
Other varieties
Pacific Rose
Jazz
Envy
Cripps Pink
Coxs Orange Pippin
Granny Smith
Pacific Queen
Pacific Beauty
Braeburn
Royal Gala
Fuji
Other varieties
Pacific Rose
Jazz
Envy
Cripps Pink
Coxs Orange Pippin
Granny Smith
Pacific Queen
Pacific Beauty
‘Braeburn’18%
‘Royal Gala’33%
JazzTM
10%
‘Fuji’8%
Pacific Beauty™ <1%
Pacific Queen™ 6%
‘Granny Smith’ 2%
‘Coxs Orange Pippin’ 1%
Pink Lady® 6%
Envy™ 5%
Pacific Rose™ 3%
Other varieties 7%
APPLES
A winning apple‘
The Envy™ apple was crowned “favourite apple” by American consumers in a US Apple Association competition comparing 32 of the world’s most popular varieties. The tournament, with more than 31,000 consumer votes, saw the New Zealand-bred Envy beat traditional favourites, such as ‘Braeburn’ and Pink Lady®, as well as other new varieties, such as SweeTango®.

1514
Other fresh fruit Sales value ($m)Growersa Planted areaa Crop volumea Domesticb Exportc (fob)
(no.) (ha) (tonnes) 2016/17 2017Avocados 1,041 3,787 43,375 40.3d 155.5d
Berryfruit 240 3,072 22,844 51.4 40.0- Blackcurrants 32 1,636 8,915 1.0- Boysenberries 19 206 2,700 4.5- Raspberries 50 150 945 3.0- Blueberries 75 740 3,284 21.0 32.3- Strawberries 110 220 6,500 21.3 7.7- Other berryfruits 120 500 0.6
Citrus 330 1,660 30,692 61.0 13.0- Grapefruit 18 15 302 0.3- Lemons 75 257 6,291 13.0 9.5- Limes 47 27 410 2.0- Mandarins 140 556 11,079 24.0 1.4- Oranges 121 783 11,708 16.0 2.0- Tangelos 28 22 902 1.0 0.1
Feijoas 220 238 1,200 3.8 0.3Grapes - table 43 0.8Hops 18 442 760Kiwiberries 28 35 200 0.3 3.9Nashi 18 25 650 1.3 0.1Nuts 1,344 0.9- Cashews 0.1- Chestnuts 100 142 350- Macadamias 195- Pisachios- Hazelnuts 433- Walnuts 574- Other nuts 0.8
Olives 300 2,172 4,000Passionfruit 47 38 125 0.7 1.0Pears 76 397 3,594 9.4Persimmons 50 154 1,630 1.5 8.4Summerfruit 280 1,808 17,690 62.2 77.6- Apricots 52 318 2,567 6.4 5.2- Cherries 88 645 5,025 16.8 71.2- Nectarines 56 328 4,074 17.1 0.2- Peaches 73 300 3,604 13.6 0.7- Plums 78 217 2,420 8.3 0.3
Tamarillos 40 100 450 2.4 0.1Other fruit 250 0.4Total fresh fruit (excl. Kiwifruit, Grape Wine, Apples) 303.4
Sources: aSector estimates, bSector estimates of first point of sale values, cStatistics New Zealand Overseas Trade Statistics. dSector adjusted data for product group reporting period. Blank entries indicate either that the information is not available or items are valued at less than $100,000. Year ending June 2017.
Processed fruitDomestica Exportb (fob)2016/17 2017
Apple juice 80.0c 19.8Avocado oil 4.5 4.0Blackcurrant concentrate 9.0Other fruit juices 92.1 28.2Other fermented beverages 10.7Dried fruits 4.8Frozen fruits 17.7- Blackcurrants 1.1- Blueberries 2.8 2.7- Boysenberries 2.7 2.9- Kiwifruit 7.7- Raspberries 0.2- Other 3.1
Fruit preparations 44.0- Apples 14.0- Blackcurrants 0.1- Kiwifruit 3.4- Fruit mixture preps 19.9- Pears 0.1- Other 6.5
Hops 7.4 20.0a
Jams, jellies and purees 4.8Nuts 3.4Olive oil 12.0 0.5Total processed fruit 166.9
Fruits used for processing is produced on the orchard areas described in the fresh fruit table. aSector estimates of first point of sale values, bStatistics New Zealand, Overseas Trade Statistics cAuthor’s estimate . Blank entries indicate either that the information is not available or items are valued at less than $100,000. Year ending June 2017.
Sector profiles
→ Fresh fruit exports in 2017 were 882,300t worth $2.66b. The average value for fresh fruit exports for the previous five years was $1.95b.
→ Kiwifruit exports $1.66b (2016: $1.67b) were 63% of the total fresh fruit export value; apple exports $691.1m ($691.8m) were a further 26%. Other fresh fruit exports were avocados $156md ($91md), cherries $71m ($68m), blueberries $32m ($37m), and 23 other fresh fruit crops with a combined value of $54m.
→ Cherries exports of $71m were $27m above the 2012 to 2016 average of $44.3m.
→ New Zealand avocado industry reached record exports of $155.5m, with the previous highest export value being $103m in 2014. An industry challenge is the biennial profile of the avocado crop where the volume in successive seasons can vary significantly.
→ The commercial production of New Zealand hops from selected aroma cultivars has had increasing demand from international brewers, with 2017 exports worth close to $20m fob (average export value previous five years: $12.6m). New Zealand production includes 15 unique varieties. 500t were exported in 2017 from a total production of 760t.
Sales value ($m)
OTHER FRUIT
A new government-funded research project is looking to produce a new type of blueberry with healthy, colourful flesh. The project will investigate the potential for a new commercial crop that would provide New Zealand with a unique product in the marketplace, combining the taste and growing characteristics of blueberries with the colourful flesh of bilberries.
Breeding bluer blueberries
(year to 30 April)

16 17
Fresh and processed vegetablesGrowersc Plantedc Crop volumec Domesticc Exports 2017g
(no.) area (ha) (tonnes) 2017 Fresh Processedb
Asparagus 39 521c 1,500 7.0 1.6Beans 25 1,200c 16,300 10.3 38.7- fresh 5 300 3,000 6.0- processed 25 900 13,300 4.3
Beetroot 50 430 28,000 8.0- fresh 42 130 8,000 5.0- processed 8 300 20,000 3.0Brassicas 125 2,800c 105,000 80.3 2.2- Broccoli 75 1,500 c 19,000 35.0- Cabbage 75 800 c 56,000 25.3- Cauliflower 25 500 c 30,000 20.0
Capsicums 20 75c 19,000 47.0 28.7Carrots 40 1,410c 154,000 56.0- fresh 20 800 88,000 40.0 9.5- processed 20 610 66,000 16.0 2.4
Cucumbers 50 50c 1,770 20.0Eggplant/Aubergines 8.5Garlic 8 200c 900 7.0 1.3Kumara 46 1,600c 22,000 35.0Lettuces 100 1,350 42.0 0.6- outdoor 40 1,300 c 17.0- greenhouse 60 50 c 25.0
Melons 20 273f 4,800 28.0 1.2Mushrooms 7 25c 8,500 42.0 1.2Onions 95 5,235c 206,322 30.0 112.0Peas 442- fresh 42- processed 400 8,250f 62,000 25.0 84.6Potatoes 169 10,329c 525,000 149.0 21.9 93.8Pumpkins 40 1,048f 38,000 13.0Shallots 4 30c 1,200 3.0 0.4Silverbeet/Spinach 15 200c 3,500 12.0Squash 25 6,526c 82,725 3.0 56.2Sweetcorn 150 4,664f 90,000 29.5 0.1 41.5- fresh 22,000 11.0- processed 68,000 18.5
Tomatoes 155 770 102,900- outdoor, processed 15 650c 60,500 9.0 4.4- greenhouse 130 120c 42,500 172.2 12.0
Truffles d 75 70 0.2 0.5Mixed vegetables Made from combinations of the above crops. 25.6Dried vegetables Excluding peas, beans, corn. 10.1Vegetable preps 24.1Vegetable juices 28.8- carrot juice d 27.3- other veg. juices 1.5
Other vegetables a 2,457 2.1 12.4Total 800e 50,163 f 251.0 366.4
Crops areas are predominantly sector estimates. aIncludes taro, celery, parsnips, spring onions, Asian vegetables (excl. Chinese cabbage), yams, witloof, leeks, vegetable shoots, shallots, swedes and some others. bProcessing includes freezing, canning, juicing and artificial drying. cSector estimates. Blank entries indicate that the information is not available. d Authors’ estimates. eGrowers produce multiple crops. fStatistics New Zealand Production Census crop areas as at 30 June 2012. gStatistics New Zealand from export entries.
Source: Statistics New Zealand. Years ending 30 June.
VEGETABLES
Vegetable exports 2005 – 2017 ($ million, fob)
0
100
200
300
400
500
600
700
800
Processed Vegetables
Frozen
Fresh Vegetables
201720162015201420102005
Other Processed Frozen Fresh
0
100
200
300
400
500
600
700
800
Processed Vegetables
Frozen
Fresh Vegetables
2015201420132012201120102005
Other Processed Frozen Fresh
→ Total value of vegetable exports in 2017, at $617m, was $2.5m above 2016. Exports of fresh and chilled vegetables were $8.0m less, but exports of dried vegetables increased by $6.6m and vegetable juice (predominantly carrot juice), increased by $5.0m.
→ In 2017 New Zealand exported more than 20 significant varieties of vegetables, the dominant varieties being: potatoes $112.8m, onions $111.9m, peas $84.6m, squash $56.2m, sweetcorn $41.5m, beans $37.8m and capsicums $28.7m. These seven varieties were 76% by value of 2017 exports.
→ Net weight of vegetable exports in 2017 was 494,000t and 3.4% less than in 2016 (511,150t).
→ Fresh and processed vegetables were exported to 81 countries in 2017 (2016: 91), with more than half (57.8%) to two countries:
– 32.7% to Australia: $202.1m (fresh veg. $10.4m, frozen $117.2m [potatoes $55.2m, peas $24.8m, mixed veg. $18.0m], vegetable preparations $58.2m [of beans: $27.6m]).
– 25.1% to Japan: $154.7m (fresh $85.1m [squash $40.6m, capsicums $20.8m]), frozen $26.6m, vegetable juice $26.0m (predominantly carrot).
→ New Zealand imported 107,100t of vegetables with a cif value of $243.0m (2016: 107,240t/$243.8m cif) from 80 countries in 2017. Largest volume vegetable imports were 26,480t of preserved tomatoes (Italy 11,600t, the USA 8,100t) and 17,040t of frozen potatoes (Continental Europe 6,440t, Australia 6,700t).
Sales value ($ million, fob)
Sector profiles

1918
0
20
40
60
80
100
120
2016
2012
2009
2007
$108.1m
$68.3m
$21.2m$24.7m
2009 2012 20152007
Wine & beerProcessed foods& ingredients
DairyFresh fruit& vegetables
Destinations of New Zealand vegetable exports
A new potato cultivar, ‘Crop39’, has been launched to New Zealand growers. The cultivar will be marketed as White Beauty for commercial growers and as Summer Beauty for the garden market. It is a bright, high-yielding potato, good for mashing, roasting and boiling whole. The cultivar was bred for New Zealand conditions but is also being evaluated in Australia and the USA.
Bright new potato
Source: Statistics New Zealand. Year ending 30 June 2017.
($ million, fob)0 50 100 150 200 250
Other countries
UK
Malaysia
USA
Korea
China
Indonesia
Fiji
Other Pacific Islands
Other Asian countries
Continental Europe
Japan
Australia
Processed vegetablesFresh vegetables
VEGETABLES ORGANICS
Organic production
→ New Zealand horticultural land area under organic certification increased by 128% in the three years from 2012 (11,188 ha) to 2015 (25,476 ha), reflecting significant growth principally in certified organic pipfruit and vineyard production.
→ In 2015 there were 610 organic operations in horticulture, down 5% from 2012.
→ Export values of organically certified fresh fruit and vegetables in 2015 were calculated to be $108m and 45% of total organic sector produce exports.
→ In 2015, the New Zealand market for organic food, including both exported and domestically consumed, was estimated at between $457m and $467m. This compares with an estimated $350m in 2012 – a 30% increase.
New Zealand exports of organically certified produce ($ millions)
0
5,000
10,000
15,000
20,000
25,000
30,000
201520122009 20072002
Source above and below: New Zealand Organic Market Report 2016. Years ending March.
New Zealand land area under organic certification, horticulture and viticulture
(hectares)
Sector profiles

2120
Sector profiles FLOWERS, PLANTS, SEEDS & OTHER PRODUCTS
→ Of the $20.5m of cut flowers exported to 33 countries in 2017 (2016 $26.8m), Asia was the largest destination region $11.5m ($15.7m), dominated by Japan at $7.8m ($11.9m). The next largest destination markets were the USA $4.4m and Hong Kong $1.4m, with exports to other countries each being less than $1.0m.
→ Vegetable seed valued at $64.4m in 2017 (2016: $74.3m) was exported to 50 countries, having been only $15.9m in 2000. Largest export value destinations were: Continental Europe $32.0m (The Netherlands $25.2m, Germany $3.2m, France $2.1m, Italy $1.2m), Asia $22.9m (Korea $8.0m, Japan $5.9m, Vietnam $3.4m), the USA $3.4m and Australia $2.3m. Exports to 41 other countries were each less than $1.0m fob.
Exports of flowers, seeds and bulbs ($ million, fob)
Source for above graphs: Statistics New Zealand. Years ending 30 June.
0
30
60
90
120
150
Cut �owers
Vegetable seeds
Bulbs & tubers
2017201620152014201320102000
Bulbs & tubersVegetable seedsCut flowers
0
20
40
60
80
100
Other veg. seeds
Silverbeet
Onion
Radish
Carrot
Cabbage
All veg seeds
201720162015201420132012201120102000
SilverbeetRadishOnionCabbage
All veg. seeds
Carrot
Other veg. seeds
Vegetable seed exports ($ million)
Exports of flowers, plants, seeds and other products ($ million,fob)2000 2010 2015 2016 2017
Cut flowers- Chrysanthemums 0.2 0.1 0.1 0.1- Hydrangeas 2.7 2.8 2.4 2.4- Lilium 1.9 0.2 0.1 0.1 0.1- Nerines 0.6 0.2 0.1 0.1 0.1- Orchids 22.4 20.8 12.9 14.6 11.7- Paeonies 0.5 1.7 2.0 2.7 2.7- Pittosporum 1.2 0.5 0.6 0.6- Proteaceae 1.4 0.9 0.3 0.3 0.3- Sandersonias 3.1 0.2 0.1 0.2 0.1- Zantedeschia (Calla lily) 7.7 3.7 0.9 1.0 0.3- Other foliage 0.6 0.6 0.3 0.2 0.6- Other cut flowers 8.5 2.7 2.8 4.7 2.1
Plants- Other live plants 5.6 6.6 4.8 5.2 4.8
Seeds- Flower seeds 2.1 0.3 0.4 0.2 0.4- Fruit seeds 1.9 2.4 2.8 3.1- Cabbage seeds 5.0 4.7 4.9 6.5- Carrot seeds 7.6 12.2 17.3 12.8- Radish seeds 21.4 23.9 28.5 22.8- Silverbeet seeds 4.0 6.1 2.4- Other veg. seeds 15.9 23.4 17.7 17.4 19.9- Tree seeds 1.6 1.5 1.0 1.1 1.4
Bulbs, tubers, corms- Lilium 16.8 24.2 22.7 20.6- Sandersonias 0.7 0.2 0.4 0.2- Tulips 9.6 9.7 16.3 15.3- Zantesdeschia (Calla lily) 1.5 3.5 0.1 0.1 0.1- Others 10.1 0.4 0.6 0.1 0.1
Sphagnum moss 15.3 6.1 5.2 5.4 5.4*Total 98.8 139.9 134.0 155.5 136.9
The term “bulbs” is used to include bulbs, corms, tubers, tuberous roots, crowns & rhizomes. *Authors’ estimate. Source: Statistics New Zealand. Years ending 30 June.
→ Cut flowers and foliage exports decreased in value to $21.1m in 2017 having averaged $28.2m for the previous five years. Seeds exports were $69.3m (prev. 5 yr average: $72.4m). 2017 imports in these categories (cif value) were cut flowers and foliage $6.0m, seeds $27.0m (veg. seed $23.2m), and bulbs and other live plants $9.9m.
0
30
60
90
120
150
Cut �owers
Vegetable seeds
Bulbs & tubers
2017201620152014201320102000
Bulbs & tubersVegetable seedsCut flowers

2322
Bees
Trainees by category (year to December 2017)
Source: Primary ITO
→ In 2017 trainees in the different fields of horticulture totalled 8,379 (2016: 5,894).
→ Trainee numbers in the subjects of fruit, vegetables and viticulture (wine grape) production, and in organics totalled 4,592 in 2017 and exceeded the previous record of 3,546 in 2016.
→ The average number of trainees in produce production subjects for the four years 2014 to 2017 was 3,172 per year compared with the four years prior (2010 to 2013) average of 1,890.
People in horticultural training, per year 2005 - 2017
Source: Primary ITO
0
2000
4000
6000
8000
10000Other
Produce
201720162015201420132012201120102005
Produce: fruit, vegetables, viticulture, organics
Other hort. incl: arboriculture, amenity, floriculture, floristry, landscape, nursery, plant & garden supplies
0
2000
4000
6000
8000
10000
201720162015201420132012201120102005
Produce: fruit, vegetables, viticulture, organics
Other hort. incl: arboriculture, amenity, floriculture, floristry, landscape, nursery, plant & garden supplies
A vital contributor to horticulture
→ Bees are crucial to New Zealand’s primary sector, pollinating approximately one third of our food sources.
→ Honey production in 2017, at 14,855t was down by 5,030t (2016: 19,885t), but above the ten-year average of 14,712t. Average yield per hive at 18.7kg was 62% of the 10-year average of over 30kg per hive, because of what the Ministry for Primary Industries described as “unfavourable climatic conditions impacting on crop flowering, bee activity and nectar flows in several districts.”
→ In 2017 New Zealand’s honey exports went to 56 countries, with a total value of $328.8m fob (2016: $314.5m), 81% by weight in retail packs.
→ As at June 2017 New Zealand’s 7,814 registered beekeepers (2016: 6,735) had 795,578 hives, an increase of 111,532 on 2016 and now double the number of hives in 2011.
New Zealand natural honey exports 2010 - 2017
Source: Statistics New Zealand
0
50
100
150
200
250
300
350
201720162015201420132012201120100
5000
10000
15000
20000
25000
2015201420132012201120102005
$ m fobTonnes
0
5000
10000
15000
20000
25000
30000
35000
20172016201520142013201220112010
$33.5 m$38.4 m
$47.6 m
$62.6 m
$81.0 m
$97.6 m$101.5 m
$121.1 m
Export value $ m fobTonnes domestic market
Tonnes exported
$97.6m$101.5m
$121.1m$144.9m
$186.6m
$233.1m
$314.5m$328.8m
New Zealand honey production (14,855 tonnes)
Marlborough,Tasman, Westland, 11%
Otago, Southland, 10%
Bay of Plenty, Coromandel,
Poverty Bay, 12%
Hawke’s Bay,Taranaki,Manawatu,Wairarapa, 22%
Canterbury, 17%
Waikato,King Country,
Taupo, 14%
Northland,Auckland,
Hauraki Plains, 14%
Source: AsureQuality Ltd. Year ending June 2017.
Horticultural training
Fruit production
Amenity
Vegetables
Nursery production
Landscape
Other
Floristry
Aboriculture
Viticulture
Fruit production
Amenity
Vegetables 8%
Other incl. organics <1%
Floriculture & Floristry 1%
Aboriculture 11%
Nursery production 4%
Fruitproduction
36%
Amenity19%
Landscape11%
Viticulture 10%
Fruit production
Amenity
Vegetables 9%
Other incl. organics <1%
Floristry 1%
Nursery production 5%
Floriculture <1%
Aboriculture 8%
Landscape 9%
Fruitproduction
39%
Amenity17%
Viticulture 12%
(Years to December)
(Years to June)
($ m fob/ x 00 tonnes)

2524
Investment in horticultureHousehold spend
→ The highest value investments are in the apple, wine grape, kiwifruit and avocado orchards and vineyards that are collectively 84% of fruit crop hectares. Since 2015, apple orchards have increased in value by approx. 70% (strong performance in international markets); kiwifruit orchards also increased by approx. 70% in value (export success with new gold kiwifruit cultivars and emergence from the Psa bacteria impact); wine grape vineyards had a lesser increase (New Zealand wine continues to receive accolades from international markets); avocado orchards increased in value by approx. 180% (strong performance in export markets).
→ Total investment in New Zealand’s horticultural industry is estimated to be in excess of $52b (2015: $40b) inclusive of off-farm postharvest and related facilities. Investment in vegetable crops and related facilities 2015 to 2017 increased by approx. 8%.
Investment in the horticultural industries, 2017Crop area On-farm Off-farm Total
(ha) ($ million) ($ million) ($ million)Apples, pears & nashi 9,535 1,765 1,510Wine grapes 37,129 7,465 21,050Kiwifruit 12,578 7,670 2,330Summerfruit 1,808 155 110Avocados 3,787 1,005 550Citrus 1,660 145 80Berryfruit 3,072 265 180Nuts 1,344 115 30Olives 2,172 190 130Other subtropical fruit 750 65 30Hops 442 40 70Other fruit 923 80 350Total fruit 75,200 $18,960 $26,420 $45,380Potatoes 10,330 645 310Peas & Beans 9,750 680 330Onions 4,895 305 150Squash 6,525 520 250Sweetcorn 4,664 305 145Broccoli, cabbages & cauliflowers 2,800 180 90Carrots 1,410 90 45Asparagus 521 35 15Lettuce 1,350 90 50Other vegetables 7,235 470 195Total vegetables (outdoor) 49,480 $3,320 $1,580 $4,900Floriculture - outdoor 590 40 20Protected - high tech 85 340 100
- greenhouse tomatoes 120 360 110- low/medium tech. 320 480 140- floriculture (under cover) 340 510 50
Total floriculture & protected crops 1,455 1,730 420 $2,150Total horticultural 126,135 $24,010 $28,420 $52,430
The above table is an estimate of the investment that has been made in the productive area of New Zealand horticulture and related postharvest facilities.
Crop area figures are predominantly industry estimates of planted areas per crop for the year to June 2017 (pgs 8 to 16 incl.) with author adjustments for informal production and differ from Statistics New Zealand Agricultural Production Census hectares as at June 2012 (pgs 26 & 27). No adjustment has been made for non-productive farm/orchard/vineyard areas that are typically 15% of total area and up to 80% for crops such as floriculture under cover.
Land values are based on independent land valuation advice and industry and authors’ estimates. Off-farm investment levels have been estimated from industry advice and guidance including integrated producers whose supply chain includes both production and post production.
New Zealand consumer spending on vegetables ($ million)
New Zealand consumer spending on fruit ($ million)
0 50 100 150 200
Other vegetables (fresh / chilled)Other canned or bottled veg.Frozen mixed vegetables - incl. stir fryOther vegetables (frozen, canned, dried, etc.)CeleryOlivesZucchini / courgettesCauliflowerAsparagusPumpkins / gourdsTomatoes (canned and bottled)CabbageSpinachPeasCorn (fresh, chilled, frozen, canned)Cucumber / gherkinsBeansCarrotsKumaraOnionsBroccoliCapsicums / peppersMushroomsLettuceCombinations of fresh & chilled veg.Tomatoes (fresh & chilled)Potatoes and potato products
0 50 100 150 200
Other vegetables(fresh / chilled)
Other canned or bottled veg.Frozen mixed vegetables - incl. stir fry
Other vegetables (frozen or dried)CeleryOlivesZucchini/courgettesCauliflowerAsparagus
Pumpkins/gourdsTomatoes (canned and bottled)CabbageSpinachPeasCorn (fresh, chilled, frozen, canned)
Cucumber/gherkinsBeans
CarrotsKumaraOnionsBroccoli
Capsicums/peppersMushroomsLettuce
Combinations of fresh & chilled veg.
Tomatoes(fresh & chilled)
Potatoes and potato products
0 50 100 150 200
Other fruitOther berryfruit e.g. raspberriesOther dried fruitOther citrus e.g. lemonsWatermelonsFruit mixturesPineapplesCherriesApricotsNectarinesPearsBlueberriesPeachesKiwifruitDried currants / raisins / sultanas, etc. StrawberriesOrangesAvocadoMandarinesGrapesApplesBananas
0 50 100 150 200
Other fruitOther berryfruit e.g. raspberries
Other dried fruitOther citrus e.g. lemons
WatermelonsFruit mixturesPineapplesCherries
ApricotsNectarinesPearsBlueberriesPeachesKiwifruit
Dried currants/raisins/sultanas, etc. StrawberriesOranges
AvocadosMandarinsGrapes
ApplesBananas
0 50 100 150 200
Other vegetables (fresh / chilled)Other canned or bottled veg.Frozen mixed vegetables - incl. stir fryOther vegetables (frozen, canned, dried, etc.)CeleryOlivesZucchini / courgettesCauliflowerAsparagusPumpkins / gourdsTomatoes (canned and bottled)CabbageSpinachPeasCorn (fresh, chilled, frozen, canned)Cucumber / gherkinsBeansCarrotsKumaraOnionsBroccoliCapsicums / peppersMushroomsLettuceCombinations of fresh & chilled veg.Tomatoes (fresh & chilled)Potatoes and potato products
0 50 100 150 200
Other vegetables(fresh / chilled)
Other canned or bottled veg.Frozen mixed vegetables - incl. stir fry
Other vegetables (frozen or dried)CeleryOlivesZucchini/courgettesCauliflowerAsparagus
Pumpkins/gourdsTomatoes (canned and bottled)CabbageSpinachPeasCorn (fresh, chilled, frozen, canned)
Cucumber/gherkinsBeans
CarrotsKumaraOnionsBroccoli
Capsicums/peppersMushroomsLettuce
Combinations of fresh & chilled veg.
Tomatoes(fresh & chilled)
Potatoes and potato products
0 50 100 150 200
Other fruitOther berryfruit e.g. raspberriesOther dried fruitOther citrus e.g. lemonsWatermelonsFruit mixturesPineapplesCherriesApricotsNectarinesPearsBlueberriesPeachesKiwifruitDried currants / raisins / sultanas, etc. StrawberriesOrangesAvocadoMandarinesGrapesApplesBananas
0 50 100 150 200
Other fruitOther berryfruit e.g. raspberries
Other dried fruitOther citrus e.g. lemons
WatermelonsFruit mixturesPineapplesCherries
ApricotsNectarinesPearsBlueberriesPeachesKiwifruit
Dried currants/raisins/sultanas, etc. StrawberriesOranges
AvocadosMandarinsGrapes
ApplesBananas
→ $ 800m on fresh and chilled fruit→ $ 160m on processed fruit→ $ 930m on fresh and chilled vegetables→ $ 330m on processed vegetables→ $ 820m on wine
Note: sample base is New Zealand resident private households; i.e. excludes overseas visitors, people living in motels and hotels etc. Individual line items are subject to sampling errors that as a guide are typically 12% (+/-).
Source: Statistics New Zealand: triennial Household Economic Survey (HES), 2016 . N.B. survey is of households only and excludes overseas visitors, people living in hotels and motels, etc., and excludes restaurants and takeout meals.
In 2016 New Zealand households spent an estimated $3.0b on fruit, vegetables and wine, with:
Calculated aggregate annual expenditure by all private New Zealand households (local & imported produce, fresh / chilled / dried / canned / bottled / frozen)

2726
Regional resources
Dist
ribu
tion
of v
eget
able
s by
Reg
iona
l Cou
ncils
(ar
ea p
lant
ed h
a)Di
stri
butio
n of
indo
or cr
ops
(m2 ; 0
00s)
Regi
onal
Cou
ncil
Aspa
ragu
sBr
occo
liCa
rrots
Peas
&Le
ttuce
Onio
nsPo
tato
esSq
uash
Swee
tOt
her
Tota
lCa
psicu
mCu
cum
ber
Lettu
ce/
Mus
h-
Tom
a-Al
l oth
erCa
b &
Caul
isBe
ans
corn
veg
veg
Sala
dro
oms
toes
veg.
& he
rbs
Year
end
ed 3
0 Ju
ne 2
012
Gree
ns(C
ased
)(In
door
s)N
orth
land
C28
62+
CC
22C
841,
354
1,49
6+C
1821
C10
921
+Au
ckla
ndC
940
194
7946
91,
621
1,44
4C
3857
25,
357
327
144
63C
483
138
Wai
kato
459
75+
166
2+73
1,83
72,
074
C42
298+
5,02
6+85
4631
C34
843
Bay
of P
lent
yC
53+
0C
0C
CC
1594
+16
2+C
C29
C6
CGi
sbor
ne0
C0
283+
CC
C2,
406
2,49
342
9+5,
611+
00
00
C0
Haw
ke’s
Bay
110
85C
2,50
610
662
589
3,24
81,
050
537+
8,79
7+3
21
C6
2+Ta
rana
kiC
CC
CC
C23
CC
C23
+C
0C
0C
CM
anaw
atu-
Wan
ganu
i17
385
942
943
339
392
1,26
024
123
472+
4,23
1+C
CC
0C
4+W
ellin
gton
039
+C
1+41
C19
CC
32+
132+
1C
10
C7+
Tasm
an-N
elso
n4
346+
CC
132
55+
13+
14+
37+
203+
804+
50+
C7
0C
CM
arlb
orou
ghC
CC
742
CC
2C
601
109+
1,45
4+0
0C
0C
CW
est C
oast
0
00
0C
00
00
00
C0
C0
CC
Cant
erbu
ry29
323
823
4,15
523
1,03
55,
754
C25
565
113
,048
2231
35C
4928
+Ot
ago
C14
9C
C25
415
3C
C2
333
CC
9C
6C
Sout
hlan
d0
C30
00
CC
210
00
C51
00
0C
0C
COt
her
451,
238
129
333
138
167
2894
263
560
2,72
384
2841
152
174
116
Tota
lN
ew Z
eala
nd82
0 3,
622
2,04
7 7,
858
1,25
0 5,
718
11,5
78
6,83
7 4,
664
5,31
349
,707
572
269
238
152
1,18
135
920
0787
13,
875
1,32
07,
515
1,30
94,
594
10,0
507,
774
6,21
06,
261
49,7
7958
526
6n/
an/
a1,
005
n/a
%-6
%-7
%55
%5%
-5%
24%
15%
-12%
-25%
-15%
0%-2
%1%
18%
See
abov
e no
tes
(1 h
a =
10,0
00 m
2 )
For m
ore
info
rmat
ion
visi
t w
ww
.sta
tistic
s.go
vt.n
z
Dist
ribu
tion
of fr
uit b
y Re
gion
al C
ounc
ils (
area
pla
nted
, ha)
Re
gion
al C
ounc
ilAp
ples
Win
e gr
apes
Kiw
ifrui
tSu
mm
erfru
itAv
ocad
osCi
trus
Berry
fruit
Nut
sOl
ives
Othe
r sub
tropi
cal
Othe
r fru
itsTo
tal f
ruits
Ye
ar e
nded
30
June
201
2N
orth
land
1782
574
17+
1,54
729
5+22
+62
+20
111
7+29
2,96
3+Au
ckla
nd96
300
363
50+
148
103+
137
112+
250
9129
1,67
9+W
aika
to14
126
726
3717
620
+34
2+44
+55
79+
151,
661+
Bay
of P
lent
y5
C9,
912
6+2,
081
106
45+
7242
112+
3412
,415
+Gi
sbor
ne11
01,
685
326
C60
1151
C8+
C11
5+14
3,46
9+Ha
wke
’s Ba
y5,
115
4,93
622
285
428
13+
23+
14+
321
222+
2511
,773
+Ta
rana
kiC
C0
062
CC
CC
17+
C79
+M
anaw
atu-
Wan
ganu
i34
8C
21+
225+
30+
53+
4350
+C
266+
Wel
lingt
onC
895
C29
+16
4+8+
3321
649
+30
1,28
0+Ta
sman
-Nel
son
2,49
6+82
1+49
7+22
+7
1+68
859
+12
928
4+47
5,05
1+M
arlb
orou
gh18
22,6
27C
68+
C0
C31
+13
415
+C
22,8
93+
Wes
t Coa
st
C0
00
00
C6
05+
C11
+Ca
nter
bury
226
1,55
0C
102
CC
1,00
863
924
018
+23
3,80
6+Ot
ago
459
1,57
70
1,04
6C
027
+11
6+22
16+
133,
276+
Sout
hlan
dC
C0
C0
C5+
33+
0C
C38
+Ot
her/
non
allo
cate
d12
855
137
242
159
263
624
7513
71,
046+
Tota
lN
ew Z
eala
nd8,
845
34,5
6212
,757
2,27
64,
149
1,85
72,
598
1,34
41,
657
1265
396
71,7
0620
079,
247
29,6
1613
,250
2,29
44,
004
1,83
42,
497
1,48
42,
173
1,50
039
868
,297
%-4
%17
%-4
%-1
%4%
1%4%
-9%
-24%
-16%
-1%
5%M
ajor
chan
ges r
efle
cted
in 2
012
Agric
ultu
ral P
rodu
ctio
n Ce
nsus
: tot
al fr
uit p
rodu
ctio
n ar
ea h
as in
crea
sed
by 1
3,17
1ha
(23%
) sin
ce 2
002
cens
us: w
ine
grap
es d
oubl
ed si
nce
2002
cens
us o
f 17,
359h
a; ki
wifr
uit r
educ
ed 5
02 h
a sin
ce 2
007,
but
was
793
ha a
bove
200
2 ce
nsus
of 1
1,96
4ha;
oliv
es d
ecre
ased
24%
(-51
6ha)
sinc
e 20
07 ce
nsus
and
is n
ow 3
6% b
elow
200
2 ce
nsus
of 2
,590
ha.
Tot
al o
utdo
or ve
geta
bles
are
a is
3,01
4ha
(-6%
) les
s tha
n th
e 20
02 C
ensu
s but
alm
ost u
ncha
nged
sinc
e 20
07; s
ince
the
2007
cens
us, s
wee
tcor
n ha
is -2
5% (-
1,56
4ha)
but
oni
ons i
ncea
sed
+24%
(+1,
124h
a) a
nd ca
rrots
by +
55%
(+72
7ha)
; pea
s & b
eans
(pre
dom
inan
tly p
eas),
incr
ease
d 5%
sinc
e 20
07, b
ut th
e ce
nsus
are
a is
14%
(1,2
50ha
) les
s tha
n th
e 20
02 fi
gure
of 9
,108
ha.
C - S
ome
data
hav
e be
en
supp
ress
ed fo
r rea
sons
of r
espo
nden
t con
fiden
tialit
y. +
inco
mpl
ete
data
set b
ecau
se so
me
crop
dat
a ar
e su
ppre
ssed
. So
urce
: Sta
tistic
s New
Zea
land
Agr
icultu
ral P
rodu
ctio
n Ce
nsus
- as
at J
une
2002
, 200
7 &
2012
. No
te: v
aria
tions
bet
wee
n th
e da
ta re
porte
d in
this
sect
ion
with
thos
e re
porte
d fo
r the
indi
vidua
l hor
ticul
tura
l sec
tors
can
in p
art b
e at
tribu
ted
to d
iffer
ence
s in
defin
ition
s, sa
mpl
e siz
e an
d tim
e of
sam
plin
g.
As a
t 30
June
201
2
2928
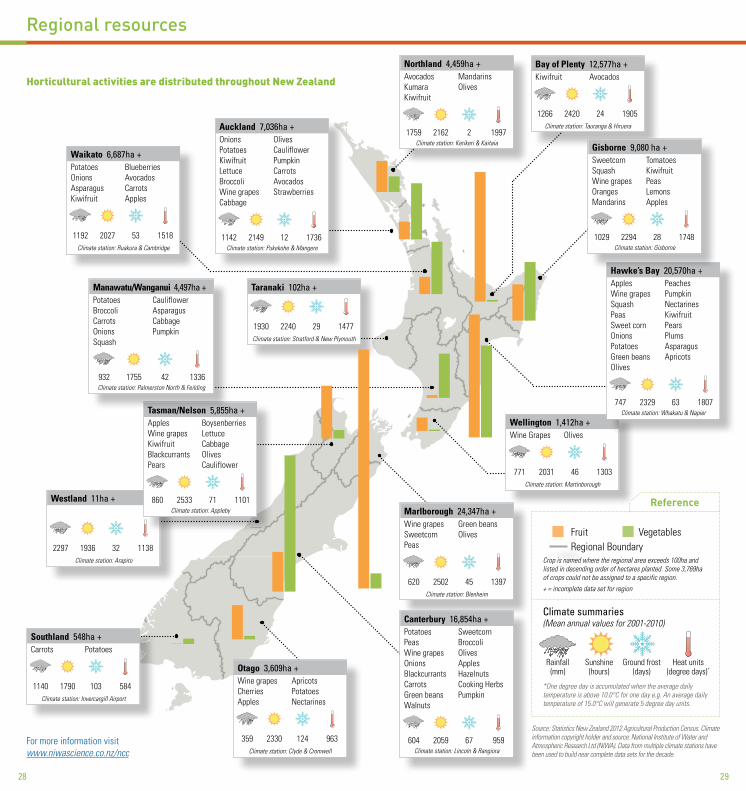
Horticultural activities are distributed throughout New Zealand
Source: Statistics New Zealand 2012 Agricultural Production Census. Climate information copyright holder and source: National Institute of Water and Atmospheric Research Ltd (NIWA). Data from multiple climate stations have been used to build near complete data sets for the decade.
Fruit Vegetables Regional Boundary Crop is named where the regional area exceeds 100ha and listed in decending order of hectares planted. Some 3,769ha of crops could not be assigned to a specific region.
+ = incomplete data set for region
Climate summaries (Mean annual values for 2001-2010)
Rainfall Sunshine Ground frost Heat units (mm) (hours) (days) (degree days)*
*One degree day is accumulated when the average daily temperature is above 10.0°C for one day e.g. An average daily temperature of 15.0°C will generate 5 degree day units.
For more information visit www.niwascience.co.nz/ncc
Waikato 6,687ha +Potatoes BlueberriesOnions AvocadosAsparagus CarrotsKiwifruit Apples
1192 2027 53 1518Climate station: Ruakura & Cambridge
Taranaki 102ha +
1930 2240 29 1477Climate station: Stratford & New Plymouth
Bay of Plenty 12,577ha +Kiwifruit Avocados
1266 2420 24 1905Climate station: Tauranga & Hiruera
Wellington 1,412ha +Wine Grapes Olives
771 2031 46 1303Climate station: Martinborough
Marlborough 24,347ha +Wine grapes Green beansSweetcorn OlivesPeas
620 2502 45 1397Climate station: Blenheim
Westland 11ha +
2297 1936 32 1138Climate station: Arapito
Otago 3,609ha +Wine grapes ApricotsCherries PotatoesApples Nectarines
359 2330 124 963Climate station: Clyde & Cromwell
Auckland 7,036ha +Onions OlivesPotatoes CauliflowerKiwifruit PumpkinLettuce CarrotsBroccoli AvocadosWine grapes StrawberriesCabbage
1142 2149 12 1736Climate station: Pukekohe & Mangere
Tasman/Nelson 5,855ha +Apples BoysenberriesWine grapes LettuceKiwifruit CabbageBlackcurrants OlivesPears Cauliflower
860 2533 71 1101Climate station: Appleby
Hawke’s Bay 20,570ha +Apples PeachesWine grapes PumpkinSquash NectarinesPeas KiwifruitSweet corn PearsOnions PlumsPotatoes AsparagusGreen beans ApricotsOlives
747 2329 63 1807Climate station: Whakatu & Napier
Gisborne 9,080 ha +Sweetcorn TomatoesSquash Kiwifruit Wine grapes Peas Oranges LemonsMandarins Apples
1029 2294 28 1748Climate station: Gisborne
Manawatu/Wanganui 4,497ha +Potatoes CauliflowerBroccoli AsparagusCarrots CabbageOnions PumpkinSquash
932 1755 42 1336Climate station: Palmerston North & Feilding
Northland 4,459ha +Avocados MandarinsKumara OlivesKiwifruit
1759 2162 2 1997Climate station: Kerikeri & Kaitaia
Canterbury 16,854ha +Potatoes SweetcornPeas BroccoliWine grapes OlivesOnions ApplesBlackcurrants HazelnutsCarrots Cooking HerbsGreen beans PumpkinWalnuts
604 2059 67 959Climate station: Lincoln & Rangiora
Southland 548ha +Carrots Potatoes
1140 1790 103 584Climate station: Invercargill Airport
Regional resources
Reference

3130
Supporting organisations
plantandfood.co.nz /growingfutures
EXPLORE HOW WE’RE MAKING AN IMPACT
HORTICULTURE
FOOD & BEVERAGE
WINE
SEAFOOD
CROPPING
FOR YOUR SECTOR
WATCH, LISTEN AND

3332
Understandingplant heatlh
Engineering, Robotics, IT& Machinery
Social MediaAdvertisingInternational
SalesIrrigation
& frost management
Understandingthe cellularstructure
GrowingProtocols
Harvest &Storage
Protocols
Shipping & supply chain management
Lowerchemical
interventions
Taste and consumer
preferences
Understandingmolecularcontrols
Developingnew varieties
UnderstandingUnderstandingEngineering, Engineering, Robotics, ITRobotics, IT
Social MediaAdvertisingAdvertisingInternationalAdvertisingInternationalAdvertising
SalesIrrigationIrrigation
& frost & frost Irrigation
& frost Irrigation
management
structurestructureGrowingGrowing
ProtocolsProtocolsGrowing
ProtocolsGrowingGrowing
ProtocolsGrowing
Harvest &Storage
ProtocolsProtocolsStorage
ProtocolsStorage
Shipping & Shipping & supply chain supply chain Shipping &
supply chain Shipping & Shipping &
supply chain Shipping &
managementmanagementLower
chemicalchemicalinterventionsinterventions
Taste and consumer
preferencespreferences
controlscontrols
DevelopingDevelopingnew varietiesnew varietiesDeveloping
new varietiesDevelopingDeveloping
new varietiesDeveloping
OrchardManagement
Post HarvestScience
Marketing
Logistics& Planning
PostHarvest
TechnologyCrop
Nutrition
Pest &Disease
Management
CropMonitoring
SensoryScience
Breeding
Genomics CellScience
New Zealand APPLESIt takes more than fresh air &
sunshine to grow the world’s best...
Sponsors
About the TrustThe New Zealand Horticentre Trust was established
in 2008 with the objective of providing ‘A helping hand for horticulture’.
The Trust encourages Horticulture and Viticulture sector groups to apply for grants to assist them in the promotion
of education, training & research in New Zealand.
The NZ Horticentre Trust has three principal sponsors, Horticentre, TasmanCrop and HortFertplus. These three principal sponsors have been providing quality products
and services to commercial crop growers since the 1980’s.
The NZ Horticentre Trust is proud to be supporting the Horticulture, Viticulture and Nursery sectors in NZ.

3534
Sponsors
18044 UF Fresh Facts ad 2018_vf.indd 1 16/04/18 8:40 PM

3736
Sponsors
FreshFacts on the go – download the app now
www.tandg.global

3938
Sponsors
TM
Gratefully acknowledge contributions made by the following organisations:
Available now to download, view graphs and export crop values back to 1999.
FreshFacts on the go – download the app now
Visit freshfacts.co.nz to see this issue and past editions online.

40 41
References used to compile this booklet:
1. Statistics New Zealand, PO Box 2822, Wellington a. Agricultural Production Census for year ended 30 June 2012. b. Household Economic Survey (HES) for year ended 30 June 2016. c. Overseas Trade Export Statistics for year ended 30 June 2017. d. Import statistics for year ended 30 June 2017.
2. New Zealand Winegrowers Annual Reports to 2017. New Zealand Winegrowers. PO Box 90-276, Auckland. www.nzwine.com
3. Pipfruit Industry Statistical Annual 2017 (year to Dec. 2017) New Zealand Apples and Pears Inc. P0 Box 11-094, Hastings. www.applesandpears.nz
4. World Apple Review, 2017 Edition, Belrose, Inc.
5. Zespri Group Annual Reports & Annual Reviews to 2017. Zespri Group Ltd. PO Box 4043, Mt Maunganui. www.zespri.com
6. Horticulture New Zealand, PO Box 10232, Wellington. www.hortnz.co.nz
7. Avocado Industry Council Annual Report 2017. New Zealand Avocado Growers’ Association and Avocado Industry Council Ltd. www.nzavocado co.nz
8. Orchard and farm valuation advice, Logan Stone Ltd. www.loganstone.co.nz
9. Further prospects for horticulture - the continuing importance of research, Bollard, ES, New Zealand Fruitgrowers Charitable Trust, Wellington. 1996.
10. Apiculture Monitoring Report 2017, Ministry for Primary Industries. www.mpi.govt.nz and AsureQuality Ltd. www.asurequality.com
11. Primary ITO (primary industries training organisation) data to Dec. 2017. www.primaryito.ac.nz
12. National Institute of Water & Atmospheric Research Ltd (NIWA): National Climate Centre. www.niwascience.co.nz/ncc
13. Organic sector data are from New Zealand Organic Market Report 2016, commissioned by OANZ (Organics Aotearoa New Zealand). www.oanz.org
14. Multiple product group contacts for updating available domestic production data.
By printing this document on Cocoon Silk 100% recycled paper, the environmental impact was reduced by*:
398 kg of landfill
53 kg CO2 and greenhouse gases
15,560 litres of water
914 kWh of energy
535 km travel in the average European car
648 kg of wood
Source: Carbon footprint data evaluated by Labelia Conseil. Virgin fibre paper data from latest European BREF data.*Compared with non recycled paper

Printed on Cocoon Silk 100% recycled paper
ISSN 1177-2190
FreshFacts is now available online at freshfacts.co.nz or download the FreshFacts app
DJS
| 201
8 | J
0073
40