frequency of physician visits on dialysis and patient … of physician visits on dialysis and...
TRANSCRIPT
Frequency of Physician Visits on Dialysis and Patient Outcomes: Is More Better?
Presented by: Areef Ishani MD, MS
Supported by NIDDK/NIH R01DK082415
Yelena Slinin MD, MS Suying Li PhD Jiannong Liu PhD Haifeng Guo MS Benjamin Morgan MD, MS David Gilbertson PhD Allan Collins MD Areef Ishani MD, MS Minneapolis VA Medical Center, and USRDS Minneapolis, MN
Medicare Reimbursement Policy Change Individuals with ESKD have high rates of
morbidity and mortality. Strategies to improve patient outcomes are urgently needed. In attempt to improve patient outcomes,
the Centers for Medicare & Medicaid Services tied physician reimbursement for outpatient hemodialysis services to the number of times a month providers see their patients on dialysis.
Evidence that Triggered the Policy Change
McClellan et al. JASN 1998; 9:1949. Observational study in 5817 randomly selected patients
on hemodialysis at 213 facilities in Network 6. Physician visit frequency reported by facilities in a survey. Physician visits > once a week associated with small reduction in mortality (coefficient -0.5, p0.01).
Pfifer et al ASN 2002 abstract (never published). DOPPS – international prospective observational study
of HD facilities. Physician-patient contact time (30 minutes / month) was associated with 3% reduction in mortality but not access failure after adjustment for patient and facility characteristics.
2004 CMS HD Reimbursement Policy Before 2004, provider reimbursement
previously based on per patient per month capitated fee (average $ 262 per month in 2003).
Policy based reimbursement on the
number of visits a month. ◦ >= 4 visits a month - $303 in 2004; ◦ 2-3 visits a month - $252; ◦ 1 visit a month - $201.
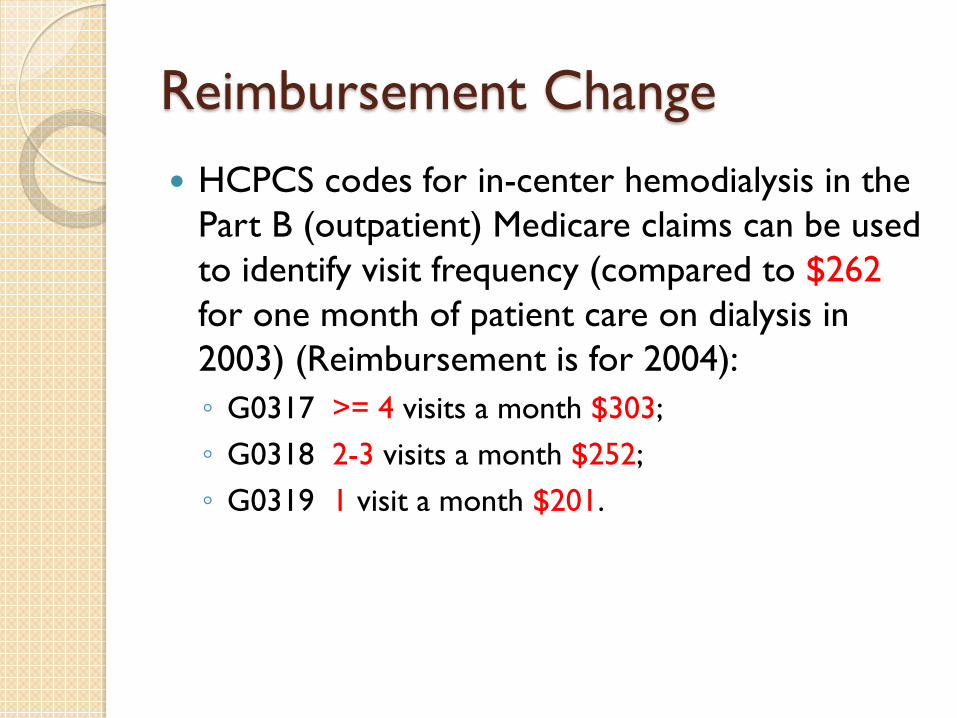
Reimbursement Change HCPCS codes for in-center hemodialysis in the
Part B (outpatient) Medicare claims can be used to identify visit frequency (compared to $262 for one month of patient care on dialysis in 2003) (Reimbursement is for 2004): ◦ G0317 >= 4 visits a month $303; ◦ G0318 2-3 visits a month $252; ◦ G0319 1 visit a month $201.
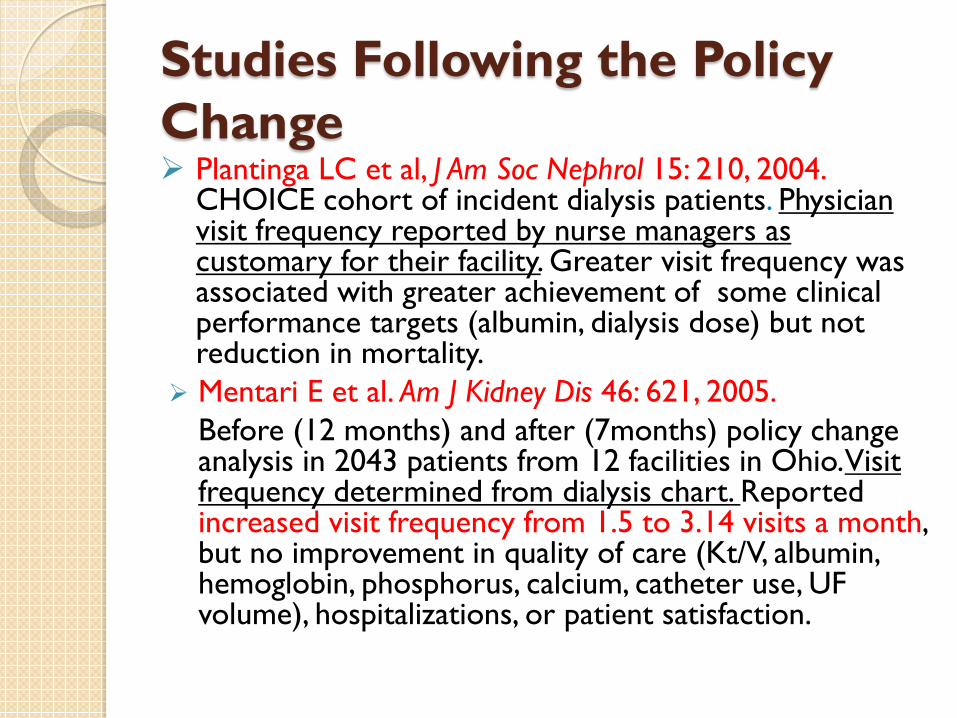
Studies Following the Policy Change Plantinga LC et al, J Am Soc Nephrol 15: 210, 2004.
CHOICE cohort of incident dialysis patients. Physician visit frequency reported by nurse managers as customary for their facility. Greater visit frequency was associated with greater achievement of some clinical performance targets (albumin, dialysis dose) but not reduction in mortality.
Mentari E et al. Am J Kidney Dis 46: 621, 2005. Before (12 months) and after (7months) policy change
analysis in 2043 patients from 12 facilities in Ohio. Visit frequency determined from dialysis chart. Reported increased visit frequency from 1.5 to 3.14 visits a month, but no improvement in quality of care (Kt/V, albumin, hemoglobin, phosphorus, calcium, catheter use, UF volume), hospitalizations, or patient satisfaction.
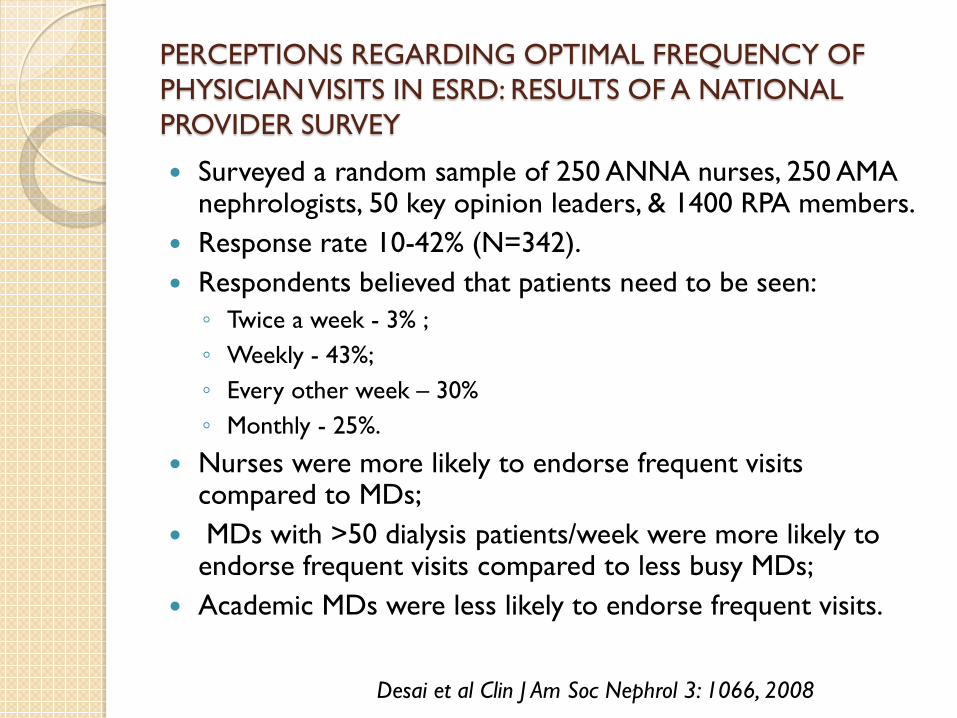
PERCEPTIONS REGARDING OPTIMAL FREQUENCY OF PHYSICIAN VISITS IN ESRD: RESULTS OF A NATIONAL PROVIDER SURVEY
Surveyed a random sample of 250 ANNA nurses, 250 AMA nephrologists, 50 key opinion leaders, & 1400 RPA members.
Response rate 10-42% (N=342). Respondents believed that patients need to be seen: ◦ Twice a week - 3% ; ◦ Weekly - 43%; ◦ Every other week – 30% ◦ Monthly - 25%.
Nurses were more likely to endorse frequent visits compared to MDs;
MDs with >50 dialysis patients/week were more likely to endorse frequent visits compared to less busy MDs;
Academic MDs were less likely to endorse frequent visits.
Desai et al Clin J Am Soc Nephrol 3: 1066, 2008
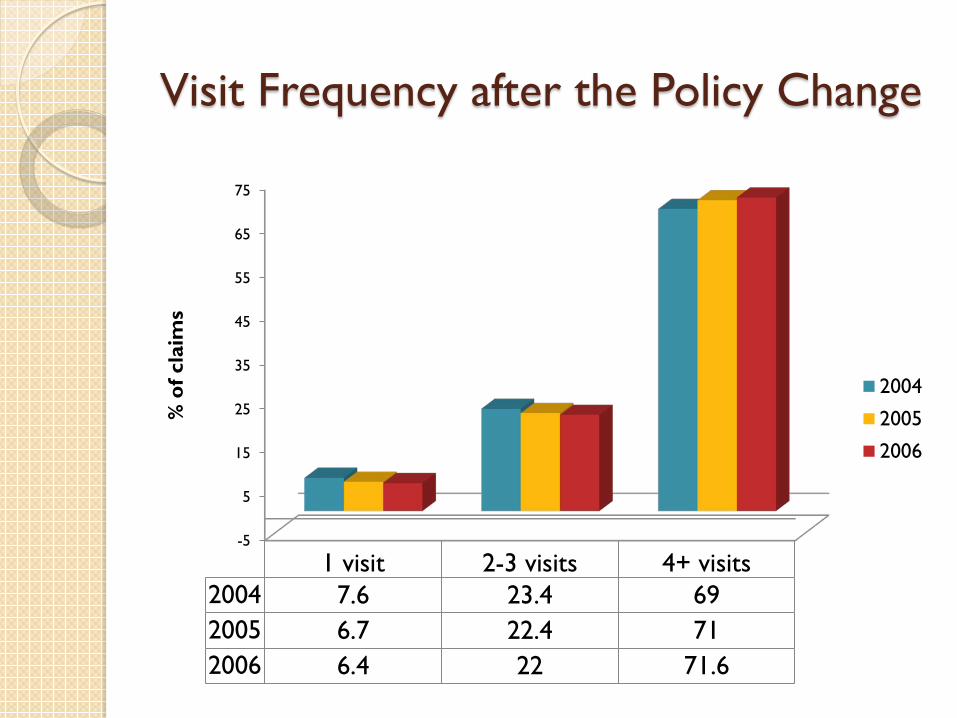
Visit Frequency after the Policy Change
-5
5
15
25
35
45
55
65
75
1 visit 2-3 visits 4+ visits2004 7.6 23.4 692005 6.7 22.4 712006 6.4 22 71.6
% o
f cla
ims
2004
2005
2006
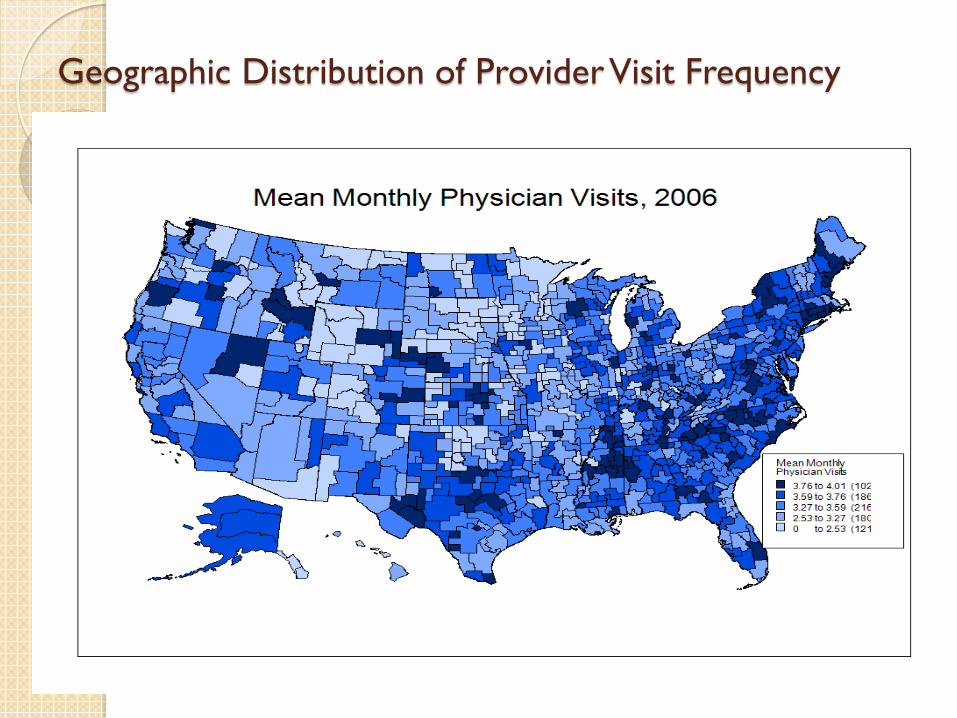
Geographic Distribution of Provider Visit Frequency
Who Provides Care to Dialysis Patients?
There was a significant growth of number of visits with Nurse Practitioners as primary providers from 2003 to 2004: whereas only 234 (0.01%) patient - months of dialysis care were provided by NPs in 2003, the number increased to 9,999 (0.40%) in 2004 (refers to comprehensive visits).
We are not able to determine proportion of non-comprehensive visits provided by physician extenders.
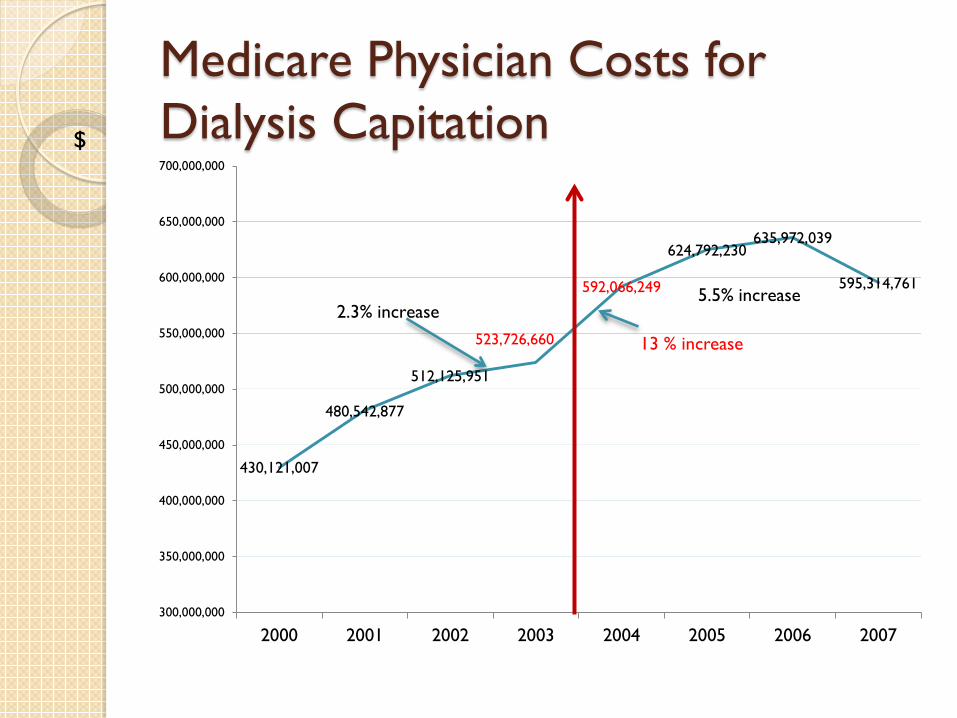
Medicare Physician Costs for Dialysis Capitation
430,121,007
480,542,877
512,125,951
523,726,660
592,066,249
624,792,230 635,972,039
595,314,761
300,000,000
350,000,000
400,000,000
450,000,000
500,000,000
550,000,000
600,000,000
650,000,000
700,000,000
2000 2001 2002 2003 2004 2005 2006 2007
2.3% increase 5.5% increase
$
13 % increase
Conclusion
The Medicare reimbursement policy had the intended consequence of increasing provider-patient visit frequency.
Visit frequency varied substantially by geographic area.
The reimbursement policy change was associated with higher Medicare outpatient dialysis provider payments.
Is More Better? Is greater physician-patient visit frequency
on dialysis associated with a reduced risk of hospitalizations and mortality among hemodialysis patients.
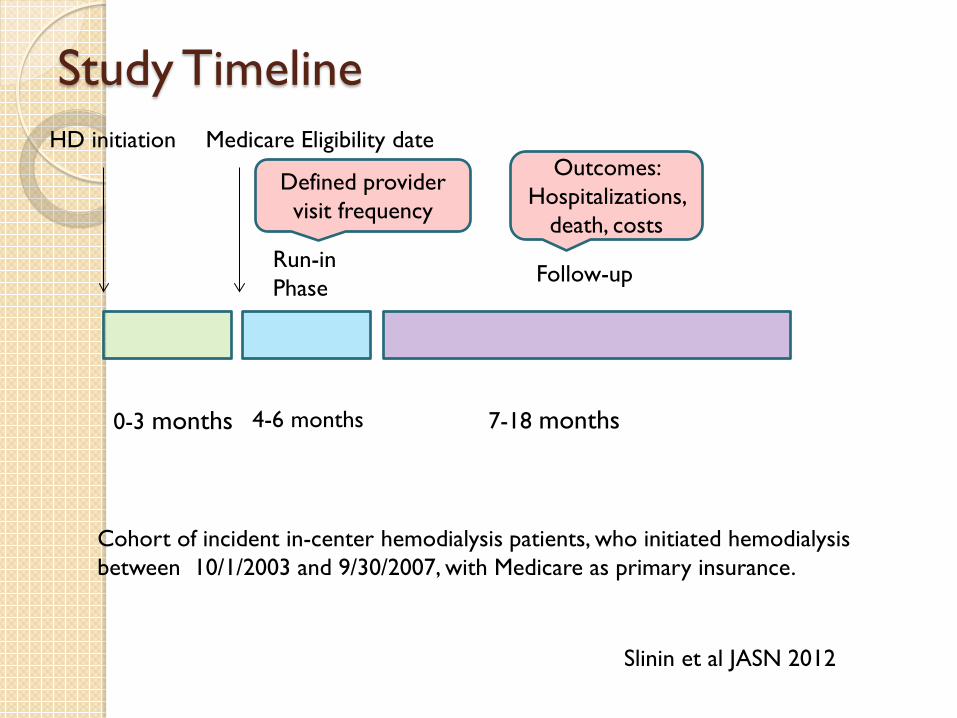
Study Timeline
0-3 months 4-6 months 7-18 months
Run-in Phase Follow-up
HD initiation Medicare Eligibility date
Defined provider visit frequency
Outcomes: Hospitalizations,
death, costs
Cohort of incident in-center hemodialysis patients, who initiated hemodialysis between 10/1/2003 and 9/30/2007, with Medicare as primary insurance.
Slinin et al JASN 2012
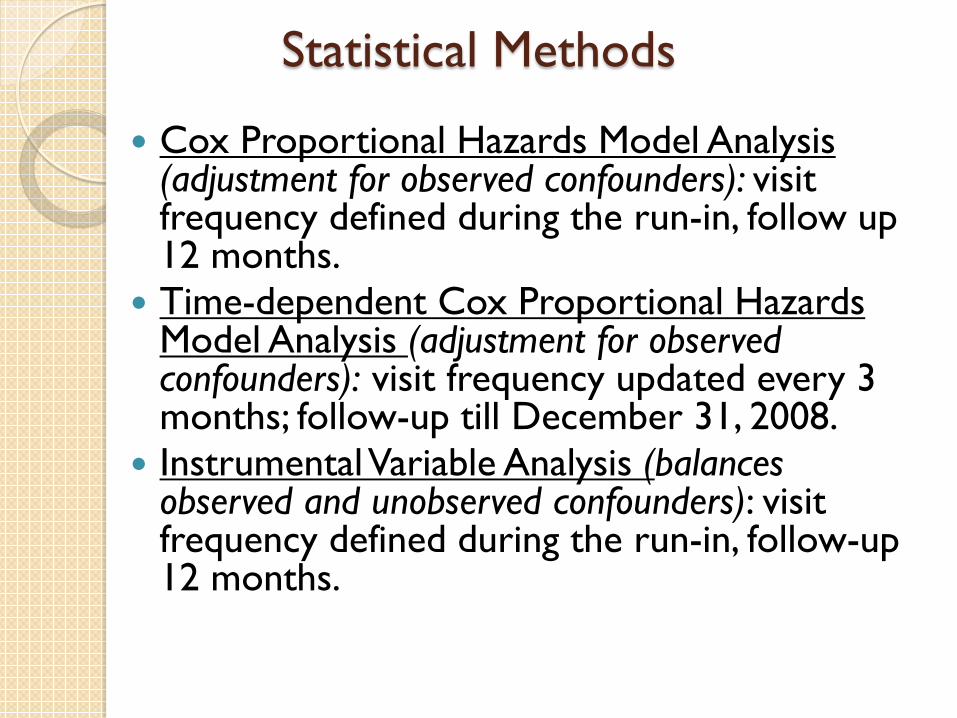
Statistical Methods
Cox Proportional Hazards Model Analysis (adjustment for observed confounders): visit frequency defined during the run-in, follow up 12 months.
Time-dependent Cox Proportional Hazards Model Analysis (adjustment for observed confounders): visit frequency updated every 3 months; follow-up till December 31, 2008.
Instrumental Variable Analysis (balances observed and unobserved confounders): visit frequency defined during the run-in, follow-up 12 months.
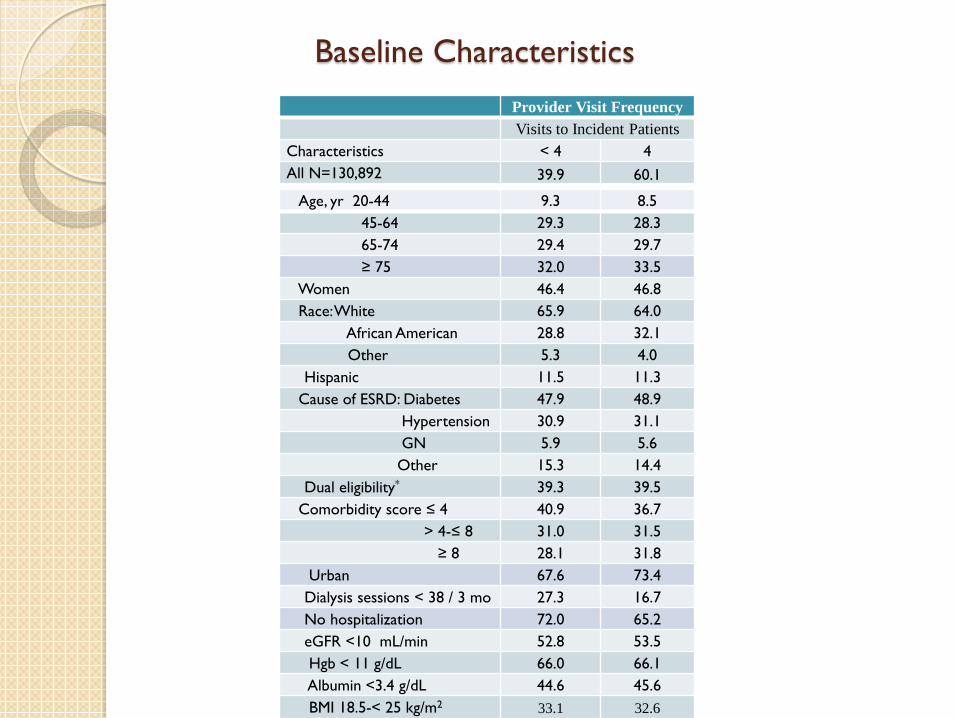
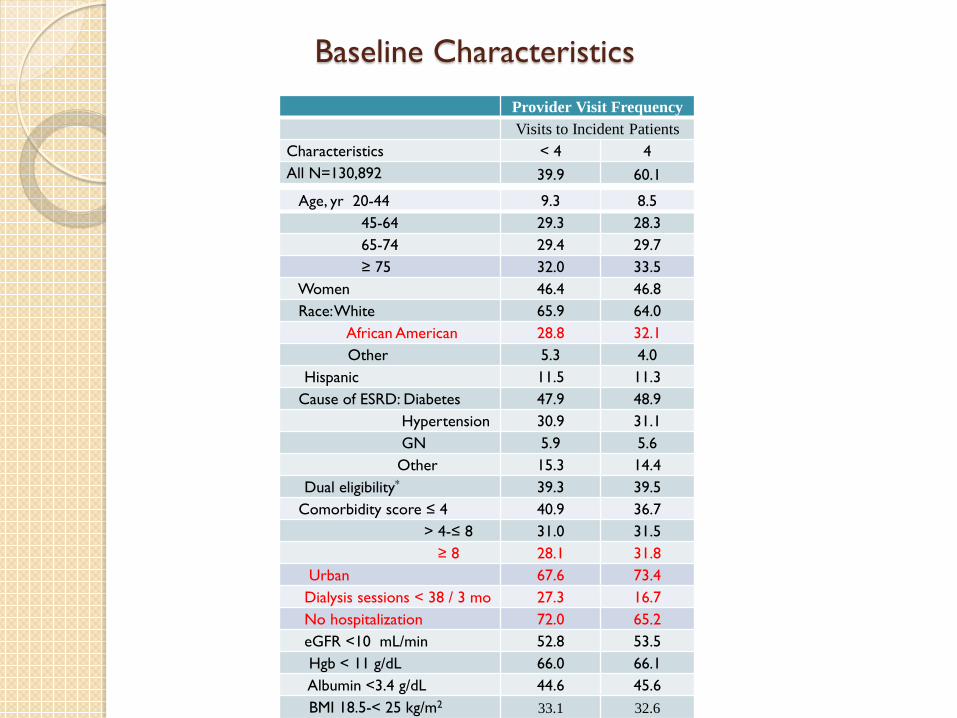
Baseline Characteristics
Provider Visit Frequency Visits to Incident Patients
Characteristics < 4 4 All N=130,892 39.9 60.1
Age, yr 20-44 9.3 8.5 45-64 29.3 28.3 65-74 29.4 29.7 ≥ 75 32.0 33.5
Women 46.4 46.8 Race: White 65.9 64.0 African American 28.8 32.1 Other 5.3 4.0
Hispanic 11.5 11.3 Cause of ESRD: Diabetes 47.9 48.9 Hypertension 30.9 31.1 GN 5.9 5.6 Other 15.3 14.4
Dual eligibility* 39.3 39.5 Comorbidity score ≤ 4 40.9 36.7 > 4-≤ 8 31.0 31.5 ≥ 8 28.1 31.8
Urban 67.6 73.4 Dialysis sessions < 38 / 3 mo 27.3 16.7 No hospitalization 72.0 65.2 eGFR <10 mL/min 52.8 53.5 Hgb < 11 g/dL 66.0 66.1 Albumin <3.4 g/dL 44.6 45.6 BMI 18.5-< 25 kg/m2 33.1 32.6
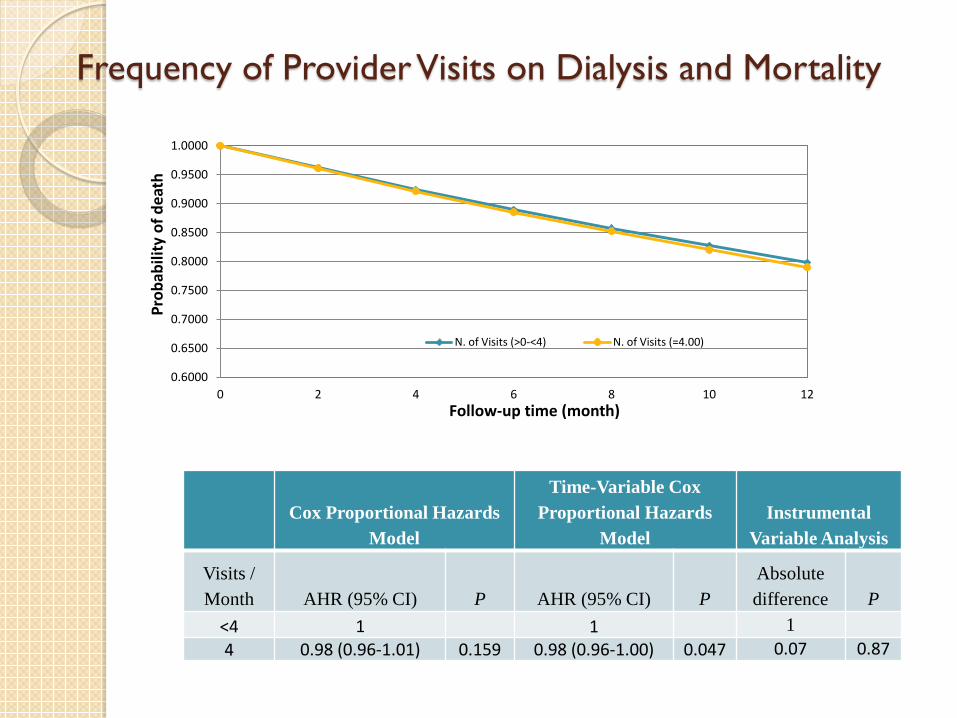
Frequency of Provider Visits on Dialysis and Mortality
Cox Proportional Hazards Model
Time-Variable Cox Proportional Hazards
Model Instrumental
Variable Analysis
Visits / Month AHR (95% CI) P AHR (95% CI) P
Absolute difference P
<4 1 1 1 4 0.98 (0.96-1.01) 0.159 0.98 (0.96-1.00) 0.047 0.07 0.87
0.6000
0.6500
0.7000
0.7500
0.8000
0.8500
0.9000
0.9500
1.0000
0 2 4 6 8 10 12
Prob
abili
ty o
f dea
th
Follow-up time (month)
N. of Visits (>0-<4) N. of Visits (=4.00)
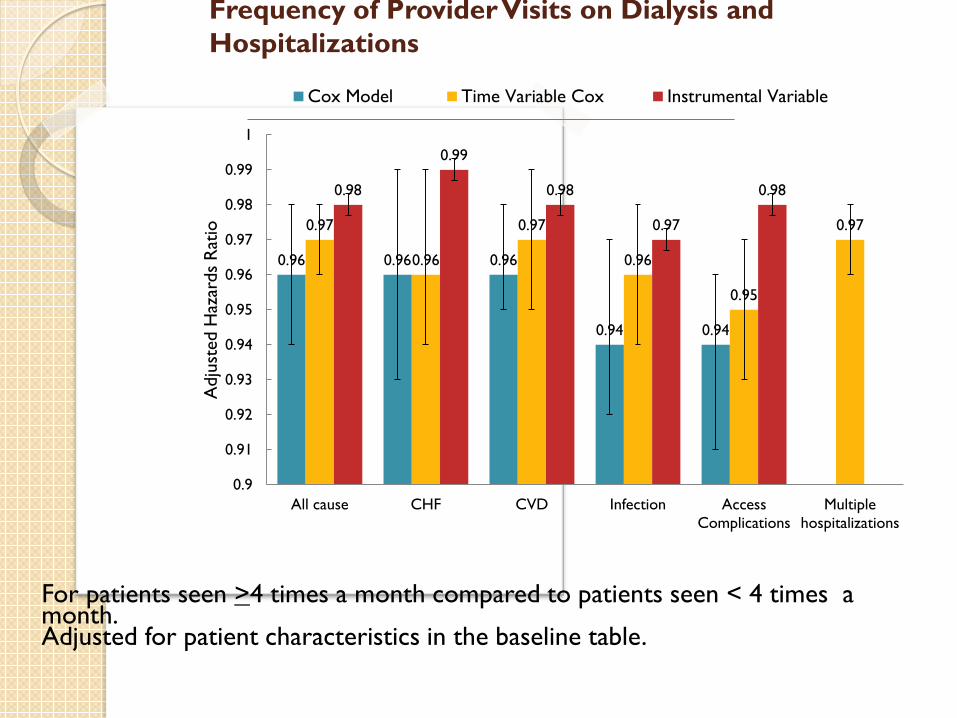
Frequency of Provider Visits on Dialysis and Hospitalizations
0.96 0.96 0.96
0.94 0.94
0.97
0.96
0.97
0.96
0.95
0.97
0.98
0.99
0.98
0.97
0.98
0.9
0.91
0.92
0.93
0.94
0.95
0.96
0.97
0.98
0.99
1
All cause CHF CVD Infection AccessComplications
Multiplehospitalizations
Adj
uste
d H
azar
ds R
atio
Cox Model Time Variable Cox Instrumental Variable
For patients seen >4 times a month compared to patients seen < 4 times a month. Adjusted for patient characteristics in the baseline table.
Conclusion In incident dialysis patients, greater provider
visit frequency on dialysis is not consistently associated with lower mortality.
Greater frequency of provider visits on dialysis (>4) is associated with small (1-6%) but significant relative decrease in the risk of first hospitalization, recurrent hospitalizations, and cause specific hospitalizations.
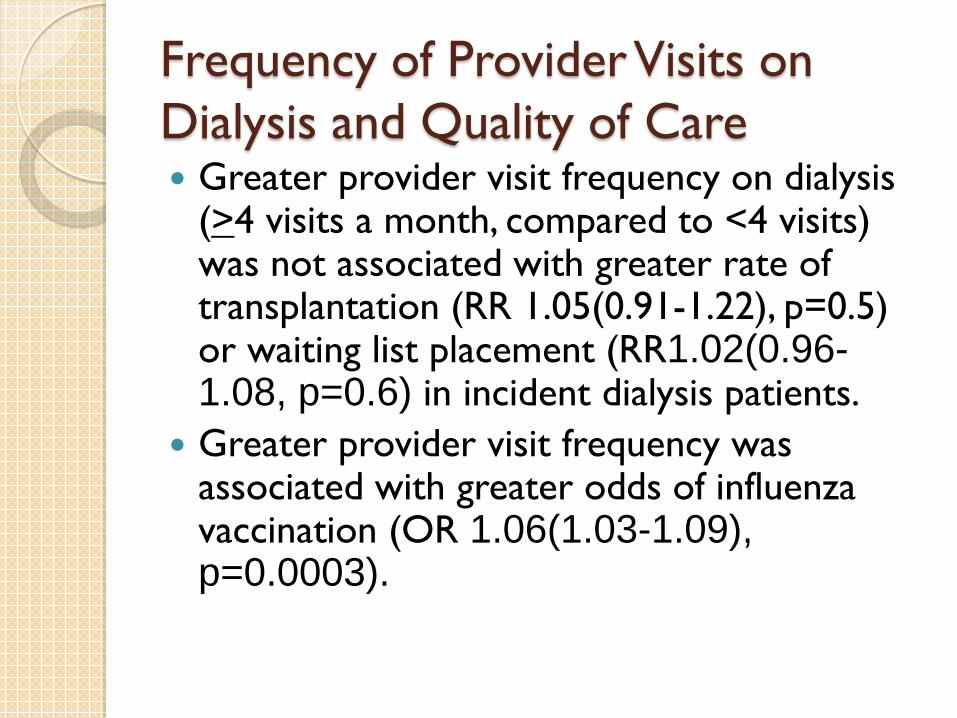
Frequency of Provider Visits on Dialysis and Quality of Care Greater provider visit frequency on dialysis
(>4 visits a month, compared to <4 visits) was not associated with greater rate of transplantation (RR 1.05(0.91-1.22), p=0.5) or waiting list placement (RR1.02(0.96-1.08, p=0.6) in incident dialysis patients.
Greater provider visit frequency was associated with greater odds of influenza vaccination (OR 1.06(1.03-1.09), p=0.0003).
Does Seeing Patients on Dialysis More Frequently Cost More?
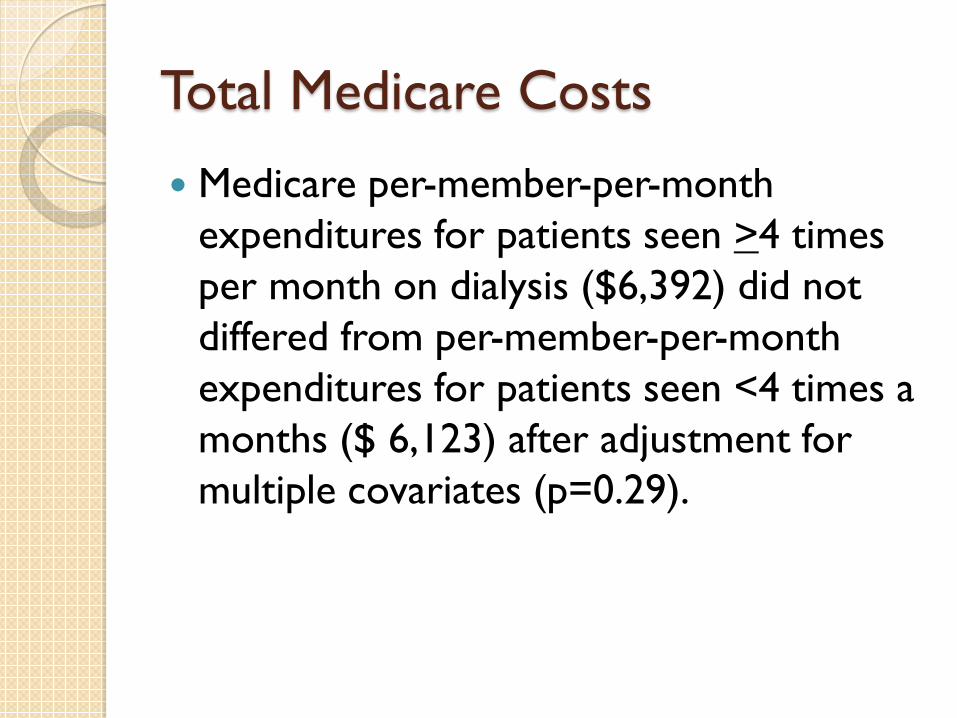
Total Medicare Costs
Medicare per-member-per-month expenditures for patients seen >4 times per month on dialysis ($6,392) did not differed from per-member-per-month expenditures for patients seen <4 times a months ($ 6,123) after adjustment for multiple covariates (p=0.29).
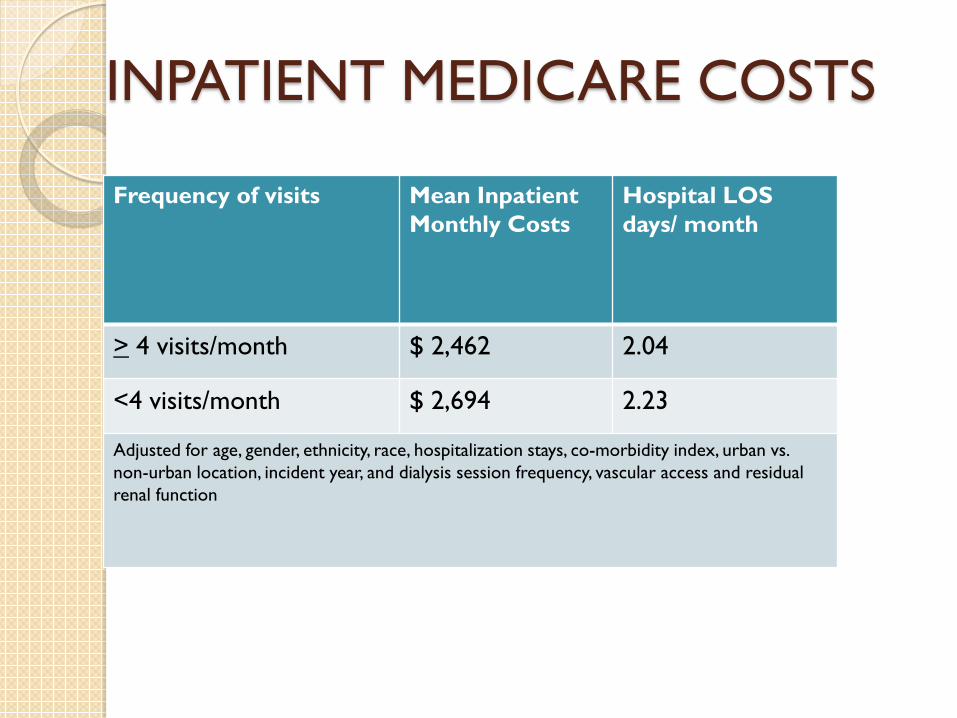
INPATIENT MEDICARE COSTS
Frequency of visits Mean Inpatient Monthly Costs
Hospital LOS days/ month
> 4 visits/month $ 2,462 2.04
<4 visits/month $ 2,694 2.23
Adjusted for age, gender, ethnicity, race, hospitalization stays, co-morbidity index, urban vs. non-urban location, incident year, and dialysis session frequency, vascular access and residual renal function
Conclusion No significant difference in total expenditures. Four or more visits a month were associated
with higher provider reimbursement balanced by lower inpatient costs: $230/month savings ($2800/yr) on inpatient costs and LOS reduction of 0.22 hospital days/ month (2.3 days/yr).

Conclusion
Greater provider visit frequency on dialysis is not consistently associated with lower mortality, but is associated with fewer hospitalizations.
Greater provider visit frequency on dialysis results in greater Medicare payments to providers (win ) and lowers inpatient costs (win ), and is cost neutral overall.
In the future, policy changes should be implemented in a stepwise fashion to allow for comparative research prior to widespread implementation.