frequency-dependent properties of neurons and synapses in
TRANSCRIPT
Frequency-dependent properties of neurons and
synapses in an oscillatory network
by Hua-an Tseng
A Dissertation submitted to the
Graduate School-Newark
Rutgers, The State University of New Jersey
in partial fulfillment of the requirements
for the degree of
Doctor of Philosophy
Graduate program in Biology
written under the direction of
Professor Farzan Nadim
and approved by
Newark, New Jersey
October, 2011

ii
Abstract of the Dissertation
Frequency-dependent properties of neurons and
synapses in an oscillatory network
by Hua-an Tseng
Dissertation Director:
Dr. Farzan Nadim
The oscillatory activities from neural networks are involved in many
behaviors, and animals need to be able to control the frequencies of these
activities to respond to the environmental challenges. Neurons in many systems
have frequency-dependent properties and preferred frequencies (also known as
resonance). We hypothesize that the activity frequency of an oscillatory network
is determined by the preferred frequencies of the neurons and of the synapses in
the network. We examined this hypothesis by investigating the frequency-
dependent properties of the neurons and of the synapses in the pyloric network
in the crab Cancer borealis. We also examined what factors affect the preferred
frequencies and how changing in these factors influence the frequency of the
network activity.
We first showed that the preferred frequency of neurons could be
measured with the voltage-clamp technique. Measuring the preferred frequency
with the voltage-clamp technique allowed us to have a full control of the voltage

iii
range and the waveform of the oscillation. By shifting the voltage range of the
oscillation, we found that the pacemaker PD neuron has a higher preferred
frequency when it is oscillating at a higher voltage range, and the preferred
frequency of the follower LP neuron is only affected by the upper bound of the
oscillation. The PD neuron also has different preferred frequencies when
oscillating with different waveforms. Specifically, one waveform parameter, the
75 - 100% rising slope, showed a negative correlation with the preferred
frequency.
After knowing that the voltage range and the waveform of the oscillation
are correlated with the preferred frequency, we used dynamic clamp to alter the
voltage range and the waveform of the PD oscillation during the ongoing activity
and measured the pyloric frequency. Based on our hypothesis, we expected the
voltage range and the waveform would have similar effects on the pyloric
frequency as they do on the preferred frequency. Indeed, our result showed that
the shifts in the pyloric frequency during the dynamic clamp experiments could
be explained by the changes in the voltage range and in the waveform
parameters.
Finally, we examined the frequency-dependencies of the amplitude and
the phase of the synaptic current. The amplitudes of the synaptic currents
between the AB/PD and LP neuron showed preferred frequencies. Interestingly,
the preferred frequencies of the synapses were significantly lower than those of
the presynaptic neurons and also than the pyloric frequency. While the voltage

iv
range of the presynaptic PD oscillation did not affect the preferred frequency of
the AB/PD to LP synapse, the preferred frequency of the LP to PD synapse was
higher when the upper bound, but not the lower bound, of the LP oscillation was
increased. Moreover, the strength of the synaptic resonance depended on the
upper bound of the presynaptic oscillation. To produce the strongest resonance,
the upper bound of the presynaptic oscillation needs to be within the voltage
range at which the synapse is most sensitive to the presynaptic membrane
potential. In addition to the amplitude, the phase of the synapses also showed
frequency-dependence. At low frequencies (< 1 Hz), the synaptic current reached
its peak before the presynaptic membrane potential did, and this phase
relationship reversed at high frequencies (> 1 Hz).
Overall, in this study, we demonstrated that many properties of the
neurons and synapses depend on the frequency of the oscillation and have
preferred frequencies. Moreover, these preferred frequencies can be regulated
by many factors, including the voltage range and the waveform of the oscillation.
Because some of these frequency-dependent properties are able to influence the
network frequency, the factors affecting their preferred frequencies could change
the network frequency in the same way. As a result, the frequency of an
oscillatory network is not determined by a single factor, but by the dynamic
interactions among the frequency-dependent properties of the network
components.

v
Acknowledgements
First, I would like to thank my advisor Dr. Farzan Nadim for his inspiration
and guidance. He taught me much of my scientific knowledge, many experiment
skills and most importantly his critical approach to research. Everything I learned
from him throughout my PhD years helped me a lot.
I would also like to thank my thesis committee, Drs. Jorge Golowasch,
Amitabha Bose and Dirk Bucher, for their advice and suggestions on my thesis.
Thanks to everyone in the Nadim lab and in the Golowasch lab. We had
such a good time working together.
Finally, I would like to thank my parents and my sister for their love. All my
accomplishments would never be possible without their endless support.
vi
Table of contents
Abstract .............................................................................................................. ii
Acknowledgements ............................................................................................ v
Table of contents ............................................................................................... vi
List of figures ...................................................................................................... x
Chapter 1: General introduction
...................................................................................................................... 1
The stomatogastric nervous system .............................................................. 2
The pyloric network and its tri-phase activity ................................................. 3
Ion channels in neurons of the pyloric network ............................................. 6
Neurotransmitter release in the pyloric network ............................................ 7
Neuromodulations in the pyloric network ...................................................... 8
Frequency-dependent properties in neuron .................................................. 9
Short-term dynamics of synapses ............................................................... 11
Frequency-dependent properties in synapse .............................................. 12

vii
Frequency-dependent properties of neuron and synapse determine the
frequency of network activity ....................................................................... 13
Chapter 2: Materials and methods
Preparation .................................................................................................. 16
Impedance amplitude profile (ZAP) function ............................................... 17
Software ...................................................................................................... 18
Chapter 3: Voltage range of oscillations affects the preferred frequency of an
oscillatory neuron
Introduction ................................................................................................. 19
Materials and methods ................................................................................ 21
Results ........................................................................................................ 22
Discussion ................................................................................................... 28
Chapter 4: Correlations between the waveform parameters and the preferred
frequency of an oscillatory neuron
viii
Introduction ................................................................................................. 39
Materials and methods ................................................................................ 40
Results ........................................................................................................ 42
Discussion ................................................................................................... 45
Chapter 5: The changes in voltage range and in waveform have similar effects on
the preferred frequency of pacemaker PD neurons and the network frequency
Introduction ................................................................................................. 55
Materials and methods ................................................................................ 56
Results ........................................................................................................ 58
Discussion ................................................................................................... 62
Chapter 6: Frequency-dependence of the action potential phase
Introduction ................................................................................................. 70
Materials and methods ................................................................................ 71
Results ........................................................................................................ 71
Discussion ................................................................................................... 72

ix
Chapter 7: The frequency-dependence of the IPSC amplitude
Introduction ................................................................................................. 75
Materials and methods ................................................................................ 77
Results ........................................................................................................ 80
Discussion ................................................................................................... 86
Chapter 8: Frequency-dependence of the IPSC phase
Introduction ............................................................................................... 105
Materials and methods .............................................................................. 106
Results ...................................................................................................... 107
Discussion ................................................................................................. 109
Chapter 9: Discussion .................................................................................... 117
Chapter 10: Future directions ......................................................................... 122
Reference ....................................................................................................... 125
Curriculum vitae .............................................................................................. 131
x
List of figures
Chapter 3: Voltage range of oscillations affects the preferred frequency of an
oscillatory neuron
Figure 3.1 Frequency-dependent impedance profile ................................... 34
Figure 3.2 Preferred frequency measurements in the current clamp and the
voltage clamp .............................................................................................. 35
Figure 3.3 Preferred frequency of the PD neuron increases with the voltage
range of oscillation ...................................................................................... 36
Figure 3.4 Preferred frequency of the LP neuron increases with the upper
bound of the oscillation only ........................................................................ 38
Chapter 4: Correlations between the waveform parameters and the preferred
frequency of an oscillatory neuron
Figure 4.1 Realistic waveforms of the PD neuron ....................................... 49
Figure 4.2 Preferred frequencies of PD neurons with realistic waveforms
.................................................................................................................... 50
xi
Figure 4.3 Correlations between the normalized preferred frequencies
(Normalized fmax) of the PD neurons and the waveform parameters ........... 52
Figure 4.4 Preferred frequencies of LP neurons with realistic waveforms
.................................................................................................................... 54
Chapter 5: The changes in voltage range and in waveform have similar effects on
the preferred frequency of pacemaker PD neurons and the network frequency
Figure 5.1 Dynamic clamp experiment setup .............................................. 65
Figure 5.2 Low-threshold dynamic clamp current ........................................ 66
Figure 5.3 High-threshold dynamic clamp current ....................................... 67
Figure 5.4 Waveform parameters during the dynamic clamp current injection
.................................................................................................................... 69
Chapter 6: Frequency-dependence of the action potential phase
Figure 6.1 Action potentials during an oscillation ........................................ 73
Figure 6.2 The phases of the action potential show more delay as the
frequency increases .................................................................................... 74
xii
Chapter 7: The frequency-dependence of the IPSC amplitude
Figure 7.1 Frequency-dependent profile of IPSC amplitude........................ 94
Figure 7.2 Preferred frequency of the AB/PD to LP synapse was not affected
by the presynaptic PD voltage range .......................................................... 96
Figure 7.3 Only the upper bound of the presynaptic LP oscillation affects the
preferred frequency of the LP to PD synapse ............................................. 98
Figure 7.4 Correlations between the preferred frequencies of the presynaptic
neurons and the synapses ........................................................................ 100
Figure 7.5 The strength of resonance depends on the upper bound of the
presynaptic oscillation ............................................................................... 101
Figure 7.6 Correlations between the voltage for maximal R and the half-
activation voltage of synapse .................................................................... 102
Figure 7.7 The upper bound of the LP slow-oscillation during the ongoing
pyloric activity reached the dynamic range of the synaptic current ........... 104
Chapter 8: Frequency-dependence of the IPSC phase
Figure 8.1 Frequency-dependent profile of the synaptic phase difference
.................................................................................................................. 113

xiii
Figure 8.2 The AB/PD to LP synaptic phase differences were affected by the
lower bound, but not the upper bound, of the presynaptic PD oscillation
.................................................................................................................. 114
Figure 8.3 The LP to PD synaptic phase differences were affected by the
upper bound, but not the lower bound, of the presynaptic LP oscillation
.................................................................................................................. 115
Figure 8.4 The synapses oscillating with realistic waveforms generate a wider
range of phase differences ........................................................................ 116
Chapter 9: Discussion
Figure 9.1 The interactions between the pyloric frequency, preferred
frequencies and properties of neurons and synapses ............................... 121
1
Chapter 1: General introduction
Many behaviors result from coordinated and rhythmic neural activities.
Some examples include the swimming in lamprey, heartbeat in leech, feeding in
crab and walking and breathing in vertebrate. Neural networks underlying these
rhythmic behaviors are known as central pattern generators (CPGs). The activity
of a CPG can arise from the intrinsic properties of neurons or from the synaptic
interactions between neurons in the network (Marder and Calabrese, 1996;
Marder and Bucher, 2001). In some CPGs rhythmic activities arise from synaptic
interactions which are usually inhibitory while in other CPGs, network activities
are driven by pacemaker neurons.
Because CPG activities are involved in many essential activities of the
animal’s day by day life, how CPGs generate rhythmic activity becomes an
important question. Additionally, the knowledge gained from studying an
anatomically simple CPG, such as the pyloric network used in this study, helps
us understand the connections between different levels of neuroscience, from the
intrinsic properties of neuron and synapse to the neural network activity. By
characterizing, identifying and finally modifying the underlying cellular and
synaptic mechanisms in a CPG, researchers can investigate how the properties
of the neurons and synapses affect the network activity, which provides a great
entry point for bringing different levels of neuroscience together and reveals the
big picture of neural networks.
2
A fundamental and important characteristic of an oscillatory activity is its
frequency. As CPGs are involved in many behaviors, the frequencies of their
activities have to be regulated. In particular, the CPG may need to maintain its
activity at a certain frequency or to change the frequency in response to various
environmental challenges. For example, animals can change their walking speed
as needed. Therefore, what factors determine the frequency of CPG activity
becomes an important question. In this thesis we hypothesize that the frequency-
dependent properties of the neurons and synapses in an oscillatory network
determine the frequency of the network activity. Based on this hypothesis, we
examined the neurons and synapses in the pyloric network of the stomatogastric
nervous system of the crab Cancer borealis to understand their frequency-
dependent properties and preferred frequencies, and to investigate how the
changes in these properties affect the frequency of network activity.
The stomatogastric nervous system
The stomatogastric nervous system (STNS), whose activity is responsible
for the feeding behaviors in crustacean, has become a well-studied model
system in the past years. The STNS is located on top of the foregut stomach and
includes four ganglia, including two commissural ganglia, one oesophageal
ganglion and one stomatogastric ganglion (STG). The commissural and the
oesophageal ganglia neurons project their axons to the STG via stomatogastric
nerve (stn) and their axonal terminals release neuromodulators required for the

3
STG to produce the rhythmic activities. We will refer to these as descending
(modulatory) projection neurons.
Located in the STG, there are two CPGs, the gastric mill network and the
pyloric network. The gastric mill activity is slow (around 0.1 Hz) and responsible
for chewing, while the pyloric activity is fast (around 1 Hz) and responsible for
filtering of chewed food. The pyloric network and the gastric mill network are not
independent from each other and interact both through local synapses and
through feedback to descending projection neurons (Bartos et al., 1999; Wood et
al., 2004).
As an experiment model system, STNS has many advantages. First,
STNS produces similar activities in vitro and in vivo, and the network activity lasts
for days in vitro. Second, each type of neuron can be easily identified by
comparing the intracellular recording with the corresponding extracellular
recording on the corresponded nerve. Third, the connections between neurons,
including gap junctions and chemical synapses, are well known. Finally, many
neuromodulators are present in and modify the outputs of the STNS and can be
used as tools to modify the properties of neurons and synapses to study how
these properties affect the network activity.
The pyloric network and its tri-phase activity
The pyloric network in crab is responsible for the filtering the chewed food
and its activity can be detected extracellularly on the motor nerves. There are 7
4
types of neurons, totaling around 11-13, in the pyloric network. These neurons
can be divided into two groups, the pacemaker group and the follower group. The
pacemaker group includes one anterior burster (AB) neuron and two pyloric
dilator (PD) neurons. The AB neuron has intrinsic oscillatory properties and,
under proper neuromodulation, is able to generate endogenous bursting
oscillations. The PD neurons do not typically generate oscillatory activity in
isolation but are strongly coupled to the AB neuron via gap junctions. As the
result of the strong electrical coupling, the AB and PD neurons become a
pacemaker kernel and produce bursting oscillation at the same phase (Marder
and Eisen, 1984b). The rhythmic bursting activity of the pacemaker kernel drives
the whole pyloric activity via inhibitory synapses, and the frequency of the
pacemaker bursting activity is the primary determinant of the frequency of the
network activity. In crab, the two lateral posterior gastric neurons (LPGs) show
rhythmic activity synchronized with the pyloric pacemakers and are sometimes
considered part of the pyloric network but will not be further discussed in this
thesis.
The follower lateral pyloric (LP) pyloric constrictor (PY), inferior cardiac (IC)
and ventral dilator (VD) neurons receive the inhibitory synapses from the
pacemaker neurons. Pyloric network contains one LP, VD and IC neuron and
three to five electrically coupled PY neurons. Without the synaptic input from the
pacemaker neurons, the follower neurons loss their bursting oscillatory activities
and become silent or fire tonically. Beside the synapses from the pacemaker
neurons, the LP and PY neurons also have a gap junction and reciprocal
5
inhibitory synapses between each other and therefore their bursting activities are
out of phase.
All chemical synapses within the pyloric network are inhibitory and can be
divided into two types based on the neurotransmitters they use: the dilator PD
and VD neurons have cholinergic synapses and all other pyloric neurons have
glutamatergic synapses (Marder and Eisen, 1984a). The pacemaker neurons
make chemical synapses to the follower neurons. Although both the AB and PD
neurons have synapses to the follower neurons, their synapses are quite
different in many ways. Besides using different neurotransmitters, they also show
different dynamics. The synapse from the AB to the LP neuron activates and
decays faster than those from the PD to the LP neuron (Rabbah and Nadim,
2007) and, in crab, the synapse from AB appears to be the major synapse
received by the LP neuron (Martinez, Golowasch and Nadim, unpublished). The
pacemaker group receives its sole chemical feedback from the follower neurons
through the LP to PD synapse, and the timing of the feedback can alter the cycle
frequency and also limit the variability of the pyloric frequency (Mamiya and
Nadim, 2004, 2005). Between the follower LP and PY neurons, there are also
synaptic connections; notably, these synapses are a combination of chemical
inhibitory synapses and electrical synapses which are rectifying in the LP to PY
direction (Mamiya et al., 2003a).
The pyloric network generates a tri-phase rhythmic activity. The AB/PD
neurons burst periodically and hyperpolarize the follower LP and PY neurons via
inhibitory synapses. The LP and PY neurons rebound at different phase due to
6
their different intrinsic properties (Rabbah and Nadim, 2005) and the inhibitory
synapse from the LP to PY neuron (Mamiya and Nadim, 2005). After the AB/PD
bursts, there is a short delay and then the LP neuron rebounds from the inhibition
and starts bursting, followed by the PY neurons. The strong inhibitory synapses
from the PY neurons to the LP neuron allows the bursting of PY neurons to end
the LP burst (Rabbah and Nadim, 2005). Finally, the AB/PD neurons begin to
burst again and terminate the PY burst. The tri-phase pattern repeats itself at the
frequency around 1 Hz. Besides the LP and PY neurons, the other follower
neurons in the pyloric network include the VD and IC neurons and are not
discussed in this thesis.
Ion channels in neurons of the pyloric network
Neurons in the pyloric network carry a wide range of voltage-gated ion
channels (Golowasch and Marder, 1992b), including transient potassium A-
current (IA), Ca2+-sensitive K+ channel (Ouyang et al., 2010) and
hyperpolarization-activated inward current (Ih) channel (Goeritz et al., 2011). The
conductance of different types of potassium channel can vary several folds
among individuals (Golowasch et al., 1999; Golowasch et al., 2002) and are not
independent from each other and from other channels. In PD neurons, the
expression of high-threshold potassium currents (IHTK), IA and Ih are correlated
with each other at the mRNA level (Schulz et al., 2007) and at the conductance
level (MacLean et al., 2005; Khorkova and Golowasch, 2007). Modeling results

7
show that similar neural activity can arise from different relative levels of ion
channel compositions (Goldman et al., 2001).
The interactions and dynamics of these voltage-gated ion channels are
important in determining the activity of each neuron. For example, an increase in
the A-current will delay the onset of the PY burst (Zhang et al., 2008). Therefore,
the bursting waveform of each neuron can be seen as representing the
combination of its ion channel composite and synaptic inputs it receives.
Neurotransmitter release in the pyloric network
Neurotransmitter release can be spike-mediated; when an action potential
reaches the axon terminal, it triggers the release of neurotransmitter. This type of
release is common in most synapses. In the stomatogastric nervous system as in
other invertebrate networks and the retina, there is another type of
neurotransmitter release, graded release (Raper, 1979; Graubard et al., 1980;
Johnson and Harris-Warrick, 1990). The synaptic terminal could release
neurotransmitter even without action potentials, and the amplitude of the release
depends on the presynaptic membrane potential. An activation curve of graded
release is usually constructed by plotting the amplitude of the postsynaptic
response to presynaptic voltage pulses of different amplitude.
8
Neuromodulation in the pyloric network
Neuromodulation has been reported in many CPG systems, including the
locomotion, respiratory system and the pyloric network (Christie et al., 1997;
Fenelon et al., 1999; Li et al., 2003; Dickinson, 2006; Harris-Warrick, 2011). The
neurons and synapses in the pyloric network are targets of neuromodulation
(Beltz et al., 1984; Hooper and Marder, 1984; Marder et al., 1986; Stein, 2009).
Many neuromodulators are released in the STG by descending projection
neurons of the commissural and oesophageal ganglia. These neuromodulators
are required for the pyloric network to generate proper rhythmic activity; blocking
the of action potential in the stn by either applying TTX or transecting the nerve
causes the removal of neuromodulator release and the pyloric network stops
producing rhythmic activity. Besides for maintaining the rhythmic activity, a recent
study shows that neuromodulators are also involved in controlling correlations
between ionic current expression in pyloric neurons (Khorkova and Golowasch,
2007).
At network level, the neuromodulators can alter the network activity during
bath application. For example, serotonin, pilocarpine and proctolin are able to
increase the frequency of the activity when bath-applied (Marder and Eisen,
1984b; Hooper and Marder, 1987). At the cellular level, one of the best known
features of many neuromodulators in the STG, in particular the peptidergic
modulators, is their ability to induce a specific voltage-dependent inward current
(Swensen and Marder, 2000), which was first identified in response to proctolin
(Golowasch and Marder, 1992a). Besides activating the modulatory inward
9
current, the neuromodulators can also regulate other intrinsic properties of pyloric
neurons. For example, dopamine increases Ih in the AB, PY and VD neurons
(Peck et al., 2006). Finally, in some cases, the neuromodulators also alter the
synaptic properties. The peptide proctolin increases the amplitude of the LP to
PD synapse and also modifies its short-term dynamics (Zhao et al, 2011 in
review). Overall, the neuromodulators play important roles in regulating the
pyloric activity.
Frequency-dependent properties in neuron
Neurons in many systems show frequency-dependence in impedance
measurements (Hutcheon and Yarom, 2000). The traditional way to measure the
impedance during the oscillation is using the impedance amplitude profile (ZAP)
waveform, a sweeping-frequency sinusoidal function whose oscillatory amplitude
is fixed but whose frequency increases with time. The neuron is usually injected
with a ZAP current in current clamp and the membrane impedance is calculated
as a ratio of membrane potential to injected current as a function of frequency. In
some neurons, the impedance first increases and then decreases as the
frequency of neural subthreshold oscillation increases. This type of impedance
profile is called resonance and such a neuron has highest impedance when it is
oscillating at a unique frequency. We refer to this frequency as the preferred
(resonant) frequency. Resonance is observed in many neurons in a variety of
neural systems (Hutcheon et al., 1996a, b; Fisher et al., 2011; van Brederode
10
and Berger, 2011), including the pacemaker neurons in the pyloric network of
crab Cancer borealis (Tohidi and Nadim, 2009).
The preferred frequency results from the interactions between passive
membrane properties and voltage-gated ion channels (Hutcheon and Yarom,
2000). The passive membrane has capacitive properties. When oscillatory
current is injected into the neuron at high frequency, the current charges and
discharges the membrane capacitor without much affecting the membrane
potential. Therefore, the membrane potential only changes when the current is
injected at low frequencies and the cellular membrane acts as a low-pass filter.
On the other hand, the voltage-gated ion channels, specifically those with large
time constants and reversal potentials around the resting membrane potential,
can act as high-pass filters. During low-frequency oscillations, these channels
activate and counter the change in the membrane potential when the potential
slowly drifts away from the resting potential. However, when the neuron is
oscillating at high frequency, these channels fail to activate due to their large time
constant. Therefore, these channels diminish the change in membrane potential
only at low frequencies and act as high-pass filter. Examples of this type of
voltage-gated channels include Ca2+ channel (Tohidi and Nadim, 2009), Ca2+-
sensitive K+ channel (Fisher et al., 2011) and hyperpolarization-activated inward
current channel (Orio et al., 2009; Tohidi and Nadim, 2009; Zemankovics et al.,
2010). The combination of cellular membrane and voltage-gated ion channels
with properties mentioned above is sufficient to generate resonance. Finally,
some voltage-gated ion channels, such as persistent Na+ channel, can act as an

11
amplifier for resonance (D'Angelo et al., 2001). These channels have short time
constants and reversal potentials away from the resting membrane potential.
They activate when the oscillation reaches its peak and enhance the amplitude of
the oscillation (Hutcheon and Yarom, 2000).
Many studies have shown correlations between the preferred frequency of
a neuron in the network and the frequency of network activity. In the rat
cerebellum, granule cells have resonant frequency around the theta-frequency
(3-12 Hz) (D'Angelo et al., 2001). In the pyloric network, the preferred frequency
of the pacemaker PD neuron is correlated with the frequency of pyloric activity
(~1 Hz) (Tohidi and Nadim, 2009). These findings imply that the preferred
frequency of the neurons in a network could be a good predictor for the network
frequency.
Short-term dynamics of synapses
With repetitive depolarizing presynaptic pulses, the amplitude of synaptic
output can show short-term dynamics and either increase (facilitation) or
decrease (depression). Short-term dynamics are a common feature of synapses
in both vertebrate and invertebrate nervous systems (Nadim and Manor, 2000;
Rabbah and Nadim, 2005; Connelly et al., 2010; Doussau et al., 2010;
Kandaswamy et al., 2010) and play important roles in determining network
activity (Connelly et al., 2010). In a simple oscillator-follower model network,
short-term depression of the synapse from the oscillator to the follower neuron

12
acts to promote phase maintenance in response to changes in network
frequency (Manor et al., 2003). Also, short-term depression of synapses enables
an oscillatory network to have bistable states, which is a possible mechanism for
prolonged effects of neuromodulators (Nadim et al., 1999; Manor and Nadim,
2001). The degree of facilitation or depression usually depends on the frequency
of repetitive stimulation (Connelly et al., 2010; Kandaswamy et al., 2010).
In the stomatogastric nervous system, graded synapses are known to
show depression (Mamiya and Nadim, 2005). Individual synapses, even those
from the same presynaptic neuron, can have different dynamics of short-term
depression, which could be important for producing proper network activity
(Mamiya and Nadim, 2005). Many factors, including the neuromodulation and
presynaptic waveform, can modify the short-term depression of the synapses
(Rabbah and Nadim, 2007). Finally, while short-term depression of graded
synapses is found in many synapses in the pyloric network, facilitation has only
been reported in the graded synapse from the LP to PD neuron with low-
amplitude presynaptic depolarization pulses in the presence of proctolin (Zhou et
al., 2007).
Frequency-dependent properties in synapses
Short-term synaptic dynamics provide possible mechanisms to generate
frequency-dependent responses in the amplitude of synaptic output in an
oscillatory network. As the frequency of presynaptic oscillation increases, the

13
amplitude of synaptic output can either increase or decrease due to facilitation or
depression, respectively. More interestingly, resonance in synaptic amplitude can
occur if the synapse shows facilitation during low-frequency oscillation and
depression during high-frequency oscillation. As a result, the synapse generates
a larger output when the presynaptic neuron is oscillating at the preferred
frequency.
Another possible frequency-dependent property is the phase of the
synaptic current in the oscillatory cycle. In an oscillatory network, the phase of
synapses can affect the properties of network oscillations. For example, in pyloric
network, the synapses from the LP to PD neuron can shorten or extend the
pyloric period depending on the phase of the synaptic input (Prinz et al., 2003;
Mamiya and Nadim, 2004, 2005). The pyloric frequency is influenced by this
synaptic phase, and if this synaptic phase has the frequency-dependence, then
there will be a two-way interaction between the pyloric frequency and the
synaptic phase, instead of simply one determines the other.
Frequency-dependent properties of neuron and synapse determine the
frequency of network activity
In this thesis, we are interested in factors that determine the frequency of
CPG activity. We hypothesize that the frequency-dependent properties of the
neurons and synapses in an oscillatory network determine the frequency of the
network activity. To examine this hypothesis, we designed a series of

14
experiments using the pyloric network of the crab Cancer borealis as our model
system. Among the neurons in the pyloric network, we focus on the PD neuron,
which is part of the pacemaker group, and the LP neuron, which is a follower
neuron with the sole chemical feedback synapse to the pacemaker group. Our
study requires a precise control of membrane potential and waveform, which is
not possible if we measure the resonance with current-clamp technique. Instead,
we use voltage-clamp to generate the oscillation with the designed voltage range
in (presynaptic) neurons and measure the cellular and synaptic preferred
frequencies.
In general, the preferred frequencies of neurons increase with higher
oscillatory voltage range and, in PD neuron, is correlated with the top 25% slope
of oscillatory waveforms. When a current is injected into the pacemaker PD
neuron with dynamic clamp to modify its voltage range and waveform, the
network frequency will shift in the same direction as the preferred frequency of
the neuron predicted by the knowledge of the voltage range and waveform. The
synapses between the pacemaker neurons and follower LP neuron show
resonance and preferred frequencies. Interestingly, the preferred frequency of
the synapses is lower than that of the neurons and is also lower than the network
frequency. Among the synaptic properties, the synaptic preferred frequency from
the pacemaker neurons to the follower LP neuron is not affected by the voltage
range of the presynaptic oscillation; on the other hand, the one from the LP
neuron to the PD neuron moves to a higher value as the upper bound of the LP
oscillation increases. The phase of synaptic current also shifts with the
15
presynaptic frequency. At low frequency, the peak of synaptic current occurs
before the peak of presynaptic voltage (negative phase), but at high frequency,
the peak of synaptic current lags behind the peak of presynaptic voltage (positive
phase). In conclusion, the network frequency affects many properties of neurons
and synapses, and these properties, in turn, have feedback on the network
frequency. Therefore, the network frequency is determined by a recurrent map of
dynamic interactions between the frequency itself and frequency-dependent
properties.
16
Chapter 2: Materials and methods
This chapter elaborates the general materials and methods used during
the course of the dissertation. The specific methods for different chapters are in
the corresponding chapters.
Preparation
Adult male crabs Cancer borealis were purchased from the local seafood
supermarkets and kept in tanks filled with artificial sea water at ~12°C until use.
Before dissection, crabs were put on ice for 20-30 minutes to anesthetize them.
The dissection was done using the standard protocol as described in (Tohidi and
Nadim, 2009). After dissection, the nervous system, including the commissural
ganglia, the esophageal ganglion, the stomatogastric ganglion (STG), the nerves
connecting these ganglia and the motor nerves were pinned down in a 100 mm
Petri dish coated with the silicon elastomer Sylgard (Dow Corning). The STG was
then desheathed to expose the neurons for impalement. During the experiment,
the whole dish was superfused with normal crab saline (11 mM KCl, 440 mM
NaCl, 13 mMCaCl2∙2H2O, 26 mM MgCl2∙6H2O, 11.2 mM Trizma base, 5.1 mM
maleic acid; pH 7.4) and maintained at 10 - 14°C. The PD and LP neurons were
identified by matching their intracellular activity with the extracellular action
potentials on the corresponding motor nerves.
17
The electrodes were prepared by using the Flaming–Brown micropipette
puller (P97; Sutter Instrument) and filled with 0.6 M K2SO4 and 0.02 M KCl. For
current injection, the resistance of the electrode was kept at 10 – 20 MΩ; for
membrane potential measurements, the resistance of the electrode was 20 – 35
MΩ. Extracellular recording from the motor nerves was done using a differential
AC amplifier model 1700 (A-M Systems) and intracellular recording was done
with Axoclamp 2B amplifiers (Molecular Devices).
Impedance amplitude profile (ZAP) function
The ZAP function was calculated as follows:
where A is the amplitude of the oscillation and f(t) is a monotonically increasing
function that determines the range of the sweeping frequencies (in Hz) and is
defined as:
where Fmax and Fmin were the maximum and minimum sweeping frequencies,
respectively; dur is the duration of the sweep; and L is the rate of the exponential
rise in frequency (the exponential rise in frequency is used so that lower
frequencies are sampled sufficiently). Because time was measured in
18
milliseconds, the scaling factor 10-3 was used to convert the frequency units to
Hz. All experiments were done with Fmin = 0.1 Hz, Fmax = 4 Hz, and dur = 100
seconds. To avoid transients at the beginning of the oscillations, the ZAP
waveform was preceded with three cycles of a sinusoidal waveform injected at
the lowest frequency Fmin, which transitioned smoothly into the ZAP function,
bringing the total duration of each sweep to 130 seconds. The first sinusoidal
waveform was phase-shifted to start at its minimum value.
Software
Data were recorded with pClamp (vesion 9.2) and Scope (version 7.75)
softwares. Dynamic clamp experiments were performed with Dynamic Clamp
software (version 1.55). Analysis was done with Readscope and Matlab. Scope,
Dynamic Clamp and Readscope were developed in the lab of Dr. Farzan Nadim
and are available for download at http://stg.rutgers.edu/software.
19
Chapter 3: Voltage range of oscillations affects the preferred
frequency of an oscillatory neuron
Introduction
Membrane resonance in neurons results from interactions between the
passive membrane properties and voltage-gated ionic currents. Two voltage-
gated currents, the hyperpolarization-activated inward current and Ca2+-sensitive
K+ current, are commonly involved in resonance and their expression have been
reported in the pyloric neurons (Ouyang et al., 2010; Goeritz et al., 2011). Indeed,
removal of the Ih or the Ca2+-sensitive K+ channel reduces the resonance in the
AB and PD neurons in the pyloric network (Tohidi and Nadim, 2009). Ih activates
when the neuron is hyperpolarized to -80 mV and has reversal potential around -
30 mV. Analyzing the neural response to the ZAP current injection shows that Ih
is responsible for the lower envelope of the oscillating membrane potential and
IK(Ca) shapes the upper envelope (Tohidi and Nadim, 2009). The activation and
inactivation of the voltage-gated ion channels depend on the membrane potential;
when the neuron is oscillating at different voltage ranges, the compositions of
activated voltage-gated ion channels may vary, resulting in different frequency-
dependent response profiles. Therefore, it is interesting to see if there is a
change in the preferred frequency of the neuron with different voltage ranges of
oscillation. In an oscillatory network, slow-oscillations of neurons can be
extracted from the bursting activity by removing the action potentials with a low-
20
pass filter. The voltage range of the oscillation can then be measured from the
slow-oscillation. Under natural conditions, the voltage range of the oscillating
neurons in the pyloric network can be regulated by many factors, including
synaptic inputs and neuromodulation. For example, follower neurons receive
inhibitory synapses from the pacemaker AB/PD neurons; with stronger synaptic
inhibition, the lower bounds of the voltage range of follower neurons will be
pushed to a more hyperpolarized level. The feedback chemical synapse received
by the pacemaker PD neurons from the follower LP neuron can similarly
determine the lower bound of the PD neuron voltage range. Neuromodulators
can also influence the voltage range of the oscillation by modifying the intrinsic
properties of neurons and by altering the strength or dynamics of synapses.
We used voltage-clamp to generate a ZAP oscillation (0.1 to 4 Hz) of sine
wave in the PD and LP neurons of the pyloric network, and calculated their
frequency-dependent impendence profiles as well as their preferred frequencies
under different voltage ranges of oscillation. While increases in both the upper
bound and the lower bound of the voltage range resulted in higher preferred
frequency in the PD neuron, only the upper bound of the oscillation had a similar
effect on the preferred frequency of the LP neuron. The results suggest that 1)
the composition and the dynamics of voltage-gated ion channel might be different
in the PD and LP neuron, and 2) the preferred frequency can be modulated by
altering the voltage range of the oscillatory neuron.
21
Materials and methods
Impedance measurement
To measure the impedance of the PD and LP neuron, after identifying the
neuron, we used 10-7 M TTX (tetrodotoxin, Biotium) to remove the
neuromodulatory inputs and, therefore, the endogenous oscillatory activity. Two
electrodes were inserted into the neuron; one used for current injection and the
other used for recording the membrane potential. In the current-clamp
experiments, the current injected was a ZAP function with the frequency
sweeping from 0.1 to 4 Hz. The amplitude of the injected current was adjusted to
produce a 30 mV difference in the membrane potential when the neuron was
oscillating at 0.1 Hz. To make the results comparable to those from the voltage-
clamp recordings, when necessary, we also injected a bias DC current to bring
the baseline membrane potential to -60 mV.
The voltage-clamp experiments were done in two-electrode voltage clamp
mode. In each sweep, the membrane potential was clamped first at a holding
value (equal to the minimum value of the ZAP function), followed by the ZAP
function. The voltage range of oscillation varied depending on the experiment.
The PD neuron produces bursting oscillations at a frequency of ~1 Hz with a
slow-wave profile that ranges approximately between -60 and -30 mV. We
therefore focused our study around these voltages and frequency ranges. In the
experiments in which the effect of the lower bound was examined, the lower
bound was shifted by ±10 mV (-70, -60 and -50 mV) while the upper bound was
22
kept at -30 mV. When examining the effect of the upper bound, this bound was
shifted by ±4 mV (-34, -30 and -26 mV) while the lower bound was kept at -60
mV. We limited the shift of the upper bound to ±4 mV, which resulted, on average,
in a shift of preferred frequency that was similar to that seen when the lower
bound was shifted by ±10 mV.
Calculation of impedance power and preferred frequency
The impedance profile was calculated with Matlab scripts. For each cycle
of recording, the script measured the frequency as well as the changes in voltage
and current. The impedance profile was generated by calculating the impedance
power (the ratio of voltage over current) as a function of frequency. During each
experiment, each oscillatory condition was repeated three times. The impedance
profiles from three repeated trials are then re-sampled and averaged together to
minimize any possible noise. The preferred frequency was defined as the
frequency at which the impedance power was maximal. In this thesis, we refer to
the impedance power as impedance.
Results
The pyloric network produces tri-phasic activity with frequency around 1
Hz. A previous study has shown that the pacemaker PD neuron shows
resonance in current-clamp and has preferred frequency close to the pyloric

23
frequency. Moreover, the preferred frequency of the PD neuron is also correlated
with the pyloric frequency (Tohidi and Nadim, 2009). To measure the frequency-
dependent impedance, we first removed the endogenous pyloric oscillation by
bath applying TTX. TTX blocks both action potential generation and
neuromodulator release, resulting in a silent pyloric network. Our experiment
required precise control of voltage ranges and waveforms; therefore, instead of
using current-clamp, we used voltage-clamp to generate ZAP oscillations of the
membrane potential in neurons and recorded the injected current simultaneously.
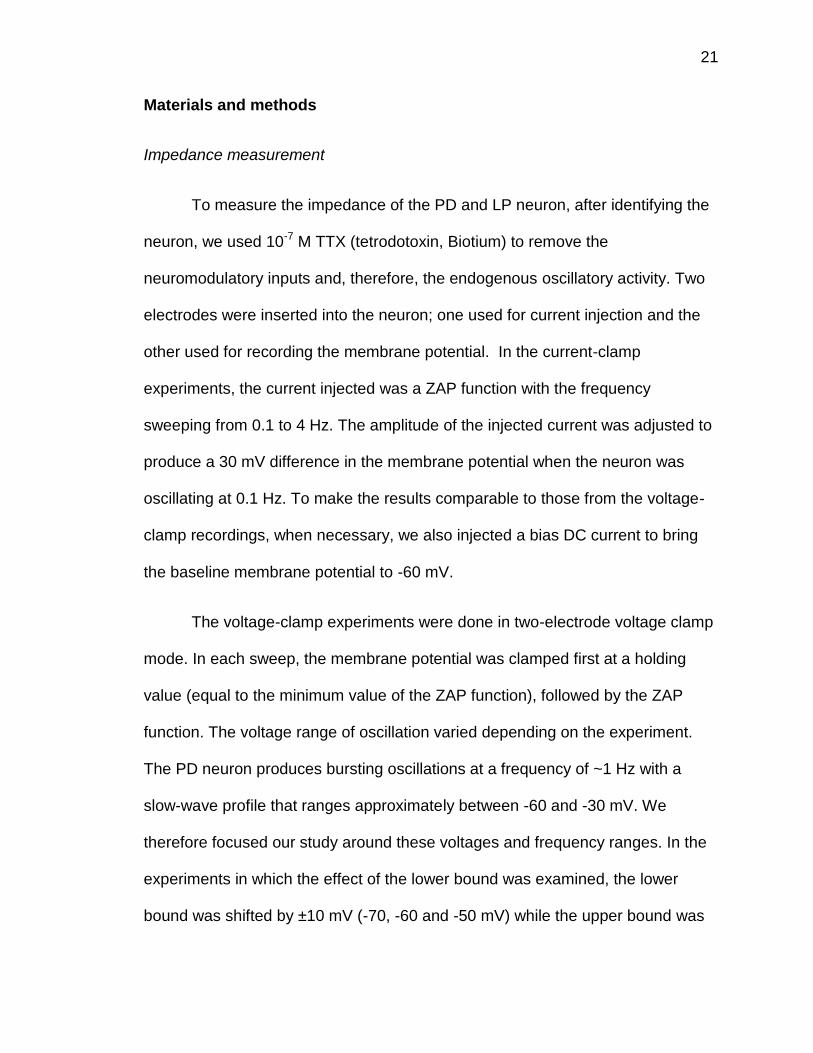
During the ZAP oscillation, the neuron was oscillating with the sine wave at a
fixed voltage range and continuously varying frequencies (figure 3.1A, upper
trace, voltage range: -60 to -30 mV, frequency: 0.1 to 4 Hz). The current required
for generating the oscillation with fixed voltage range varied with the frequency
(figure 3.1A, lower trace). The preferred frequency is the unique frequency at
which the neuron exhibits maximum impedance. When the voltage clamped
neuron was oscillating at the preferred frequency, the injected current was
minimal (figure 3.1A, arrow). The plot of the impedance against the frequency at
each oscillatory cycle showed that the impedance first increases and then
decreases (figure 3.1B), and that the maximum impedance occurred at the
preferred frequency (figure 3.1B, arrow).
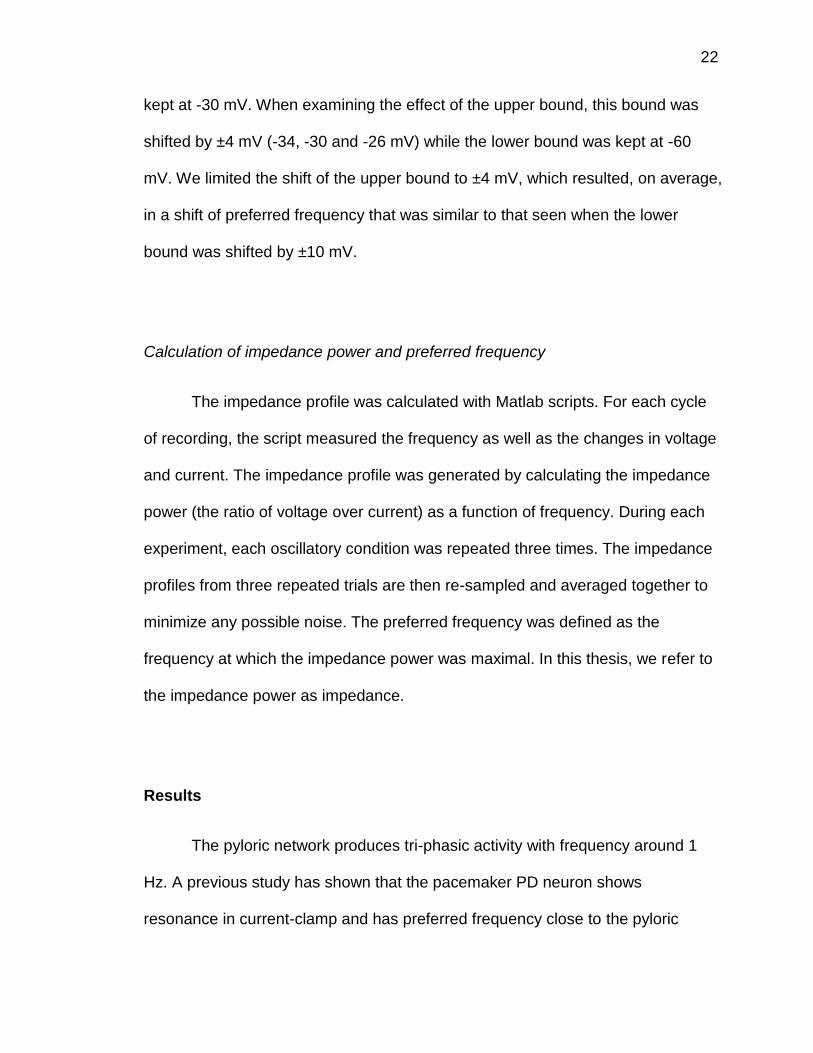
Traditionally, the frequency-dependent impedance profile is measured
with the current-clamp technique. We were interested to know if the
measurements we obtained with the voltage-clamp technique were comparable
with those obtained with the current-clamp technique. We adjusted the amplitude
24
of the current in the current-clamp experiments to produce the ZAP oscillation,
whose voltage range at 0.1 Hz matching the voltage range we used in the
voltage-clamp experiments (-60 to -30 mV). The frequency-dependent
impedance profile was produced in the same neuron with the voltage-clamp
technique (figure 3.2A) and with the current-clamp technique (figure 3.2B). The
measurement results from both techniques were similar and were not statistically
different (N = 7; voltage-clamp: 1.28±0.51 Hz, current-clamp: 1.36±0.38 Hz;
paired Student’s t-test, p = 0.742; figure 3.2C). In all following experiments, we
measured the preferred frequency with the voltage-clamp technique.
The activation and inactivation of voltage-gated ion channels depend on
the membrane potential, and the dynamics of these channels are required to
generate resonance. Therefore, the different voltage ranges of oscillation could
potentially produce different frequency-dependent responses. To examine the
effects of voltage range on frequency-dependent responses and preferred
frequencies, we altered either the upper bound or the lower bound of the
oscillations in PD and LP neurons. As our control, we used the voltage range of -
60 to -30 mV, which was similar to the voltage range of pyloric neurons during
natural oscillation. The upper bound was shifted by ±4 mV during the upper
bound experiment, and the lower bound was shifted by ±10 mV during the lower
bound experiment. The different values for the upper bound and lower bound
were chosen because in preliminary experiments, these two values generated a
similar level of change in the preferred frequency.
25
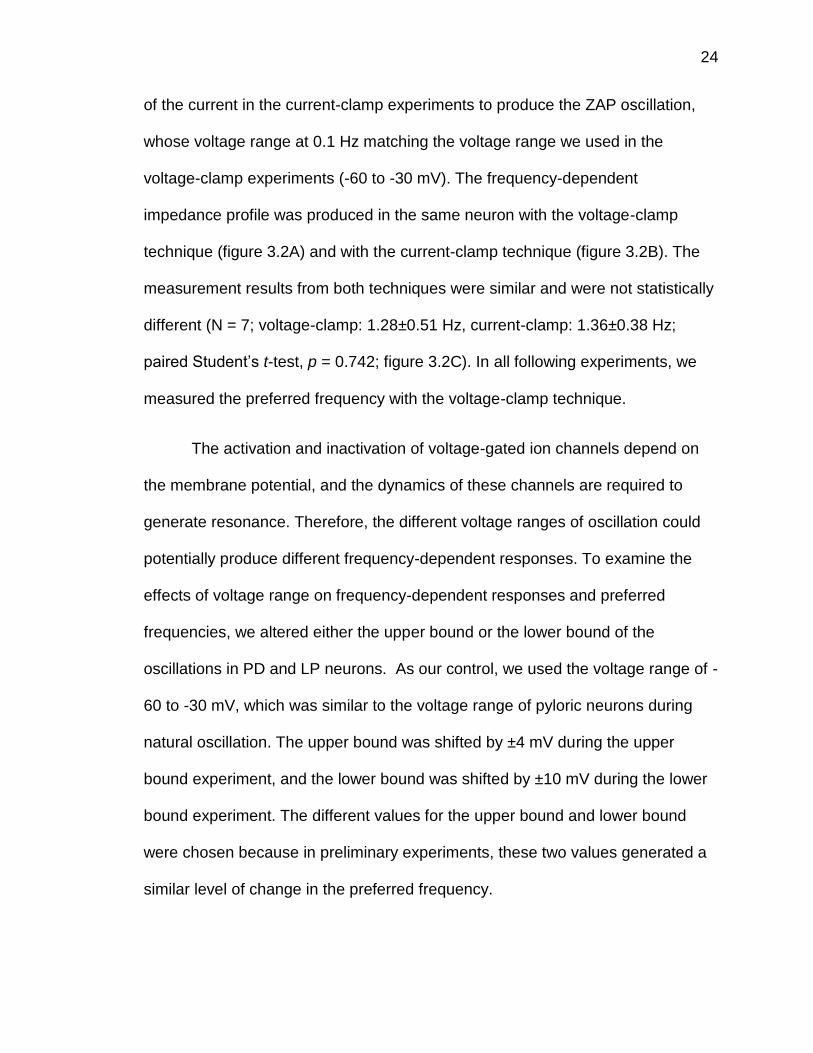
First, we examined how the frequency-dependent impedance profile in the
pacemaker PD neuron responded to changes in voltage range. When the PD
neuron was oscillating at a fixed lower bound (-60 mV) but various upper bound
(-34, -30 and -26 mV), the frequency-dependent impedance profiles showed that
the peak of impedance shifted toward higher frequency as the upper bound of
voltage range became more depolarized (figure 3.1A1). A 4 mV increase (from -
30 to -26 mV) in the upper bound shifted the preferred frequency of the PD
neuron toward the higher value by ~27% (from 1.14±0.23 Hz to 1.44±0.36 Hz)
compared with control. Similarly, decreasing the upper bound by 4 mV (from -30
to -34 mV) dropped the preferred frequency by ~23% (from 1.14±0.23 Hz to
0.88±0.25 Hz) compared with the control. Summary of results from 15
experiments showed that moving the upper bound to a more depolarized level
shifted the preferred frequency to a higher value (N = 15; one-way ANOVA, p <
0.001; figure 3.3A2).
Similarly, the preferred frequency also moved with the lower bound of the
voltage range in the oscillating PD neuron. As the lower bound became more
depolarized, the peak of the frequency-dependent impedance profile moved
toward a higher value (figure 3.3B1). When the lower bound was increased by 10
mV (from -60 to -50 mV), the preferred frequency of the PD neuron increased by
~18% (from 1.02±0.24 Hz to 1.18±0.26 Hz) compared with control. Likewise,
decreasing the lower bound by 10 mV (from -60 to -70 mV) resulted in a drop in
the preferred frequency by ~30% (from 1.02±0.24 Hz to 0.74±0.36 Hz) compared
with control. Results from 12 experiments showed that moving the lower bound
26
of the voltage range higher or lower shifted the preferred frequency in the same
way (N = 12; one-way ANOVA, p < 0.05; figure 3.3B2).
Although both shifting the upper bound and the lower bound of the voltage
range could alter the preferred frequency in the PD neuron, they might have
different efficiency. To examine which one is more efficient in shifting the
preferred frequency, we compared the sensitivity of the preferred frequency to
the changes in the upper bound or the low bound of the voltage range. The
sensitivity was calculated as the ratio of the change in preferred frequency to the
change in the voltage. We found that changing the upper bound of the voltage
range was more efficient than the lower bound in shifting the preferred frequency
in the PD neuron (upper bound: N = 15, 0.07±0.044 Hz/mV; lower bound: N = 12,
0.02±0.017 Hz/mV; Student’s t-test, p = 0.001).
We also shifted both the upper and the lower bound simultaneously by ±4
mV. The voltage amplitude of the oscillation was kept at 30 mV and the peak of
the frequency-dependent profile increased as the voltage range became more
depolarized (figure 3.3C1). Moving the voltage range of the PD neuron toward a
depolarized level by 4 mV (from -60 – -30 mV to -56 – -26 mV), increased the
preferred frequency by ~29% and moving toward the hyperpolarized level by
4mV (from -60 - -30 mV to -64 - -34 mV) decreased the preferred frequency by
~25% (N = 9; one-way ANOVA, p < 0.001; figure 3.3C2). Interestingly, the
change in the preferred frequency due to shifting both upper and lower bounds
by 4 mV was close to and not significantly different from shifting the upper bound
by 4 mV alone (upper bound: N = 15, frequency increase: 26.9±25.5%; both

27
upper and lower bound: N = 9, frequency increase: 28.5±18.9%; Student’s t-test,
p = 0.876).
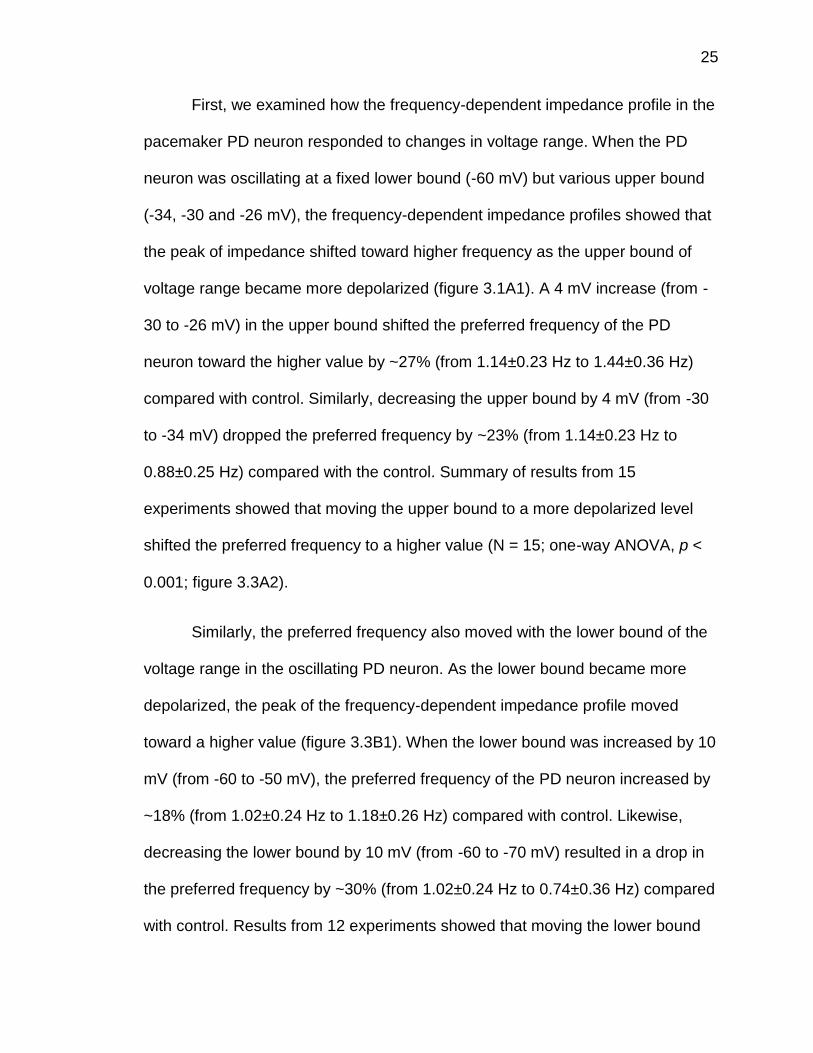
Besides the pacemaker PD neuron, we also investigated the frequency-
dependent impedance profile in the follower LP neuron. Shifting the upper bound
of the voltage range in the oscillating LP neuron had a similar effect as we saw in
the oscillating PD neuron. When the upper bound of the voltage range increased,
the peak of the frequency-dependent impedance profile shifted toward the higher
frequency (figure 3.4A1). Increasing the upper bound by 4 mV (from -30 to -26)
increased the preferred frequency by ~24% (from 1.53±0.40 Hz to 1.90±0.48 Hz)
and decreasing the upper bound by 4 mV (from -30 to -34) decreased the
preferred frequency by ~29% (from 1.53±0.40 Hz to 1.08±0.30 Hz; N = 10; one-
way ANOVA, p < 0.001; figure 3.4A2).
Unlike changing the upper bound of the voltage in the oscillating LP
neuron, changing the lower bound had no effect on the preferred frequency. We
shifted the lower bound by 10 mV in both directions (from -60 to -50 mV or to -70
mV) and the peak of the frequency-dependent impedance profile was unchanged
(figure 3.4B1). Further analysis showed that the preferred frequencies during the
oscillation with all three lower bound (-70, -60 and -50 mV) were not significantly
different from each other (-70 mV: 1.56±0.56 Hz; -60 mV: 1.33±0.43 Hz; -50 mV:
1.50±0.45 Hz; N = 8; one-way ANOVA, p = 0.72; figure 3.4B2).

28
Discussion
Resonance in neurons involves cellular membrane and voltage-gated ion
channels. The activation and deactivation of the voltage-gated ion channels
depends on the voltage value of the membrane potential. Therefore, it is likely
that the frequency-dependence of the impedance and the preferred frequency of
the neuron are affected by the voltage range of its oscillation. Indeed, modifying
the voltage range changes the preferred frequency. In general, when the voltage
range becomes more depolarized, the preferred frequency will move to a higher
value.
The traditional way of measuring the frequency-dependence of impedance
is to inject the ZAP current into the neuron in current clamp and to record the
membrane potential simultaneously. During the ZAP current injection, the neuron
is oscillating at various voltage ranges, depending on the oscillatory frequency.
Because we were interested in the effects of voltage range on the preferred
frequency, the voltage-clamp technique, which allowed us to have full control of
the voltage range of the oscillation, is a better choice for the impedance
measurement than the current-clamp technique. The fact that the voltage clamp
technique and the current clamp technique give the same preferred frequency at
similar voltage ranges further proves that the voltage clamp technique is a
feasible alternative way to measure the preferred frequency. In future
experiments, we will have the ability to explore the details of the behavior of ionic
currents during the oscillation because we will have precise control of the
membrane potential under the voltage clamp. In voltage clamp, the amplitude of
29
the ionic current of voltage-gated ion channels can be measured by comparing
the amount of the injected current with and without an ion channel blocker. The
amplitude of Ih, for example, can be obtained by subtracting the injected current
under CsCl (an Ih blocker) treatment from the one without the CsCl treatment.
The ability to measure the preferred frequency with the voltage clamp technique
opens new possibilities in understanding the role of each ionic current during
oscillation.
Increasing either the upper bound or the lower bound of the voltage range
of the oscillating PD neuron increases its preferred frequency. However, the
preferred frequency shows different sensitivities between the upper bound and
the lower bound changes. It is known that different types of voltage-gated ion
channels are responsible for the reactions at the upper portion and the lower
portion of the oscillation. The upper portion of the oscillation is shaped by the Ica
while the lower portion is shaped by the Ih (Tohidi and Nadim, 2009). Because
these two types of ion channels have distinct dynamics, they can respond to the
voltage change differently, resulting in different sensitivities of the preferred
frequency.
Many factors, including ionic currents, neuromodulation and synaptic
inputs, influence the voltage range of an oscillation. In a PD neuron model,
increasing the conductance of Ih makes the baseline of the membrane potential
more depolarized and also increases the preferred frequency of the model
(Tohidi and Nadim, 2009). These findings are consistent with our experimental
results that a more depolarized voltage range will give a higher preferred

30
frequency. Neuromodulators also play an important role in determining the
voltage range of oscillating neurons. Many neuromodulators, including dopamine,
serotonin and pilocarpine, depolarize the AB neuron when bath applied (Marder
and Eisen, 1984b). Interestingly, these neuromodulators also increase the
frequency of the AB oscillation (Marder and Eisen, 1984b). For PD neurons,
some neuromodulators, such as dopamine, hyperpolarize the membrane
potential while others, such as octopamine and pilocarpine, depolarize it (Marder
and Eisen, 1984b; Harris-Warrick et al., 1998; Kloppenburg et al., 1999; Goaillard
et al., 2004). Moreover, ionic currents involved in generating resonance can be
the target of neuromodulation directly. For example, Ih current is modulated by
dopamine, octopamine and serotonin (Peck et al., 2006; Ballo et al., 2010).
Although the effects of neuromodulators on pyloric frequency have been shown
in many studies, how neuromodulators will affect the preferred frequency is still
unclear.
In addition to the ionic currents, the strength of inhibitory synapses
between neurons is also regulated by neuromodulators and therefore can shift
the lower bound of the voltage range to different levels. Dopamine enhances the
graded release component of the synapse from the LP to the PD neuron but
reduces the overall synaptic output (Ayali et al., 1998). Another neuromodulator,
red pigment concentrating hormone, enhances both the graded release
component and the overall output of the LP to PD synapse (Thirumalai and
Marder, 2002). Because the pyloric frequency is correlated with the preferred
frequency of the PD neuron (Tohidi and Nadim, 2009) and the factors shifting the

31
preferred frequency shifts the pyloric frequency in the same direction (see
chapter 5), we expect that the inhibitory synapse from the LP to PD neuron is
able to control the pyloric frequency. However, previous studies have shown that
removing (by hyperpolarizing the LP neuron) or enhancing (with neuromodulators)
this synapse has almost no effect on the pyloric frequency (Mamiya and Nadim,
2004; Thirumalai et al., 2006). One explanation is that the strength of the
synaptic input from the LP neuron does not produce enough of a shift in the
lower bound of the PD voltage range, so the changes in both the preferred
frequency and the pyloric frequency are not significant, especially considering
that the preferred frequency is less sensitive to the shift in the lower bound of the
voltage range. It is also possible that changing the strength of the LP to PD
synapse not only shifts the lower bound, but also alters the PD waveform in a
way of counteracting the effect of shifting the lower bound; resulting in a limited
change in the preferred frequency and the pyloric frequency.
Finally, the neuromodulator can activate a voltage-dependent inward
current (IMI) (Swensen and Marder, 2000). A recent study shows that using
dynamic clamp to inject the negative-conductance region of the IMI or a negative
leak current into the PD neuron is sufficient to recover the pyloric oscillation in
the absent of the neuromodulation (Zhao et al., 2010). The negative leak current
could have two possible effects on the resonance and the preferred freqeuncy of
the PD neuron. By reducing the leak current, the neuron could have a higher
impedance and therefore an enhanced resonance, which may help the recovery
of the pyloric oscillation. Also, the negative leak current has the reversal potential

32
at -68 mV, so increasing its conductance would depolarize the neuron, resulting
a higher preferred frequency and a higher pyloric frequency.
Interestingly, the preferred frequency in the LP neuron behaves differently
to the shift in the voltage range. The LP and PD neurons play different functional
roles in the pyloric network; the PD neuron is part of the pacemaker kernel while
the LP neuron belongs to the group of followers. Their voltage-gated ion
channels can be composed of different combinations thus respond differently to
the shift of voltage range. The preferred frequencies of neurons in many other
systems have varied responses to the shift in the voltage range. In some, like
the pyloric neurons, the preferred frequency increases as the membrane
potential becomes more depolarized (Gutfreund et al., 1995). In others, the
preferred frequency could decrease with a more depolarized membrane potential
(Hutcheon et al., 1996b) or is not affected by the voltage range at all
(Zemankovics et al., 2010).
When we put all our measurements from voltage range of -60 to -30 mV
together, we found that there was a three-fold variability in the preferred
frequencies of the PD or LP neurons (PD: min = 0.75 Hz, max = 2.10 Hz; LP: min
= 0.71 Hz, max = 2.56 Hz), which is similar to the variabilities in the ionic currents
(Golowasch et al., 2002; Khorkova and Golowasch, 2007). Interestingly, the
pyloric frequencies cross animals are also variable, while the phases are
relatively more constant (Bucher et al., 2005). Because the pyloric frequency is
correlated with the preferred frequency of the PD neuron (Tohidi and Nadim,
2009), the variability in the preferred frequency could reflect on the pyloric
33
frequency, and there are other mechanisms help stabilizing the phase of the
pyloric activity.
Overall, in this part of my thesis, we demonstrate that the voltage range
can be an important factor in determining the preferred frequency of the neurons
in the pyloric network. In the following chapters, we will explore other possible
factors.
34
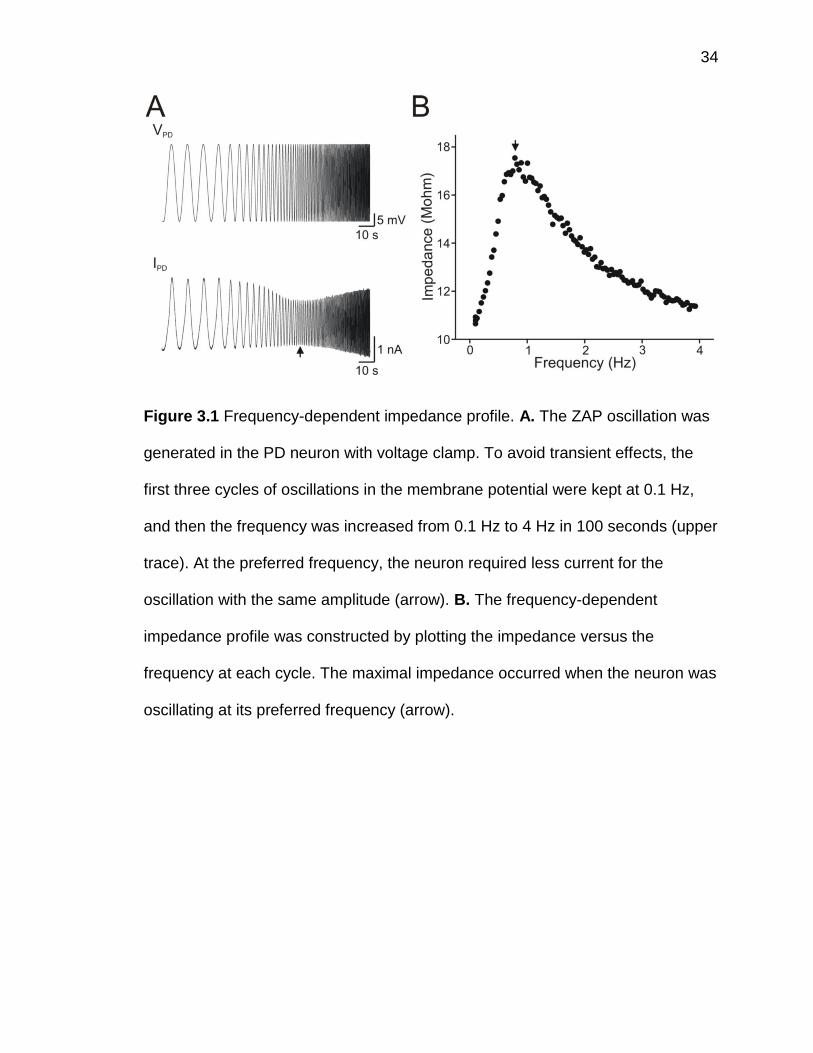
Figure 3.1 Frequency-dependent impedance profile. A. The ZAP oscillation was
generated in the PD neuron with voltage clamp. To avoid transient effects, the
first three cycles of oscillations in the membrane potential were kept at 0.1 Hz,
and then the frequency was increased from 0.1 Hz to 4 Hz in 100 seconds (upper
trace). At the preferred frequency, the neuron required less current for the
oscillation with the same amplitude (arrow). B. The frequency-dependent
impedance profile was constructed by plotting the impedance versus the
frequency at each cycle. The maximal impedance occurred when the neuron was
oscillating at its preferred frequency (arrow).
35
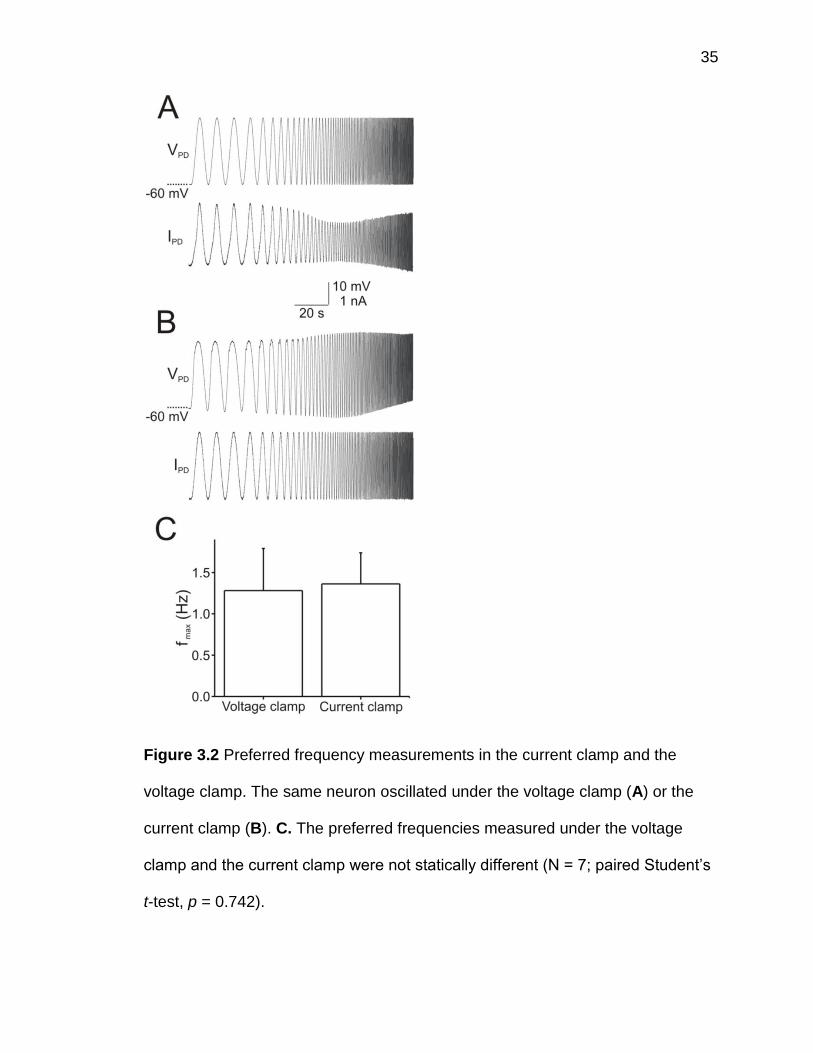
Figure 3.2 Preferred frequency measurements in the current clamp and the
voltage clamp. The same neuron oscillated under the voltage clamp (A) or the
current clamp (B). C. The preferred frequencies measured under the voltage
clamp and the current clamp were not statically different (N = 7; paired Student’s
t-test, p = 0.742).

36
Figure 3.3 Preferred frequency of the PD neuron increases with the voltage
range of oscillation. A1. The impedance profiles when a PD neuron is oscillating
between different upper bounds (-34, -30 and -26 mV) and a fixed lower bound (-
37
60 mV). A2. The preferred frequency of the PD neuron increases as the upper
bound becomes more depolarized (N = 15; one-way ANOVA, p < 0.001). B1.
The impedance profiles when a PD neuron is oscillating between a fixed upper
bound (-30 mV) and various lower bounds (-70, -60 and -50 mV). B2. The
preferred frequency of the PD neuron increases as the lower bound becomes
more depolarized (N = 12; one-way ANOVA, p < 0.05). C1. The impedance
profiles when a PD neuron is oscillating at different voltage range (-64 to -34 mV,
-60 to -30 mV and -56 to -26 mV) with the same amplitude. C2. The preferred
frequency of the PD neuron increases with the voltage range of the oscillation (N
= 9; one-way ANOVA, p < 0.001).
38
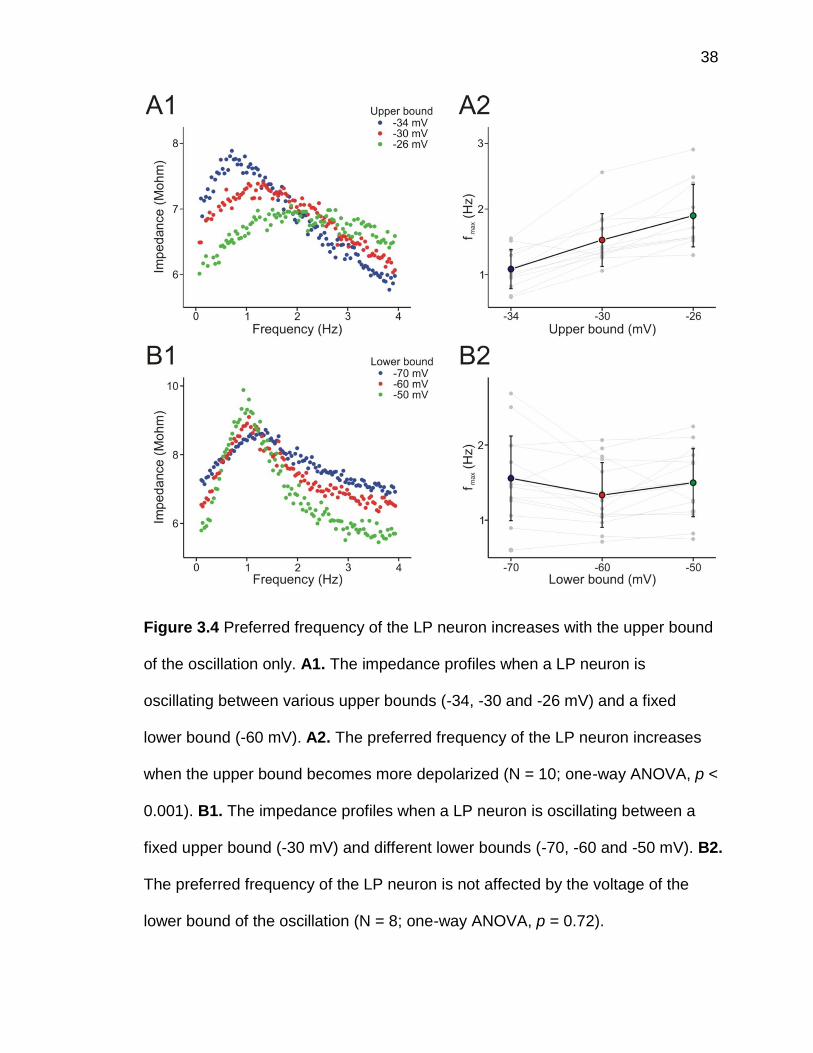
Figure 3.4 Preferred frequency of the LP neuron increases with the upper bound
of the oscillation only. A1. The impedance profiles when a LP neuron is
oscillating between various upper bounds (-34, -30 and -26 mV) and a fixed
lower bound (-60 mV). A2. The preferred frequency of the LP neuron increases
when the upper bound becomes more depolarized (N = 10; one-way ANOVA, p <
0.001). B1. The impedance profiles when a LP neuron is oscillating between a
fixed upper bound (-30 mV) and different lower bounds (-70, -60 and -50 mV). B2.
The preferred frequency of the LP neuron is not affected by the voltage of the
lower bound of the oscillation (N = 8; one-way ANOVA, p = 0.72).
39
Chapter 4: Correlations between the waveform parameters and
the preferred frequency of an oscillatory neuron
Introduction
The bursting activity of the neurons in the pyloric network can be simplified
to slow-oscillation waveforms by filtering out the action potentials on the recorded
waveform using a low-pass filter. The slow-oscillation waveform represents the
change of membrane potential of the oscillatory neuron and is the result of
dynamic interactions between a number of ion channels. I have discussed one
parameter of the slow-oscillation waveform, the voltage range, in the previous
chapter. Besides the voltage range, the slow-oscillation waveform can also be
described by many other parameters, including duty cycle, rising and falling
slopes and peak phase. Duty cycle is the portion of the cycle above the average
value. Slope can be either rising or falling and is the rate of the change in
membrane potential. Peak phase is the phase at which the membrane potential
reaches its peak during the cycle. In general, the slow-oscillation is how the
membrane potential changes during the activity. Because many voltage-gated
ion channels are involved in generating neural resonance, different slow-
oscillation waveforms may recruit different levels of activation of voltage-gated
ion channels and result in different frequency-dependent responses and
preferred frequencies.
40
We recorded the membrane potential during the ongoing activity and used
a low-pass filter to filter this recording at 10 Hz to generate slow-oscillation
realistic waveforms. We then measured the preferred frequencies by voltage-
clamping the neuron with the realistic waveform and sine wave (which serve as
reference). In the PD neuron, the preferred frequencies vary with different
realistic waveforms and are negatively correlated with the top 75-100% of the
rising slope. However, the preferred frequencies of the LP neuron oscillating with
different realistic waveforms show no statistical difference.
Materials and methods
Generation of the slow-oscillation realistic waveform
The representative realistic waveforms were extracted from the
experimental recordings using the Readscope software (version 7.75) as
described below. Five consecutive cycles of the selected recording were
analyzed. The voltage trace was low-pass filtered at 10 Hz to reveal the slow
oscillation. The average membrane potential in the five cycles was used as the
voltage threshold to align and average these cycles and produce a single
averaged waveform. The averaged waveform was sampled at 1000 points and
rescaled to be between 0 and 1. Finally, the waveform was shifted so that the
minimum point 0 became the start point of the waveform. These representative
realistic waveforms were then used in the waveform analysis and in the
experiments. The experiments in which the waveform was used to voltage clamp
41
the neuron and measure the corresponding preferred frequency were performed
by replacing the sine function in the ZAP equation (see chapter 2) with the
realistic waveform using the Scope software.
The realistic waveforms used in this study were selected as described
below. The seven PD realistic waveforms were extracted from randomly selected
recordings. For the LP realistic waveforms, we collected a group of the LP
waveforms and performed the principal component analysis. We then chose
seven LP realistic waveforms showing the most variations on the first and second
principal components.
Waveform analysis
The waveform analysis was done using Matlab scripts. The waveform duty
cycle was defined as the fraction of time that the waveform was above its mean
value. We also calculated the portions of the waveform above 75% or below 25%
of the peak value. The peak phase is the phase at which the maximum value (1)
occurs when the minimum (0) is used as the reference point. Area refers to the
area underneath the waveform curve where the duration of the waveform is
normalized to 1. The various slopes were calculated from different parts of the
waveform after dividing the waveform into a rising and a falling interval. The
rising interval is the portion of the waveform from between the start point 0 and
the peak point 1 and the falling interval is between the peak and the end point.
Each interval was divided into different slope ranges. The rising slopes used
42
were as follows: 0-100, 0 -25, 25-50, 50 -75, and 75-100%; the falling slopes
were as follows: 100-0, 100-75, 75-50, 50-25, and 25-0%. These parameters
were not meant to be independent or exhaustive descriptions of the waveforms.
These were selected from among a larger set of parameters because they
provide a relatively distinct and comprehensive description of the waveforms.
Results
In the pyloric network, each type of neuron has a singular slow-oscillation
waveform. The same type of neuron from different preparation, however, has a
similar (not exactly the same) waveform. The slow-oscillation waveform
represents how the membrane potential changes during each oscillation cycle
and can be dissected into several parameters, including the duty cycle, peak
phase, the portion above a certain threshold, the rising and falling slopes, etc. As
the activation and inactivation of voltage-gated ion channels depend on the
membrane potential, and the dynamics of the voltage-gated ion channels is
responsible for resonance in neurons, the same neuron oscillating with different
slow-oscillation waveforms could have different preferred frequencies. Moreover,
the preferred frequency could be correlated with the parameters of the waveform.
We explored the possible correlations between the preferred frequency in
the PD neuron and the waveform parameters. One way to approach this question
is to measure the preferred frequency with a set of waveforms, which have
differences in the desired parameters. Instead of creating separate sets of

43
waveforms for each parameter, we took advantage of the fact that the slow-
oscillation waveform of PD in each individual has different parameters during the
ongoing pyloric activity. We selected seven PD neurons in different individuals
and extracted the slow-oscillation waveforms from their recorded bursting
activities. The pre-recorded bursting activity (figure 4.1A, blue trace) was low-
pass filtered at 10 Hz to remove action potentials, and the filtered waveform
(figure 4.1A, red trace) was averaged over several cycles to generate the unitary
slow-oscillation waveform (we called it the realistic waveform) representing this
recording. We collected a set of seven unitary realistic waveforms (figure 4.1B, a-
g) and also included the sine waveform as our reference waveform. Although all
realistic waveforms were from real PD recordings, they looked different from
each other (figure 4.1C, compare the realistic waveforms a and g).
In each experiment, we drove the voltage-clamped PD neurons, in
separate runs, with ZAP functions constructed from the realistic waveforms and
the sine waveform, making them oscillate from 0.1 to 4 Hz and with a voltage
range between -60 and -30 mV. The example traces of the same neuron
oscillating with different realistic waveforms, waveforms a and g, were shown in
figure 4.2A. The frequency-dependent impedance profiles showed that different
realistic waveforms generate the peak of impedance at different frequencies
(figure 4.2B). To focus on the effects of different realistic waveforms in the same
neuron and to eliminate the variations between individuals, we normalized the
preferred frequency obtained from the realistic waveform oscillation to that
obtained from the sine waveform oscillation. The normalized preferred
44
frequencies were clearly different when the neurons were oscillating with different
realistic waveform (N = 7; one-way ANOVA, p < 0.001; figure 4.2C).
The realistic waveform can be described with several parameters,
including duty cycle, peak phase, the portions above certain thresholds, rising
and falling slopes, etc. We would like to know which of these parameter(s) can
be correlated with the preferred frequency. We calculated the parameters of the
seven realistic waveforms we used in the preferred frequency measurement and
checked if there was any correlation between the realistic waveform parameters
and the normalized preferred frequency. Surprisingly, most of the parameters
only showed slight or no correlations with the normalized preferred frequency
(figure 4.4). However, few specific parameters did stand out and draw our
attention. Amongst them, the rising slope of the waveform at 75 -100% amplitude
gave us a strongest negative correlation with statistically significant p value
( Pearson Product Moment Correlation, correlation coefficient = -0.59, p < 0.001;
figure 4.3J). In addition to the 75-100% rising slope, the total waveform area
(figure 4.3C) and the portion above 75% amplitude of the waveform (figure 4.3D)
also showed a good correlation with normalized preferred frequency (Pearson
Product Moment Correlation; area: correlation coefficient = 0.43, p < 0.05; portion
above 75%: correlation coefficient = 0.45, p < 0.05). Altogether, the analysis of
waveform parameters indicated that other than the upper bound and the lower
bound of the voltage range, other factors also influence the preferred frequency.
In particular, when the rising slope of the top portion of the waveform became
steeper, the preferred frequency became smaller.

45
As described in chapter 3, in contrast to the PD neuron, the preferred
frequency in the LP neuron responded differently to the shift in voltage range. We
therefore examined if the preferred frequency in the LP neuron is correlated to its
waveform parameters in a similar manner as the PD neuron, and if not, what are
the differences. We generated a set of seven realistic waveforms of LP neuron
from the LP bursting activity in different preparations. Even though the seven
realistic waveforms of the LP neuron looked similar, there were differences in the
waveform parameters (figure 4.4A, h-n). The oscillations were generated in the
LP neuron with these seven realistic waveforms and the sine wave, and their
frequency-dependent impedance profiles were calculated in the same manner as
described above for the PD neuron. In some cases, as the example shown in
figure 4.4B, the impedance in the same LP neuron oscillating with different
realistic waveforms could peak at different frequencies. However, the results
from seven experiments showed that there is no statistical difference in the
normalized frequencies obtained from different realistic waveforms (N = 7; one-
way ANOVA, p = 0.57; figure 4.4C).
Discussion
In the previous chapter, we used sine waveforms to examine the effects of
voltage range on the preferred frequency. To study the effects of other
parameters, we switched to realistic oscillation waveforms, which show variability
in several waveform parameters. The realistic slow-oscillation waveforms of PD
46
or LP neurons were extracted from recorded traces in several experiments.
Among different individuals, the pyloric activity has shown consistence in its
phase relationships (Bucher et al., 2005). Despite the consistence in the phase
relationship, the waveforms of the same type of neuron in different individuals
could be quite distinct (see figure 4.1 and 4.4). When comparing the waveform
parameters of each waveform to the preferred frequency, the rising slope of top
75- 100% of the waveform showed the strongest negative correlation with the
preferred frequency in the PD neuron. In contrast, for the LP neuron, oscillations
with different realistic waveforms produced a similar preferred frequency.
The slow-oscillation waveform represents how the membrane potential
changes during the oscillation cycle. The activation and inactivation of voltage-
gated ion channels depend on the value and the change rate (slope) of the
membrane potential. The same type of voltage-gated ion channels could behave
differently when the neuron is oscillating with different waveform. For example, in
leech heart interneurons, waveforms with different rising slopes produce different
amounts of ICa and Ih (Olsen and Calabrese, 1996). These differences in the
dynamics of ion channels can in turn affect the preferred frequency of neurons.
On the other hand, the slow-oscillation waveform of a neuron results from
the interactions between the dynamics of ion channels in the neuron. In the PD
neuron, over-expression of Ih changes its waveform by reducing the time to first
spike, increasing duty cycle and producing more action potentials per burst
(Zhang et al., 2003), whereas an increase in transient potassium current (IA)
delays the post-inhibitory rebound (Tierney and Harris-Warrick, 1992). In other

47
neurons, modeling results show that increasing IA reduce the duration of the PY
active phase (Zhang et al., 2008). Because many ion channels undergo
neuromodulation, neuromodulators also influence the slow-oscillation waveform.
The neuromodulator dopamine enhances the rebound of the LP and PY neurons
(Johnson et al., 2005), shortens the LP bursting duration (Johnson et al., 2011)
and increases the burst duration and duty cycle of the PY neuron (Johnson et al.,
2005). The last contributors to the waveform are the synaptic inputs. Stronger
inhibitory synapses creates a larger delay in the rebound after inhibition, due to
the removal of IA inactivation (Tierney and Harris-Warrick, 1992). Working
together, ionic currents, neuromodulators and synaptic inputs determine the
slow-oscillation waveform and therefore the preferred frequency of the PD
neuron.
As in responses to voltage range described in chapter 3, the preferred
frequency of the LP neuron behaves differently from the PD neuron in response
to changes in the slow waveform. Unlike The PD neuron, the LP neuron has a
similar preferred frequency even when oscillating with different realistic slow-
oscillation waveforms. One possible but unlikely explanation is that the preferred
frequency of the LP neuron is not related to any waveform parameters. However,
it is also possible that the preferred frequency is affected by certain waveform
parameters, but these parameters are similar in the waveforms we used. When
we selected the LP waveforms, we did the principal component assay and picked
up the ones far away from each other on the first and second principal
components. If there is a specific waveform parameter correlated with the
48
preferred frequency and not showing variations in the waveform we used, it is
likely that that specific waveform parameter does not vary much in normal
conditions.
So far, we demonstrate that the voltage range of the oscillation and the
rising slope of top 75-100% of the waveform have great influence on the
preferred frequency of the PD neuron. Because the preferred frequency of the
PD neuron is correlated with the pyloric frequency, we would like to know if
modifying the voltage range and the rising slope of the PD neuron during ongoing
activity could change the pyloric frequency in the same way as it changes the
preferred frequency. This possibility will be examined in the next chapter.

49
Figure 4.1 Realistic waveforms of the PD neuron. A. The PD membrane
potential recording (blue trace) is low-pass filtered at 10 Hz to remove the action
potentials and the slow-oscillation (red trace). B. We select seven realistic
waveforms (a - g) and also include the sine waveform as the reference. C. The
overlapped comparison of the waveforms a and g is showed here as an example
of the differences between the realistic waveforms.
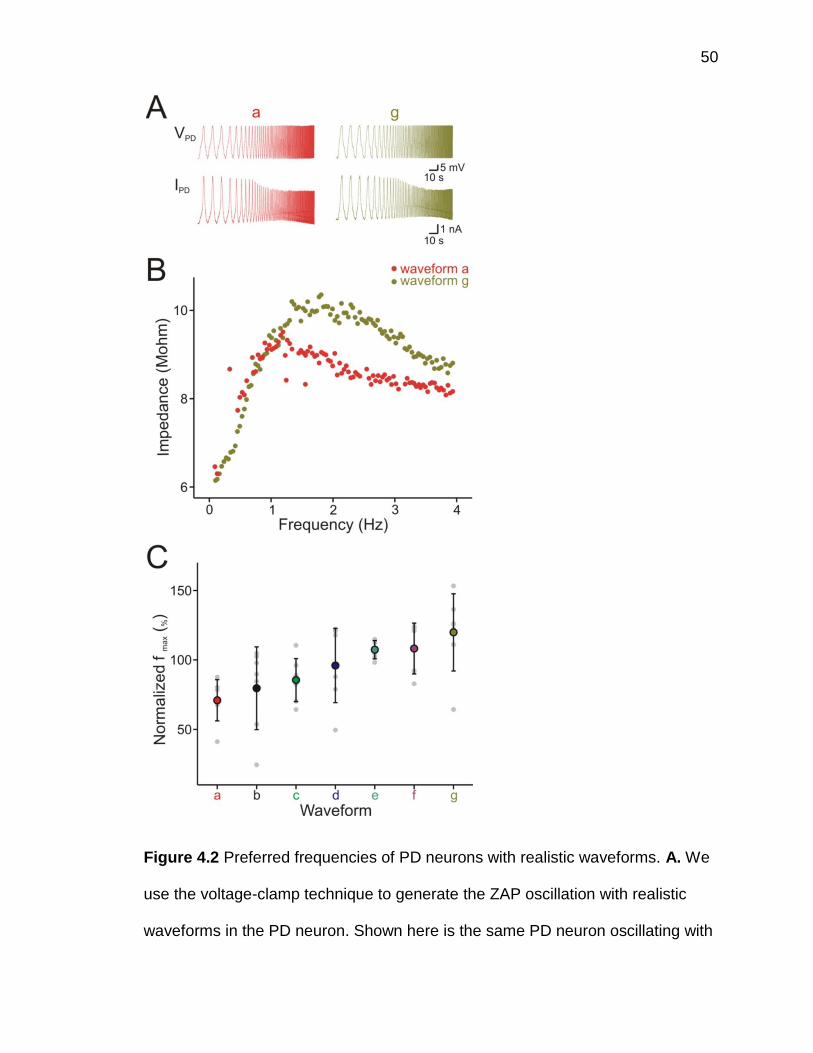
50
Figure 4.2 Preferred frequencies of PD neurons with realistic waveforms. A. We
use the voltage-clamp technique to generate the ZAP oscillation with realistic
waveforms in the PD neuron. Shown here is the same PD neuron oscillating with
51
the realistic waveform a (left) and waveform g (right). B. The frequency-
dependent impedance profiles from the recording shown in A. C. To eliminate
variations between individuals, we normalize the preferred frequency from the
realistic waveforms to that from sine waveform in the same neuron. The
normalized preferred frequencies vary with the realistic waveforms (N = 7; one-
way ANOVA, p < 0.001).

52
Figure 4.3 Correlations between the normalized preferred frequencies
(Normalized fmax) of the PD neurons and the waveform parameters. A–O, Fifteen

53
properties of waveform were analyzed, including duty cycle (A), peak phase (B),
area under the waveform (C), portion above 75% (D), portion below 25% (E), and
slope within different parts of the waveform (F–O). Among these properties, the
rising slope at the 75–100% amplitude (J) showed the strongest (negative)
correlation. Each yellow dot shows the measurement at that value of the
parameter in a single experiment.

54
Figure 4.4 Preferred frequencies of LP neurons with realistic waveforms. A.
Seven realistic waveforms were generated from pre-recorded LP oscillation. The
sine waveform was included as reference. B. The frequency-dependent
impedance profiles of the same neuron oscillating with waveform h and n. C. The
normalized preferred frequency does not change when the LP neuron is
oscillating with different realistic waveforms (N = 7; one-way ANOVA, p = 0.57).
55
Chapter 5: The changes in voltage range and in waveform have
similar effects on the preferred frequency of pacemaker PD
neurons and the network frequency
Introduction
In the pyloric network, the preferred frequency of the pacemaker PD
neuron is correlated with the pyloric frequency (Tohidi and Nadim, 2009). As we
showed in previous chapters, factors such as the voltage range and the rising
slope could influence the preferred frequency of the PD neuron. It is possible that
these factors also affect the pyloric frequency and that the pyloric frequency can
be regulated by targeting these parameters.
We use the dynamic clamp technique to alter the PD oscillation in an
ongoing pyloric network and measure the response in the pyloric frequency. As
shown in chapters 3 and 4, both the voltage range and the top 75-100% slope of
the waveform affect the preferred frequency of the PD neuron. In this chapter we
show that changing the voltage range and waveform of the PD oscillation in the
ongoing pyloric activity have similar effects on both the preferred frequency of the
PD neuron and the pyloric frequency. Therefore, with the understanding that the
preferred frequency of the PD neuron is correlated with the voltage range and the
waveform parameters, we can predict how the changes in voltage range and
waveform of the pacemaker neuron affect the pyloric frequency.
56
Materials and methods
Dynamic clamp
The Dynamic Clamp software (version 1.55) was used to produce artificial
ionic conductances to shift the voltage range of an oscillating PD neuron during
its ongoing network activity. The current was injected into the PD neuron in
discontinuous current-clamp mode. In the upper-bound shift experiments, the
artificial current had a reversal potential at 0 mV and activated when the PD
membrane potential was above a given threshold; in the lower-bound shift
experiments, the artificial current had a reversal potential at -80 mV and activated
when the PD membrane potential was below a given threshold. In each
experiment, we used two different thresholds. The lower threshold was set at the
voltage at which the inhibitory synapse from the LP neuron activated (around -55
mV; figure 5.1, blue line), whereas the higher threshold was always set 10 mV
higher than the lower threshold (figure 5.1, red line). The dynamic clamp current
was assumed to activate with first-order activation kinetics and no inactivation:
The activation variable followed equations:
57
Here, vth is the activation threshold, k was set to -1 mV to produce a sharp
m) was set to a constant value of 1 ms.
By adjusting the maximal conductance gmax (range, 5–35 nS), we could move the
upper bound or the lower bound of the PD neuron membrane potential to
different levels. In the upper and lower bound shift experiments, we limited the
value of gmax so that only the upper or lower bounds, respectively, were affected.
This restriction resulted in a smaller possible range of gmax values for the low
threshold activation inward current and thus a more limited shift in the upper
bound when compared with the high threshold activation current.
Waveform parameter comparison
For each recording, we used Readscope software to extract five
consecutive cycles of the PD membrane potential before dynamic current
injection and five cycles during the injection. The analysis of the extracted
waveforms was done as described in chapter 4. To show how the waveform
parameters change during the dynamic current injection, we calculated the ratio
of the value of the waveform parameter during the dynamic current injection to
that before the injection. A ratio larger than one indicates the waveform
parameter increases during the current injection while a value less than less than
one indicates that parameter decreases.
58
Results
Our goal is to understand what factors determine the frequency of pyloric
activity. The preferred frequency of the PD neuron has been shown to be
correlated with the pyloric frequency (Tohidi and Nadim, 2009). So far, we have
demonstrated that the voltage range and the waveform of the PD neuron can
influence its preferred frequency. Therefore, we hypothesized that any
modifications changing the preferred frequency of the PD neuron will change the
pyloric frequency in the same way. Specifically, the changes in the voltage range
and in the waveform parameters of the PD neuron during ongoing activity can
alter the pyloric frequency. We predicted that when the voltage range of the PD
oscillation went higher, the frequency of the pyloric activity would also go higher,
just like the preferred frequency of the PD neuron.
To alter the voltage range of the PD neuron during ongoing activity, we
used dynamic clamp to generate an additional voltage-gated current in the PD
neuron. We changed the upper bound of the voltage range in the PD neuron by
designing a dynamic current that activates when the PD membrane potential is
over a certain threshold. Because the PD neuron in different individuals had
slight differences in voltage range, instead of a fixed voltage for all experiments,
we used a threshold based on the features of the PD bursting waveform. One
prominent feature of the PD bursting waveform is the drop in the membrane
potential caused by the inhibitory synaptic input from the LP neuron (figure 5.1,
arrow). As shown in figure 5.1, we used the voltage at which the PD neuron
receives the synaptic input from the LP neuron as the threshold (referred as low-
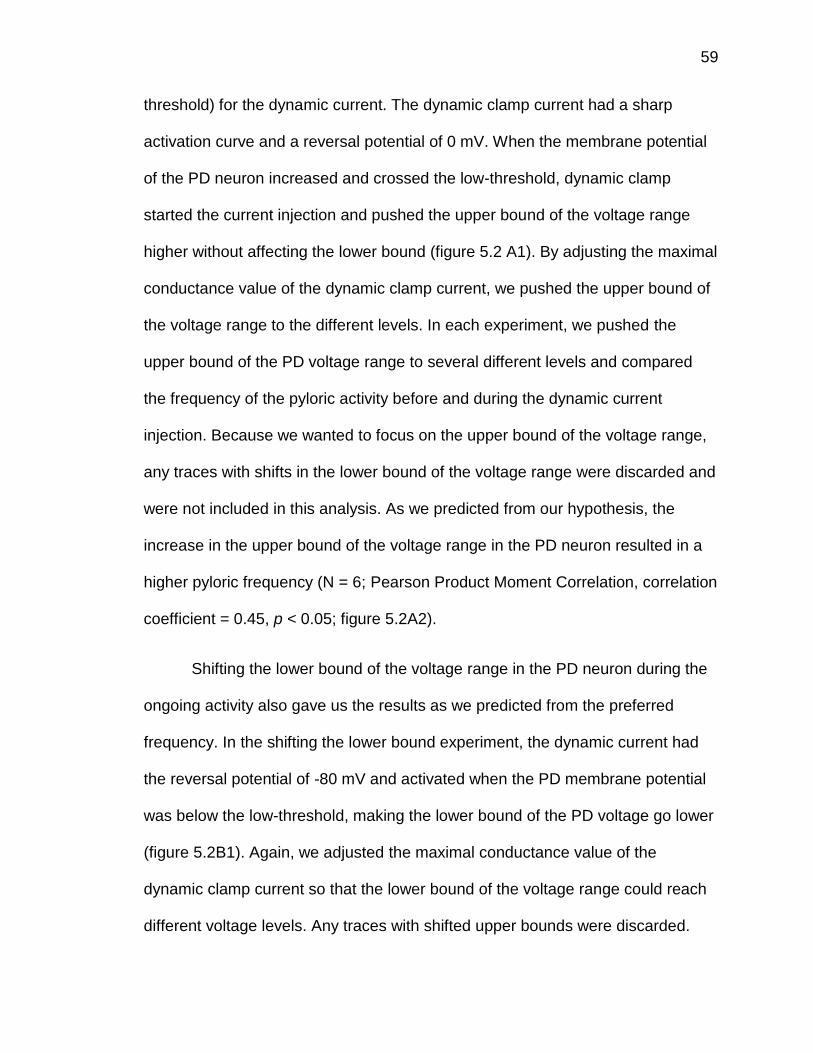
59
threshold) for the dynamic current. The dynamic clamp current had a sharp
activation curve and a reversal potential of 0 mV. When the membrane potential
of the PD neuron increased and crossed the low-threshold, dynamic clamp
started the current injection and pushed the upper bound of the voltage range
higher without affecting the lower bound (figure 5.2 A1). By adjusting the maximal
conductance value of the dynamic clamp current, we pushed the upper bound of
the voltage range to the different levels. In each experiment, we pushed the
upper bound of the PD voltage range to several different levels and compared
the frequency of the pyloric activity before and during the dynamic current
injection. Because we wanted to focus on the upper bound of the voltage range,
any traces with shifts in the lower bound of the voltage range were discarded and
were not included in this analysis. As we predicted from our hypothesis, the
increase in the upper bound of the voltage range in the PD neuron resulted in a
higher pyloric frequency (N = 6; Pearson Product Moment Correlation, correlation
coefficient = 0.45, p < 0.05; figure 5.2A2).
Shifting the lower bound of the voltage range in the PD neuron during the
ongoing activity also gave us the results as we predicted from the preferred
frequency. In the shifting the lower bound experiment, the dynamic current had
the reversal potential of -80 mV and activated when the PD membrane potential
was below the low-threshold, making the lower bound of the PD voltage go lower
(figure 5.2B1). Again, we adjusted the maximal conductance value of the
dynamic clamp current so that the lower bound of the voltage range could reach
different voltage levels. Any traces with shifted upper bounds were discarded.

60
When the lower bound of the voltage range in the PD neuron became more
hyperpolarized, the frequency of the pyloric activity decreases (N = 6; Pearson
Product Moment Correlation, correlation coefficient = 0.61, p < 0.001; figure
5.2B2). Overall, these results showed that shifting the voltage range has similar
effects on the preferred frequency of the PD neuron and the frequency of the
pyloric activity.
The choice of the low-threshold, although based on the features of the PD
bursting waveform, was arbitrary. We therefore examined the effect of this
threshold value by using another threshold (referred as the high threshold), which
was 10 mV higher than low-threshold, for the dynamic clamp current. In the
upper bound shift experiment, the high-threshold current altered the upper bound
of the voltage range as the low-threshold current did (figure 5.3A1). Surprisingly,
even though the upper bound was shifted during the dynamic clamp current
injection, unlike the low-threshold dynamic current, the high-threshold dynamic
current failed to increase the pyloric frequency (N = 6; Pearson Product Moment
Correlation, correlation coefficient = 0.06, p = 0.67; figure 5.3A2).
In the lower bound shift experiments, the high-threshold current generated
similar results to those generated by the low-threshold current. During the high-
threshold dynamic current injection, the lower bound was brought to more
hyperpolarized levels (figure 5.3B1) and the pyloric frequency also slowed down
(N = 6; Pearson Product Moment Correlation, correlation coefficient = 0.35, p <
0.05; figure 5.3B2).

61
In the previous chapters, we showed that the voltage range of the
oscillation in the PD neuron was not the only factor affecting its preferred
frequency. Additionally, the rising slope of 75-100% of the waveform was also
strongly negatively correlated with the preferred frequency. The dynamic current
not only shifted the voltage range, but also altered the PD waveform. To
understand how the dynamic current affects the waveform, we extracted the
slow-oscillation realistic waveform from the PD busting activities before and
during the dynamic current injection. The low-threshold current and the high-
threshold current modified the realistic waveforms in different ways, especially
the top portion of the waveforms (figure 5.4A).
To compare the slow-oscillation waveform before and during the dynamic
clamp current injection, we measured the effects of the dynamic clamp current by
calculating the ratio of the given waveform parameter during injection to that
before injection. A ratio higher or lower than one indicated the waveform
parameter increased or decreased, respectively. The rising slope of the 75-
100% portion of the waveform, one of the most correlated parameters to the
preferred frequency, reacted differently during the low-threshold and high-
threshold injection. As the high-threshold current pushed the upper bound of the
voltage range higher and increased the rising slope at the same time; on the
other hand, the low-threshold current shifted the upper bound but slightly
reduced rising slope (low-threshold: N = 6, r = 0.36, p < 0.05, slope = -0.03; high-
threshold: N = 6, r = 0.39, p < 0.01, slope = 0.13; figure 5.4B). The other two
parameters, the area and the portion above 75%, showed an increase when the

62
upper bound of the voltage range was pushed higher during both dynamic clamp
current injections. However, the values measured with low-threshold current
injection were higher (figure 5.4C and D). The low- and high-threshold dynamic
clamp currents affected the waveform parameters differently, which could provide
a possible explanation of their different effects on pyloric frequency.
Discussion
In chapter 3 and 4, we demonstrated that a more depolarized voltage
range resulted in a higher preferred frequency while a steeper rising slope of top
75- 100% of the waveform gave a lower preferred frequency. The preferred
frequency of the PD neuron has been correlated with the pyloric frequency. We
therefore expected to observe that changing the voltage range and the waveform
parameters would have the same effects on the pyloric frequency as the
preferred frequency of the PD neuron. To examine how the voltage range of the
PD neuron during ongoing pyloric activity affects the pyloric frequency, we used
dynamic clamp to shift the voltage range of the oscillating PD neurons in intact
networks. The dynamic clamp technique induces an artificial current into the cell
based on given equations and is a great tool for mimicking ionic currents or
synaptic currents (Sharp et al., 1993a, b; Prinz et al., 2004). In our experiments,
we used the dynamic clamp technique to add an inward or outward current to
shift the voltage range of the PD neuron up or down, respectively, and we
examined the pyloric frequency during these manipulations.
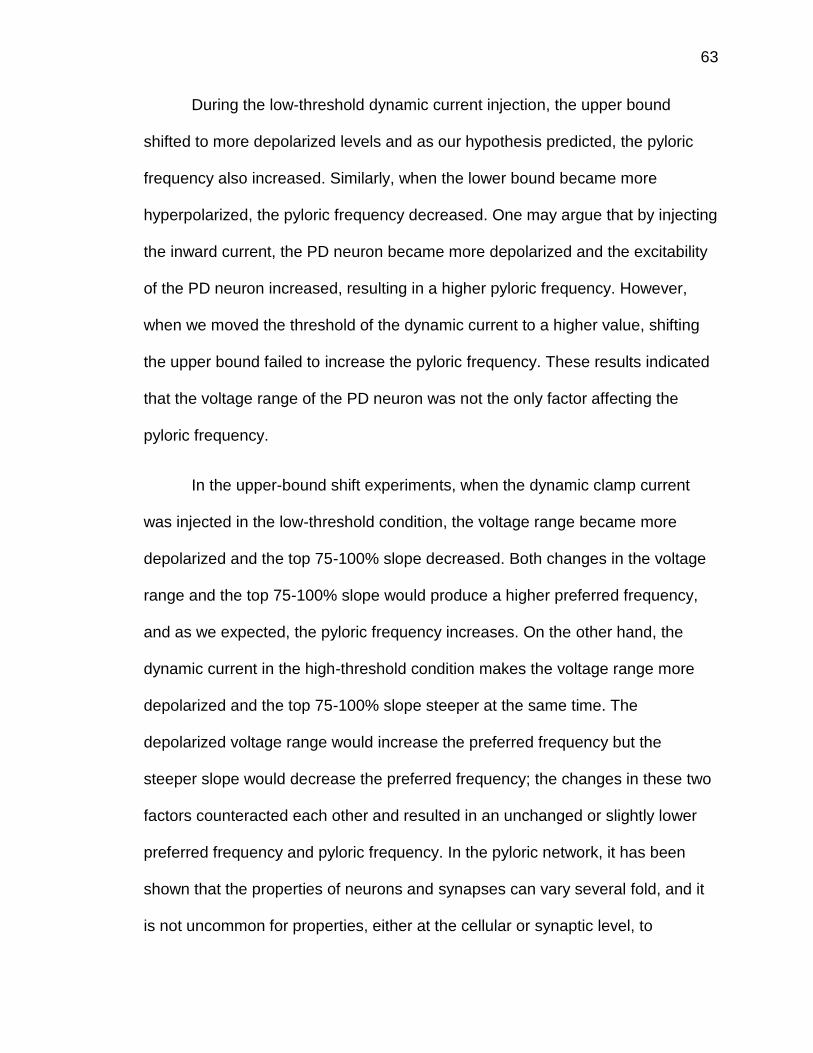
63
During the low-threshold dynamic current injection, the upper bound
shifted to more depolarized levels and as our hypothesis predicted, the pyloric
frequency also increased. Similarly, when the lower bound became more
hyperpolarized, the pyloric frequency decreased. One may argue that by injecting
the inward current, the PD neuron became more depolarized and the excitability
of the PD neuron increased, resulting in a higher pyloric frequency. However,
when we moved the threshold of the dynamic current to a higher value, shifting
the upper bound failed to increase the pyloric frequency. These results indicated
that the voltage range of the PD neuron was not the only factor affecting the
pyloric frequency.
In the upper-bound shift experiments, when the dynamic clamp current
was injected in the low-threshold condition, the voltage range became more
depolarized and the top 75-100% slope decreased. Both changes in the voltage
range and the top 75-100% slope would produce a higher preferred frequency,
and as we expected, the pyloric frequency increases. On the other hand, the
dynamic current in the high-threshold condition makes the voltage range more
depolarized and the top 75-100% slope steeper at the same time. The
depolarized voltage range would increase the preferred frequency but the
steeper slope would decrease the preferred frequency; the changes in these two
factors counteracted each other and resulted in an unchanged or slightly lower
preferred frequency and pyloric frequency. In the pyloric network, it has been
shown that the properties of neurons and synapses can vary several fold, and it
is not uncommon for properties, either at the cellular or synaptic level, to

64
compensate each other and generate a similar output (Marder, 2011; Marder and
Taylor, 2011). Overall, the preferred frequency and the pyloric frequency are not
determined by a sole factor, but by the combination effects of many parameters.
We demonstrated that some factors influence the preferred frequency and
the pyloric frequency in the same way. However, these results do not necessary
mean the preferred frequency determines the pyloric frequency directly. It is
possible that the preferred frequency and the pyloric frequency share some
common underlying mechanisms, such as voltage-gated ion channels, and that
changes in the voltage range and the top 75-100% slope modify these underlying
mechanisms which in turn alter the preferred frequency and the pyloric frequency
together. Nevertheless, we provide an example that the properties (the voltage
range and the top 75-100% slope) of the neuron in the network can be good
indicators for the properties (pyloric frequency) of the network's activity.
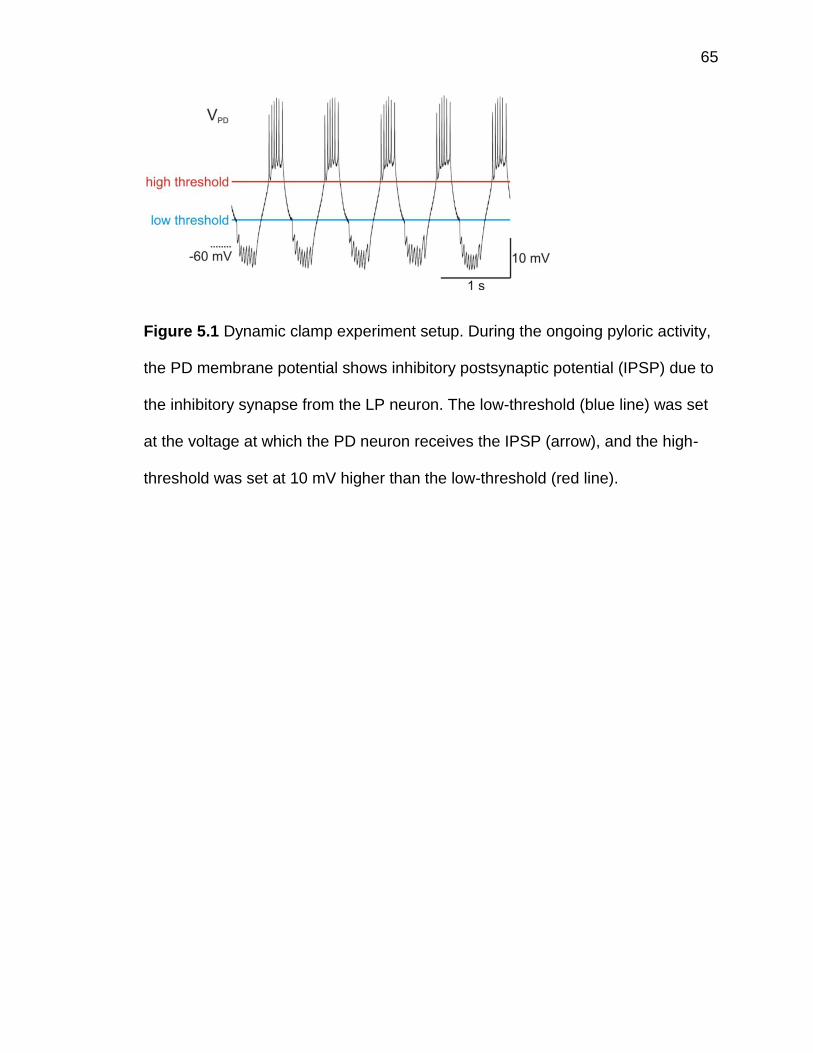
65
Figure 5.1 Dynamic clamp experiment setup. During the ongoing pyloric activity,
the PD membrane potential shows inhibitory postsynaptic potential (IPSP) due to
the inhibitory synapse from the LP neuron. The low-threshold (blue line) was set
at the voltage at which the PD neuron receives the IPSP (arrow), and the high-
threshold was set at 10 mV higher than the low-threshold (red line).
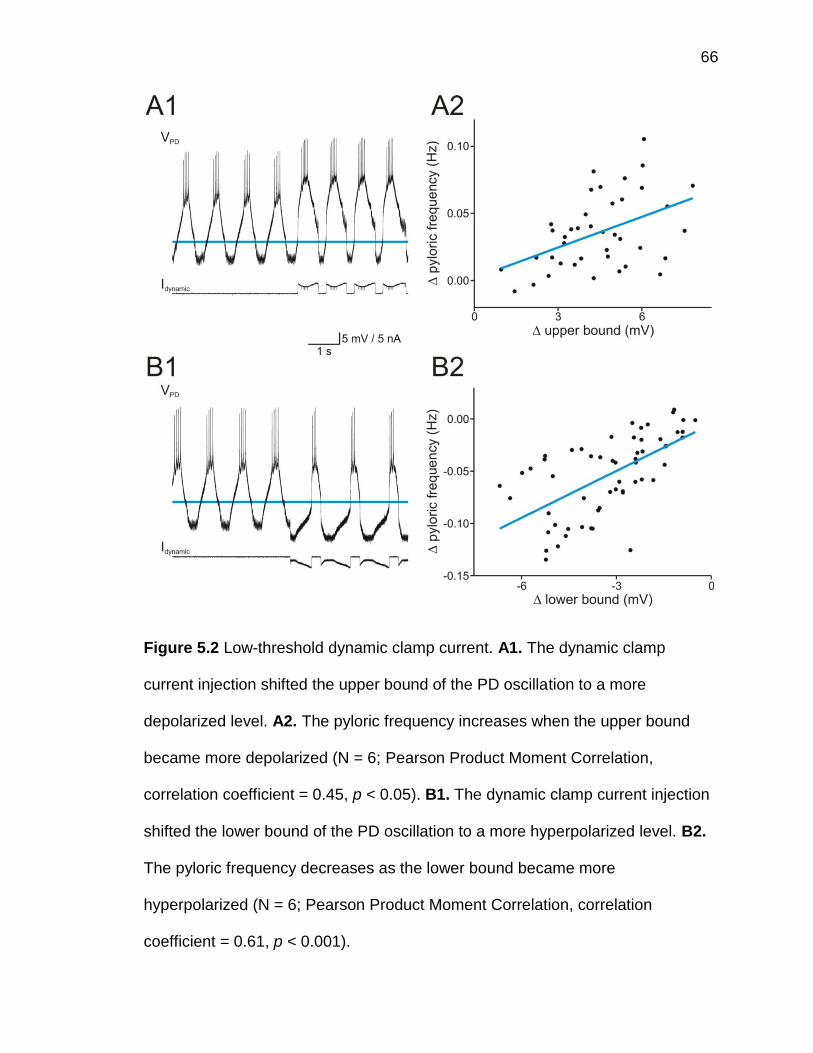
66
Figure 5.2 Low-threshold dynamic clamp current. A1. The dynamic clamp
current injection shifted the upper bound of the PD oscillation to a more
depolarized level. A2. The pyloric frequency increases when the upper bound
became more depolarized (N = 6; Pearson Product Moment Correlation,
correlation coefficient = 0.45, p < 0.05). B1. The dynamic clamp current injection
shifted the lower bound of the PD oscillation to a more hyperpolarized level. B2.
The pyloric frequency decreases as the lower bound became more
hyperpolarized (N = 6; Pearson Product Moment Correlation, correlation
coefficient = 0.61, p < 0.001).
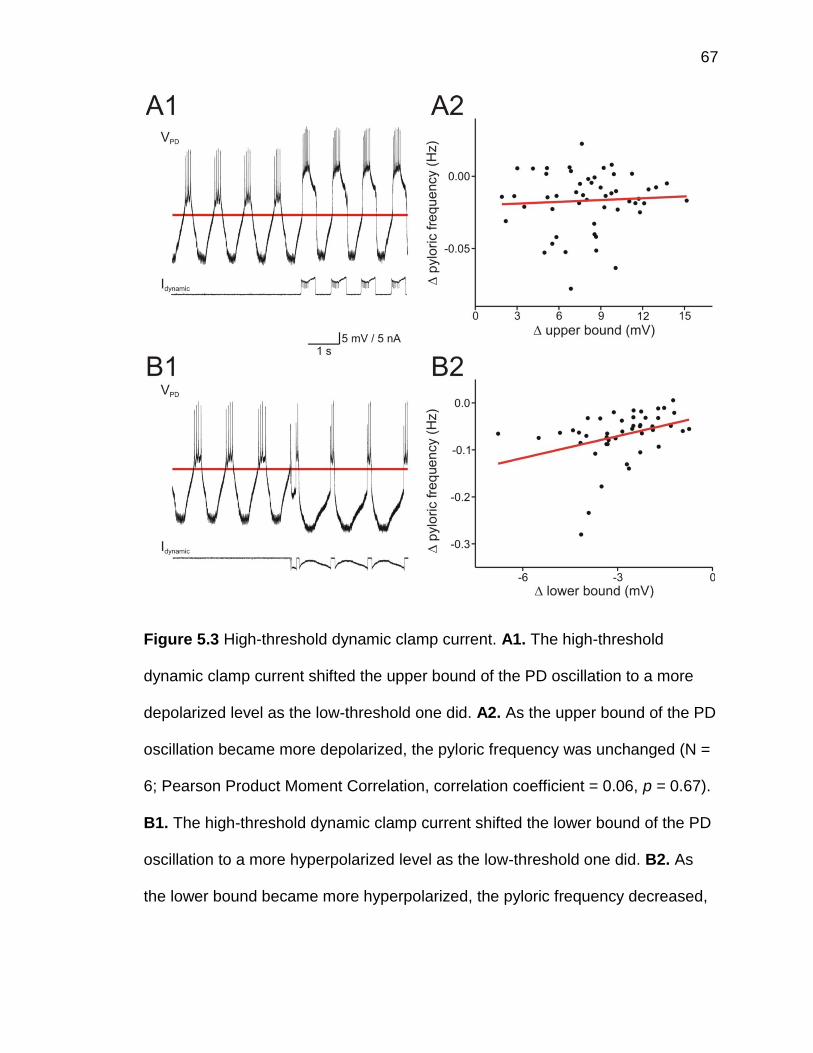
67
Figure 5.3 High-threshold dynamic clamp current. A1. The high-threshold
dynamic clamp current shifted the upper bound of the PD oscillation to a more
depolarized level as the low-threshold one did. A2. As the upper bound of the PD
oscillation became more depolarized, the pyloric frequency was unchanged (N =
6; Pearson Product Moment Correlation, correlation coefficient = 0.06, p = 0.67).
B1. The high-threshold dynamic clamp current shifted the lower bound of the PD
oscillation to a more hyperpolarized level as the low-threshold one did. B2. As
the lower bound became more hyperpolarized, the pyloric frequency decreased,

68
as in the low-threshold dynamic clamp experiments (N = 6; Pearson Product
Moment Correlation, correlation coefficient = 0.35, p < 0.05).

69
Figure 5.4 Waveform parameters during the dynamic clamp current injection. A.
The waveforms during the low-threshold (left) and high-threshold dynamic
current injection were overlapped with the waveforms before the injection. The
top 75-100% slope became steeper during the high-threshold dynamic current
injection but not during the low-threshold dynamic current injection. B. During the
high-threshold dynamic current injection, the top 75-100% slope became steeper
when the upper bound of the oscillation was pushed higher (N = 6, r = 0.39, p <
0.01, slope = 0.13). The top 75-100% slope slightly decreased during the low-
threshold dynamic current injection (N = 6, r = 0.36, p < 0.05, slope = -0.03). C
and D. The area and the portion above 75% increased during both the low-
threshold and high-threshold dynamic current injection, although they increased
more during the low-threshold situation.

70
Chapter 6: Frequency-dependence of the action potential phase
This chapter describes preliminary results of ongoing experiments dealing with
the phase of action potentials.
Introduction
Most neurons, beside the AB neuron, in the pyloric network are motor
neurons, and in the crab their action potentials directly control the muscle around
the stomach (Marder and Bucher, 2007). The phases of the action potentials in
the pyloric network, therefore, are important for proper feeding behavior. Studies
have shown that the same type of pyloric neuron generates the burst of action
potentials at similar phases among different individuals (Bucher et al., 2005).
However, it is still unclear how the phase of the action potential changes with the
frequency within the same individual.
In this study, we looked at the phase of the action potential of a neuron
when it was oscillating at different frequencies. We showed that the phase of the
first action potential depended on the oscillatory frequency. Because the onset of
the first action potential is the start of the burst, our results indicate the phase of
the burst changes with the frequency of the oscillation.
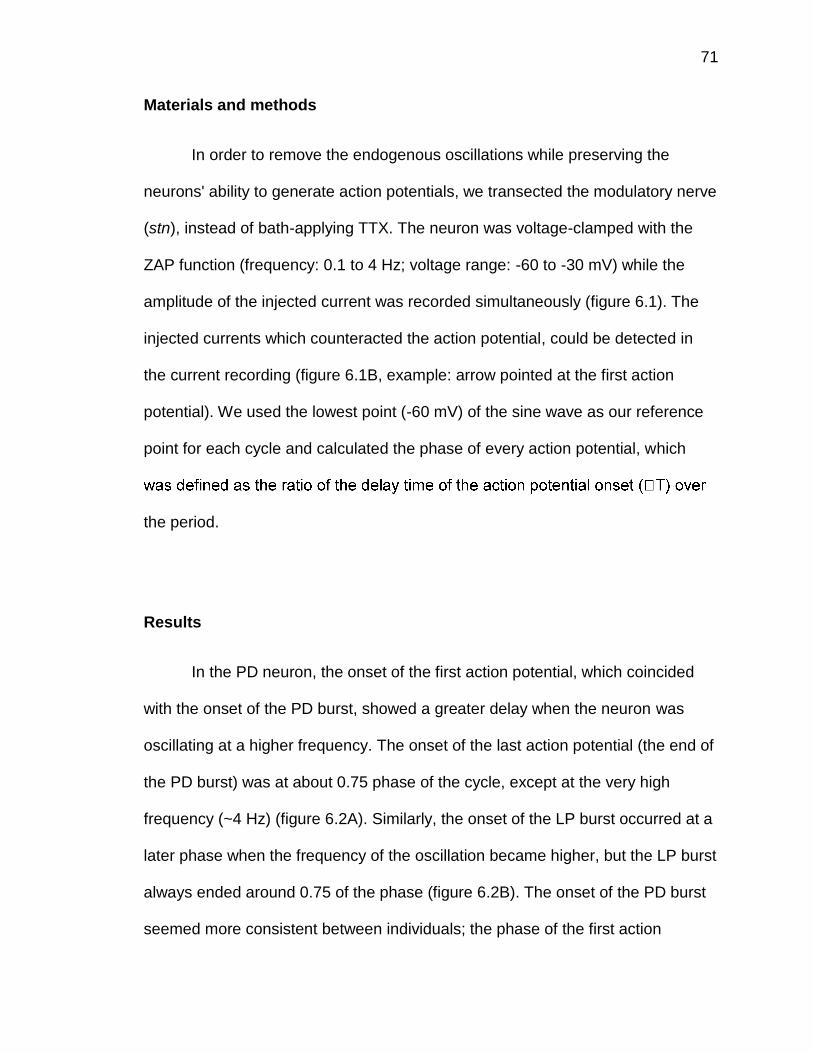
71
Materials and methods
In order to remove the endogenous oscillations while preserving the
neurons' ability to generate action potentials, we transected the modulatory nerve
(stn), instead of bath-applying TTX. The neuron was voltage-clamped with the
ZAP function (frequency: 0.1 to 4 Hz; voltage range: -60 to -30 mV) while the
amplitude of the injected current was recorded simultaneously (figure 6.1). The
injected currents which counteracted the action potential, could be detected in
the current recording (figure 6.1B, example: arrow pointed at the first action
potential). We used the lowest point (-60 mV) of the sine wave as our reference
point for each cycle and calculated the phase of every action potential, which
the period.
Results
In the PD neuron, the onset of the first action potential, which coincided
with the onset of the PD burst, showed a greater delay when the neuron was
oscillating at a higher frequency. The onset of the last action potential (the end of
the PD burst) was at about 0.75 phase of the cycle, except at the very high
frequency (~4 Hz) (figure 6.2A). Similarly, the onset of the LP burst occurred at a
later phase when the frequency of the oscillation became higher, but the LP burst
always ended around 0.75 of the phase (figure 6.2B). The onset of the PD burst
seemed more consistent between individuals; the phase of the first action

72
potential from three experiments overlapped with each other. On the other hand,
the onset of the LP burst was more variable.
Discussion
Traditionally, action potentials are generated when the membrane
potential reaches a certain threshold. Accordingly, we would expect that the first
action potential occurs at a fixed phase at all frequencies during the ZAP
oscillation, because the sine waveform always crosses a certain voltage at a
certain phase, regardless of the frequency. However, our results show that the
onset of the first action potential depends on the frequency. One possible
explanation is that along with the voltage, the slope of the membrane potential
also influences the initiation of the action potential. In the ZAP oscillation, the
slope of a certain phase in each cycle increases as the frequency goes higher.
This can be further determined by voltage-clamping the neuron with ramp
waveforms having different slopes and measuring the voltage and the slope at
which the first action potential occurs.
In conclusion, we have shown that the phase of the first action potential,
and therefore the onset of the burst, depends on the frequency of the oscillation.
This frequency-dependence might be related to the slope of the membrane
potential. However, the detailed mechanism and functional significance of this
frequency-dependence needs further investigation.

73
Figure 6.1 Action potentials during an oscillation. A. The neuron was voltage-
clamped with the ZAP oscillation (top trace; frequency: 0.1 to 4 Hz; voltage range:
-60 to -30 mV) and the injected current was recorded simultaneously (bottom
trace). B. A close-up of one cycle shown in A. Under the voltage-clamp, the
current recording showed the inward current of action potential. The arrow
indicates the first action potential in the cycle.
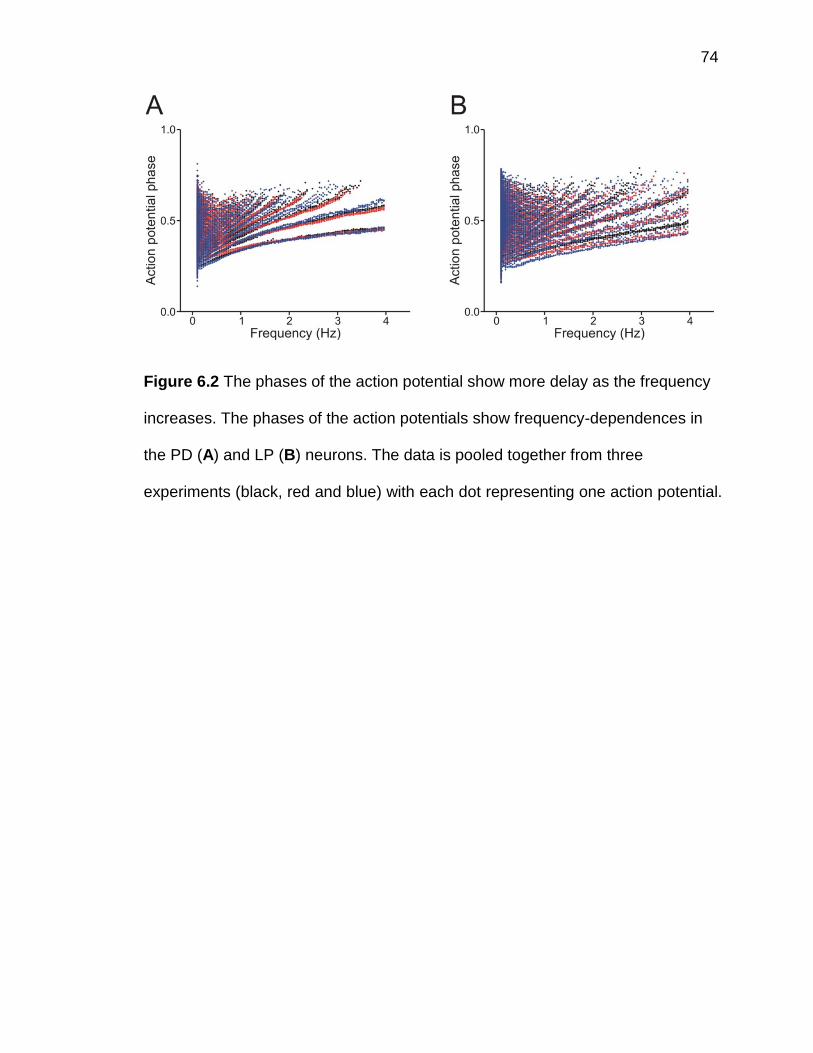
74
Figure 6.2 The phases of the action potential show more delay as the frequency
increases. The phases of the action potentials show frequency-dependences in
the PD (A) and LP (B) neurons. The data is pooled together from three
experiments (black, red and blue) with each dot representing one action potential.
75
Chapter 7: The frequency-dependence of the IPSC amplitude
Introduction
Synaptic interactions play an important role in shaping neural network
output. In an oscillatory network, the interactions between the neural intrinsic
properties and the synaptic outputs could be crucial for generating the rhythmic
activity or for determining the properties (i.e., frequency and phase pattern) of
network activity. In the pyloric network, inhibitory synapses from the oscillatory
pacemaker neurons drive the follower neurons to produce rhythmic activity;
without synaptic inputs from the pacemaker neurons, the follower neurons either
become silent or fire tonically. Because the synaptic interactions are critical for
the network activity and the neurons in the network are constantly oscillating, it is
important to understand how the synaptic outputs respond to the presynaptic
oscillation at different frequencies.
Short-term plasticity of synapses has been reported in both vertebrates
and invertebrates (Connelly et al., 2010; Doussau et al., 2010; Kandaswamy et
al., 2010). The amplitude of the synaptic current can either increase (facilitation)
or decrease (depression) during repetitive stimulation, and the level of facilitation
or depression is dependent on the frequency and duration of the stimulus
(Rabbah and Nadim, 2005; Connelly et al., 2010; Kandaswamy et al., 2010). In
the pyloric network, short-term synaptic depression has been reported in the
synapses from the pacemaker AB/PD neurons to the follower LP and PY

76
neurons (Rabbah and Nadim, 2005) and from the LP neuron to PD and PY
neurons (Mamiya and Nadim, 2005). The characteristics of short-term
depression of individual synapses are important for proper network activity
(Mamiya and Nadim, 2005). In a simple inhibitory oscillator-follower model,
synapses without short-term depression result in a fixed delay between the
oscillator and follower bursting and fail to maintain a proper phase relationship.
With short-term depression, the phase relationship is maintained over a wide
frequency range of oscillation (Manor et al., 2003; Bose et al., 2004). A similar
result is also observed in a more realistic PD-LP/PY model (Mouser et al., 2008).
These findings indicate that the synaptic amplitude could vary depending on the
frequency of the presynaptic oscillation.
Here we show that the synapses between the AB/PD and LP neuron
produce larger currents when the presynaptic neurons were oscillating at certain
(preferred) frequencies than at other frequencies. The preferred frequency of the
LP to PD synapse became higher when the upper bound of the presynaptic
voltage waveform was shifted to a more depolarized level. The preferred
frequency of this synapse was also positively correlated with the preferred
frequency of the LP neuron. Finally, to have the strongest resonance, the upper
bound of the presynaptic oscillation has to be within the dynamic range of the
synaptic current. Overall, the synaptic output depends on the frequency of
oscillation, and this frequency-dependence varies with the voltage range of the
presynaptic oscillation.
77
Materials and methods
Frequency-dependence of synaptic current
The preparation bathed in saline containing 10-7 M TTX (tetrodotoxin,
Biotium) to remove the endogenous oscillations and the spike-mediated
neurotransmitter release. The presynaptic neuron was voltage-clamped with the
ZAP oscillation while the postsynaptic neuron was voltage-clamped at -40 mV to
measure the postsynaptic current. The ZAP oscillation started with three 0.1 Hz
pre-cycles and then the frequency increased from 0.1 to 4 Hz in 100 seconds.
The voltage ranges of presynaptic oscillation depended on experimental design.
For the upper-bound shift experiment, we used three values for the upper bound
(-34, -30 and -26 mV) and a fixed lower bound at -60 mV. The lower-bound shifti
experiments were done with a fixed upper bound (-30 mV) and various lower
bounds (-70, -60 and -50 mV). The frequency-dependence profiles were
generated with Matlab scripts as described below. We discarded the pre-cycles
to avoid any possible transient effects. The ZAP oscillation of the membrane
potential was divided into individual cycles, and we extracted the frequency and
the amplitude of postsynaptic current from each oscillatory cycle. The remaining
data was then fit with a 7-variable polynomial equation. The preferred frequency
was defined as the peak frequency of the fit curve.
The strength of synaptic resonance
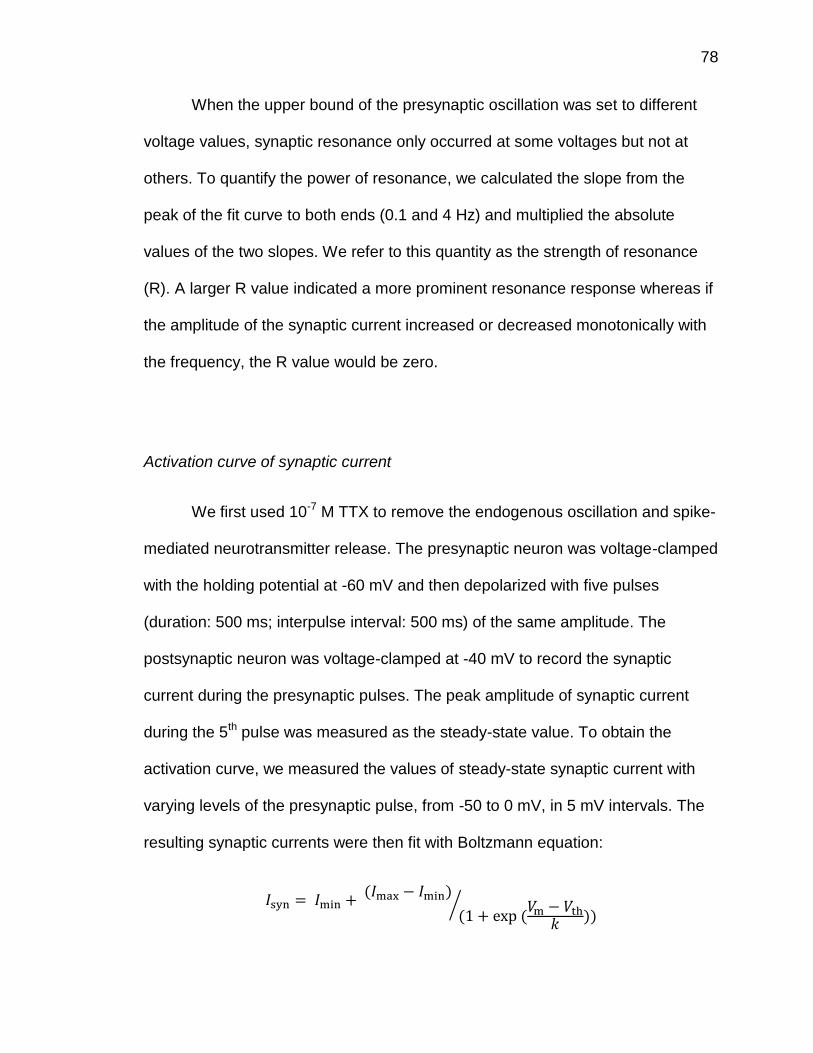
78
When the upper bound of the presynaptic oscillation was set to different
voltage values, synaptic resonance only occurred at some voltages but not at
others. To quantify the power of resonance, we calculated the slope from the
peak of the fit curve to both ends (0.1 and 4 Hz) and multiplied the absolute
values of the two slopes. We refer to this quantity as the strength of resonance
(R). A larger R value indicated a more prominent resonance response whereas if
the amplitude of the synaptic current increased or decreased monotonically with
the frequency, the R value would be zero.
Activation curve of synaptic current
We first used 10-7 M TTX to remove the endogenous oscillation and spike-
mediated neurotransmitter release. The presynaptic neuron was voltage-clamped
with the holding potential at -60 mV and then depolarized with five pulses
(duration: 500 ms; interpulse interval: 500 ms) of the same amplitude. The
postsynaptic neuron was voltage-clamped at -40 mV to record the synaptic
current during the presynaptic pulses. The peak amplitude of synaptic current
during the 5th pulse was measured as the steady-state value. To obtain the
activation curve, we measured the values of steady-state synaptic current with
varying levels of the presynaptic pulse, from -50 to 0 mV, in 5 mV intervals. The
resulting synaptic currents were then fit with Boltzmann equation:

79
where Isyn was the amplitude of the synaptic current at membrane potential Vm,
Imax and Imin were the maximal and minimal values of synaptic current,
respectively, Vth was the half-activation voltage and k was a constant. When the
presynaptic neuron was depolarized to its half-activation voltage (Vth), the
synaptic current was at 50% of its maximal value.
Neuromodulator
A stock solution of the peptide proctolin was prepared in distilled water at
a concentration of 10-3 M and stored in small aliquots at -20 °C. During proctolin
treatment, the final concentration of 10-7 M proctolin in physiological saline was
superfused for a minimum of 20 minutes before measurements were obtained.
The LP voltage range and the synaptic activation curve during the ongoing
activity
To measure the voltage range of the LP neuron during the ongoing activity,
we low-pass filtered the LP membrane potential recording at 10 Hz to reveal the
LP slow-oscillation. The voltages of the upper and lower bounds of the LP slow-
oscillation were measured using the Readscope software. To calculate the
activation curve of the LP to PD synapse, we voltage-clamped both the
presynaptic LP neuron and the postsynaptic PD neuron and measured the
steady-state synaptic current with depolarized pulses at different voltages as

80
described above. However, without TTX treatment, we lacked good control of
membrane potential when it was close to 0 mV. Therefore, when performing the
Boltzmann fit, we used the voltage value measured from the actual membrane
potential recording, not those set in the protocol.
Results
In oscillatory networks, the neurons and synapses may possess
frequency-dependent properties, and these properties could play an important
role in determining the characteristic of network activity. Previous chapters have
shown that the neurons in the pyloric network exhibit preferred frequencies, and
that there are correlations between the preferred frequency of the pacemaker
neuron and the frequency of the network. In this and subsequent chapters, we
investigated the possible frequency-dependence of the synaptic properties,
specifically the synaptic currents of graded synapses (this chapter) and the peak
phase of the synaptic current (chapter 8) between the pacemaker AB/PD
neurons and the follower LP neuron.
First, we examined whether there is a frequency-dependence of the
graded synapse by measuring the synaptic current after TTX treatment. The
application of TTX removed both the endogenous oscillation of the network
activity and the production of action potentials, leaving only the graded
component of the synaptic current. Oscillations were imposed in the presynaptic
neuron by voltage-clamping the presynaptic neuron with a ZAP function

81
(frequency: 0.1 to 4Hz, voltage: -60 to -30 mV) and the postsynaptic current was
recorded simultaneously (PD to LP: figure 7.1A; LP to PD: figure 7.1B). The
amplitude of the synaptic current in each cycle during the ZAP function was then
plotted against the frequency to produce the frequency-dependence profile of the
synaptic current. The profile showed that, in both the AB/PD to LP synapse and
the LP to PD synapse, as the frequency of presynaptic oscillation increased, the
graded-synaptic currents also increased at the beginning and then decreased
over time (PD to LP: figure 7.1A; LP to PD: figure 7.1D). The synaptic currents
showed resonance, and there were preferred frequencies at which the synaptic
currents reached their peak values (red arrow in figure 7.1C and 7.1D). The
preferred frequencies of the graded-synaptic currents were lower than the
preferred frequencies of the respective presynaptic neurons and the natural
pyloric frequency (N = 16; one-way ANOVA, *: p < 0.05; PD to LP: 0.49±0.11 Hz,
LP to PD: 0.70±0.13 Hz, PD: 0.97±0.18 Hz, LP: 1.42±0.41 Hz, network:
1.24±0.33 Hz; figure 7.1E).
The neurotransmitter release of graded synapses are dependent on the
presynaptic membrane potential, so we were interested to determine how the
different voltage ranges of presynaptic oscillation affect the preferred frequency
of the synaptic current. To address this question, we shifted the upper bound of
the oscillating voltage to different levels (-34, -30 and -26 mV) while keeping the
lower bound at a fixed value (-60mV) or, alternatively, shifted the lower bounds (-
70, -60 and -50 mV) while kept the upper bound fixed (-30 mV). For the synaptic
current from the AB/PD to LP neuron, the peaks of the frequency-dependence

82
profile were similar in all voltage ranges tested (upper bound: figure 7.2A1; lower
bound: figure 7.2B1) and shifting the lower or upper bounds of the presynaptic
oscillation had no significant effect on the synaptic preferred frequency (upper
bound, N = 11, one-way ANOVA, p = 0.700, -34 mV: 0.51±0.08 Hz, -60 mV:
0.49±0.12 Hz, -26 mV: 0.52±0.12 Hz, figure 7.2A2; lower bound: N = 10, one-
way ANOVA, p = 0.191, -70 mV: 0.49±0.09 Hz, -60 mV: 0.51±0.06 Hz, -50 mV:
0.56±0. 09 Hz; figure 7.2B2). We also tested the presynaptic PD oscillations with
more depolarized upper bounds, and the synaptic preferred frequency was
unchanged even when the upper bound was as high as -15 mV (N = 5; one-way
ANOVA, p = 0.648; figure 7.2C).
On the other hand, the synaptic current from the LP to PD neuron had
different responses to changes in the voltage range. The peaks of the frequency-
dependence profile did not move when the lower bound was shifted (figure 7.3B1)
but increased as the upper bound became more depolarized (figure 7.3A1).
Analysis showed that while changing the lower bound of LP oscillations did not
significantly affect the preferred frequency of the synaptic current from the LP to
PD neuron (N = 10; one-way ANOVA, p = 0.751; -70 mV: 0.76±0.19 Hz, -60 mV:
0.75±0.18 Hz, -50 mV: 0.81±0.20 Hz; figure 7.3B2), moving the upper bound of
the LP oscillation to a higher level increased the preferred frequency (N = 9; one-
way ANOVA, p < 0.001; -34 mV: 0.44±0.10 Hz, -60 mV: 0.70±0.13 Hz, -26 mV:
0.84±0.07 Hz; figure 7.3A2).
Because both neurons and synaptic currents exhibit preferred frequencies,
whether there is any correlation between their preferred frequencies become an

83
interesting question. We combined the data from all the voltage ranges examined
above (three voltage ranges per experiment) and compared the synaptic
preferred frequencies to the preferred frequencies of the presynaptic neuron.
While the preferred frequency of the PD to LP synapse showed no correlation
with the preferred frequency of the PD neuron (N = 15; Pearson Product Moment
Correlation, correlation coefficient = 0.26, p = 0.08; figure 7.4A), the LP to PD
synapse with a higher preferred frequency tended to pair with the LP neuron with
the higher preferred frequency (N = 18; Pearson Product Moment Correlation,
correlation coefficient = 0.63, p < 0.001; figure 7.4B).
The synapse from the LP to PD neuron is the sole feedback synapse to
the pacemaker neurons, and its frequency-dependent properties show more
sensitivity to the upper bound of the presynaptic LP oscillation. Therefore, we
further examined the frequency-dependent property of this synapse in a larger
range of the upper bound of the presynaptic oscillation, from -40 to 0 mV, in 5
mV intervals. An example is shown in figure 7.5. When the upper bound was at
or below -35 mV, the synaptic current was small and the frequency-dependent
profile showed no resonance (figure 7.5A, yellow line). As the upper bound
increased to -30 mV, the resonance started to emerge (figure 7.5A, blue line).
Increasing the upper bound to -25 mV produced clear resonance (figure 7.5A,
red line). However, further pushing the upper bound above -20 mV resulted in a
flatter profile (figure 7.5A, black line). Because the frequency-dependent profiles
of the synaptic current changed radically as the upper bound moved from -40 to
0 mV, we used "the strength of resonance" (R, figure 7.5B; see Methods) to
84
characterize these profiles. When the frequency-dependence profile decreases
or increases monotonically, the peak will be at the end of the profile and one
slope is zero; thus, the R value will be zero. The larger the synaptic current at the
preferred frequency compared with the current at other frequencies, the higher
the R value will be. The result showed that the R value is voltage-dependent on
the upper bound of presynaptic oscillation (figure 7.5C). When the upper bound
of oscillating voltage increased, the R value first increased and then decreased,
and there existed a specific upper bound value for the presynaptic oscillation at
which the synaptic current showed strongest resonance (-35 mV for the example
shown in figure 7.5C).
We noticed that the upper bound required for the strongest synaptic
resonance was different between individuals. One possibility is that the voltage-
dependence of the resonance is related to other voltage-dependent properties of
synapse. A well-known voltage-dependent property of graded synapses is the
amount of neurotransmitter release, which can be represented by the activation
curve of the synaptic current. The activation curve shows the amplitudes of
steady state synaptic current when the presynaptic neuron is voltage-clamped
with repetitive pulses, which depolarize the presynaptic neuron to different
voltage levels. There is a voltage (half-activation voltage) at which the synaptic
current reaches the 50% of its maximum value. In the voltage range (dynamic
range) around the half-activation voltage, the synaptic current increased or
decreased rapidly with the voltage. We hypothesized that the strongest synaptic
resonance occurs when the upper bound of the presynaptic oscillation is within

85
the dynamic range of the synapse. This hypothesis predicts that when the
activation curve is modified and there is a shift of the half-activation voltage, the
voltage of the upper bound producing the strongest resonance should move in
the same direction as the shift of the half-activation voltage. To test this
hypothesis, we measured the R values and the half-activation voltage of the
synaptic current in 13 experiments in control and during the 10-7M proctolin
treatment. The neuromodulator proctolin is known to enhance the LP to PD
synaptic current (Zhao et al., 2011). Among the 13 experiments, most showed
shifts of the half-activation voltage toward more hyperpolarized levels during the
proctolin treatment (figure 7.6A), and, as our hypothesis predicted, the voltages
of the upper bound producing the strongest resonance also moved to lower
voltages (figure 7.6B). In a few experiments, the proctolin treatment had no effect
on the half-activation voltage, and the voltage of the upper bound producing the
strongest resonance also remained the same in the control condition and during
the proctolin treatment, which also agreed with our hypothesis. Furthermore,
there was a correlation between the half-activation voltage and the voltage of the
upper bound producing the strongest resonance (N = 13; Pearson Product
Moment Correlation, correlation coefficient = 0.50, p < 0.01; figure 7.6C). Thus,
the half-activation voltage of the synapse could be a good indicator for the
voltage of the upper bound required for producing the strongest resonance.
Finally, proctolin also enhanced the maximal R value of the synaptic current by
563% (N = 13; paired Student's t-test, p = 0.002; figure 7.6D).

86
Because the resonance of the synaptic current only occurs when the
presynaptic neuron is oscillating at certain voltage ranges, we examined if the
upper bound of the LP oscillation is within the dynamic voltage range of the LP to
PD synapse during the ongoing pyloric activity. If yes, then it is likely that the
resonance of the LP to PD synapse plays a functional role during ongoing pyloric
activity. To address this, we recorded the LP membrane potentials during the
ongoing pyloric activity (figure 7.6A, blue trace) and then filtered these recordings
with a 10 Hz low-pass filter to generate the slow-waves of the LP neuron (figure
7.6A, red trace). The voltage ranges of the slow waveform were measured with
the Readscope software, and the upper bounds of the slow waveforms were
compared with the half-activation voltages of the LP to PD synaptic current in the
same preparation. Our results showed that the voltage range of the LP slow
waveform included the half-activation voltage of the synaptic current, indicating
that synaptic resonance likely exists in the pyloric network under naturally
ongoing activity (figure 7.6B).
Discussion
Synapses and neurons are two fundamental components of every neural
network. Short-term synaptic dynamics allow the synaptic current to vary its
amplitude based on the presynaptic neuron’s activity. In an oscillatory network,
the presynaptic neuron could oscillate at different frequencies and voltage ranges.
As a result, knowing how the synapses respond under different frequencies is
87
critical to understand how an oscillatory network maintains its function. Our study
shows that the amplitude of the synaptic current is frequency-dependent. More
importantly, in some synapses, these frequency-dependencies are adjustable by
altering the voltage range of the presynaptic neuron and/or modulating the
activation curve of the synapse, thus providing the network possible ways to
regulate the frequency-dependence of its synapses in response to different
needs.
Synaptic dynamics have been shown to be present in many neural
systems. Repetitive stimulation can either increase (facilitation) or decrease
(depression) the amplitude of the synaptic current, and the levels of increase or
decrease depend on the frequency of the stimulation. If facilitation occurs at low
frequencies and depression happens at the high frequencies, the frequency-
dependence profile of the synaptic current will have a preferred frequency
(Izhikevich et al., 2003). During the repetitive pulse stimulation, the graded
synapse from the LP to the PD neuron exhibits short-term depression (Mamiya
and Nadim, 2005) and facilitation in modulatory conditions (Zhou et al., 2007).
When stimulated with an oscillatory realistic waveform, the inhibitory postsynaptic
potential (IPSP) shows resonance. One possible explanation is that as the
frequency increase, the inactivation of Ca2+ channel decreases, resulting in a
initial increase in the postsynaptic potential before the depression occurs (Manor
et al., 1997).The IPSP is generated by the interactions between the synaptic
current and the voltage-gated ion channels in the postsynaptic neuron. By
measuring the synaptic current, we showed that the synapse itself has

88
resonance and the resonance in the IPSP is not solely from the voltage-gated ion
channels in the postsynaptic neuron.
The preferred frequency of the pacemaker PD neuron increases when the
voltage range of the oscillation increases, while the preferred frequency of the LP
neuron is only affected by the upper bound of the voltage range. The preferred
frequency of the PD to LP synapse is not affected by the presynaptic PD voltage
range, and only shifting the upper bound of the LP oscillation has effects on the
LP to PD synaptic preferred frequency, not the lower bound. One possible
explanation is that we generated the oscillation in the PD neuron, not in the AB
neuron, whose synapse produces the major synaptic current from the pacemaker
to the follower neurons in crab. The 4 mV shifts in the upper bound of the PD
oscillation might only have little changes on the upper bound of the AB neuron
and therefore had no significant influence on the preferred frequency of the
AB/PD to LP synapse. However, shifting the upper bound of the PD neuron to a
more depolarized level (from -30 to -15 mV), which should move the AB upper
bound higher, still fails to generate any significant change in the frequency-
dependent properties of the AB/PD to LP synapse. Therefore, a lack of an effect
of changing the upper bound of the PD oscillation is not because we failed to
alter the upper bound of the AB neuron.
Unlike the preferred frequency of the PD neuron, which closely resembles
the frequency of the network output during ongoing network activity (about 1 Hz),

89
the preferred frequencies of both the AB/PD to LP and the LP to PD synaptic
currents are significantly lower than the pyloric frequency and the preferred
frequency of the presynaptic neurons. However, the synaptic current still shows
frequency-dependence around the natural frequency of the pyloric activity. When
the pyloric frequency becomes slower than 1 Hz, the synaptic current from the
LP to PD neuron gets larger and occurs at an earlier phase, which is consistent
with the change in the postsynaptic potential previously reported by our lab
(Mamiya and Nadim, 2004). As a result, the LP to PD synapse generates a
greater compensation if the perturbation decreases the frequency of the pyloric
activity.
An interesting question is the connection between the preferred frequency
of the synapse and that of the presynaptic neuron. The preferred frequency of
the LP to PD synapse has been correlated with the preferred frequency of the
presynaptic LP neuron. Shifting the upper bound of the oscillation has similar
effects on both the neural and the synaptic preferred frequencies, while shifting
the lower bound has no effect on either. These similarities indicate that the same
type of ion channel, possibly the Ca2+ channel, may be involved in both the
preferred frequencies of the LP neuron and of the LP to PD synapse. The
preferred frequency of the PD neuron and of the AB/PD to LP synapse showed
no correlation and responded differently to the shift of voltage range, indicating
that different types of ion channel are behind these preferred frequencies.
The activation of graded synapses depends on the presynaptic membrane
potential. A typical method to measure the activation of a synapse is to record
90
the steady state synaptic current during repetitive pulse stimulation with the
different upper bounds. The voltage-dependence of the synaptic current can be
divided into three ranges: non-activation, dynamic and saturated. No activation
occurs when the upper bound of the pulse is low and there is no synaptic current.
The dynamic range occurs as the upper bound of the pulse becomes more
depolarized and the amplitude of the synaptic current increases rapidly from its
minimum to its maximum value. The saturated range occurs after the membrane
potential reaches a certain voltage where further depolarizing the membrane
potential results in no increase in the synaptic current and the synaptic current
maintains its maximal value. The midpoint voltage of the dynamic range is near
the half-activation voltage of the synaptic current. The synaptic current has the
largest voltage-sensitivity around the half-activation voltage; any depolarization
or hyperpolarization of membrane potential from the half-activation point will,
respectively, increase or decrease the amplitude of the synaptic current. On the
other hand, the amplitude of the synaptic current is maintained at its minimum
when membrane potential is in the low non-activation range and at its maximum
when the membrane potential is in the saturated range.
The voltage-dependence of the strength of synaptic resonance in our
experiment is correlated to the voltage-dependent activation of the graded
synapse. The presynaptic oscillation with upper bound in the non-activation
range of the synaptic activation curve produced a minimal, close to zero, synaptic
current, and even if it is enhanced at a certain frequency, the difference is barely
detectable. The oscillation with the upper bound in the saturated range pushes
91
the synaptic current close to its maximum value, so after a small increase in the
synaptic current, the current reaches it maximum and cannot be enhanced more,
resulting in less resonance in the frequency-dependent profile. Only when the
upper bound of the presynaptic oscillation is within the dynamic range of the
synaptic activation curve, the synaptic current is large enough that the
enhancement in the current is noticeable, and small enough that it will not reach
its maximum. Thus, the strongest resonance occurs when the upper bound of the
presynaptic oscillation is at the half-activation point of the synapse, where the
synaptic current has the largest freedom to either increase or decrease.
The observation that the strength of the resonance of a synaptic current
depends on the voltage of presynaptic oscillation shows a possible way for a
neural network to regulate the synaptic resonance within the network. By shifting
the voltage range of oscillations, the network can switch the synaptic resonance
on and off, or change the frequency-dependence of the synaptic current. Another
way to regulate the frequency-dependent response of synaptic current is by
altering the activation curve of the synapse. As we have shown in this study,
when the activation curve shifts towards the hyperpolarized or depolarized
voltage, the half-activation voltage follows and so does the voltage for the
strongest resonance. Under natural conditions, many factors can affect the
voltage range of the neuron, the activation curve of synapse or both
simultaneously. For example, neuromodulators such as proctolin are able to shift
the membrane potential of the neuron to a depolarized level and also enhance
the synaptic current. Therefore, regulation of the frequency-dependence of
92
synaptic current in the intact pyloric network may be complicated and result from
different sources.
Because the existence of synaptic resonance requires certain presynaptic
voltage ranges, it becomes an interesting question to know if it occurs in the
pyloric network during the ongoing activity. However, due to the interference of
the endogenous oscillation, it is difficult to measure the frequency-dependent
response of the synaptic current directly without TTX treatment. An alternative
way is to examine if the presynaptic neuron is oscillating at the dynamic range of
the synaptic activation curve. Our results have shown that the half-activation
voltage of synaptic current from LP to PD neuron is close to the upper bound of
the LP oscillation under natural neuromodulation. Therefore, it is likely that
resonance and hence the frequency-dependence of synaptic current exist in the
pyloric network during ongoing activity.
In conclusion, we demonstrated that the synapses in an oscillatory
network exhibit frequency-dependencies. The synaptic current could increase
with frequency of presynaptic oscillation and then decrease, producing
resonance and also have a maximal value at the preferred frequency. The
preferred frequency of the synaptic current is influenced by the oscillating voltage
of the presynaptic LP neuron; the higher the upper bound of LP oscillation is, the
higher the preferred frequency of synaptic current. Moreover, the strength of
synaptic resonance is correlated with the activation curve of the synapse, and the
strongest resonance occurs when the presynaptic neuron is oscillating with the
upper bound at the dynamic range of synapse. The frequency-dependence of the

93
synaptic current can be modified by shifting the voltage range of the presynaptic
neuron and by altering the activation curve of the synapse. Overall, this study
characterizes the frequency-dependent properties of the synaptic current and
demonstrates the potential ways for the neural network to regulate the amplitude
of the synaptic current when needed.

94
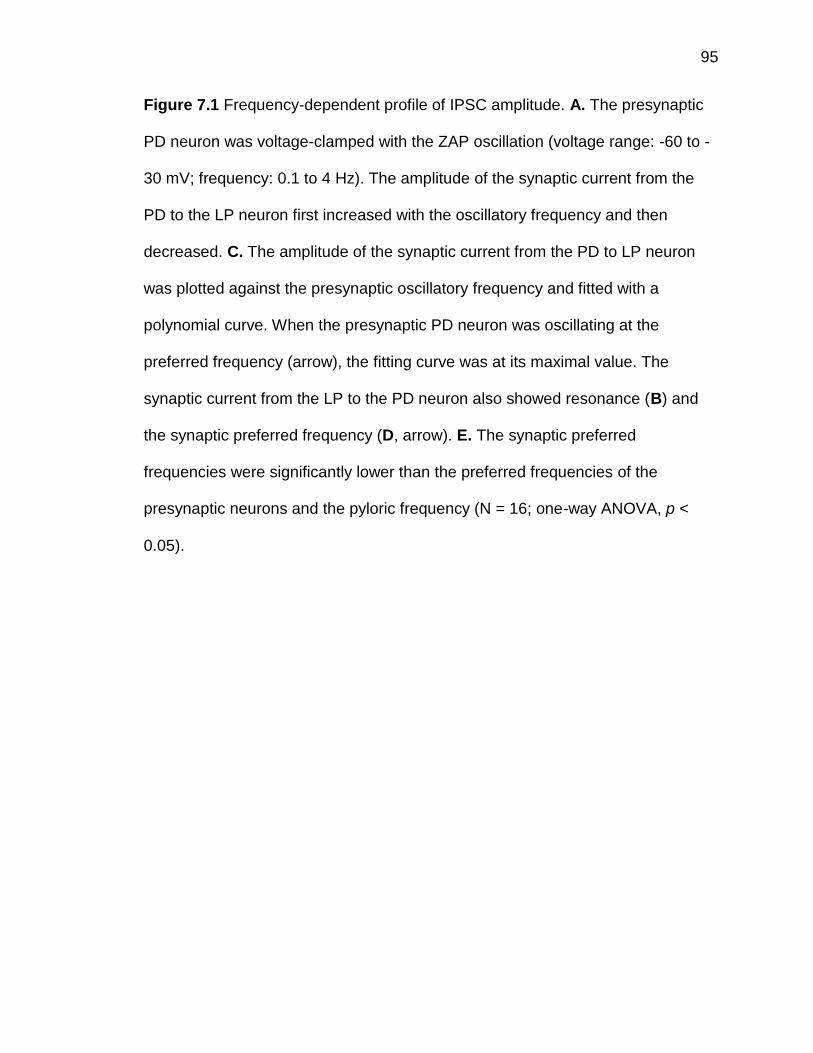
95
Figure 7.1 Frequency-dependent profile of IPSC amplitude. A. The presynaptic
PD neuron was voltage-clamped with the ZAP oscillation (voltage range: -60 to -
30 mV; frequency: 0.1 to 4 Hz). The amplitude of the synaptic current from the
PD to the LP neuron first increased with the oscillatory frequency and then
decreased. C. The amplitude of the synaptic current from the PD to LP neuron
was plotted against the presynaptic oscillatory frequency and fitted with a
polynomial curve. When the presynaptic PD neuron was oscillating at the
preferred frequency (arrow), the fitting curve was at its maximal value. The
synaptic current from the LP to the PD neuron also showed resonance (B) and
the synaptic preferred frequency (D, arrow). E. The synaptic preferred
frequencies were significantly lower than the preferred frequencies of the
presynaptic neurons and the pyloric frequency (N = 16; one-way ANOVA, p <
0.05).

96
Figure 7.2 Preferred frequency of the AB/PD to LP synapse was not affected by
the presynaptic PD voltage range. A1. The frequency-dependence profiles of the
97
AB/PD to LP synapse showed resonances when the PD neuron was oscillating
between various upper bounds (-34, -30 and -26 mV) and a fixed lower bound (-
60 mV). However, the peak of the synaptic current occurs at the very similar
frequencies. A2. The synaptic preferred frequency was not affected by the upper
bound of the presynaptic oscillation (N = 11; one-way ANOVA, p = 0.700). B1.
When the presynaptic PD neuron was oscillating between a fixed upper bound (-
30 mV) and various lower bound (-70, -60 and -50 mV), the frequency-
dependence profiles of synaptic current had the peaks at a similar presynaptic
frequency. B2. Shifting the lower bound of the presynaptic oscillation has no
effects on the synaptic preferred frequency (N = 10; one-way ANOVA, p = 0.191).
C. The synaptic preferred frequency was still not affected by the upper bound
even when the upper bound was as high as -15 mV (N = 5; one-way ANOVA, p =
0.648).

98
Figure 7.3 Only the upper bound of the presynaptic LP oscillation affects the
preferred frequency of the LP to PD synapse. A1. When the upper bound of the
presynaptic LP oscillation shifted to a more depolarized level, the peak of the
synaptic current moved to a higher frequency range (arrow). A2. The synaptic
preferred frequency increased when the upper bound of the presynaptic LP
oscillation became more depolarized (N = 9; one-way ANOVA, p < 0.001). B1.
The frequency-dependence profiles with various lower bounds (-70, -60 and -50
mV) showed the peaks of the synaptic current at the similar frequency. B2. The
99
synaptic preferred frequency was not affected by the lower bound of the
presynaptic oscillation (N = 10; one-way ANOVA, p = 0.751).

100
Figure 7.4 Correlations between the preferred frequencies of the presynaptic
neurons and the synapses. A. The preferred frequencies of the synaptic current
from the PD to LP synapses showed no correlation with the preferred
frequencies of the presynaptic PD neurons (N = 15; Pearson Product Moment
Correlation, correlation coefficient = 0.26, p = 0.08). B. When the LP to PD
synapses had higher preferred frequencies, the presynaptic LP neuron also
exhibited higher preferred frequencies (N = 18; Pearson Product Moment
Correlation, correlation coefficient = 0.63, p < 0.001). Each dot shows the
measurement at one voltage range in a single experiment. There were three
voltage ranges per experiment.
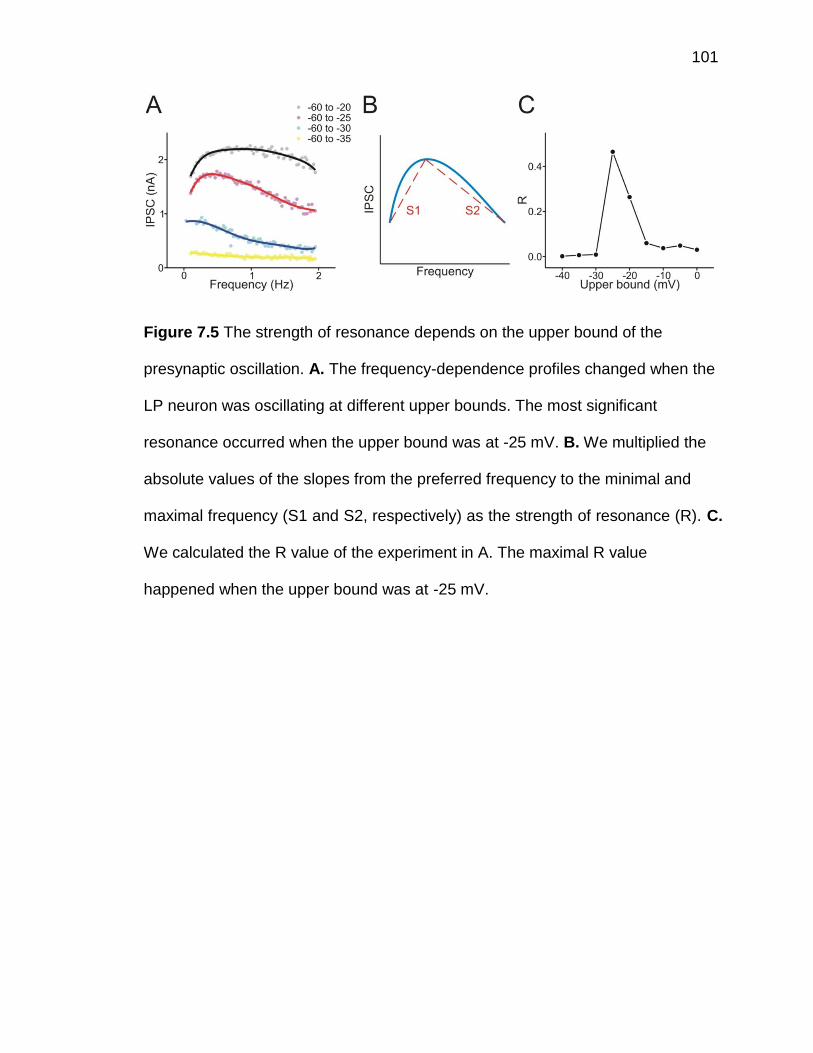
101
Figure 7.5 The strength of resonance depends on the upper bound of the
presynaptic oscillation. A. The frequency-dependence profiles changed when the
LP neuron was oscillating at different upper bounds. The most significant
resonance occurred when the upper bound was at -25 mV. B. We multiplied the
absolute values of the slopes from the preferred frequency to the minimal and
maximal frequency (S1 and S2, respectively) as the strength of resonance (R). C.
We calculated the R value of the experiment in A. The maximal R value
happened when the upper bound was at -25 mV.

102
Figure 7.6 Correlations between the voltage for maximal R and the half-
activation voltage of synapse. A. Bath-application of neuromodulator proctolin
shifted the activation curve. The amplitude of the maximal synaptic current
increased and the half-activation voltage also became more hyperpolarized. B.
The voltage of the upper bound producing the maximal R value shifted to a more
hyperpolarized level during the proctolin treatment. C. The synapse with higher
value of half-activation voltage required a higher upper bound to produce the
strongest resonance. Each experiment generated two data points; one in the
control condition and the other during the proctolin treatment (N = 13; Pearson

103
Product Moment Correlation, correlation coefficient = 0.50, p < 0.01). D. Proctolin
also enhanced the synaptic resonance. The maximal R value increased during
the proctolin bath-application (N = 13; paired Student's t-test, p = 0.002).

104
Figure 7.7 The upper bound of the LP slow-oscillation during the ongoing pyloric
activity reached the dynamic range of the synaptic current. A. The LP slow-
oscillation (red trace) is revealed by low-pass filtering the LP ongoing activity
(blue trace) at 10 Hz. B. The upper bound of the LP oscillation reached the
dynamic range of the LP to PD synaptic current.
105
Chapter 8: Frequency-dependence of the IPSC phase
Introduction
The activation of a graded synapse depends on the voltage of the
presynaptic membrane potential. Moreover, neurotransmitter release is not
instantaneous and requires a response time for the synapse to reach its peak,
even when the presynaptic depolarization occurs instantly (Rabbah and Nadim,
2007). Therefore, the shape of the synaptic current may not exactly follow the
presynaptic membrane potential, and there could be a timing difference between
the peaks of the synaptic current and the presynaptic membrane potential.
The synapse from the LP to PD neuron is the only chemical synapse
providing feedback from the pyloric follower neurons to the pacemaker kernel.
This synapse reduces the variation of the pyloric frequency by increasing or
decreasing the network frequency depending on its phase. The frequency of the
pyloric network increases when the peak of the synaptic current occurs in the
early phase of the cycle and decreases when the peak occurs in the late phase
(Mamiya and Nadim, 2004, 2005). As a result, the phase of this feedback
synapse is critical in regulating the pyloric frequency.
Here we examined the shape of the synaptic current during oscillations
and showed that the peaks of synaptic current and of the presynaptic membrane
potential could occur at different times. We used the peak of presynaptic
membrane potential as the reference point and calculated the phase difference of
106
the peak of the synaptic current. The phase difference depends on the frequency
of the presynaptic oscillation. With low frequency oscillations, the synaptic
current reaches its peak before the presynaptic membrane potential does while,
with high frequency oscillations, the synaptic current peaks after the membrane
potential. Overall, the frequency-dependence of the peak phase in the feedback
synapse can be a mechanism to maintain the pyloric activity at a certain
frequency.
Materials and methods
Phase analysis
The synaptic current during the ZAP oscillation was recorded as described
in chapter 7 and analyzed with Matlab scripts. For each cycle in the ZAP
oscillation, we measured the duration of the cycle (period) and the peak time of
the presynaptic membrane potential (TV) and the synaptic current (TC). The
phase difference was calculated as:
A negative phase difference indicated that the synaptic current reached its
peak before the presynaptic membrane potential did, and a positive phase
difference indicated that the peak of the synaptic current occurred after the peak
of the presynaptic membrane potential.

107
To simplify the analysis, we divided the frequency range (0.1 to 4 Hz) into
0.5 Hz intervals. For each interval, we referred to the averaged phase difference
from all cycles in the interval as the phase difference of that interval.
Results
In the pyloric network, the phases of synaptic current have important roles
in maintaining the proper network activity. We investigated if the frequency of
presynaptic oscillation has any effect on the phase of the synaptic current peak.
The phase difference is defined as the time difference (from the peak of the
postsynaptic current to the peak of the presynaptic voltage) divided by the period.
At low frequency, the phase difference is negative, indicating that the peak of the
postsynaptic current occurred before the peak of the presynaptic voltage (figure
8.1A, left); at high frequency, the peak of postsynaptic current has occurred after
the peak of the presynaptic membrane potential, and the phase difference is
positive (figure 8.1A, right). To provide a simple analysis, we divided the
frequency range of the ZAP function (0.1 to 4 Hz) into eight 0.5 Hz interval bins
and averaged the phase differences of every cycle in each frequency region.
When the presynaptic neurons were oscillating between -60 and -30 mV, both
synaptic currents showed negative phase differences at the lowest frequency
range (0.1 to 0.5 Hz); as the presynaptic frequencies went higher, the phase
difference turned into a positive value and increased. Moreover, the synaptic
current from the AB/PD to LP neuron showed more delay than that from LP to

108
PD neuron in all frequency ranges except the lowest one (N = 16; two-way
ANOVA, frequency: p < 0.001, *: the difference between two synapses has p <
0.001; figure 8.1B).
In general, the phase differences of the synaptic current increased with
the frequency of the presynaptic oscillation in all voltage ranges examined.
However, shifting the upper or the lower bound of the presynaptic oscillation had
different effects on the phase differences of the synapses between the AB/PD
and LP neurons. For the AB/PD to LP synapse, shifting the upper bound had no
effect (N = 11; two-way ANOVA, frequency: p < 0.001, upper bound: p = 0.624);
figure 8.2A) while increasing the lower bound of PD neuron resulted in a slightly
larger phase delay (N = 10; two-way ANOVA, frequency: p < 0.001, lower bound:
p = 0.043; figure 8.2B). On the other hand, when the LP neuron was oscillating
within the range of the natural pyloric frequency (0.5 to 2 Hz), moving the upper
bound of the LP neuron to a higher value increased the delay of the synaptic
current from the LP to PD neuron (N = 9; two-way ANOVA, frequency: p < 0.001,
*: the difference between upper bounds has p < 0.05; figure 8.3A). Changing the
lower bound of LP oscillation had no effect on the phase difference (N = 10; two-
way ANOVA, frequency: p < 0.001, upper bound: p = 0.099; figure 8.3B).
Although the sine waveform is a common choice for generating
oscillations in neurons, there are few similarities between the sine waveform and
the LP neuron realistic waveform. To get a better idea about the phase difference
under natural situations, we further generated the ZAP oscillation (-60 to -30 mV,
0.1 to 4 Hz) in the LP neuron with the LP realistic waveforms along with the sine
109
waveform and measured the phase difference of the LP to PD synapse (figure
8.4). The LP realistic waveforms were the same set of waveforms used in
chapter 4. The oscillations with sine waveform produced phase differences within
the range of -0.1 and 0.1. The oscillations with the LP realistic waveforms, on
the other hand, had the phase difference as low as -0.25 at a low frequency and
as high as 0.39 at a higher frequency. These results indicated that, during the
ongoing pyloric activity, the value of the phase difference could have a wider
range and have more influence on the pyloric frequency.
Discussion
Previous studies in lobster have reported the different frequencies of the
presynaptic oscillations produce different peak phases in the postsynaptic
potential of the AB/PD to LP synapse (Rabbah and Nadim, 2007), the AB/PD to
PY synapse (Rabbah and Nadim, 2007), the LP to PD synapse (Manor et al.,
1997) and the LP to PY synapse (Mamiya et al., 2003b). Moreover, the duty
cycle of the presynaptic waveform can influence the frequency-dependence of
the postsynaptic potential peak. The postsynaptic potential results from the
combination of the synaptic properties and the intrinsic properties of the
postsynaptic neuron. Here we focused on the frequency-dependence of the
synaptic properties by measuring the synaptic current instead of the postsynaptic
potential. Whether the peak phases of the synaptic current share exactly the
same frequency-dependences with the peak phases of the postsynaptic potential
110
and the contributions of the postsynaptic neural properties to the peak phases of
the postsynaptic potential are still unclear and require further experiments.
Our results show that the phase differences changed from negative to
positive values and then increased as the frequency of presynaptic oscillation
became higher. In the AB/PD to LP synapse, shifting the lower bound of the
presynaptic oscillation had a small but statically significant effect on the
frequency-dependence of the phase difference. However, the functional role of
this frequency-dependence is still in question. Unlike the peak phase of the
AB/PD to PY synapse showing the correlation with the PY burst phase, the peak
phase of the AB/PD to LP synapse has no correlation with the LP burst phase
(Rabbah and Nadim, 2007). In addition, the LP to PD postsynaptic potential,
which controls the lower bound of the PD oscillation, is usually only a few mVs
and therefore may not be large enough to alter the frequency-dependence of the
peak phase.
On the other hand, the peak phase of the LP to PD synapse is known to
affect the frequency of the PD oscillation (Mamiya and Nadim, 2005). When the
peak occurs during the early phase of the PD oscillatory cycle, the frequency of
the next oscillatory cycle will increase (Mamiya and Nadim, 2004); if the peak
occurs during the later phase, the frequency will decrease. These studies provide
a hypothesis regarding how the inhibitory synapse from the LP to PD neuron
stabilizes the frequency of the network activity. During natural pyloric oscillations,
the LP to PD synapse is active in the middle of the PD cycle, a phase with no
effect on the network frequency (Oprisan et al., 2003). When the perturbation

111
changes the PD frequency without changing the frequency of LP, the inhibitory
synapse from the LP neuron will occur at relatively early or later phases and thus
push the PD oscillation back to its original frequency (Nadim et al., 2011). Our
results provide another way to explain how the LP to PD synapse helps
maintaining the pyloric frequency. Based on our results, the peak phase of
synaptic current is frequency-dependent. When the pyloric frequency becomes
slower, the peak of the synaptic current will occur earlier in the oscillatory cycle
and therefore increase the pyloric frequency. Similarly, when the pyloric
frequency becomes faster, the peak occurs later and slows down the frequency.
As a result, there is a default frequency at which the peak phase of the LP to PD
synapse is in the middle of the oscillatory cycle.
When the LP neuron is voltage clamped with a sine waveform, the phase
differences of the LP to PD synapse are within only the range of ±0.1. Although
the phase of the LP to PD synapse can affect the pyloric frequency, it is doubtful
if such small phase differences can have a large effect. The realistic waveforms,
which are more similar to the LP natural waveform, produced the phase
differences in a wider range (from -0.25 to 0.39), suggesting that under more
realistic conditions frequency may have a much larger influence on the peak
synaptic phase.
In conclusion, we showed that the peak phases of the synapses between
the AB/PD and LP neuron depend on the presynaptic frequency. These findings,
combined with previous studies that the peak phase of the LP to PD synapse can
shift the pyloric frequency, demonstrate that the potential ability of the pyloric

112
network to control the variability of its cycle frequency via the frequency-
dependence of the peak synaptic phase.
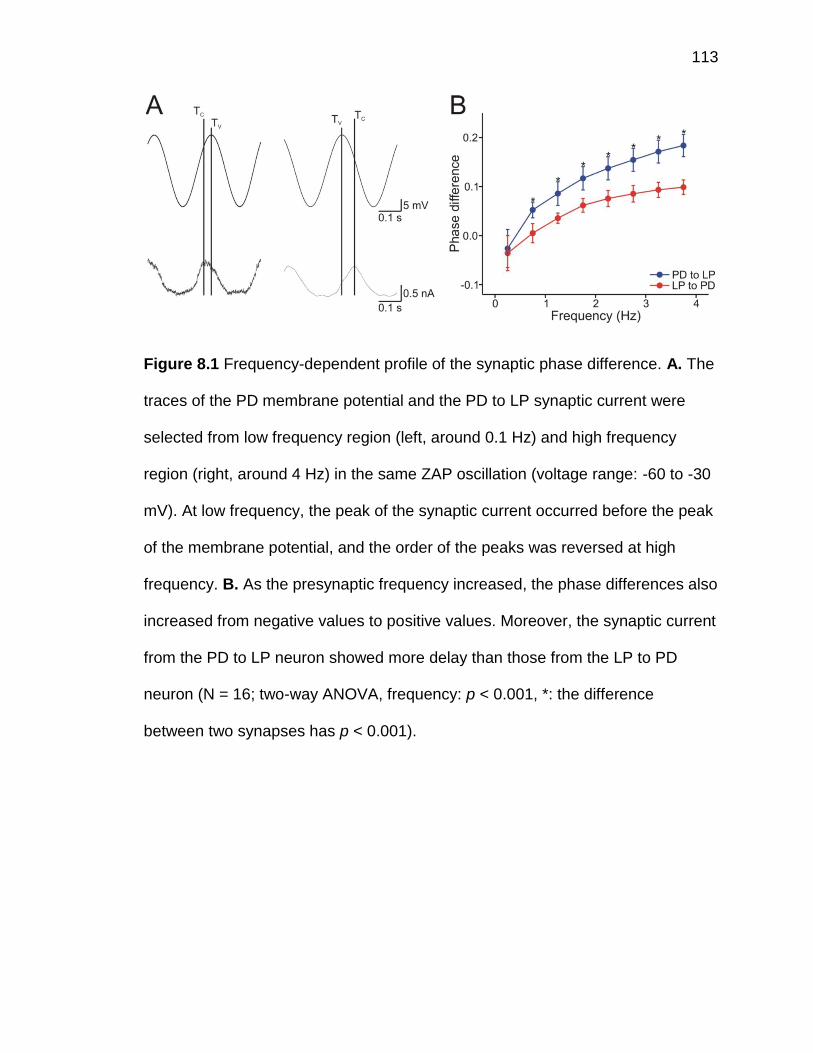
113
Figure 8.1 Frequency-dependent profile of the synaptic phase difference. A. The
traces of the PD membrane potential and the PD to LP synaptic current were
selected from low frequency region (left, around 0.1 Hz) and high frequency
region (right, around 4 Hz) in the same ZAP oscillation (voltage range: -60 to -30
mV). At low frequency, the peak of the synaptic current occurred before the peak
of the membrane potential, and the order of the peaks was reversed at high
frequency. B. As the presynaptic frequency increased, the phase differences also
increased from negative values to positive values. Moreover, the synaptic current
from the PD to LP neuron showed more delay than those from the LP to PD
neuron (N = 16; two-way ANOVA, frequency: p < 0.001, *: the difference
between two synapses has p < 0.001).
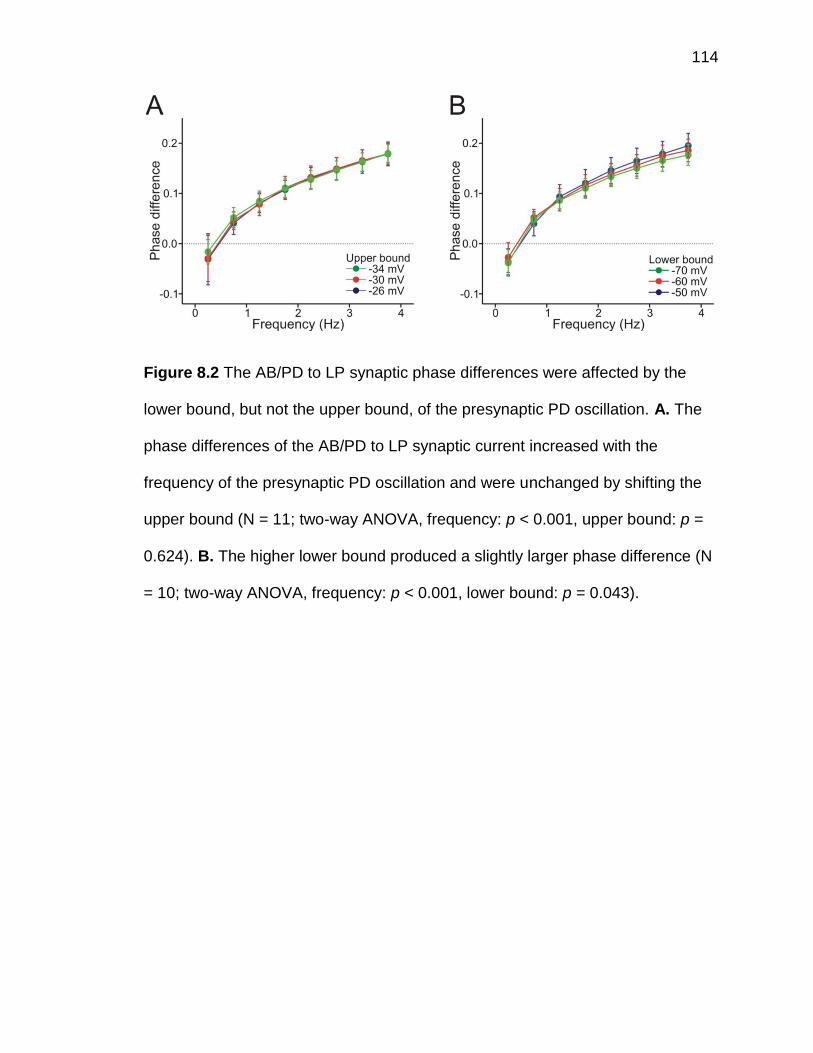
114
Figure 8.2 The AB/PD to LP synaptic phase differences were affected by the
lower bound, but not the upper bound, of the presynaptic PD oscillation. A. The
phase differences of the AB/PD to LP synaptic current increased with the
frequency of the presynaptic PD oscillation and were unchanged by shifting the
upper bound (N = 11; two-way ANOVA, frequency: p < 0.001, upper bound: p =
0.624). B. The higher lower bound produced a slightly larger phase difference (N
= 10; two-way ANOVA, frequency: p < 0.001, lower bound: p = 0.043).
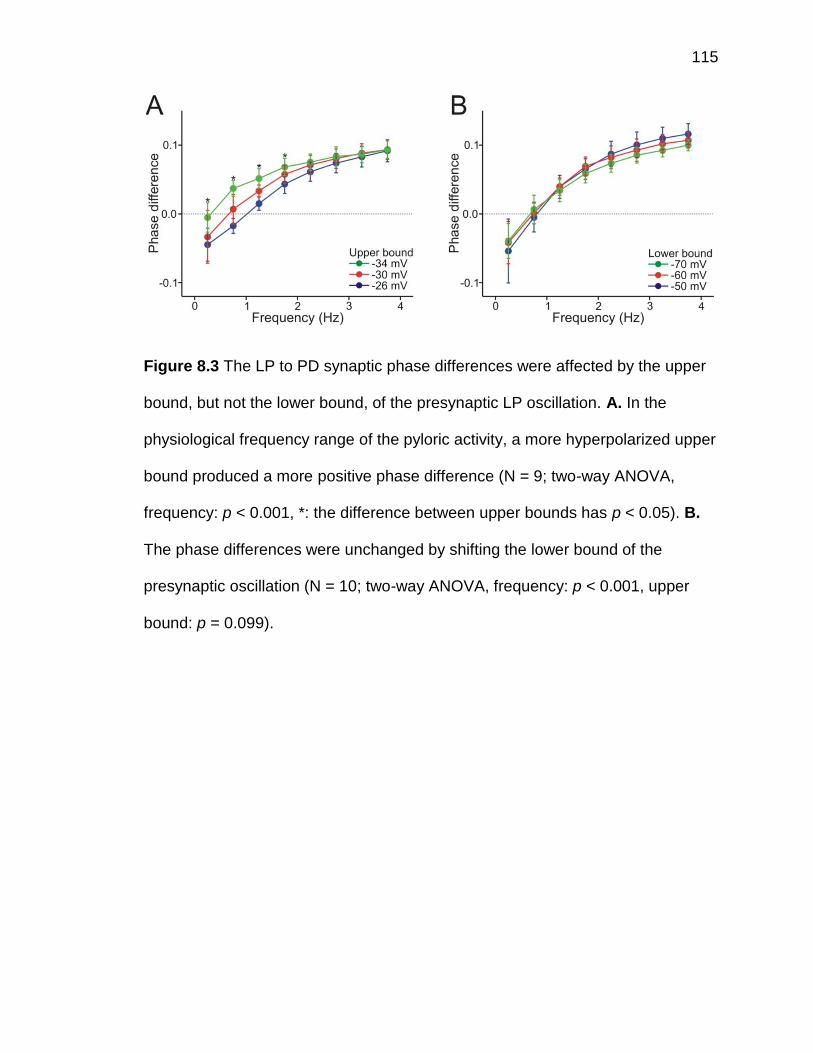
115
Figure 8.3 The LP to PD synaptic phase differences were affected by the upper
bound, but not the lower bound, of the presynaptic LP oscillation. A. In the
physiological frequency range of the pyloric activity, a more hyperpolarized upper
bound produced a more positive phase difference (N = 9; two-way ANOVA,
frequency: p < 0.001, *: the difference between upper bounds has p < 0.05). B.
The phase differences were unchanged by shifting the lower bound of the
presynaptic oscillation (N = 10; two-way ANOVA, frequency: p < 0.001, upper
bound: p = 0.099).

116
Figure 8.4 The synapses oscillating with realistic waveforms generate a wider
range of phase differences. While the sine oscillation produced the phase
difference between -0.1 and 0.1, the phase difference during the oscillation with
the realistic waveforms can reach -0.25 at low frequencies and 0.39 at high
frequencies (N = 4; two-way ANOVA, frequency: p < 0.001, waveform: p < 0.001).

117
Chapter 9: Discussion
Oscillatory activity controls many aspects of animal behavior like feeding,
breathing and locomotion. In order to respond to changing environments,
animals may need to adjust the frequency of the behavior, and the way the
frequencies are regulated becomes important. We hypothesized that the
frequency of an oscillatory activity is determined by the frequency-dependent
properties of the neurons and synapses in the network. We tested this
hypothesis by examining the frequency-dependent properties of the neurons and
synapses in the pyloric network of crab Cancer borealis. The impedances of the
pacemaker PD neuron and the follower LP neuron show frequency-dependences,
and the impedances reach a maximum value when the neurons are oscillating at
their preferred frequencies. Factors, such as the voltage range and waveform
parameters, could shift the preferred frequency and the network frequency in the
same way. The frequency-dependent properties can also be found in the
amplitude and peak phase of the synaptic current. The synapse generates a
larger current when the presynaptic neuron is oscillating at the synaptic preferred
frequency. During a low frequency oscillation, the synaptic current reaches its
peak before the membrane potential does, and the opposite occurs at a high
frequency of oscillation. Overall, we showed that preferred frequencies exist in
neurons and synapses of the pyloric network, and there are many factors could
potentially affect these preferred frequencies.

118
Since the preferred frequencies exist in both the neurons and the
synapses, it would be of interest to know which has more influence on the pyloric
frequency . Considering that we demonstrated a clear correlation between the
pyloric frequency and the preferred frequency of the pacemaker PD neuron and
that other studies show that removal of the LP to PD synapse has little effect on
the pyloric frequency, it is likely the preferred frequency of the neuron, at least of
the pacemaker neurons, plays a major role in determining the pyloric frequency.
Notably, the factors affecting the preferred frequencies are not
independent from each other and there are continuous interactions between
them. For example, the voltage range and the waveform, both of which show
correlation with the neural preferred frequency, are shaped by the activation of
voltage-gated ion channels. However, the activation of the voltage-gated ion
channels itself, depends on the voltage range and waveform of the membrane
potential. These relationships, therefore, are not simple one-directional
interactions, but rather complex two-way interactions between the voltage-gated
ion channel and the waveform. The waveform of a neuron is also affected by the
synaptic input it receives. Modeling results show that the short-term depression
of the inhibitory synapses and the dynamics of transient potassium A-current
control the rebound properties of the follower neurons in an inhibitory oscillator-
follower system; more importantly, there are interactions between the inhibitory
synaptic input and the activation of A-current (Bose et al., 2004). When the
inhibitory synapse becomes stronger and pushes the membrane potential lower,
more inactivation of A-current is removed, resulting in a larger A-current during
119
the rebound process. As a result, it is hard, if not impossible, to only modify one
factor without altering the other factors.
The pyloric network receives many neuromodulatory inputs from
projection neurons, and each neuromodulator can affect many properties of the
network at the same time. One example is the neuromodulator dopamine.
Dopamine shifts the activation curve of Ih channel to a depolarized level and
reduce its conductance, resulting in a combined effect of the depolarization of PD
axon (Ballo et al., 2010). Dopamine also affects the waveform of the LP neuron.
It shortens the LP bursting duration (Johnson et al., 2011) and enhances the LP
rebound (Johnson et al., 2005). Besides the intrinsic properties of neurons,
neuromodulators also influence multiple synaptic properties, such as the strength,
the short-term depression and the peak phase (Johnson et al., 2011). Many of
these properties affect neural and synaptic resonance so bath-application of
neuromodulators could affect resonance properties in a complex way.
By putting all these relationships together, we can obtain a roadmap that
shows how the pyloric oscillation frequency relates to various properties of
neurons and synapses in the network (figure 9.1). Many feedback loops can be
seen in the map. For example, the pyloric frequency affects the amplitude of the
LP to PD synapse, which in turn shifts the lower bound of the PD neuron
oscillation and then influences the pyloric frequency. The pyloric frequency is not
determined by one single factor, but by the dynamic interactions between many
factors. The work in this thesis provides the groundwork for further mathematical

120
modeling and biological experiments to understand the importance of each
individual factor.

121
Figure 9.1 The interactions between the pyloric frequency, preferred frequencies
and properties of neurons and synapses. Several feedback loops can be seen in
the map. Red color indicates results from this thesis.
122
Chapter 10: Future directions
Regulating the frequency of a bursting neuron through connections to a resonant
neuron via gap junctions
Among the neurons in the pacemaker kernel, only the AB neuron is an
intrinsicoscillator. The PD neuron oscillatory activity is primarily due to the strong
gap junction coupling between the AB and PD neurons. Therefore, how the
intrinsic properties, especially the preferred frequency, of the PD neuron affect
the frequency of the oscillation becomes an interesting question. This question
could be examined with mathematical modeling or biological experiments. In the
model, we could construct an oscillator and connect this oscillator to a resonance
model neuron. Similarly, we could first isolate the AB neuron experimentally and
then use dynamic clamp to connect the AB neuron to a resonant model neuron.
The voltage of the resonant model neuron need to be carefully adjusted to the
voltage level so that when it connects to the resonant neuron, the voltage range
of the oscillator or the AB neuron will not be shifted. By using resonant neurons
with various preferred frequencies, we expect that the oscillatory frequency
would shift by shifting the preferred frequency of the connected resonant neuron.
Connecting to a resonant neuron with a preferred frequency higher than the
oscillatory frequency of the isolated oscillator should increase the overall
frequency, and connecting to one with lower preferred frequency should bring
down the overall frequency. These results help us understand how the network

123
frequency is regulated with the gap junctions between an oscillator and a
resonant neuron.
Ionic currents contributed to resonance
Many ionic currents are involved in resonance, and the behaviors of these
ionic currents during the oscillatory activity are still unclear. To address this
question, we could measure the ionic currents during the oscillation by
comparing the voltage-clamp current with and without the blocker to the specific
ion channels. For example, CsCl can block the Ih and could be used to study the
amplitude of the Ih during the oscillation. Other blockers include CdCl2 for calcium
currents and 4-aminopyridine for the IA. By applying these blockers, we could
understand the roles of individual ionic current in generating the resonance. In
addition to the removal of ionic currents, we could also use neuromodulators to
alter the properties of the currents. By combining the blockers and the
neuromodulators, we would be able to identify the effects of neuromodulator
result from which ionic current. Finally, by comparing the amplitudes of different
ionic current when the neuron is oscillating at different voltage ranges, we will be
able to understand the underlying mechanisms responsible for the changes of
the preferred frequency with voltage ranges.
The functional role of synaptic resonance in determining the network activity

124
We showed that the synapses have preferred frequencies, and these
preferred frequencies are lower than the network frequency. To examine how
shifting the synaptic preferred frequency affects the network frequency, we could
block the endogenous synapses in the biological network by applying
tetraethylammonium (cholinergic synapse blocker) and picrotoxin (glutamatergic
synapse blocker), and then use dynamic clamp to introduce artificial synapses.
The amplitude of the artificial synapse should have a frequency-dependent
profile and show a preferred frequency. By adjusting the profile and the preferred
frequency, we can examine how the differences in the synaptic resonance
influence the frequency of the network activity.

125
Reference
Ayali A, Johnson BR, Harris-Warrick RM (1998) Dopamine modulates graded and spike-evoked synaptic inhibition independently at single synapses in pyloric network of lobster. J Neurophysiol 79:2063-2069.
Ballo AW, Keene JC, Troy PJ, Goeritz ML, Nadim F, Bucher D (2010) Dopamine modulates Ih in a motor axon. J Neurosci 30:8425-8434.
Bartos M, Manor Y, Nadim F, Marder E, Nusbaum MP (1999) Coordination of fast and slow rhythmic neuronal circuits. J Neurosci 19:6650-6660.
Beltz B, Eisen JS, Flamm R, Harris-Warrick RM, Hooper SL, Marder E (1984) Serotonergic innervation and modulation of the stomatogastric ganglion of three decapod crustaceans (Panulirus interruptus, Homarus americanus and Cancer irroratus). The Journal of experimental biology 109:35-54.
Bose A, Manor Y, Nadim F (2004) The activity phase of postsynaptic neurons in a simplified rhythmic network. J Comput Neurosci 17:245-261.
Bucher D, Prinz AA, Marder E (2005) Animal-to-animal variability in motor pattern production in adults and during growth. J Neurosci 25:1611-1619.
Christie AE, Baldwin DH, Marder E, Graubard K (1997) Organization of the stomatogastric neuropil of the crab, Cancer borealis, as revealed by modulator immunocytochemistry. Cell Tissue Res 288:135-148.
Connelly WM, Schulz JM, Lees G, Reynolds JN (2010) Differential short-term plasticity at convergent inhibitory synapses to the substantia nigra pars reticulata. J Neurosci 30:14854-14861.
D'Angelo E, Nieus T, Maffei A, Armano S, Rossi P, Taglietti V, Fontana A, Naldi G (2001) Theta-frequency bursting and resonance in cerebellar granule cells: experimental evidence and modeling of a slow k+-dependent mechanism. J Neurosci 21:759-770.
Dickinson PS (2006) Neuromodulation of central pattern generators in invertebrates and vertebrates. Current opinion in neurobiology 16:604-614.
Doussau F, Humeau Y, Benfenati F, Poulain B (2010) A novel form of presynaptic plasticity based on the fast reactivation of release sites switched off during low-frequency depression. J Neurosci 30:16679-16691.
Fenelon VS, Kilman V, Meyrand P, Marder E (1999) Sequential developmental acquisition of neuromodulatory inputs to a central pattern-generating network. J Comp Neurol 408:335-351.
Fisher JA, Kowalik L, Hudspeth AJ (2011) Imaging electrical resonance in hair cells. Proceedings of the National Academy of Sciences of the United States of America 108:1651-1656.
Goaillard JM, Schulz DJ, Kilman VL, Marder E (2004) Octopamine modulates the axons of modulatory projection neurons. J Neurosci 24:7063-7073.
Goeritz ML, Ouyang Q, Harris-Warrick RM (2011) Localization and function of Ih channels in a small neural network. Journal of neurophysiology 106:44-58.
Goldman MS, Golowasch J, Marder E, Abbott LF (2001) Global structure, robustness, and modulation of neuronal models. J Neurosci 21:5229-5238.
126
Golowasch J, Marder E (1992a) Proctolin activates an inward current whose voltage dependence is modified by extracellular Ca2+. J Neurosci 12:810-817.
Golowasch J, Marder E (1992b) Ionic currents of the lateral pyloric neuron of the stomatogastric ganglion of the crab. J Neurophysiol 67:318-331.
Golowasch J, Abbott LF, Marder E (1999) Activity-dependent regulation of potassium currents in an identified neuron of the stomatogastric ganglion of the crab Cancer borealis. J Neurosci 19:RC33.
Golowasch J, Goldman MS, Abbott LF, Marder E (2002) Failure of averaging in the construction of a conductance-based neuron model. J Neurophysiol 87:1129-1131.
Graubard K, Raper JA, Hartline DK (1980) Graded synaptic transmission between spiking neurons. Proceedings of the National Academy of Sciences of the United States of America 77:3733-3735.
Gutfreund Y, Yarom Y, Segev I (1995) Subthreshold oscillations and resonant frequency in guinea-pig cortical neurons: physiology and modelling. J Physiol 483 ( Pt 3):621-640.
Harris-Warrick RM (2011) Neuromodulation and flexibility in Central Pattern Generator networks. Current opinion in neurobiology (In press).
Harris-Warrick RM, Johnson BR, Peck JH, Kloppenburg P, Ayali A, Skarbinski J (1998) Distributed effects of dopamine modulation in the crustacean pyloric network. Annals of the New York Academy of Sciences 860:155-167.
Hooper SL, Marder E (1984) Modulation of a central pattern generator by two neuropeptides, proctolin and FMRFamide. Brain Res 305:186-191.
Hooper SL, Marder E (1987) Modulation of the lobster pyloric rhythm by the peptide proctolin. J Neurosci 7:2097-2112.
Hutcheon B, Yarom Y (2000) Resonance, oscillation and the intrinsic frequency preferences of neurons. Trends Neurosci 23:216-222.
Hutcheon B, Miura RM, Puil E (1996a) Models of subthreshold membrane resonance in neocortical neurons. J Neurophysiol 76:698-714.
Hutcheon B, Miura RM, Puil E (1996b) Subthreshold membrane resonance in neocortical neurons. J Neurophysiol 76:683-697.
Izhikevich EM, Desai NS, Walcott EC, Hoppensteadt FC (2003) Bursts as a unit of neural information: selective communication via resonance. Trends Neurosci 26:161-167.
Johnson BR, Harris-Warrick RM (1990) Aminergic modulation of graded synaptic transmission in the lobster stomatogastric ganglion. J Neurosci 10:2066-2076.
Johnson BR, Schneider LR, Nadim F, Harris-Warrick RM (2005) Dopamine modulation of phasing of activity in a rhythmic motor network: contribution of synaptic and intrinsic modulatory actions. J Neurophysiol 94:3101-3111.
Johnson BR, Brown JM, Kvarta MD, Lu JY, Schneider LR, Nadim F, Harris-Warrick RM (2011) Differential modulation of synaptic strength and timing regulate synaptic efficacy in a motor network. J Neurophysiol 105:293-304.
127
Kandaswamy U, Deng PY, Stevens CF, Klyachko VA (2010) The role of presynaptic dynamics in processing of natural spike trains in hippocampal synapses. J Neurosci 30:15904-15914.
Khorkova O, Golowasch J (2007) Neuromodulators, not activity, control coordinated expression of ionic currents. J Neurosci 27:8709-8718.
Kloppenburg P, Levini RM, Harris-Warrick RM (1999) Dopamine modulates two potassium currents and inhibits the intrinsic firing properties of an identified motor neuron in a central pattern generator network. J Neurophysiol 81:29-38.
Li L, Kelley WP, Billimoria CP, Christie AE, Pulver SR, Sweedler JV, Marder E (2003) Mass spectrometric investigation of the neuropeptide complement and release in the pericardial organs of the crab, Cancer borealis. J Neurochem 87:642-656.
MacLean JN, Zhang Y, Goeritz ML, Casey R, Oliva R, Guckenheimer J, Harris-Warrick RM (2005) Activity-independent coregulation of IA and Ih in rhythmically active neurons. J Neurophysiol 94:3601-3617.
Mamiya A, Nadim F (2004) Dynamic interaction of oscillatory neurons coupled with reciprocally inhibitory synapses acts to stabilize the rhythm period. J Neurosci 24:5140-5150.
Mamiya A, Nadim F (2005) Target-specific short-term dynamics are important for the function of synapses in an oscillatory neural network. J Neurophysiol 94:2590-2602.
Mamiya A, Manor Y, Nadim F (2003a) Short-term dynamics of a mixed chemical and electrical synapse in a rhythmic network. J Neurosci 23:9557-9564.
Mamiya A, Manor Y, Nadim F (2003b) Short-term dynamics of a mixed chemical and electrical synapse in a rhythmic network. The Journal of neuroscience : the official journal of the Society for Neuroscience 23:9557-9564.
Manor Y, Nadim F (2001) Synaptic depression mediates bistability in neuronal networks with recurrent inhibitory connectivity. J Neurosci 21:9460-9470.
Manor Y, Nadim F, Abbott LF, Marder E (1997) Temporal dynamics of graded synaptic transmission in the lobster stomatogastric ganglion. J Neurosci 17:5610-5621.
Manor Y, Bose A, Booth V, Nadim F (2003) Contribution of synaptic depression to phase maintenance in a model rhythmic network. J Neurophysiol 90:3513-3528.
Marder E (2011) Quantification of Behavior Sackler Colloquium: Variability, compensation, and modulation in neurons and circuits. Proceedings of the National Academy of Sciences of the United States of America (In press).
Marder E, Eisen JS (1984a) Transmitter identification of pyloric neurons: electrically coupled neurons use different transmitters. Journal of neurophysiology 51:1345-1361.
Marder E, Eisen JS (1984b) Electrically coupled pacemaker neurons respond differently to same physiological inputs and neurotransmitters. J Neurophysiol 51:1362-1374.
128
Marder E, Calabrese RL (1996) Principles of rhythmic motor pattern generation. Physiol Rev 76:687-717.
Marder E, Bucher D (2001) Central pattern generators and the control of rhythmic movements. Curr Biol 11:R986-996.
Marder E, Bucher D (2007) Understanding circuit dynamics using the stomatogastric nervous system of lobsters and crabs. Annu Rev Physiol 69:291-316.
Marder E, Taylor AL (2011) Multiple models to capture the variability in biological neurons and networks. Nat Neurosci 14:133-138.
Marder E, Hooper SL, Siwicki KK (1986) Modulatory action and distribution of the neuropeptide proctolin in the crustacean stomatogastric nervous system. J Comp Neurol 243:454-467.
Mouser C, Nadim F, Bose A (2008) Maintaining phase of the crustacean tri-phasic pyloric rhythm. J Math Biol 57:161-181.
Nadim F, Manor Y (2000) The role of short-term synaptic dynamics in motor control. Curr Opin Neurobiol 10:683-690.
Nadim F, Manor Y, Kopell N, Marder E (1999) Synaptic depression creates a switch that controls the frequency of an oscillatory circuit. Proc Natl Acad Sci U S A 96:8206-8211.
Nadim F, Zhao S, Zhou L, Bose A (2011) Inhibitory feedback promotes stability in an oscillatory network. J Neural Engineering (In press).
Olsen OH, Calabrese RL (1996) Activation of intrinsic and synaptic currents in leech heart interneurons by realistic waveforms. J Neurosci 16:4958-4970.
Oprisan SA, Thirumalai V, Canavier CC (2003) Dynamics from a time series: can we extract the phase resetting curve from a time series? Biophys J 84:2919-2928.
Orio P, Madrid R, de la Pena E, Parra A, Meseguer V, Bayliss DA, Belmonte C, Viana F (2009) Characteristics and physiological role of hyperpolarization activated currents in mouse cold thermoreceptors. The Journal of physiology 587:1961-1976.
Ouyang Q, Patel V, Vanderburgh J, Harris-Warrick RM (2010) Cloning and distribution of Ca(2+)-activated K(+) channels in lobster Panulirus interruptus. Neuroscience.
Peck JH, Gaier E, Stevens E, Repicky S, Harris-Warrick RM (2006) Amine modulation of Ih in a small neural network. J Neurophysiol 96:2931-2940.
Prinz AA, Thirumalai V, Marder E (2003) The functional consequences of changes in the strength and duration of synaptic inputs to oscillatory neurons. J Neurosci 23:943-954.
Prinz AA, Abbott LF, Marder E (2004) The dynamic clamp comes of age. Trends Neurosci 27:218-224.
Rabbah P, Nadim F (2005) Synaptic dynamics do not determine proper phase of activity in a central pattern generator. J Neurosci 25:11269-11278.
Rabbah P, Nadim F (2007) Distinct synaptic dynamics of heterogeneous pacemaker neurons in an oscillatory network. J Neurophysiol 97:2239-2253.

129
Raper JA (1979) Nonimpulse-mediated synaptic transmission during the generation of a cyclic motor program. Science 205:304-306.
Schulz DJ, Goaillard JM, Marder EE (2007) Quantitative expression profiling of identified neurons reveals cell-specific constraints on highly variable levels of gene expression. Proc Natl Acad Sci U S A 104:13187-13191.
Sharp AA, O'Neil MB, Abbott LF, Marder E (1993a) The dynamic clamp: artificial conductances in biological neurons. Trends Neurosci 16:389-394.
Sharp AA, O'Neil MB, Abbott LF, Marder E (1993b) Dynamic clamp: computer-generated conductances in real neurons. J Neurophysiol 69:992-995.
Stein W (2009) Modulation of stomatogastric rhythms. J Comp Physiol A Neuroethol Sens Neural Behav Physiol 195:989-1009.
Swensen AM, Marder E (2000) Multiple peptides converge to activate the same voltage-dependent current in a central pattern-generating circuit. J Neurosci 20:6752-6759.
Thirumalai V, Marder E (2002) Colocalized neuropeptides activate a central pattern generator by acting on different circuit targets. J Neurosci 22:1874-1882.
Thirumalai V, Prinz AA, Johnson CD, Marder E (2006) Red pigment concentrating hormone strongly enhances the strength of the feedback to the pyloric rhythm oscillator but has little effect on pyloric rhythm period. J Neurophysiol 95:1762-1770.
Tierney AJ, Harris-Warrick RM (1992) Physiological role of the transient potassium current in the pyloric circuit of the lobster stomatogastric ganglion. J Neurophysiol 67:599-609.
Tohidi V, Nadim F (2009) Membrane resonance in bursting pacemaker neurons of an oscillatory network is correlated with network frequency. J Neurosci 29:6427-6435.
van Brederode JF, Berger AJ (2011) GAD67-GFP+ neurons in the Nucleus of Roller. II. Subthreshold and firing resonance properties. Journal of neurophysiology 105:249-278.
Wood DE, Manor Y, Nadim F, Nusbaum MP (2004) Intercircuit control via rhythmic regulation of projection neuron activity. J Neurosci 24:7455-7463.
Zemankovics R, Kali S, Paulsen O, Freund TF, Hajos N (2010) Differences in subthreshold resonance of hippocampal pyramidal cells and interneurons: the role of h-current and passive membrane characteristics. The Journal of physiology 588:2109-2132.
Zhang Y, Bose A, Nadim F (2008) Predicting the activity phase of a follower neuron with A-current in an inhibitory network. Biol Cybern 99:171-184.
Zhang Y, Oliva R, Gisselmann G, Hatt H, Guckenheimer J, Harris-Warrick RM (2003) Overexpression of a hyperpolarization-activated cation current (Ih) channel gene modifies the firing activity of identified motor neurons in a small neural network. J Neurosci 23:9059-9067.
Zhao S, Golowasch J, Nadim F (2010) Pacemaker neuron and network oscillations depend on a neuromodulator-regulated linear current. Front Behav Neurosci 4:21.

130
Zhao S, Sheibanie A, Oh M, Rabbah P, Nadim F (2011) Peptide neuromodulation of synaptic dynamics in an oscillatory network. (In Review).
Zhou L, Zhao S, Nadim F (2007) Neuromodulation of short-term synaptic dynamics examined in a mechanistic model based on kinetics of calcium currents. Neurocomputing 70:2050-2054.
131
Curriculum vitae
Hua-an Tseng
Ph.D. in Biology, Rutgers University, NJ, USA (July 2011)
M.S. in Neuroscience, National Yang-Ming University, Taipei, Taiwan (2003)
B.S. in Life Science, National Tsing-Hua University, Hsinchu, Taiwan (2001)