freezing rain and sleet climatology of the southeastern usa
TRANSCRIPT
Vol. 3: 209-220.1993 CLIMATE RESEARCH
Clim. Res. Published December 30
Freezing rain and sleet climatology of the southeastern USA
David A. Gay, Robert E. Davis
Department of Environmental Sciences. University of Virginia, Charlottesville, Virginia 22903, USA
ABSTRACT: Freezing rain is a dangerous and economically costly event that occurs frequently in the southeastern United States. Using surface observations for 44 Southeast stations, we describe and map the basic climatological data for both freezing rain and sleet, and describe the number and duration of events and associated upper air temperatures, layer thicknesses, and temporal trends. The Southeast averages 1.6 freezing rain and sleet events per year, ranging from 0 in southern Florida to over 5 in highland Virginia. Event frequencies and durations show 2 general trends: (1) a mountain-coastal decrease, and (2) a north-south decrease. Differences between freezing rain and sleet are evident in the upper air analysis: freezing rain events have higher 850 mb temperatures and lower surface tem- peratures. Freezing rain and sleet thickness differences show more variation for the 850 to 700 mb layer and less variation for the 1000 to 850 mb layer. Average 1000 to 500 mb thicknesses for freezing rain and sleet are both above and below the traditional 540 dam thickness. The ratio of freezing rain to sleet is consistently 2.0 or 2.5 freezing rain hours to 1.0 sleet hour in the upland stations, but is as low as 0.5 to 1.0 along the coast.
INTRODUCTION
Ice storms are very dangerous and costly precipita- tion episodes. Although the glaze produced in these storms can be beautiful, the damage caused to tree limbs and trunks, power lines, structures, etc., and de- lays in transportation can be quite extensive. Each of these physical impacts has an econon~ic cost to individ- uals, businesses, and landscapes of affected regions. Therefore, the timing and location of these storms, their frequencies and durations, and the damage they cause is of considerable interest to the general popu- lace. Despite its socio-economic importance, little is known about the climatology of freezing rain and sleet (FR/Sl) in the United States.
The accepted theory of FR/Sl development involves snow falling through a surface inversion of warm air aloft and cold air at the surface (Stewart 1985). These events are generally associated with warm fronts in the Southeast. The observed surface precipitation type is defined by the depth of both the in situ cold and warm layers. As warm air intrusion continues in association with an approaching warm front, the depth of the warm layer increases, more snowflakes melt as they
fall into the warm layer, and the chance of them re- freezing in the shallower cold layer is reduced. For instance, snow is observed at the surface when the air throughout both layers is below 0°C (e.g. in Fig. 1, after Stewart 1985). A mixture of frozen and unfrozen hydrometeors develops (e.g. sleet) as snow falls through a relatively shallow overlying warm layer (temperature, T, > 0°C) and begins to melt. The still relatively deep cold layer (T < 0°C) quickly supercools the hydrometeors to the ambient temperature. With supercooled temperatures, the remaining ice crystals provide efficient, preferential sites for re-freezing and S1 is the likely observed surface precipitation type. As the warm layer deepens (e.g. freezing rain), snow- flakes are completely melted and only water droplets remain at the warm-cold layer boundary. Again, the cold layer supercools the droplets, but without ice crys- tals present, little, if any, re-freezing occurs and the likely observed surface precipitation type is FR. Objects on the ground must be at or below freezing for FR to occur. Thermometers in above-ground shelter can measure above-freezing temperatures even with below-freezing ground temperatures when micro- inversions are in place. With liquid droplets reaching
O Inter-Research 1993

210 Clim. Res. 3:
Height (km) Height (km)
Temperature ("C) Temperature ('C)
Fig. 1. Vertical temperature profiles leading to 5 observed surface precipitation types: snow sleet, freezing ram, and
rain (from Stewart 1985)
the ground (e.g. rain) and surface temperatures above freezing, the observed precipitation will be cold rain (Stewart 1985). McQueen & Keith (1956), after Okada (1914) and Brooks (19201, suggest that S1 can form from completely melted raindrops, given strong low-level winds that: (1) maintain a deep, cold layer, and (2) 'create a stirring action' that increases the likelihood of re-freezing droplets.
With the approach of a warm front, the deepening warm layer melts more and more snow while the sur- face remains under cold air throughout. This leads to a commonly observed progression of precipitation types from snow, to S1, to FR, and finally to rain. This is the normal occurrence in the Southeast, as most FR/S1 events are thought to be associated with warm fronts. Martner et al. (1993) note that the reverse evolution (rain, FR, S], snow) occurs with cold frontal events in the southern Plain states. FR/S1 events have also been noted for stationary fronts and in non-frontal situations (Bennett 1959).
Several researchers have investigated individual FR/SI storms and their characteristics in the Southeast and other regions (Brooks 1914, 1920, Tannehill 1929, McNayr 1944, McQueen & Keith 1956, Young 1978, Donaldson & Stewart 1989, Martner et al. 1993). FR and S1 tend to occur near low pressure centers. The rain-snow transition zone is usually found between 80 and 125 km on either side of an 850 mb low center trajectory (Spiegler & Fisher 1971, Eagleman 1983). However, Ackely & Itagaki (1970) noted a wider area (ca 280 km) of frozen precipitation on either side of the storm's track. The frozen/unfrozen boundary is delineated by the 0°C isotherm, with warmer air to the right of the storm's track and with colder air be- hind and to the left (Stewart 1991). FR tends to be found in bands along the warm front and primarily to the right of the surface low's path (Donaldson & Stewart 1989). Young (1978) observed these same-
sized FR bands preceding the warm front (warm over- running).
The temperature structure (and resulting thickness) of the atmosphere is very important in determining the precipitation type observed at the surface. FR has below-freezing surface temperatures and above-freez- ing upper air temperatures (McQueen & Keith 1956, Bennett 1959, Young 197 8, Martner et al. 1993). Lamb (1955) found that European storms with freezing levels of 300 m, a 1000 to 700 mb thickness of 2780 m, and/or a 1000 to 500 mb thickness of 5225 m had an equal probability of frozen or unfrozen precipitation. In Ontario, Canada, Koolwine (1975) found mean FR 850 to 700 mb and 1000 to 850 mb thicknesses to be 1539 m and 1313 m, respectively.
Surface conditions change rapidly during a FR/SI storm. As a warm front event proceeds, pressure and wind speed generally decrease while temperature tends to increase and precipitation changes from snow to S1 to FR to rain (Bennett 1959, Stewart & King 1987, Martner et al. 1993). It has been well documented that hydrometeor phase changes, both aloft and at the sur- face, can warm or cool ambient temperature depend- ing on the local conditions, or can lead to a persistence of a O°C temperature (Stewart & Yiu 1993). The pre- cipitation progression can often be complex, oscillating from snow to rain to snow with intermixed FR and S1 (Stewart & Patenaude 1988), and have highly variable precipitation rates (McQueen & Keith 1956). Higher
Upper Air Grid Nodes
Flg. 2. Location of surface stations and upper gnd nodes across the southeastern United States, identified with the 3-
digit airways code (see Table 1)
Gay & Davis: Freezing rain and sleet
precipitation rates are associated with S1, while lower DATA precipitation rates are found with FR (Matsuo et al. 1981). Relative humidity also affects the observed pre- The meteorological data used in the investigation is cipitation type (through evaporation and condensa- the TD-3280 Surface Airways Observation dataset tion) with higher relative humidities leading to more (NCDC 1991) for 44 stations across the southeastern FR, and vice versa (Matsuo et al. 1981). U.S. (Fig. 2, Table 1). The Southeast is defined as the
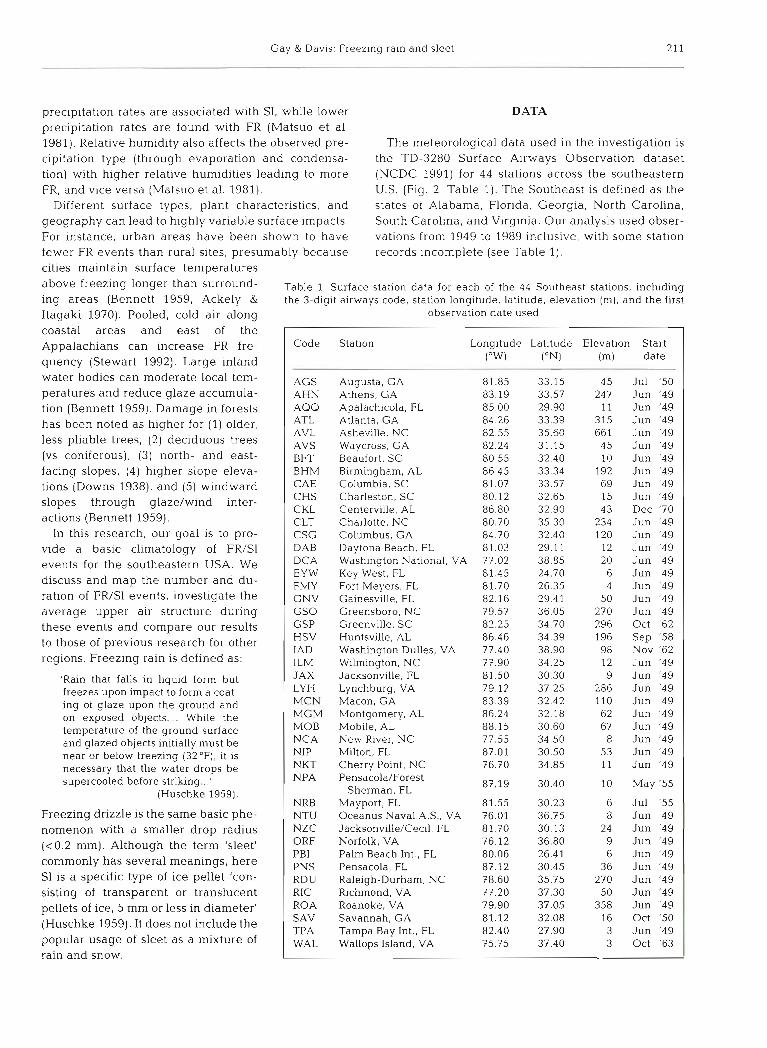
Different surface types, plant characteristics, and states of Alabama, Florida, Georgia, North Carolina, geography can lead to highly variable surface impacts. South Carolina, and Virginia. Our analysis used obser- For instance, urban areas have been shown to have vations from 1949 to 1989 inclusive, with some station fewer FR events than rural sites, presumably because records incomplete (see Table 1) . cities maintain surface temperatures
freezing longer than Table 1 Surface station data for each of the 44 Southeast stations, including ing areas (Bennett 1959, Ackely & the 3-digil airways code, station longitude, latitude, elevation (m), and the first ltagaki 1970). Pooled, cold air along observation date used
coastal areas and east of the Appalachians can increase FR fre- Longitude Latitude Elevation Start
quency (Stewart 1992). Large inland ("W) (ON1 (m) date
water bodies can moderate local tem- 81.85 33.15 45 Jul '50 peratures and reduce glaze accumula- 83.19 33.57 247 Jun '49
tion (Bennett 1959). Damage in forests Apalachlcola, FL 85 00 29.90 11 Jun '49
has been noted as higher for (1) older, Atlanta, GA 84.26 33.39 315 Jun '49 Asheville, NC 82.55 35.60 661 Jun '49
less pliable trees, (2) deciduous trees Waycross, GA 82.24 31.15 45 Jun '49 (vs coniferous), (3) north- and east- Beaufort. SC 80.55 32.40 10 Jun '49 facing slopes, (4) higher slope eleva- I BHM ~i rmingham, AL
tions (Downs 1938), and (5) windward slopes through glaze/wind inter- actions (Bennett 1959).
In this research, our goal is to pro- vide a basic climatology of FR/S1 events for the southeastern USA. We discuss and map the number and du- ration of FR/Sl events, investigate the average upper air structure during these events and compare our results to those of previous research for other regions. Freezing rain is defined as:
'Rain that falls in liquid form but freezes upon impact to form a coat- ing of glaze upon the ground and on exposed objects .... While the temperature of the ground surface and glazed objects initially must be near or below freezing (32"F), it is necessary that the water drops be supercooled before strihng . . . '
(Huschke 1959).
Freezing drizzle is the same basic phe- nomenon with a smaller drop radius ( ~ 0 . 2 mm). Although the term 'sleet' commonly has several meanings, here S1 is a specific type of ice pellet 'con- sisting of transparent or translucent pellets of ice, 5 mm or less in diameter' (Huschke 1959). It does not include the popular usage of sleet as a mixture of rain and snow.
CAE Columbia, SC CHS Charleston, SC CKL Centerville, AL CLT Charlotte. NC CSG Columbus, GA 84.70 DAB Daytona Beach, FL 81.03 DCA Washington National, VA 77.02 EYW Key West. FL 81.45 FMY Fort Meyers, FL 81.70 GNV Gainesville. FL 82.16 GSO GSP HSV I AD ILM JAX LYH MCN MGM MOB NCA NIP NKT NPA
NRB NTU NZC ORF PBI PNS RDU RIC ROA S AV TPA WAL
Greensboro, NC Greenville, SC Huntsvllle, AL Washington Dulles, VA Wilmington, NC Jacksonvllle, FL Lynchburg, VA Macon, GA Montgomery, AL Mobile, AL New River, NC Milton, FL Cherry Point, NC Pensacola/Forest
Sherman, FL Mayport, FL Oceanus Naval A.S., VA Jacksonville/Cecil, FL Norfolk, VA Palm Beach Int., FL Pensacola, FL Raleigh-Durham, NC Richmond, VA Roanoke, VA Savannah, GA Tampa Bay Int., FL Wallops Island, VA
192 Jun '49 69 Jun '49 15 Jun '49 4 3 Dec '70
234 Jun '49 120 Jun '49
12 Jun '49 20 J u n '49
6 Jun '49 4 Jun '49
50 Jun '49 Jun '49 Oct '62 Sep '58 Nov '62 Jun '49 Jun '49 Jun '49 Jun '49 Jun '49 Jun '49 Jun '49 Jun '49 Jun '49
May '55
Jul '55 Jun '49 Jun '49 Jun '49 Jun '49 Jun '49 Jun '49 Jun '49 Jun '49 Oct '50 J u n '49 Oct '63

Clim. Res. 3: 209-220, 1993
Event progression (elapsed time)
Fig. 3. Six hypothetical examples of FR/S1 'events' (and 1 non-event) as defined here, including the 'observed' hour, the number of events, and the total event time. Shaded areas are hours not considered as part of the event. Sn: snow; R: rain; FR: freezing
rain; S1: sleet; NP: no precipitation
Duration (h)
4
25
1 each
0
3
20
1
The upper air data source is the Northern Hemi- sphere Octagonal Grid Data (NCAR 1975), where upper air station observations were interpolated to a relatively square grid. Grid points between 25 to 40" N and 76 to 87" W were used, from January 1963 through December 1988 (Fig. 2). Observations were available at both 0000 and 1200 UTC for the 850, 700, and 500 mb constant pressure levels. Temperatures at 1000 mb were determined using surface temperature and elevation based on a lapse rate of 0.0098"C m-'. While the use of both gridded data and information at only 4 standard reporting levels neglects much of the finer scale temperature information, this approach was necessary in a clirnatological study of this kind owing to the volume of data that we processed.
In our analysis, frozen precipitation observations were divided into 4 categories using TD 3280 present weather codes (PWCs): (1) S1 (PWC = ice pellets/pellet showers); (2) FR (freezing raiddrizzle, glaze); (3) snow (snow, snow showers/pellets/squaIls/grains, ice crys- tals); and (4) other (all other codes). Two PWCs could be recorded for each hour and either code could be used to define S1, FR, or snow. If 2 different PWCs re- ported frozen precipitation during the same hour, the hour was categorized in this order: FR, S1, and snow.
In our data evaluation we discuss mean FR/Sl events. A FR/Sl 'event' was defined as 1 or more hours of re- ported FR or S1 without any intervening period (rain or no precipitation) longer than 24 h, i.e. a continuous time period of frozen precipitation. A FR/S1 event can include snow, rain, or no precipitation, but must begin and end with some form of frozen precipitation. Events in which only snow was reported were not counted as FR/Sl events. Events recorded between May and September were assumed to be misreported and were removed. Also, during the middle and late 1960s, ob-
No. of events
1
1
2
0
1
1
1
Example
1
2
3
4
5
6
7
servations were taken every 3 h , so hours of FR and S1 are somewhat underreported during this period.
In Fig. 3, 7 hypothetical examples are shown as illus- trations of this definition. In Example 1, 1 h of snow, 2 h of FR, and 1 h of S1 are followed by 18 h of rain. This would be considered 1 event with a 4 h duration, with the rain following the FR/S1 event. Example 2 shows that 23 h of no precipitation between FR hours would not be long enough to define 2 separate events, but 24 h of intervening no precipitation (Example 3) would define 2 separate FR/Sl events of 1 h each. Example 4 contains only snow, and would not be a FR/SI event. However, in Example 5, the event begins with snow which turns to FR after 2 h and therefore is classified as an event. This 3 h event has rain hours before and after, but they are not included as part of the event. Example 6 has only 1 h of FR, but does have frozen precipitation 19 h before (snow) and is therefore defined as a 20 h event. In Ex- ample ?, the preceding or following 20 h of (non-frozen) precipitation would not be part of the 1 h S1 event.
The event 'duration' was calculated as the total of 'event hours' - the total number of hours from the first reported to the last reported hour of frozen precipita- tion within 1 FR/Sl event. This could include hours with rain or without any precipitation as in Examples 2 & 6 (Fig. 3).
As noted earlier, FR/S1 events are usually associated with frontal situations and rapidly changing surface and upper air conditions. Since FR/SI events occur only un- der limited surface and upper air conditions, and since upper air characteristics change rapidly near fronts, all of the upper air data were restricted to reported FR/S1 hours occurring within 3 h of a 0000 or 1200 UTC upper air observation. Further, stations with fewer than 10 events were removed from the mapping, leaving Florida uncontoured in almost all figures.
Non-event hours
6hSn
5hR
20hR
Event hours
l h FR
Event hours
l h Sn, 2 h FR, 1 h S1
1 hSn,23hNP, 1 hFR
l hSn
2 h S n , l h F R
l h S n , 1 8 h R , l h F R
l hSl
Non-event hours
l 8 h R
24hNP
BhR
IOhR
2DhR
Gay & Davis: Freezing ram and sleet 2 13
RESULTS AND DISCUSSION
The Southeast has a n average of 1.6 + 1.7 events yr-l. Most events occur in January, followed by De- cember and February. Half a s many events occur in December and February as in January. Regional event duration is longest in December with 9.0 k 7.1 h event- ' , followed closely by January and February (8.7 k 5.4 and 8.6 f 5.8 h event-' respectively).
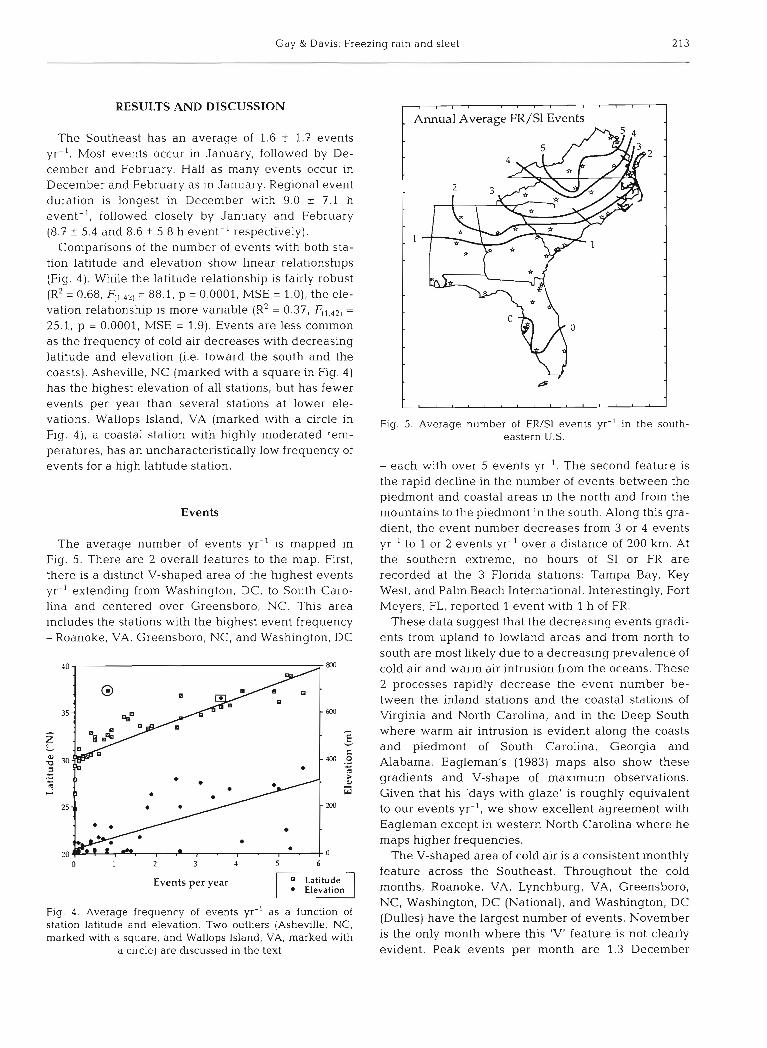
Comparisons of the number of events with both sta- tion latitude and elevation show linear relationships (Fig. 4). While the latitude relationship is fairly robust (R2 = 0.68, = 88.1, p = 0.0001, MSE = 1.0), the ele- vation relationship is more variable (R2 = 0.37, = 25.1, p = 0.0001, MSE = 1.9). Events are less common as the frequency of cold air decreases with decreasing latitude and elevation (i.e. toward the south and the coasts). Asheville, NC (marked with a square in Fig. 4) has the highest elevation of all stations, but has fewer events per year than several stations at lower ele- vations. Wallops Island, VA (marked with a circle in Fig. 4), a coastal station with highly moderated tem- peratures, has an uncharacteristically low frequency of events for a high latitude station.
Events
The average number of events yr-' is mapped in Fig. 5. There are 2 overall features to the map. First, there is a distinct V-shaped area of the highest events yr-I extending from Washington, DC, to South Caro- lina and centered over Greensboro, NC. This area includes the stations with the highest event frequency - Roanoke, VA, Greensboro, NC, and Washington, DC
0 1 2 3 6
Events per year Q Latitude Elevation i
Fig. 4 . Average frequency of events yr-' as a function of station latitude and elevation. Two outliers (Asheville, NC, marked with a square, and Wallops Island, VA, marked with
a circle) a re discussed in the text
. Annual Average FR/Sl Events
2
1
J
Fig. 5. Average number of FR/Sl events yr-' in the south- eastern U.S.
- each with over 5 events yr-l. The second feature is the rapid decline in the number of events between the piedmont and coastal areas in the north and from the mountains to the piedmont in the south. Along this gra- dient, the event number decreases from 3 or 4 events yr-' to 1 or 2 events yr-' over a distance of 200 km. At the southern extreme, no hours of S1 or FR a re recorded at the 3 Florida stations: Tampa Bay, Key West, and Palm Beach International. Interestingly, Fort Meyers, FL, reported 1 event with 1 h of FR.
These data suggest that the decreasing events gradi- ents from upland to lowland areas and from north to south are most likely due to a decreasing prevalence of cold air and warm air intrusion from the oceans. These 2 processes rapidly decrease the event number be- tween the inland stations and the coastal stations of Virginia and North Carolina, and in the Deep South where warm air intrusion is evident along the coasts and piedmont of South Carolina, Georgia and Alabama. Eagleman's (1983) maps also show these gradients and V-shape of maximum observations. Given that his 'days with glaze' is roughly equivalent to our events yr-l, w e show excellent agreement with Eagleman except in western North Carolina where h e maps higher frequencies.
The V-shaped area of cold air is a consistent monthly feature across the Southeast. Throughout the cold months, Roanoke, VA, Lynchburg, VA, Greensboro, NC, Washington, DC (National), a n d Washington, DC (Dulles) have the largest number of events. November is the only month where this 'V' feature is not clearly evident. Peak events per month are 1.3 December

Clim. Res. 3: 209-220. 1993
events in Roanoke, VA, 1.8 January events in Greens- boro, NC, and 1.2 February events in Roanoke, VA, Lynchburg, VA, and Greensboro, NC. The region of strongest gradient migrates north and south as the mean position of the polar front (and the southerly ad- vance of cold air) changes through the year. The total complement of mean and monthly maps can be found in Davis & Gay (1993).
Event durations
Over the entire year, the average event durations are highest in Roanoke, VA, Greensboro, NC, and Wash- ington, DC (Dulles) (over 6 h event-') and at the upland stations of Virginia, North Carolina and Georgia (not shown). Durations decline at the Georgia and Alabama piedmont along a north-south gradient. This pattern is not as clearly defined in the average winter months duration (December, January, and February) where the north-south gradient is prevalent only in the ex- treme southern regions (Fig. 6). Three of the upland stations average over 14 h event-' (Huntsville, AL, Asheville, NC, and Roanoke, VA). Between Lynchburg and Roanoke. VA, there is a difference of more than 4 h in average event duration. Most of the piedmont stations average between 10 and 12 h event-'. Jack- sonville, FL, seems to be an outlier, where its elevated winter average is dictated by one 24 h event in 12 total events.
. Winter Average FR/S1 12
- Event Durations
Fig. 6. Average hourly duration (h event-') of FR/Sl events for the winter months (January, February, and March) in the
southeastern U.S.
Fig. 7 Ratio of total reported FR hours to total reported S1 hours in the southeastern U.S.
Event durations are consistent from month to month throughout Virginia, North Carolina, and South Caro- lina. Exceptions occur at the coastal stations and in upland Georgia and Alabama. In March, durations decline quickly south of the Appalachians, probably resulting from restricted advance of cold air. April events are extremely rare, with most stations reporting 2 or fewer events in 40 yr.
FRISl ratios
The ratio of (observed) FR hours to (observed) S1 hours is very uniform across the upland Southeast but varies markedly along the coasts (Fig. 7). Both FR and S1 are more prevalent inland, and each decreases to- wards the coasts. However, FR decreases 3 times faster than does S1, so there are fewer FR hours relative to S1 hours and a decreasing FR/Sl ratio.
Most inland areas have ratios from 2.0 to 2.5 with maxima in Atlanta, GA, and Charlotte, NC (2.7 and 2.5 respectively). The area is broad, covering most of the sites in Virginia, North Carolina, South Carolina and Georgia. It is interesting that Huntsville and Birming- ham, AL (with ratios of 0.9 and 1.1 respectively) are much different from nearby upland Georgia stations. This FR/S1 ratio can be extremely sensitive to local effects, such as the development of cold air dams, in- versions, and urban influences.
Many of the northern coastal stations have ratios at or below 1.0. Washington, DC (National) has a ratio of approximately 1.0 (767 observations), and Cherry

Gay & Davis: Freezing rain and sleet 215
Point, NC, Norfolk, VA, and Oceanus Naval Air Station (N.A.S.), VA, all have ratios less than 1.0 (more than 190 observations each). The same is true for several Florida stations, although this is based upon fewer ob- servations. Exceptions include coastal areas of South Carolina and southern North Carolina, with ratios from 1.5 to 2.0 and higher. Low FR to S1 ratios (<l) are re- ported at stations with elevations below 200 m and less than 100 observed hours. Our hypothesis for this is that coastal stations, having ocean-moderated, warmer sur- face temperatures, experience less FR and a lowered FRISl ratio. Upland stations are colder and experience less warm air advection which leads to colder surface temperatures, more FR observations and larger FR/SI ratios.
Washington, DC (National) may be an example of urban heat island influences decreasing FR occur- rence. National Airport is located in the center of the Washington metroplex and has a FRIS1 ratio of 1.0 (767 observations over 40 yr), while Dulles Airport is located 30 miles east in semi-rural Virginia and has a ratio of 2.1 (642 observations over 25 yr). We propose that urban heating more frequently maintains surface temperatures above 273.0K, resulting in fewer FR observations and a lower FR/Sl ratio. Reduced FR in urban areas has been noted before by at least 2 re- searchers (Bennett 1959, for 2 Russian cities; Ackely & Itagaki 1970, in the northeastern U.S.). Further, signif- icant urban warming of temperatures in towns and cities is well documented (e.g. Ackerman 1985, Karl et al. 1988). Between 1961 and 1990, National Airport is consistently 2 to 4 "F warmer on average throughout all months than Dulles (NCDC 1992). However, some warming at National may be partly due to moderating influences of the Potomac River. Between 1963 and 1989 (both airports operating), S1 observations were fairly consistent between National and Dulles Airports (r = 0.404). An unpaired, 2 sample t-test indicates that the S1 means are not significantly different (a = 0.05) and neither time series has a significant trend. The same test for FR indicates that the means are signifi- cantly different.
Surface and upper air temperatures
Upper air temperatures during FR/S1 events are im- portant in determining the precipitation type observed at the surface. However, recall that our upper air data are gridded values which we assume are representa- tive of large areas. This point is particularly important when using these values to discuss meteorological sit- uations with highly variable temperature fields.
FR/S1 theory requires surface temperatures at or be- low 273.0K for FR and suggests colder temperatures
for S1 because of the necessity of a deep, cold layer. The average surface temperature differences between FR and S1 events (FR minus S1; Fig. 8), in fact, show that most stations have colder temperatures for FR than for S1 (negative values). There are 4 exceptions to this finding, however (Athens, GA, Greensboro, NC, and Columbia and Greenville, SC). The FR tem- perature maximum is restricted by the requirement for freezing surface temperatures, but S1 does not have this surface temperature requirement. The largest temperature differences are found along the coasts and throughout the Deep South. The location of the 273.0K surface isotherm under S1 conditions (not shown) corresponds very well with the location of the 2.0 FR/Sl ratio line (Fig. 7). This indicates that above- freezing surface temperatures lead to reduced FR oc- currence and a lower FR/S1 ratio, rather than more S1. This correlation may be further affected by possible urban influences.
For FR, all of the mean surface temperatures are at or below 273.0K (Fig. 9). Temperatures range from about 271.0 to above 272.5K along a generally north to south gradient. Virginia and North Carolina coastal stations are warmer than equal-latitude inland stations, but the opposite is found for coastal South Carolina and Georgia. Mean surface S1 temperatures exhibit a higher variance for both below- and above-freezing values. The entire middle Southeast has surface S1 temperatures between 271.5 and 273.0K. Other stations, particularly those to the south, have mean temperatures above 274.5 K with the warmest surface temperatures at 2 northern coastal stations (Norfolk and Oceanus N.A.S., VA).
Positive temperature differences dominate at the 850 mb level over the Southeast (Fig. 8) , meaning that FR temperatures are higher than the corresponding S1 temperatures. Over all of Virginia, North Carolina, and South Carolina, the 850 mb temperature differences are between 0 and +3K. Over the State of Georgia, however, the differences are almost all negative (an observation for which we have no explanation). Furthermore, Mobile and Montgomery, AL, have the largest positive values of +6 and +?K, while nearby Macon, GA, has a negative value of more than 4K.
Almost all of the FR temperatures are in the same 'quadrant' of Fig. 9, with a majority of 850 mb tempera- tures above 273.0K and much warmer than surface FR temperatures. Most upland 850 mb temperatures are between 273.0 and 276.0K while temperatures are lower in the mid-Southeast and higher in the southern coastal and northern areas. For S1, the 850 mb tempera- tures are generally lower than for FR, with temperatures ranging from less than 270.0 to 279.0K. The majority of upland temperatures are between 272.0 and 276.0K and are about 1 K lower than FR temperatures.

216 Clim. Res. 3: 209-220, 1993
Station
Fig. 8. Difference in mean temperature be- tween FR and S1 events (PR minus S1) for both 850 mb and the surface, for each Southeast study site. Solid bar: AT at the surface; hatched
bar: AT at 850 mb
Overall, surface temperatures are higher during S1 than during FR events at 25 of 29 sites shown and, at 850 mb, S1 temperatures are lower than FR tempera- tures at most sites outside of Georgia. Thus, the low- level inversion tends to be stronger during FR events, with a colder surface and a warmer 850 mb level.
In other analyses of FR/Sl temperatures, Young (1978) found that FR temperatures for the southern U.S. averaged 277.25K at 850 mb and 271.50K at the surface, in agreement with our findings. His average S1 temperatures, 269.75K at the surface and 272.70K at 850 mb, are much colder than both our temperatures and the findings of other researchers. Bryson & Hare (1974) found average temperatures for mixed precipi- tation in Canada (FR, S1, and snowhain mixtures) to be 277.25K at 850 mb and between 268.00 and 273.00K at the surface.
268 269 270 W1 2i2 273 W4 275 276 277 278 279
Surface temperature (K)
- .
278 - - 277 - E
2 276-
2 275-
274-
273 1 F m: 2 271-
0 270- V)
m 269-
i
Fig. 9. Average surface and 850 mb temperatures (K) for FR and S1 events
Thickness
m
m . C m . m .. 80 m .
,,=':m m. . 0 0
n .A 0
m
. . . I . . . . . I
Layer thicknesses have a large impact upon the sur- face precipitation type. Thicknesses are directly re- lated to the average layer temperature according to the hypsometric (thickness) equation:
0
O O o
0 0
o m o o o 0
0
D 0
o 0 Sleet n Freezing Rain
. . . . . .
where the difference in height (thickness) of the layer bounds (Z, and Z,) is equivalent to the product of the average virtual temperature of the layer (z), the dry air gas constant (Rd), the inverse of the average surface gravity force (g0), and the natural log of the layer boundary pressure ratio (P, and P2). Therefore, as a layer warms (virtual temperature increases), its thick- ness increases (Wallace & Hobbs 1977). A 1000 to 500 mb thickness of 5400 m is commonly used in fore- casting to denote the snow-rain transition region (Heppner 1992).
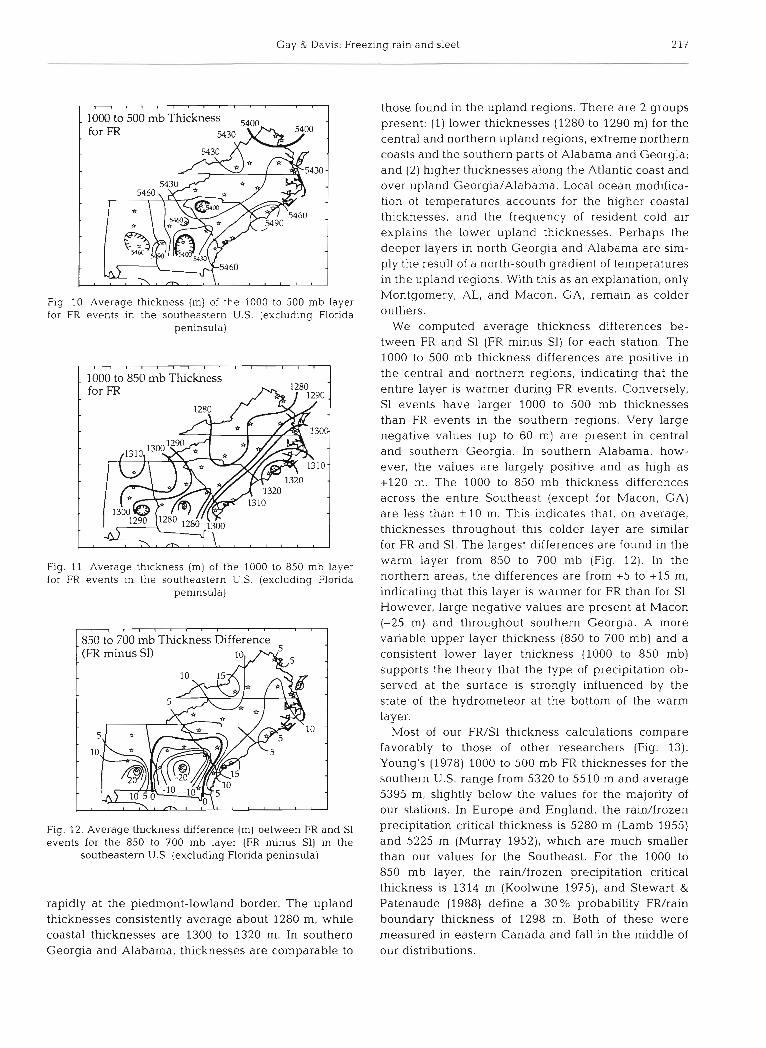
During FR events, the central mountain and pied- mont regions have mean 1000 to 500 mb thicknesses between 5400 and 5460 m (Fig. 10). Over the coasts and southern US., FR occurs in warmer layers with thicknesses greater than 5460 m. Based upon this map, the 5400 m thickness line should not be used as a 'general' rule for forecasting FR occurrence over the Southeast. Rather, this critical thickness varies signifi- cantly from station to station, which is also supported by Heppner (1992).
The 1000 to 850 mb thickness map has the same 2 general characteristics, but there are areas with steep thickness gradients (Fig. 11). Thicknesses increase
Gay & Davis: Freezing rain and sleet 217
those found in the upland regions. There are 2 groups present: (1) lower thicknesses (1280 to 1290 m) for the central and northern upland regions, extreme northern coasts and the southern parts of Alabama and Georgia; and (2) higher thicknesses along the Atlantic coast and over upland Georgia/Alabama. Local ocean modifica- tion of temperatures accounts for the higher coastal thicknesses, and the frequency of resident cold air explains the lower upland thicknesses. Perhaps the deeper layers in north Georgia and Alabama are sim- ply the result of a north-south gradient of temperatures in the upland regions. With this as an explanation, only Montgomery, AL, and Macon, GA, remain as colder
Fig. 10. Average thickness (m) of the 1000 to 500 mb layer for FR events in the southeastern U.S. (excluding Florida
peninsula) We computed average thickness differences be- tween FR and S1 (FR minus S1) for each station. The 1000 to 500 mb thickness differences are positive in
Fig. 11 Average thickness (m) of the 1000 to 850 mb layer for FR events in the southeastern U.S. (excluding Florida
peninsula)
Fig. 12. Average tiuckness difference (m) between FR and S1 events for the 850 to 700 mb layer (FR minus S1) in the
southeastern U.S. (excluding Florida peninsula)
rapidly at the piedmont-lowland border. The upland thicknesses consistently average about 1280 m, while coastal thicknesses are 1300 to 1320 m. In southern Georgia and Alabama, thicknesses are comparable to
the central and northern regions, indicating that the entire layer is warmer during FR events. Conversely, S1 events have larger 1000 to 500 mb thicknesses than FR events in the southern regions. Very large negative values (up to 60 m) are present in central and southern Georgia. In southern Alabama, how- ever, the values are largely positive and as high as +l20 m. The 1000 to 850 mb thickness differences across the entire Southeast (except for Macon, GA) are less than + 10 m. This indicates that, on average, thicknesses throughout this colder layer are similar for FR and S1. The largest differences a re found in the warm layer from 850 to 700 m b (Fig. 12). In the northern areas, the differences are from +S to + l 5 m, indicating that this layer is warmer for FR than for S1. However, large negative values are present at Macon (-25 m) and throughout southern Georgia. A more variable upper layer thickness (850 to 700 mb) and a consistent lower layer thickness (1000 to 850 mb) supports the theory that the type of precipitation ob- served at the surface is strongly influenced by the state of the hydrometeor a t the bottom of the warm layer.
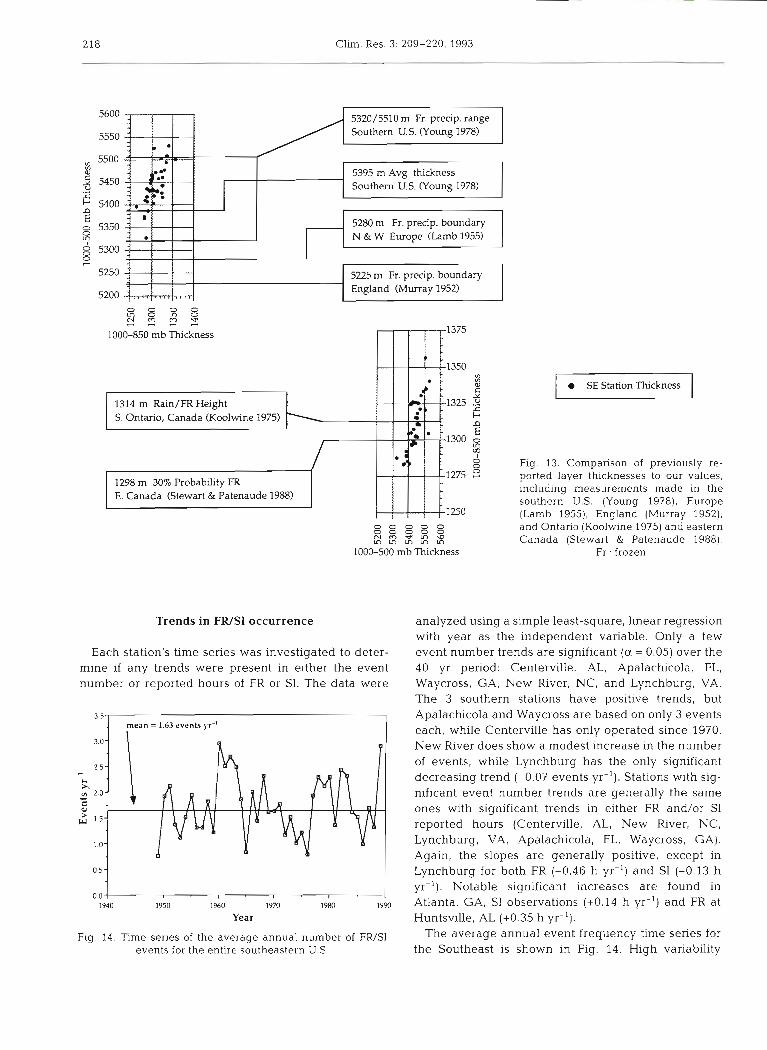
Most of our FRS1 thickness calculations compare favorably to those of other researchers (Fig. 13). Young's (1978) 1000 to 500 mb FR thicknesses for the southern U.S. range from 5320 to 5510 m and average 5395 m, slightly below the values for the majority of our stations. In Europe and England, the raidfrozen precipitation critical thickness is 5280 m (Lamb 1955) and 5225 m (Murray 1952), which are much smaller than our values for the Southeast. For the 1000 to 850 mb layer, the raidfrozen precipitation critical thickness is 1314 m (Koolwine 1975), and Stewart & Patenaude (1988) define a 3 0 % probability FR/rain boundary thickness of 1298 m. Both of these were measured in eastern Canada and fall in the middle of our distributions.
Clim. Res. 3: 209-220, 1993
5320/5510 m Fr. preap. range Southern U.S. (Young 1978)
5395 m Avg thickness Southern U.S. (Young 1978) -
5280 m Fr. precip. boundary N & W Europe (Lamb 1955)
I
5225 m Fr. precip. boundary England (Murray 1952)
- 0 0 ? i f a s
1000-850 mb Thickness
( E. Canada (Stewart & Patenaude 1988) 1
1314 m Rain/FR Height S. Ontario, Canada (Koolwine 1975)
0 0 0 0 0 0 0 0 0 0 z z x s 3
1000-500 rnb Thickness
\
Trends in FRlSl occurrence
1298 m 30% Probability FR
Each station's time series was investigated to deter- mine if any trends were present in either the event number or reported hours of FR or S1. The data were
1 mean = 1.63 events vi' I
0.0 I I 1940 1950 1960 1970 1980 1990
Year
Fig. 14. Time series of the average annual number of FR/SI events for the entire southeastern U.S.
m SE Station Thickness
Fig. 13. Comparison of previously re- ported layer thicknesses to our values, including measurements made in the southern U.S. (Young 1978). Europe (Lamb 1955), England (Murray 1952), and Ontario (Koolwine 1975) and eastern Canada (Stewart & Patenaude 1988).
Fr.: frozen
analyzed using a simple least-square, linear regression with year as the independent variable. Only a few event number trends are significant (a = 0.05) over the 40 yr period: Centerville, AL, Apalachicola, FL, Waycross, GA, New River, NC, and Lynchburg, VA. The 3 southern stations have positive trends, but Apalachicola and Waycross are based on only 3 events each, while Centerville has only operated since 1970. New River does show a modest increase in the number of events, while Lynchburg has the only significant decreasing trend (-0.07 events yr-l). Stations with sig- nificant event number trends are generally the same ones with significant trends in either FR and/or S1 reported hours (Centerville, AL, New River, NC, Lynchburg, VA, Apalachicola, FL, Waycross, GA). Again, the slopes are generally positive, except in Lynchburg for both FR (-0.46 h yr-l) and S1 (-0.13 h yr-l). Notable significant increases are found in Atlanta, GA, S1 observations (+0.14 h yr-l) and FR at Huntsville, AL (+0.35 h yr-l).
The average annual event frequency time series for the Southeast is shown in Fig. 14. High variability

Gay & Dav~s. Free211 ~g rain and sleet 219
about the regional mean of 1.63 events yr-' occurs throughout the record. High frequency years include the early 1960s and 1988. Lower frequency years occur in the mid-1970s and in 1964. Over all years, there is no significant trend.
Summary and conclusions
On average, the Southeast has 1.6 k 1.7 FR/Sl events yr-', ranging from zero events at 3 Florida stations (Tampa Bay, Key West, and Palm Beach) to 5.6 events yr-' at Roanoke, VA. Most events occur in January, and December and February have slightly lower frequen- cies. Event duration is longest in December with 9.0 ? 7.1 h event-', followed closely by January and February (8.7 i. 5.4 and 8.6 ? 5.8 h event-').
Based on 40 yr of climatological data, event distribu- tions in the Southeast U.S. show 2 general features. A large V-shaped wedge of high event frequency is observed over inland/mountain Virginia and North Carolina. The highest average is over 5 events yr-' at Roanoke and Lynchburg, VA, Greensboro, NC, and Washington, DC. These high event frequencies de- crease in the northern coastal regions (except in Washington, DC) and in the southern piedmont and lowlands. Two general decreasing gradients of FR and S1 events are observed: (1) north to south, and (2) mountain to coastal.
FR and S1 event duration is highest in the northern regions. Roanoke, VA, Greensboro, NC, and Wash- ington, DC (Dulles) have the longest average dura- t i o n ~ , with the typical winter event lasting over 12 h. Most of upland Virginia and North Carolina experi- ence events of this length, and durations decline as one moves south.
The FR to S1 ratio is also divided into upland and coastal groups. Upland and piedmont stations have almost exclusively 2.0 or 2.5 FR hours to 1.0 S1 hour. However, the coasts are much different, where ratios vary widely. Washington, DC (National) is thought to be an example of warming from an urban heat island reducing the occurrence of FR.
Temperatures at the surface and at 850 mb generally follow accepted theory. FR surface temperatures are just below freezing (from 271.0 to 272.5K). At 850 mb, FR temperatures are mostly above 273.0K and warmer than those of S1, although some stations (particularly in Georgia) have the opposite tendency. S1 temperatures vary much more than FR temperatures at both the sur- face and the 850 mb level, and are both higher and lower than FR temperatures.
Layer thicknesses, related directly to layer tempera- tures, are highly variable over the Southeast. The 1000 to 500 mb thicknesses vary by more than 60 m over the
interior Southeast, and southern stations have larger thicknesses. Thickness changes quite rapidly at the piedmont-lowland boundary. Thickness differences between S1 and FR are greater in the 850 to 700 m b layer than in the 1000 to 850 mb layer, supporting the theory that the hydrometeor state at the warm/cold boundary is important in determining surface precipi- tation type. Most Southeast stations have a thicker (warmer) 850 to 700 mb layer for FR than for S1. In Georgia, however, this 1s generally reversed (the 850 to 700 mb layer is cooler for FR).
Only a few stations had statistically significant trends (a = 0.05) over the past 40 yr. Increasing num- bers of events have occurred at Centerville, AL, Waycross, GA, Apalachicola, FL, and New River, NC. Lynchburg, VA, was the only location with signifi- cantly decreasing numbers of events and reported S1 and FR hours. Other notable increases were found in Atlanta, GA, S1 observations (+0.14 h yr-l) and Huntsville, AL, FR observations (+0.35 h yr-l).
Frozen precipitation has great economic influence and extensive study of it is required. This research is only the beginning of such a n effort. For future work, we suggest the following topics: (1) a climatological study of this type for the entire United States, describ- ing events, event durations and upper air conditions, (2) a synoptic-scale and meso-scale climatology of FR and S1 events to more precisely define conditions lead- ing to these events and to aid in their forecasting, (3) studies that concentrate on specific parameters that are summarized here, such as height of the freezing level under varying conditions, evolution of precipita- tion type during events, or variation of surface pres- sure and winds during events.
Acknowledgments. This work was supported through a grant provided by the Southeast Regional Clmate Center (NOAA #NA26CP0329-02). A full report including specific station val- ues is available by request (Research Paper #052593) from the SERCC at this address: Southeast Regional Climate Center, South Carolina Water Resources Commission, 1201 Main Street, Suite 1100, Columbia, SC 29201, USA, tel. (804) 737- 0800. We thank Scott Webber (University of Delaware) for providing the NOAA Upper Air dataset, Chip Knappenburger (Office of the Virginia State Clunatologist) for his analysis and quality assurance help, and both Tanya Larson and Beth Pierce for their organizational and graphics work.
LITERATURE CITED
Ackerman, B. (1985). Temporal march of the Chicago heat is- land. Bull. Am. met. Soc. 24: 547-554
Ackely, S. F., Itagaki, K. (1970). Distribution of icing in the Northeast's ice storm of 26-27 December 1969. Weatherwise 23: 274-279
Bennett, I. (1959). Glaze: its meteorology and climatology, geographical distribution, and economic effects. Technical Report EP-105, U.S. Army Quartermaster Research and

220 Clirn. Res. 3:
Engineering Command, Environmental Protection Research Division, Natick, MA
Brooks, C. F. (1914). The ice storms of New England. Harvard University Press. Cambridge
Brooks, C . F. (1920) The nature of sleet and how i t is formed. Mon. Weather Rev. 48: 69-72
Bryson, R. A., Hare, F. K. (1974). World survey of climatology, Vol. 11, Climates of North America. Elsevier Scientific Publishing Co., Amsterdam
Davis, R. E., Gay, D. A. (1993). Freezing rain and sleet clima- tology of the southeastern U.S.A. (Research Paper #052593) Southeast Regional Climate Center, Columbia, SC
Donaldson, N. R., Stewart, R. E. (1989). O n the precipitation regions within two storms affecting Atlantic Canada. Atmos.-Ocean 27: 108-129
Downs, A. A. (1938). Glaze damage in the birch-beech- maple-hemlock type of Pennsylvania and New York. J. For. 36: 63-70
Eagleman. J. R. (1983). Severe and unusual weather. Van Nostrand Reinhold Co., Inc., New York
Heppner, P. 0. G. (1992). Snow versus rain: looking beyond the ' m a g ~ c ' numbers. Weather Forecast. 7: 683-691
Huschke, R. E. (ed.) (1959). Glossary of meteorology. American Meteorology Society, Boston
Karl, T. R., Diaz, H F., Kukla, G (1988). Urbanization: its detection and effect in the United States climate record. J. Climate 1: 1099-1123
Koolwine, T. (1975). Freezing rain. M S c . thesis, University of Toronto
Lamb, H. H. (1955). Two-way relationship between the snow and ice limit and 1000-500 mb thicknesses in the overlay- lng atmosphere. Quart. J R. meteorol. Soc. 19: 354-355
Matsuo, T., Sasyo, Y., Sato, Y (1981). Relationship between types of precipitation on the ground and surface meteoro- logical elements J. meteorol. Soc. Japan 59: 462-475
Martner, B. E., Sn~der , J . B., Zamora, R. J., Byrd, G. P.. Niziol, T. A., Joe, P. I. (1993). A remote-sensing view of a freez- ing-rain storm. Mon. Weather Rev. 121: 2562-2577
McNayr, J . S. (1944). Unusual ice storm in Louisiana, January 13-14. 1944. Bull. Am. met. Soc. 25: 196
McQueen, H. R., Keith, H. C. (1956). The ice storm of January 7-10, 1956 over the northeastern United States Mon. Weather Rev. 84: 35-45
Murray. R. (1952). Rain and snow in relation to the 1000-700 mb. and 1000-500 mb. thicknesses and the freezing level. Meteorol. Mag. 81. 5-8
National Climatic Data Center (NCDC) (1991). Surface air- ways hourly TD-3280 and airways solar radiation TD- 3281. U.S. Department of Commerce, National Oceanic and Atmosphenc Administration (NOAA), Federal Building, Asheville, NC
National Climatic Data Center (NCDC) (1992). Monthly sta- tion normals of temperature, pressure, and heating and cooling degree days; 1961-1990, Virginia. U.S. Depart- ment of Commerce, National Oceanic and Atmospheric Administration (NOAA), Federal Budding, Asheville, NC
National Center for Atmospheric Research (NCAR) (1975). Northern hemisphere octagonal grid data. U.S. Depart- ment of Commerce, National Oceanic and Atmospheric Administration (NOAA), Boulder, CO
Okada, T. (1914). Notes on the formation of glaze. Mon. Weather Rev. 42. 284-286
Spiegler, D. B., Fisher, G. E . (1971). A snowfall pred~ction method for the Atlantic seaboard. Mon. Weather Rev. 99: 31 1-325
Stewart, R. E . (1985) Precipitation types in winter storms. Pure appl. Geophys. 123: 597-609
Stewart, R. E. (1991). On the temperatures near and the motions of low-pressure centres in winter storms. Atmos. Res. 26: 33-54
Stewart, R. E. (1992). Precipitation types in the transition region of winter storms. Bull. Am met. Soc 73: 287-296
Stewart, R. E., King, P. (1987). Freezing precip~tatlon in winter storms. Mon. Weather Rev. 115: 1270-1279
Stewart, R. E., Patenaude, L. M. (1988). Rain-snow boundaries and freez~ng precipitation In Canadian east coast winter storms. Atmos.-Ocean 26: 377-398
Stewart, R. E., Yiu, D. T. (1993). Distributions of precipitation and assoc~ated parameters across precipitation type tran- sitions over southern Ontano. Atrnos. Res. 29: 153-178
Tannehill, I. R. (1929). Wet and dry northers. Mon. Weather Rev. 57: 136-142
Wallace, J . M,, Hobbs, P. V. (1977). Atmosphenc sciences: an introductory survey. Academic Press, Inc., New York
Young, W. R. (1978). Freezing precipitation in the southeast- ern United States. M.Sc. thesis, Colorado State Un~versity, Fort Coll~ns
Editor: V Meentemeyer Manuscript first received: June 30, 1993 Revised version accepted: October 19, 1993