free but costly - beacon hill
TRANSCRIPT
Free But Costly: An Economic Analysis of a Wind Farm in Nantucket Sound Douglas Giuffre Jonathan Haughton David G. Tuerck
Beacon Hill Institute at Suffolk University 8 Ashburton Place, Boston, MA 02108 Web: www.beaconhill.org phone: 617-573-8750 fax: 617-720-4272 email: [email protected] March 2004 ISBN-1-886320-22-5

Free But Costly: An Economic Analysis of a Wind Farm in Nantucket Sound Page 2 of 34
Table of Contents
Executive Summary...................................................................................................................... 3
1. Introduction....................................................................................................................... 7
2. Economic Costs and Benefits ........................................................................................... 8 Economic Benefits 1: Fuel Saved .................................................................................................... 8 Economic Benefits 2: Less Capital Expenditure............................................................................ 10 Economic Benefits 3: Lower Emissions ........................................................................................ 11 Economic Benefits 4: Energy Independence ................................................................................. 12 The Economic Costs ...................................................................................................................... 13
3. Financial Costs and Benefits .......................................................................................... 15 Financial and Economic Returns Reconciled ................................................................................ 15 Is the amount of subsidy appropriate? ........................................................................................... 16
4. Robustness ....................................................................................................................... 18
5. Jobs................................................................................................................................... 22
6. Electricity Prices and the Consumer............................................................................. 24
Appendix: Distributions of Risk Variables............................................................................... 27
References.................................................................................................................................... 32

Free But Costly: An Economic Analysis of a Wind Farm in Nantucket Sound Page 3 of 34
Executive Summary
Cape Wind Associates proposes to build the world’s largest offshore wind farm, with 130 tall turbines, on
a 24 square mile area of Horseshoe Shoals in Nantucket Sound. The project is controversial. Cape Wind
argues that the project will lower electricity costs to consumers, reduce emissions from power plants in
the New England region, contribute to greater energy diversity and independence and create more jobs on
Cape Cod. Critics of the project are concerned about the high cost of offshore wind-generated electricity
and warn against the environmental impacts and aesthetic effects of 130 windmills, which they fear will
deter tourists and depress land values.
In October 2003, the Beacon Hill Institute published Blowing in the Wind: Offshore Wind and the Cape
Cod Economy. In that study, authors Jonathan Haughton, Douglas Giuffre and John Barrett reported and
interpreted the responses of a thousand tourists and home owners whom DAPA Research had surveyed
over the course of the preceding summer. The purpose of that study was to assess the principal effects of
the wind farm on the Cape Cod economy. The findings were:
• There would be a small decline in tourism, causing the loss of 1,173 to 2,533 jobs.
• According to homeowners, property values would fall by 4.6% or by $1.35 billion.
• According to an overwhelming majority of tourists and homeowners, the wind farm should be required to pay a royalty to operate on Horseshoe Shoal. On the average, homeowners suggested a royalty of 8.06% and tourists a royalty of 7.66% of sales.
While these effects on the Cape Cod economy are important, they do not account for the full array of
economic costs and benefits that the wind farm would impose or confer on the greater society. One of the
principal benefits of wind power, much emphasized by its advocates, is the reduction in fossil fuel
consumption and the attendant environmental benefits and improved energy independence. The wind
farm is undergoing a review process, the outcome of which will depend in part on the assessment of these
and other benefits.
It is not enough to rely on piecemeal claims about costs and benefits in deciding an issue as vast and
complex as that posed by this project. The developer has chosen to place an installation remarkable for
its size in a location remarkable for its pristine character. In doing so, Cape Wind has challenged the
regulatory authorities and the greater community to provide a comprehensive framework within which it
is possible to assess at least the most important of the economic costs and benefits in a systematic,
objective fashion.

Free But Costly: An Economic Analysis of a Wind Farm in Nantucket Sound Page 4 of 34
This report aims to provide the framework required for this task. There is the danger that, because the
wind is “free” and fossil fuel is not, the project will proceed without adequate consideration of the very
real costs that it would impose. This would be as short sighted as an automatic rejection of the project
because it would not pass muster financially without subsidization by government.
Our report quantifies the economic costs that the project would impose and the economic benefits that it
would confer. The costs include those of installing and operating the physical plant and of integrating it
into the New England power grid. They include, as well, such “external costs” as the project might
impose, costs that we classify under the rubric of environmental effects – generally, the negative aesthetic
effects on the view of Nantucket Sound that the project would have plus negative effects on birds and
marine life. The benefits include the reduction in fossil fuel burned, the reduced emissions and the
greater energy independence.
Once the sum of the benefits and the sum of the costs are calculated, we subtract the second from the first
to obtain a measure of the net benefits to society. This measure provides a bottom-line assessment of
whether, from the point of view of the greater society, the project should go forward, or not. It is akin to
the up-or-down verdict of a jury on which every stakeholder has a place.
For the proposed wind farm, the jury is in. The economic costs of the project, in present value terms,
come to $947.2 million. The economic benefits come to $735.5 million. The costs exceed the benefits
by $211.8 million (the difference owed to rounding). Based on these numbers, it does not make sense,
from a societal point of view, to build the project. The wind may be free, but wind power from
Nantucket Sound is costly.
Yet Cape Wind is eager to see the project built. This is because of the difference between (1) the
economic costs and benefits of the project to society as a whole and (2) the narrower financial costs and
benefits to Cape Wind. We show that the project would indeed make a positive (if modest) profit for the
developer even as it imposes a net economic loss.
Despite being economically undesirable, the project would be privately profitable because of the very
large subsidies that it would receive. The most important subsidy would stem from the “green credits”
that result from recent changes to the law in Massachusetts: Electricity consumers in the Commonwealth
are required to buy a growing proportion of their electricity from new renewable sources, requiring them,

Free But Costly: An Economic Analysis of a Wind Farm in Nantucket Sound Page 5 of 34
in practice, to pay a premium for their power. This premium will raise the price received by Cape Wind,
normally 4.7 cents per kilowatt hour (kWh), by about 2.5 cents/kWh and amounts to a total subsidy (in
present value terms) of $157 million from Massachusetts ratepayers.
A Federal Renewable Electricity Production Credit (REPC), which expired in 2003 but is expected to be
reinstated later this year, is likely to raise the “levelized” (revenue per kWh, in present value terms)
revenue by a further 0.8 cents/kWh and represents a total subsidy of $84 million.
Wind energy is clean, and so it is appropriate to subsidize its production relative to power plants that use
fossil fuels. But because the Cape Wind project would inflict net economic losses on society as a whole,
it follows that the subsidy it would receive must be larger than socially desirable.
Cape Wind would receive a subsidy of 3.3 cents/kWh. We estimate that the appropriate subsidy would
be 2.24 cents/kWh. The difference, 1.06 cents/kWh, is the amount by which society will overpay for
electricity produced by the wind farm if the project goes on line. This is equivalent to an excess subsidy
of $74 million.
It is worth noting, in addition, that even had the wind farm turned out beneficial to the greater society, its
practical value to the immediate community it is intended to serve would be small. This is in part because
of the small amount of generating capacity that it would add to that already in existence and in part because
the fact that any saving in electricity prices would be short lived.
At its maximum, the portion of existing electricity represented by wind farm production would be
0.94% for New England and 2.51% for Massachusetts. And, while there would be some immediate
saving to ratepayers, that saving would be captured mainly by commercial and industrial users and
would dissipate in no more than a year. Moreover, the effects on the Cape economy would, as our
earlier study showed, almost certainly be negative. The jobs that the installation and operation of the
facility would bring about would be more than offset by the job reduction due to decreased tourism; the
net effect is that the Cape would lose at least 1,000 jobs.
Another question is, “Why this project?” The project would not be a significant moneymaker for the
developer. We find that the project would yield a respectable but modest 12.2% rate of return on equity.
The rate of return could be as high as 18.1% but as low as 6.6%. The project would be expected to yield a
profit (in present value terms) of $41.7 million. But there is no guarantee that it will make a profit of this

Free But Costly: An Economic Analysis of a Wind Farm in Nantucket Sound Page 6 of 34
size or, for that matter, break even. Unforeseen increases in construction or maintenance costs and the
unpredictability of wind speeds add an element of risk to this enterprise.
There is a 12% chance that the wind farm would lose at least $50 million. This raises the question of
what happens to the wind turbines should financial considerations lead the developer to shut down the
project. It also strengthens the case for contingency plans aimed at dismantling the turbines in the
event that they are ultimately taken off line.
That its developers would incur the risks posed by this project is curious in light of the relatively better
odds for success in building a land-based facility. Wind farms in West Texas appear to operate at half the
cost of the proposed Horseshoe Shoal wind farm.
An appropriately-placed land-based facility in an area with wind conditions comparable to, or even
significantly less than, those on Horseshoe Shoal would be substantially less costly for the greater
society than the Cape Wind project.
One might think that the unique and pristine character of Nantucket Sound would figure strongly into our
determination that the social costs of the Cape Wind project would outweigh the social benefits. But that
is not so. Even if we ignore the aesthetic and environmental costs of producing wind power at this
particular site, the economic costs exceed the economic benefits. Our study stands as warning, therefore,
against offshore wind power anywhere along the U.S. coastline, not just at this site. Cape Wind may
prevail in its efforts to build in Nantucket, but it will be despite, rather, than because of any benefits to the
greater society. And, oddly, Cape Wind itself might end up not benefiting as much as it expects.
_____________________________________________________________
The Beacon Hill Institute gratefully acknowledges the Egan Family Foundation, which provided support for this project. Neither the Foundation nor any other entity played any role in the design, execution or production of this study.

Free But Costly: An Economic Analysis of a Wind Farm in Nantucket Sound Page 7 of 34
1. Introduction
In November 2001, a private developer, Cape Wind Associates, filed an application with the U.S. Army
Corps of Engineers for permission to construct the nation’s first offshore wind farm in Nantucket Sound.
The project would consist of 130 wind turbines, the world’s biggest, each approximately 420 feet tall,
arrayed over a 24 square mile area of the Sound known as Horseshoe Shoals. The wind farm would be
sited five miles off the coast, in federal Outer Continental Shelf (OCS) waters. From there, undersea
cables would transmit power through state waters to an onshore distribution grid. The project, according
to Cape Wind, would have an installed nameplate capacity of approximately 468 megawatts (MW) of
electricity.
The project is controversial. Cape Wind argues that the project will lower electricity costs to consumers,
reduce emissions from power plants in the New England region, create more jobs on Cape Cod, and
contribute to greater energy diversity and independence. Critics of the project are concerned about the
high cost of wind-generated electricity, about environmental impacts and about the aesthetic effects of
130 windmills on the horizon, which they fear will deter tourists and depress land values.
The project is subject to an extensive regulatory review process, involving a number of federal, state and
local regulatory authorities. Because the project would be sited in federal coastal waters, the Army Corps
of Engineers, through its permitting authority, has a key role in this process. The Army Corps’ guidelines
recognize the importance of considering the “reasonable use expectations of the general public and
waterfront landowners” in deciding whether to issue a permit for projects of this kind.1
Whether use of a public asset such as Nantucket Sound is “reasonable” or not depends in part on how,
from a societal point of view, the benefits it would confer compare to the costs it would impose. This
study reports the results of a systematic cost-benefit analysis of the siting of the proposed wind farm in
the Sound.
This report addresses three major questions:
1. What are the economic costs and benefits of the Cape Wind proposal?
2. What are the financial costs and benefits of the project, from the point of view of Cape Wind?
3. Is the level of subsidy to the project appropriate?
To answer these questions we constructed a detailed cost-benefit and risk analysis of the windmill project.

Free But Costly: An Economic Analysis of a Wind Farm in Nantucket Sound Page 8 of 34
2. Economic Costs and Benefits
An economic cost-benefit analysis identifies, measures and compares the resource benefits of a project
with the resource costs. For instance, in the context of a wind power project, the economic benefits
include the value of fossil fuels saved and emissions averted; however, subsidies to the project are
transfers from one part of society to another, and do not represent economic benefits (although of course
they represent financial benefits to the project’s owners). We now turn to a systematic examination of the
economic benefits and costs of the Cape Wind project.
The method we used was as follows: first we built a spreadsheet to determine the economic and financial
benefits and costs of the project, using the best available information on all of the input variables (the
price of fuel, the cost of construction, and so on). Many of the important input variables are either not
known with certainty (e.g., the future price of green credits) or are inherently variable (e.g., the speed of
the wind). For each of these variables we specified a distribution that reflects our judgment of the type
and extent of their variability; the details are set out in the Appendix. We then took 10,000 random
drawings from these distributions and for each drawing we recomputed the output variables, including the
economic costs and benefits and the financial rate of return. The results reported below are the mean
values that result from this exercise; the confidence intervals show the range within which we are 90%
certain that the truth lies, based on our analysis and simulations.
Economic Benefits 1: Fuel Saved
The first benefit of the Cape Wind project is that it would reduce the need to generate electricity by other
means. The main saving would be the ensuing reduction in fossil fuel consumption.
To measure the amount of fossil fuel saved one must begin by determining how much electricity the Cape
Wind project would supply to the regional power grid. This depends on the rated capacity of the wind
farm (468MW) and the pattern of wind speed during the year. Cape Wind claims that the wind speed (at
the appropriate height) would average 8.89 meters per second (m/s) during the year (Cape Wind 2001).
This is plausible, and is the number we begin with. An anemometer at 24.8 meters height in nearby
Buzzards Bay found an average wind speed of 7.74 m/s during 1997-2001; adjusting for the fact that the
hubs of the Cape Wind windmills would be 90 meters above sea level, one finds a wind speed of 9.30
m/s.2

Free But Costly: An Economic Analysis of a Wind Farm in Nantucket Sound Page 9 of 34
Using information from Station 44018, a buoy located 30 nautical miles east of Nantucket, we determine
the pattern of monthly wind speeds; we gross these up to give an average of 8.89 m/s (the wind speed
reference by Cape Wind); and we use information from the RETScreen International Wind Energy
Project Model (Canada 2000) to convert the average wind data into capacity utilization rates.3 We
estimate that the actual output of the wind farm would be 38.1% of its rated capacity. However, the
equipment is expected to degrade slowly, by 0.8% annually reducing the actual capacity. This would be
corrected by major rehabilitations of the drive train (every ten years) and the blades (every 15 years). In
2007, its first full year of operation, the wind farm is expected to produce 1.4 million MWh of electricity,
equivalent to 0.94% of the electricity produced in New England, or 2.51% of that consumed in
Massachusetts.4
The next step is to determine how much fossil fuel would be saved. Electricity from the wind farm would
be fed into the New England power grid. Since the wind farm is not reliable enough to provide firm
power – it is non-dispatchable – the grid would first take electricity from wind farms before turning to
generating facilities that are further up the “bid stack” (i.e., have offered to supply electricity at non-zero
prices). The regional Independent System Operator (ISO-New England) that runs the regional grid
continues to add producers until demand is satisfied; the bid price of the last producer brought on line will
then be the price paid to all producers by all purchasers. It follows that electricity from the wind farm
will displace the “marginal” producers – in practice mainly those using natural gas, but also suppliers that
use oil and coal. The precise producer whose production would be displaced at any given moment will
vary from day to day and hour to hour. Information on who is the marginal producer is not made public.
We have assumed that all the wind-generated electricity will displace fossil fuel (and not nuclear or
renewable power), and that it will reduce the use of natural gas, oil and coal in proportion to the expected
marginal contributions to electricity production of these sources.5
The projected prices of fossil fuels come from the recent projections through 2025 made by the U.S.
Energy Information Agency (EIA 2004). The EIA projects relatively little growth in real energy prices
over the coming two decades. Here, as elsewhere, we use nominal dollars, and have inflated our
projected prices and costs using a projected price index.
Having quantified the value of fuel savings, we discount it at 10% to 2004, and compare it to the
similarly-discounted volume of electricity produced.6 The result is a measure of the “levelized cost” of

Free But Costly: An Economic Analysis of a Wind Farm in Nantucket Sound Page 10 of 34
fuel saved; in our baseline it amounts to 4.96 cents/kWh (see Table 1), or a total of $523.3 million (in
present value terms).7
Economic Benefits 2: Less Capital Expenditure
The main benefit of wind power is the reduction in fossil fuel use by power plants whose output is
displaced by wind-generated electricity. However, because wind power is unreliable, it is sometimes
assumed that dispatchable backup generating capacity, roughly equivalent to the capacity of the wind
farm, is still needed, in case there is a time when the wind does not blow.
Table 1: Economic Costs and Benefits of the Nantucket Sound Wind Farm Project Net Present Value (at 10%) Cents/kWh Mean 90% confidence interval
($ millions) Benefits 735.5 626 – 853 6.97 Of which: Fuel saved 523.3 455 – 599 4.96 Capital costs saved 97.9 75 – 120 0.92 Emissions reduced 107.4 55 – 176 1.02 Greater energy independence 6.8 2 – 13 0.06Costs 947.2 882 – 1,029 9.00 Of which: Project itself 882.4 819 – 963 8.39 Grid integration 25.6 23 – 28 0.24 Environmental effects (using royalty rates) 39.2 35 – 44 0.37Benefits – Costs (211.8) (337) – (84) (2.04)Costs using expected property value (1,523.2) (1,650) – (1,393) Costs using willingness to pay measure (176.5) (304) – (46) Note: Totals may not add exactly, due to rounding errors. Based on 10,000 drawings from underlying distributions of the variables determining costs and benefits.
This is an unnecessarily cautious position. Simulation evidence from wind farms elsewhere in the United
States suggests that electricity systems typically need only to maintain additional reserve capacity
(spinning and non-spinning) of at most 20% of the rated capacity of the wind turbines, and possibly far
less (Milligan 2001). This is because there is usually enough variability in the system to take up the slack
when the turbines are becalmed.
In the case of the Cape Wind project there is another consideration: peak electricity demand in the region
is in July and August, yet this is the time when the wind blows least. The capacity utilization of the wind
turbines is estimated at 13% in July and 30% in August, compared to an annual average rate of 38%. This

Free But Costly: An Economic Analysis of a Wind Farm in Nantucket Sound Page 11 of 34
limits the amount of other capacity that could be removed from the system when wind comes on stream.
We assume that when Cape Wind is operating, one could avoid building gas-powered plants to the extent
of 19.5% of the Cape Wind rated capacity. This is the average capacity for July and August (21.5%)
reduced by 10% to provide backup reserve. The natural gas plants are assumed to have a capital cost of
$500/kW (in 2002 prices; see NW Energy Coalition; BP; and Univ. of Alaska Fairbanks) and a 95%
operating efficiency rate. Thus the wind farm would allow a saving of $97.9 million in capital costs
elsewhere in the system, equivalent to 0.92 cents/kWh produced by the wind farm.
Economic Benefits 3: Lower Emissions
When wind power reduces fossil fuel use, it also indirectly contributes to cleaner air through lower
emissions of sulfur oxides (SOx), nitrogen oxides (NOx) and particulates. The reduced emissions of
carbon dioxide (CO2) are believed to reduce the greenhouse effect and thereby moderate the effects of
global warming, although the strength of these effects is a matter of considerable debate.
The independent system operator of New England (ISO-NE) has undertaken a “marginal emissions
analysis” that asks what the emissions effects would have been if it had bought an additional 500MW of
power at every point during a year. At each point in time, ISO-NE knows who the marginal power
supplier would be, and how much pollution it would produce (ISO-NE 2003). This is the appropriate
measure to use, given that power from Cape Wind would be a modest proportion (typically under 1%) of
the total New England supply of electricity.8 Using this information, we estimate that in 2007, the project
would reduce CO2 emissions by 855,630 metric tons, SOx emissions by 2,280 metric tons, and NOx
emissions by 708 metric tons (Table 2).
The main benefit of lower emissions of SOx, NOx and particulates is a reduction in human mortality and
morbidity. It is not easy to put a dollar value on these effects, and so estimates vary widely. We use the
numbers reported by Levy et al. (1999); they are relatively recent, and are in line with figures for parts of
New England that were published in another study by Levy et al. (2002). These studies also make
sensible assumptions about the value of CO2 emissions; many earlier researchers assumed, unrealistically,
that such emissions should be valued at the cost of planting enough trees to offset these emissions.
Earth Tech (2002) also provides estimates of the pollutant emissions that would be displaced by the Cape
Wind Project (see their Table 4-4), but the numbers are high; although the Cape Wind project would
produce about 1% of the region’s electricity, Earth Tech believes that it would displace more than 2% of
Free But Costly: An Economic Analysis of a Wind Farm in Nantucket Sound Page 12 of 34
emissions. Emissions rates have fallen very rapidly in New England recently; between 1997 and 2002,
emissions of SOX fell by 65%, NOX by 58%, and of CO2 by 10%.
Although emissions from fossil fuel use are likely to continue falling as technology advances, we assume
no such further improvements here. If anything, this leads to an overstatement of the emissions reductions
that we attribute to the Cape Wind project.
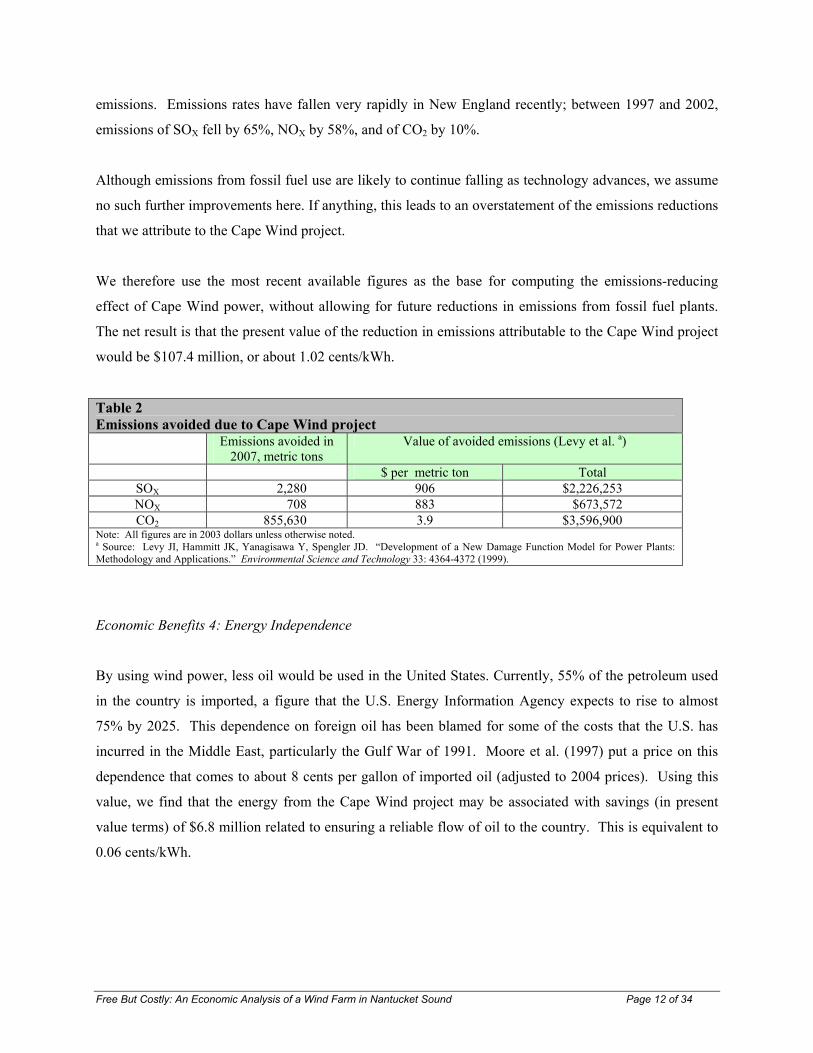
We therefore use the most recent available figures as the base for computing the emissions-reducing
effect of Cape Wind power, without allowing for future reductions in emissions from fossil fuel plants.
The net result is that the present value of the reduction in emissions attributable to the Cape Wind project
would be $107.4 million, or about 1.02 cents/kWh.
Table 2 Emissions avoided due to Cape Wind project
Emissions avoided in 2007, metric tons
Value of avoided emissions (Levy et al. a)
$ per metric ton Total SOX 2,280 906 $2,226,253 NOX 708 883 $673,572 CO2 855,630 3.9 $3,596,900
Note: All figures are in 2003 dollars unless otherwise noted. a Source: Levy JI, Hammitt JK, Yanagisawa Y, Spengler JD. “Development of a New Damage Function Model for Power Plants: Methodology and Applications.” Environmental Science and Technology 33: 4364-4372 (1999).
Economic Benefits 4: Energy Independence
By using wind power, less oil would be used in the United States. Currently, 55% of the petroleum used
in the country is imported, a figure that the U.S. Energy Information Agency expects to rise to almost
75% by 2025. This dependence on foreign oil has been blamed for some of the costs that the U.S. has
incurred in the Middle East, particularly the Gulf War of 1991. Moore et al. (1997) put a price on this
dependence that comes to about 8 cents per gallon of imported oil (adjusted to 2004 prices). Using this
value, we find that the energy from the Cape Wind project may be associated with savings (in present
value terms) of $6.8 million related to ensuring a reliable flow of oil to the country. This is equivalent to
0.06 cents/kWh.

Free But Costly: An Economic Analysis of a Wind Farm in Nantucket Sound Page 13 of 34
Adding together the benefits of fuel saved, avoided investment, emissions reduced, and greater energy
independence, we get a total equivalent to 6.97 cents/kWh. The present value of this benefit is $735.5
million, which is our measure of the economic benefit of the output of the Cape Wind project.
The Economic Costs
By far the largest economic cost of the Cape Wind project is the main investment in plant and equipment.
We estimate the cost to be $1,554/kW, not including contingency costs or other up-front costs of
preparation. This gives a total of $727 million, close to the “approximately $700 million” figure used by
Global Insight (2003, p. 3) in a report prepared for Cape Wind, and represents a levelized cost of 6.6
cents/kWh.
The operating and maintenance costs of wind plants are relatively low, although by no means negligible.
Global Insight (2003, p. 12) cites an annual cost of “approximately $16 million,” which is the one we use
here. Combining the present value of the capital and operating costs, with adjustments for initial
development costs, contingencies and accounts payable, we find the present value of the project cost to be
$882.4 million or 8.39 cents/kWh.
In addition to the cost of the project itself, there are costs related to the integration of wind power into the
regional electricity grid. Since wind power is relatively unpredictable, other units must be available to
provide power at very short notice (“regulation”), over a period of 10 minutes to several hours (“load
following”), and over a period of several days (“load commitment”). This imposes fuel and operating
costs on other operators, in effect to create enough reliability to accommodate wind power. Parsons et al.
(2003) report integration costs of 0.18 cents/kWh. Using this rate, appropriately adjusted for inflation and
discounted to 2004, gives a present value of $25.6 million or a levelized cost of 0.24 cents/kWh.
Most controversial are the environmental costs of siting the windmills in Nantucket Sound. In a
companion study, the Beacon Hill Institute (2003) reported on the results of a survey of almost a thousand
homeowners and tourists in the towns abutting Nantucket Sound in the summer of 2003. Among the key
findings:

Free But Costly: An Economic Analysis of a Wind Farm in Nantucket Sound Page 14 of 34
• Homeowners believed that the windmill project would reduce the value of property by $1.35
billion. If correct, this would be the appropriate figure to use, since in principle it capitalizes all
the effects of the windmill project. It arguably provides an upper bound to the environmental
costs of the project.
• Tourists and homeowners alike said that they thought Cape Wind should pay royalties; the
average amount suggested was 7.86% of sales. This might be interpreted as the price that tourists
and homeowners believe Cape Wind should pay in order to compensate for the possibly negative
environmental effects of the project. These could include the costs of the broken view of the
ocean, the impact on bird and marine life, the reduced recreational value of the Sound and
potential safety issues for boats and planes.
• Respondents to the survey indicated a modest “willingness to pay” to ensure that the windmills
would not be built.
Using the “royalties” measure, we find the environmental effects to total $39.2 million for a levelized cost
of 0.37 cents/kWh.
This brings the total economic cost of the project to $947.2 million, or 9.0 cents/kWh. This is
substantially larger than the benefits of $735.5 million, or 6.97 cents/kWh. The net result is that the
economic costs would exceed the economic benefits by $211.8 million (in present value terms). The
Nantucket Sound wind farm would cost more to society than it would ever give back, and the difference
is large. It follows that, using economic criteria, the wind farm should not be built.

Free But Costly: An Economic Analysis of a Wind Farm in Nantucket Sound Page 15 of 34
3. Financial Costs and Benefits
Even though it is not economically advisable, the windmill project is financially attractive. This is
because it would receive heavy subsidies.
If the project were not subsidized, it would generate a rate of return on equity of about 1.1% and the net
present value of the project, from the point of view of the owners, would be -$197.0 million. This
computation is based on the cash flow to equity, and makes adjustments for accounts payable and
receivable, debt servicing (assuming that 50% of the project is financed by debt) and taxes.
However, the project expects to receive subsidies from two sources. Starting in 2003, Massachusetts law
states that 1% of electricity must come from new, renewable sources, or else pay to the state a penalty of
5 cents/kWh on this electricity.9 The proportion due to come from renewables is set to rise over time.10
Utilities can satisfy this RPS (Renewable Portfolio Standard) arrangement by buying “green credits” from
a certified provider. Cape Wind will be a certified provider, so the question becomes one of what price it
can expect to receive by selling its green credits.
Grace and Cory (2003) have projected the price of green credits through 2012; the figure is about 2.5
cents/kWh, and is not expected to rise much above this level because once the price premium on
electricity reaches this point there are a number of attractive options for producing “green” electricity
(e.g. biomass, landfill methane, etc.).
Cape Wind also hopes to benefit from a federal Renewable Electricity Production Credit (REPC).
Congress is expected to reinstate such a credit in 2004, probably at a rate close to the 1.8 cents/kWh that
prevailed in 2003. Strictly speaking, the REPC is a tax credit, and so is only useful for corporations that
are profitable, but serious consideration is being given to making the credits transferable.
Financial and Economic Returns Reconciled
The results of the financial analysis are presented in Table 3. Even with green credits and the Renewable
Electricity Production Credit, the estimated rate of return on equity is just 12.2%, which is modest.
The project requires both the green credits and the federal Renewable Electricity Production Credit in
order to be financially viable. We assume that the REPC is either tradable (so that Cape Wind can in fact

Free But Costly: An Economic Analysis of a Wind Farm in Nantucket Sound Page 16 of 34
use it to offset taxes), or that a profitable company will take on the project (and so have taxes against
which to use the credits); if this is not the case, then the project will look financially weaker.
In short, the project is just about financially viable, but only because of the subsidies it will receive.
These subsidies are large. In present-value terms:
• the Massachusetts green credit will transfer $157 million to Cape Wind, and
• the Federal Renewable Electricity Production Credit is worth $84 million to Cape Wind.
This is a combined subsidy of $241 million, equivalent to 3.33 cents/kWh.
Is the amount of subsidy appropriate?
Wind power is clean and it reduces the cost of energy dependence. In addition, Cape Wind has to pay
taxes, which push the private return below the economic return. Therefore, the appropriate subsidy would
bridge the gap between the unsubsidized revenue (4.73 cents/kWh) and the economic benefits (6.97
cents/kWh).11 This gap, and therefore the appropriate subsidy, is 2.24 cents/kWh.12 This is to be
contrasted with the actual subsidy of 3.33 cents/kWh.
Table 3: Financial Costs and Benefits of the Cape Wind project Baseline No green
credits No Federal
REPC No credits or
REPC NPV for firm at 10%, ($ millions) 41.7 (115.1) (42.6) (197.0) Confidence interval for NPV ($ millions) (78.1) – 158.5 (221) – (19) (120) – 34 (251) – (149) Rate of return on equity (%) 12.2 7.1a 9.0a 1.1a
Confidence interval for rate of return (%) 6.6 – 18.1 n.a. n.a. n.a. Levelized revenue per kWh ($/kWh) 8.06 5.51 7.25 4.73 Basic Levelized costs/kWh ($/kWh) 8.40 8.40 8.40 8.40 Of which: Operation and maintenance 1.51 1.51 1.51 1.51 Capital costs 6.89 6.89 6.89 6.89 Notes: n.a. = rate of return could not be computed (because it would be negative) for a number of cases.
a These rates of return are based on our best single-point estimates, and not the Monte Carlo simulations; they are thus not strictly comparable with the return shown in the “Baseline” column. Levelized revenue does not adjust for accounts receivable; and levelized costs do not adjust for accounts payable, cash reserves, or taxes. The numbers in this table are based on 10,000 drawings from underlying distributions of the variables determining costs and benefits.
Even with the optimum subsidy of 2.24 cents/kWh, the Cape Wind project would not be viable. Yet wind
projects are being built elsewhere in the country. The Massachusetts Renewable Portfolio Standard is
similar to the one developed in Texas. Wiser and Langniss report that, in 2001, Texas suppliers were

Free But Costly: An Economic Analysis of a Wind Farm in Nantucket Sound Page 17 of 34
delivering power to the grid for 3 cents/kWh. When we factor in the (then) 1.7 cents/kWh Federal
Renewable Electricity Production Credit, it follows that West Texas producers were generating wind
power for about 4.7 cents/kWh. Over ten wind projects totaling 930 MW were erected or under
construction in Texas in 2001 alone.
The cost of producing wind power at the Texas sites – 4.7 cents/kWh – is substantially less than the 8.4
cents/kWh that it would cost Cape Wind to produce electricity in Nantucket Sound. The problem is not
the wind – averaging 8.9 meters per second, it is stronger than in West Texas (8 meters per second). The
difficulty is with the very high cost of construction, partly because the size of the turbines is exceptional,
and partly because of the difficulty of working at sea.
In short, on-land wind power may still be a preferable option to an offshore wind farm. But there can be
no presumption that the best place to site on-land wind turbines is in Massachusetts.

Free But Costly: An Economic Analysis of a Wind Farm in Nantucket Sound Page 18 of 34
4. Robustness
It is reasonable to ask how robust these results are. To answer this question we began with a brief
discussion of the sensitivity of our measures to changes in the variables, and then present the results of a
complete risk analysis. The general conclusion is that the fundamental findings – private profitability and
economic loss – appear to be robust.
Several factors affect both the economic and financial results. Among the most important:
• The findings are sensitive to the assumptions that are made about wind speed. If the average
wind speed were 9.30 m/s13 rather than the 8.89 m/s that we have assumed, then the rate of return
on equity would rise by two percentage points, and the economic cost of the project would fall by
0.5 cents/kWh to 8.5 cents/kWh. However, this is still far higher than the economic benefit of 7.0
cents/kWh.
• Little would change if the price of electricity were assumed to remain unchanged (in real terms)
over time rather than following the projections of the Energy Information Agency.
• If operating and maintenance costs are higher than assumed here (1.335 cents/kWh rather than
0.75 cents/kWh), the economic net present value would be even more negative, and the private
return would fall by almost two percentage points.
• If the cost of building and erecting the windmills is higher than Cape Wind expects, and
approaches recent European experience of $1,900/kW, then the economic cost of the electricity
would rise to over 10.1 cents/kWh, and the private return on equity would fall by almost a third.14
The economic, but not financial, appraisal is affected by a few important factors:
• In valuing emissions, we used the same numbers as Levy et al. (1999), appropriately adjusted for
inflation. However, if we use the numbers summarized in the Pace study (Ottinger et al. 1990),
the economic benefits of wind power rise by 3.1 cents/kWh, bringing it to a cent above the
economic cost of 9.0 cents/kWh. As mentioned earlier, the Pace numbers put a very high price
on CO2 emissions, because of the (not very reasonable) assumption that the best alternative is
planting trees to offset the CO2.
• The Energy Information Administration forecasts lower real energy prices in the future than were
experienced in 2003. If one assumes that the real prices of 2003 persist through the end of the
project, then the benefits of the wind power rise by a cent, but still fall short of the costs (9.0
cents/kWh).

Free But Costly: An Economic Analysis of a Wind Farm in Nantucket Sound Page 19 of 34
• Using a higher social discount rate – 12% instead of 10% – would make the project economically
even less attractive, essentially because the benefits, which accrue far into the future, now have to
be more heavily discounted.
A number of factors influence the financial, but not the economic results. These include:
• The price of the Massachusetts green credits. If credits sell for $10 per MWh less than expected,
the private profitability of the project would fall by three percentage points.
• If the Federal Renewable Electricity Production Credit were to last for five years rather than ten,
this would lower the profitability of the project by four percentage points.
• The project is risky – prices are uncertain, the technology is untested (for such large turbines) –
and it is possible that Cape Wind could only finance 40% with debt, rather than the 50% that we
have assumed. This would lower the return on equity by about two percentage points.
The sensitivity analysis is useful, and it is interesting that in only one case does one see a reversal of our
basic result, which is that the project is economically undesirable.
However, a better approach would be to undertake a “Monte Carlo analysis,” which sets a distribution of
outcomes for each of the main variables, and then simulates the results. This gives a better sense of what
outcomes are plausible (rather than merely possible).
For instance, we assume that the capital costs of the project could be as low as $1,450/kW and as high as
$1,900/kW, with the most plausible value being $1,554/kW; we also suppose that this distribution has a
triangular shape. Or again, we assume that there is a 50% probability that the project will be finance half
with equity and half with debt, and 25% probabilities that the equity proportion would be 55% or 60%
respectively. The full set of assumptions is shown in the Appendix.
We then drew 10,000 random samples from the distributions, and computed the variables of interest (rates
of return, net present value, etc.). This allowed us to compute a distribution of outcomes, like the one
shown here in Figure 1, which shows the net present value of benefits minus costs, for the economic
analysis. The best-fitting distribution turned out to be a normal distribution with a mean of -$212 million
and a standard deviation of $77 million.

Free But Costly: An Economic Analysis of a Wind Farm in Nantucket Sound Page 20 of 34
Figure 1. Distribution of Net Present Value of Net Economic Benefits ($ million)
Frequency Comparison
.000
.013
.025
.038
.050
-450.0 -337.5 -225.0 -112.5 0.0
Normal Di s tri buti onMean = -211.8Std Dev = 77.0
I33
Overlay Chart
The most important feature of this risk analysis is that it allows us to compute confidence intervals for our
target variables. These are shown in Tables 1 and 2. Thus the 90% confidence interval for the NPV of
net economic benefits is -$337 million to -$84 million (Table 1); in other words, we are 90% confident
that the true result lies inside this band. It is also clear that the net economic benefits are negative. In
other words, our conclusion that the project is not economically worthwhile is robust.
The analysis also helps to highlight the risks that face investors. With 90% probability, we expect the
financial return on equity to be somewhere between 6.6% and 18.1%, with an expected value of 12.2%.
This is a wide interval; a nominal return of 6.6% would be disappointing, but a return of 18.1% would be
well worthwhile. Indeed, we estimate that there is a 30.0% probability that the project will lose money for
its shareholders; a 12.0% probability that the project will lose $50 million or more.
The risk analysis is good for one other thing: it helps identify the input variables that are most important.
This is done in the sensitivity chart (or “tornado graph”) in Figure 2. The benefits of wind power are
lower if construction costs are higher, and the relationship between the two is close and therefore
powerful. Other important influences on the economic value of the project are the speed of the wind; the
level of future energy prices; and the value that one puts on reducing pollution. These are all variables
that need particular attention to ensure that they are as accurate as possible.15

Free But Costly: An Economic Analysis of a Wind Farm in Nantucket Sound Page 21 of 34
Figure 2: Sensitivity Chart Target variable: NPV of Net Economic Benefits
Equipment and construction costs Wind Speed Energy prices Value of CO2 abatement Value of SOx abatement Share of natural gas in electricity generation Cost of operating and maintenance Value of NOx abatement Value of energy independence Price of green credits
-.55
.51
.36
.35
.27
.12
-.09
-.09
.08
-.08
.03
.01
-.01
.01
-.00
-1 -0.5 0 0.5 1
Measured by Rank Correlati on

Free But Costly: An Economic Analysis of a Wind Farm in Nantucket Sound Page 22 of 34
5. Jobs
In our analysis of the benefits and costs of the Cape Wind project, we have made no specific mention of
job creation. This is because jobs represent a cost, rather than a benefit, and so are included already in the
project expenses. Jobs represent a cost because people have to be paid for the inconvenience, exertion
and discipline that they demand.
However, it is widely believed that job creation is indeed desirable. If this is the case, how well does the
Cape Wind project fare?
The Lexington-based firm Global Insight, at the request of Cape Wind Associates, developed an
“Economic Impact Analysis” of the wind farm project in which considerable attention was paid to the
job-creation effects in Massachusetts (Global Insight 2003). Using the IMPLAN input-output model for
Massachusetts, they found that
• 142 jobs would be created directly during the building phase, both in manufacturing and
assembly as well as in construction and installation, in Massachusetts. When the indirect effects
(via project purchases made locally) and induced effects (when the newly-employed workers
spend their money locally) are factored in, the total number of jobs created during this 27-month
phase would be between 597 and 1,013.
• 50 jobs would be created to cover the operation and maintenance of the windmills, 45 of them
going to Massachusetts residents. When the indirect and induced effects are added, total
employment in the state would rise permanently by 154.
Even if one accepts these figures (and the high multiplier effects that they imply), they are incomplete,
because they do not take into account the effect of the wind farm on tourism.
In late summer 2003, the Beacon Hill Institute (BHI) commissioned a survey of 499 tourists in those
towns on Cape Cod and Martha’s Vineyard that have a clear sight of the wind farm (BHI 2003). The
relevant findings of that study were that
• 3.2% of tourists said they would spend an average of 2.9 fewer days on the Cape if the windmills
were built;
• a further 1.8% said they would not visit at all; and
• 1.0% of tourists said they would stay longer on the Cape, remaining an extra 13 days on average.

Free But Costly: An Economic Analysis of a Wind Farm in Nantucket Sound Page 23 of 34
The study also estimated that a number of tourists would visit the Cape because of the windmills, and that
this would boost visits by about 0.6%.16 By combining these numbers with information on tourist
spending (also from the survey) and annual tourist visits (3.6 million to the affected towns), the BHI
report estimated that total spending tourist would fall by between $57 million and $123 million annually.
The BHI study then applied multipliers from the Regional Input-Output Modeling System (RIMS II)
model of the Bureau of Economic Analysis to measure the effects on output and employment. The RIMS
II multipliers take into account the indirect and induced effects as well as the immediate effects of the
spending. The important result is that the number of jobs would fall by between 1,173 and 2,533 (BHI
2003, p.14). These are large effects in the context of the local economy.
Therefore, even if we allow for the 154 new permanent jobs predicted by the Global Insight study, the net
effect would be that the Cape and Islands could be expected to lose at least 1,000 jobs.

Free But Costly: An Economic Analysis of a Wind Farm in Nantucket Sound Page 24 of 34
6. Electricity Prices and the Consumer
In a report prepared for Cape Wind, LaCapra Associates (2002) argues that the wind farm would “lead to
savings for the New England electricity market of approximately $25 million per year for the first five
years of operation.” An estimated $15 million of these savings would go to commercial electricity
customers, $2.5 million to industrial users, and $7.5 million to residential consumers.
The argument is as follows. Currently, producers offer electricity to the regional grid at prices that they
set, but which will certainly at least cover their marginal costs of production (i.e. the additional costs,
such as fuel, that are incurred when they supply more electricity). The operators of ISO-NE stack the bids
from lowest to highest price; if electricity demand rises, they will move up the bid stack, buying
electricity at a higher price. All producers are paid the price that is determined by the supplier chosen at
the margin.
Electricity from Cape Wind would have a negligible marginal cost, and so would be chosen first by ISO-
NE operators. The effect would be to displace high-cost operators at the top of the bid stack, so that some
of the time a lower-price plant would become the marginal supplier. This would result in a lower average
price for electricity, creating savings that would be passed on to consumers. In some recent years during
the summer, when demand for electricity is high, the slope of the bid stack was very steep at the top.
LaCapra Associates used a utility dispatch simulation program (PROSYM) to quantify the effect of Cape
Wind electricity on the price of electricity, using recent data from the NEPOOL bid stack and loads from
1999 as inputs. They used the model first to simulate the regional electricity market for 2005-2009
“reflecting recent long term planning assumptions”, and then to simulate the effects when “the Cape Wind
project is added to the New England supply.” By comparing the two simulations, they estimated the cost
savings at $25 million per year.
Two questions arise from this discussion: first, are the findings plausible? And second, does the $25
million represent an economic benefit that our analysis needs to include?
Free But Costly: An Economic Analysis of a Wind Farm in Nantucket Sound Page 25 of 34
The savings are plausible for one year only
A $25 million reduction in the cost of electricity to users is plausible for the first year in which Cape
Wind operates. However, we do not believe that the project can take credit for suppressing the price of
electricity for more than one year. There are two reasons for this. First, electricity demand in the region
is rising by at least 1% per year, so that within a year demand will have expanded to fully absorb the
expected production from the Cape Wind project. But any further increases in the price of electricity will
elicit increased supply, because (and this is our second point), the supply of electricity is essentially
completely elastic. With Cape Wind coming on line, other producers may delay their investments for a
year, but once the market tightens again, they will prevent the price from rising any further, and it is they,
rather than the Cape Wind project, that should get credit for preventing any further rises in the price.
The situation is summarized in Figure 3. Initially, the market is at point A. When the Cape Wind project
comes on line, we move to B, and the price of electricity falls. But over the course of a year, demand
rises to fully absorb Cape Wind production. Any further rise in demand would push up the price, and
supply would expand along the horizontal long-run supply curve, from point C onwards.
In order to simulate this effect using PROSYM, it would have been necessary to change the “long term
planning assumptions” in reaction to the arrival of power from the Cape Wind project. Otherwise one
would have to apply the same logic to all electricity producers in the region – since all are somewhere in
the bid stack – and argue that they all should be given credit for generating savings to consumers, for a
total of about $2.5 billion annually.17
The savings to electricity users represent transfers, not economic benefits
To the extent that the Cape Wind project lowers the price of electricity, the main effects are to transfer
revenue from other power generators (which now get a lower price) to the public (which pays less).
Certainly, those producers who now do not sell their electricity to the regional grid will incur lower costs
(mainly of fuel and possibly of equipment), but these have already been taken into account in our
economic cost-benefit analysis.

Free But Costly: An Economic Analysis of a Wind Farm in Nantucket Sound Page 26 of 34
Figure 3. The Market for Electricity
Wholesale price of electricity
Quantity of electricity sold (wholesale)
Demand (old)
Demand (new)
Short-run Supply (old)
Short-run Supply plus Cape Wind Supply
A
B
C
Long-run Supply

Free But Costly: An Economic Analysis of a Wind Farm in Nantucket Sound Page 27 of 34
Appendix: Distributions of Risk Variables
Value of abated CO2, $/ton Beta distribution with parameters: Alpha 2.00 Beta 8.00 Scale 31.20 Selected range is from 1.95 to +Infinity Mean value in simulation was 6.83 0.00 5.25 10.50 15.76 21.01
$/ton
Value of abated SOx, $/ton Beta distribution with parameters: Alpha 2.00 Beta 8.00 Scale 7245.36 Selected range is from 452.33 to +Infinity Mean value in simulation was 1582.32 0.00 1219.64 2439.27 3658.91 4878.54
$/ton
Value of abated NOx, $/ton Beta distribution with parameters: Alpha 2.00 Beta 8.00 Scale 7061.92 Selected range is from 442.37 to +Infinity Mean value in simulation was 1562.20 0.00 1188.76 2377.51 3566.27 4755.03
$/ton
Percentage of financing through equity
Custom distribution with parameters:
Relative Prob.
Single point 50.0% 0.50 Single point 55.0% 0.25 Single point 60.0% 0.25 Total Relative Probability 1.00 Mean value in simulation was 53.8%
.000
.125
.250
.375
.500
50.0% 52.5% 55.0% 57.5% 60.0%
Percentage
Equipment & Construction costs, $/kW Triangular distribution with parameters: Minimum 1,450 Likeliest 1,554 Maximum 1,900 Selected range is from 1,450 to 1,900 Mean value in simulation was 1,636 1,450 1,563 1,675 1,788 1,900
Equipment & Construction $/kW

Free But Costly: An Economic Analysis of a Wind Farm in Nantucket Sound Page 28 of 34
Distribution of Annual Average Wind Speed, m/s Normal distribution with parameters: Mean 8.89 Standard Dev. 0.30 Selected range is from -Infinity to +Infinity
Mean value in simulation was 8.89 7.99 8.44 8.89 9.34 9.79
Cape Wind estimate
Variable operating and maintenance costs per kWh, $ Triangular distribution with parameters: Minimum 0.0070 Likeliest 0.0075 Maximum 0.0100 Selected range is from 0.0070 to 0.0100 Mean value in simulation was 0.0082
Performance degradation rate, blades Gamma distribution with parameters: Location 0.00% Scale 0.30% Shape 1 Selected range is from 0.01% to 1.00% Mean value in simulation was 0.27% 0.00% 0.35% 0.69% 1.04% 1.39%
Performance degradation rate, blades
Performance degradation rate,drive train Gamma distribution with parameters: Location 0.00% Scale 0.50% Shape 1 Selected range is from 0.01% to 1.50% Mean value in simulation was 0.43% 0.00% 0.58% 1.15% 1.73% 2.31%
Performance degradation rate,drive train
Years of Federal Renewables Production (Tax) Credit
Custom distribution with parameters:
Relative prob.
Single point 1.00 0.10 Single point 2.00 0.10 Single point 3.00 0.10 Single point 5.00 0.20 Single point 10.00 0.50 Total Relative Probability 1.00 Mean value in simulation was 6.62
.000
.125
.250
.375
.500
1.00 3.25 5.50 7.75 10.00
Years of PTC
0.0070 0.0078 0.0085 0.0093 0.0100
Variable operating and maintenance costs per kWh, $

Free But Costly: An Economic Analysis of a Wind Farm in Nantucket Sound Page 29 of 34
Variation in MA green credits, $, relative to LaCapra projections
Normal distribution with parameters:
Mean 0.00 Standard Dev. 5.00
Selected range is from -Infinity to +Infinity
Mean value in simulation was 0.06
Is real price of electricity constant (yes=1) or does it follow EIA forecasts?
Custom distribution with parameters:
Relative Prob.
Single point 0.000 0.50 Single point 1.000 0.50 Total Relative Probability 1.00
Mean value in simulation was 53.8%
Adjustment to ensure adequate use of natural gas at the margin Triangular distribution with parameters: Minimum 0.00% Likeliest 8.40% Maximum 35.00% Selected range is from 0.00% to 35.00% Mean value in simulation was 14.40%
Cost of oil insecurity, per gallon imported, $ Triangular distribution with parameters: Minimum 0.000 Likeliest 0.080 Maximum 0.160 Selected range is from 0.000 to 0.160 Mean value in simulation was 0.080
Weight on 2003 real fuel prices relative to EIA projections Triangular distribution with parameters: Minimum -0.20 Likeliest 0.00 Maximum 1.30 Selected range is from -0.20 to 1.00 Mean value in simulation was 0.33 -0.20 0.18 0.55 0.93 1.30
Weight on 2003 prices (1=const '02 P)
0.000 0.040 0.080 0.120 0.160
Cost of oil insecurity, per gallon imported, $
0.00% 8.75% 17.50% 26.25% 35.00%
Adjustment to ensure adequate use of natural gas at the margin
-15.00 -7.50 0.00 7.50 15.00
Variation in MA green credits, $, relative to LaCapra projections
.000
.125
.250
.375
.500
0.000 0.250 0.500 0.750 1.000
Price constant? Yes=1

Free But Costly: An Economic Analysis of a Wind Farm in Nantucket Sound Page 30 of 34
Endnotes
1 U.S. Army Corps of Engineers guidelines referenced at http://www.nae.usace.army.mil/reg/reg2.htm. 2 At greater elevations, where there is less shearing, wind speeds are higher. The relationship is captured by the equation (S2/S1) = a.(H2/H1)^(1/7), where S1 and S2 are the wind speeds at heights 1 (low) and 2 (high), H1 and H2 are the heights, and a is a constant. 3 Even if the wind speed averages 3 m/s, which would normally not suffice to turn the windmill, there will be periods when the wind is blowing strongly enough. The RETScreen model applies a Rayleigh distribution in order to estimate how much effective production one can obtain, given an average wind speed. 4 The EIA provides the most recent information on Massachusetts’ electricity generation. See http://www.eia.doe.gov/cneaf/electricity/epm/table1_6_b.html. 5 The projected average level of use of oil, natural gas and coal come from the EIA (2003). We make an adjustment that gives a somewhat higher weight, an extra 8.4 percentage points, to natural gas. This is because of the heavy use of natural gas as the marginal fuel. The proportion (i.e. 8.4%) is designed to ensure that the marginal emissions are consistent with recent experience. 6 This discount equals the real rate (7%) recommended by the U.S. Office of Management and Budget plus the assumed rate of inflation (3%) over the life of the project. Source: http://www.whitehouse.gov/omb/circulars/a094/a094.html#8. 7 The nominal levelized cost is the cost of electricity “expressed on an equal, per-unit basis, taking into account an appropriate interest rate that includes the effects of inflation.” Source: http://www.bpa.gov/Corporate/KCC/defn/defnsmal/l.htm [Accessed March 5, 2004.] 8 From the EIA we obtained information on emissions by fuel source; we used this information to account for the changing mix of fuel that is expected to occur over the coming 25 years. 9 This amount is indexed to inflation. In 2004, the amount was adjusted to 5.41 cents/kWh. http://www.state.ma.us/doer/rps/index.htm 10 The proportion of electricity that is to come from new renewable sources is set to rise by half a percentage point per year through 2009 (when it will amount to 4% of the total), and to rise by a percentage point per year thereafter. 11 This is in line with the quantifiable external costs of energy systems reported by Bertel and Fraser (2002), which were 1.1 eurocents/kWh for gas and 2.6 eurocents/kWh for coal. Given that 57% of regional fossil-fuel generated electricity comes from natural gas, and the rest from oil and coal, this would imply an external cost of 1.75 eurocents/kWh for New England. 12 Table 1 shows that the external benefits attributable to the project – reduced emissions, and greater energy independence – together were valued at 1.08 cents/kWh ($114.2 million). It might also be argued that this is the appropriate level of subsidy. 13 An anemometer at 24.8 meters height in nearby Buzzards Bay found an average wind speed of 7.74 m/s during 1997-2001; adjusting for the fact that the hubs of the Cape Wind windmills would be 90 meters above sea level, one finds a wind speed of 9.30 m/s. At greater elevations, where there is less shearing, wind speeds are higher. The relationship is captured by the equation (S2/S1) = a.(H2/H1)^(1/7), where S1 and S2 are the wind speeds at heights 1 (low) and 2 (high), H1 and H2 are the heights, and a is a constant. 14 The construction costs at Horns Rev in Denmark, the largest offshore wind farm in Europe, came to 268 million euro, of which 40 million euro were interconnection costs; at an exchange rate of 1.3 euro/dollar, this totals $348 million. Horns Rev consists of 80 two-megawatt turbines, for a total capacity of 160 MW. This represents a cost of $2,175 per kW (or $1,850 if interconnection costs are excluded). Based on these numbers, we have taken $1,900/kW as an upper bound to the construction costs in Nantucket Sound. Source: http://www.jxj.com/magsandj/rew/2002_03/horns.html. 15 There are a great many costs and benefits that can be associated with the Cape Wind project. The project entails the installation of a large facility in the middle of a body of water unsurpassable for its value as a tourist attraction, a vista for homeowners and a home to marine wildlife. While the "private" (or financial) costs and benefits of such a project are relatively easy to determine, the external costs and benefits (those associated mainly with environmental effects) are another matter. No cost-benefit analysis could account for all of these externalities. We believe, however, that, by recognizing the benefits from reduced emissions and increased energy independence, we have captured the most important external benefits of the wind farm. Some might question our omission of reduced oil spills as an additional benefit. In fact, however, the costs of such spills are already internalized by oil transporters and are therefore accounted for in our analysis. If anything, we probably underestimate the external costs of the

Free But Costly: An Economic Analysis of a Wind Farm in Nantucket Sound Page 31 of 34
project by not incorporating any measure of the costs of possible boating or aircraft accidents or of the prospective harm to commercial fishing. 16 Roughly, for every two tourists that say they would spend less time on the Cape, another one would not visit at all. Applying a similar proportion to those who say they would spend more time on the Cape, we estimate that there would be a 0.58% increase in visits to the Cape, attributable entirely to the presence of the windmills. 17 Cape Wind production will amount to about 1% of New England supply and, it is argued, would reduce electricity prices by $25 million annually; grossing this up by a factor of 100 gives $2.5 billion.

Free But Costly: An Economic Analysis of a Wind Farm in Nantucket Sound Page 32 of 34
References Bertel, E. and Fraser P. 2002. “Energy policy and externalities,” NEA updates, NEA News, 20(1): 14-17. BP. 2003. “CCGT Power Generation,” August. www.bpgaseconomy.com. [Accessed March 3, 2004.] Cape Wind. 2001. Application of Cape Wind Associates, LLC for US Army Corps Approval of The Cape
Wind Project, Nantucket Sound and Yarmouth, Massachusetts, ESS Project No. E159-009. Earth Tech, Inc. 2003. Cape Wind Emissions Displacement Evaluation, Concord MA. Energy Information Agency. 2004, January. Annual Energy Outlook 2004 with Projections to 2025.
http://www.eia.doe.gov/oiaf/aeo/ Report #: DOE/EIA-0383(2004) [Accessed February 27, 2004.]
Economic Report of the President 2004. [Accessed via Web, February 2004.] Environmental Protection Agency, 1999. “The Benefits and Costs of the Clean Air Act 1990-2010”, report
to Congress, November 1999. EPA-410-R-99-001. http://www.epa.gov/air/sect812/index.html Environmental Protection Agency, 2003. “Benefits and Costs of the Clean Air Act 1990-2020: Revised
Analytical Plan for EPA’s Second Prospective Analysis” May 12. http://www.epa.gov/air/sect812/index.html
Giuffre, Douglas. 2003. “Estimating Residential Demand for Electricity,” Senior Thesis [Unpublished.]
Department of Economics, Suffolk University, Boston. Global Insight. 2003. Economic Impact of the Cape Wind Off-Shore Renewable Energy Project,
Lexington MA. April 2. Grace, Robert and Cory, Karlynn. 2002. “Massachusetts RPS: 2002 Cost Analysis Update – Sensitivity
Analysis”, Sustainable Energy Advantage and LaCapra Associates. [PowerPoint slides.] December 16.
ISO New England. 2003. 2002 NepoolMarginal Emission Rate Analysis . [Accessed 2/24/04.] LaCapra Associates. 2002. “Attachment APNS-N-15” entitled “Estimated Savings from the Cape Wind
Project,” (from Karlynn Cory and Douglas Smith), March 4. LaCapra Associates and Sustainable Energy Advantage. 2000. Massachusetts Renewable Portfolio
Standard: Cost Analysis Report, Boston. Levy, JI., Hammitt, JK., Yanagisawa, Y., Spengler, JD. 1999. “Development of a New Damage Function
Model for Power Plants: Methodology and Applications.” Environmental Science and Technology 33: 4364-4372.
Levy, JI. and Spengler, JD. 2002. “Modeling the Benefits of Power Plant Emission Controls in
Massachusetts.” Journal of Air and Waster Management Association 52: 5-18, January. Milligan, M.R.. 2001. “A Chronological Reliability Model to Assess Operating Reserve Allocation to
Wind Power Plants,” National Renewable Energy Laboratory, Golden CO. Moore, John, Behrens, Carl and Blodgett, John. 1997. Oil Imports: An Overview and Update of Economic
and Security Effects, Environment and Natural Resources Policy Division. http://www.ncseonline.org/nle/crsreports/energy/eng-
53.cfm?&CFID=12745071&CFTOKEN=232889 [Accessed 27 Feb 2004.]
Free But Costly: An Economic Analysis of a Wind Farm in Nantucket Sound Page 33 of 34
NW Energy Coalition. 2001. Report, 20(8), August.
http://www.nwenergy.org/publications/report/01_aug/rp_0108_1.html [Accessed March 3, 2004.] Ottinger et al. 1990. Pace University Center for Environmental Legal Studies, Environmental Costs of
Electricity New York, NY: Oceana Publications. Parsons, Brian, et al. 2003. “Grid Impacts of Wind Power: A Summary of Recent Studies in the United
States,” presented at the European Wind Energy Conference, Madrid. RETScreen International. 2000. Wind Energy Project Model. Natural Resources Canada.
http://retscreen.gc.ca
University of Alaska Fairbanks. ca.2002. "Steam and Gas Turbines." http://www.uaf.edu/energyin/webpage/pages/heat_engines/steam_and_gas_turbines.htm . [Accessed March 3, 2004].
U.S. Congress, Office of Technology Assessment. 1994. Studies of the Environmental Costs of
Electricity, OTA-ETI-134. (Washington, DC: U.S. Government Printing Office, September.
Wiser, Ryan and Ole, Langniss. 2001. The Renewables Portfolio Standard in Texas: An Early Assessment, Lawrence Berkeley National Laboratory, Berkeley, CA.

Free But Costly: An Economic Analysis of a Wind Farm in Nantucket Sound Page 34 of 34
About the Beacon Hill Institute Founded in 1991, BHI is an independent, nonpartisan economic research organization, located within Suffolk University in Boston, that applies a market-clearing approach to the analysis of tax, fiscal and regulatory issues. In addition to analyzing tax policy, we study issues including education spending, charitable tax incentives, universal health care, tort reform and economic competitiveness. BHI develops innovative solutions and applies economic analysis to public-policy issues affecting the states and the nation. About the Authors Douglas Giuffre, MSEP, is an Economist at the Beacon Hill Institute. He holds an MS in Economic Policy from Suffolk University. He has written on electricity demand. Jonathan Haughton, CFA, PhD, is Senior Economist at the Beacon Hill Institute and Associate Professor of Economics at Suffolk University. He holds a doctorate in economics from Harvard University and has published widely in refereed journals on economic development and taxation. David G. Tuerck, PhD, is Executive Director of the Beacon Hill Institute for Public Policy Research at Suffolk University in Boston, MA, where he also serves as Chairman and Professor of Economics. He holds a doctorate in economics from the University of Virginia, and has written extensively on issues of taxation and public economics. ©2004, Beacon Hill Institute at Suffolk University, ISBN-1-886320-22-5