framing the future together: long term care …
TRANSCRIPT

FRAMING THE FUTURE TOGETHER: LONG TERM CARE FINANCING
Report to the House of Representatives Louisiana State Legislature
March 15, 2013

FRAMING THE FUTURE TOGETHER: LONG TERM CARE FINANCING
Report to the House of Representatives Louisiana State Legislature
AARP Louisiana Advocacy Center
Coalition for Choice to Advance Long Term Care Options in Louisiana LeadingAge Gulf States
Leading Health Care of Louisiana Louisiana Aging Network Association
Louisiana Assisted Living Association Louisiana Association of Nurse Practitioners
Louisiana Budget Project Louisiana Council on Aging Director's Association
Louisiana Department of Health and Hospitals Louisiana Division of Administration
Louisiana Enhancing Aging with Dignity Through Empowerment and Respect Louisiana Governor's Office of Elderly Affairs
Louisiana House Committee on Health and Welfare Louisiana Nursing Home Association
Louisiana State Medical Society Public Affairs Research Council of Louisiana
The report was produced as a result of a six month study of long term care financing, including: research, analysis, presentations from subject matter experts, debate, discussion and dialogue among the members and stakeholders. The methodology of the work of the study group utilized consensus decision-making. While participants may not necessarily agree with every statement within the report, the report does reflect the overall consensus of the study group. March 15, 2013

TABLE OF CONTENTS
EXECUTIVE SUMMARY ........................................................................................................... 1
OVERVIEW ............................................................................................................................... 6 STUDY GROUP PARTICIPANTS .................................................................................................. 6 DEFINITIONS ............................................................................................................................ 7
HISTORY OF LONG TERM SUPPORTS AND SERVICES IN LOUISIANA .............................. 8 MEDICAID FINANCING BELOW AVERAGE .................................................................................... 8 INSTITUTIONAL BIAS ................................................................................................................. 8 ALTERNATIVES TO INSTITUTIONAL CARE ...................................................................................10 LOUISIANA MOVES TO RE-BALANCING ......................................................................................10 UNEXPECTED CONSEQUENCES AND GROWTH IN NUMBER OF RECIPIENTS .................................11 ADDITIONAL SOURCES OF FUNDING .........................................................................................12
THE CURRENT PROBLEM ......................................................................................................13 DEMOGRAPHICS ARE RAPIDLY CHANGING ................................................................................13 IMPACT OF POVERTY ...............................................................................................................14 DEMAND CONTINUES TO GROW ...............................................................................................14 FEDERAL MEDICAID MATCH DECLINES .....................................................................................14 MEDICAID TRUST FUND DEPLETION IN FIVE YEARS ...................................................................14 LOUISIANA’S COMPARISON WITH OTHER STATES ......................................................................15 LOOKING AHEAD .....................................................................................................................17
MEDICAID REGULATORY AND LEGAL ENVIRONMENT ......................................................18 DESPITE PROGRESS, INSTITUTIONAL BIAS CONTINUES ..............................................................18 NEW FEDERAL PROGRAMS PROMOTE HCBS, BUT FLEXIBILITY IS AN ISSUE ................................18 THE POTENTIAL OF LOCAL FUNDING ........................................................................................20 FMAP DECLINE ......................................................................................................................20 IMPACT OF REGULATORY CHANGES .........................................................................................21
FINANCIAL AND RATE SETTING OPERATING RULES AND POLICIES ..............................22 VARIATIONS BY FUNDING SOURCE ...........................................................................................22 MEDICAID DISCRETION BY STATE .............................................................................................22 NURSING HOME RATES ...........................................................................................................22 RATES FOR PRIVATE INTERMEDIATE CARE FACILITIES ...............................................................25 ADHC MEDICAID REIMBURSEMENT METHODOLOGY SUMMARY..................................................25 NON-MEDICAID LTSS PROVIDED BY THE STATE AND OTHERS ...................................................26
FRAMEWORK FOR ADDITIONAL ANALYSIS ........................................................................28 FOCUS ON RESEARCH FRAMEWORK ........................................................................................28
IMPLEMENTATION PLAN FOR LTC FINANCING ..................................................................31
APPENDICES APPENDIX A: FINANCIAL AND RATE SETTING APPENDIX B: RESEARCH AND DATA

1
EXECUTIVE SUMMARY
Overview This report presents the work of the Long Term Care Financing Study Group for HR 166 conducted from August 2012 through February 2013. The purpose of the study is to develop the design for a thorough and complete analysis of funding for long term services and supports, to propose in the 2013 legislative session. While eighty-nine percent of AARP members say they want to age in place and stay in their homes as long as possiblei, there are significant challenges in financing long term care services due to the growing demand, expense of services, and the limited resources to pay for such services. Currently, Medicaid serves as the primary source of payment for long term care services and supports (LTSS). With respect to the percent of total Medicaid spending that goes to all long term care (LTC), Louisiana is somewhat below the national average, at 29.6% versus 31.5%. However, as it relates to nursing home spending and spending on home health and home and community-based services (HCBS), Louisiana is well below the national average (3.6% below and 8.8% below respectively).ii
History Historically, Louisiana has relied almost exclusively on institutional care and was one of the most heavily institutionalized states in the nation, financed largely by Medicaid. At the beginning of the 2000, the U.S. Supreme Court ruled in the Olmstead case that states must provide alternatives to institutional care for persons with disabilities, based on the Americans with Disabilities Act. The Advocacy Center filed a follow-up suit in Louisiana known as the Barthelemy case. The state entered into a settlement agreement, which paved the way for growth in the number of waiver “slots” (persons served) and called for the establishment of a new program, Long Term Personal Care Services. In 2004, the state undertook a significant review of long term care services, including broad stakeholder input and the involvement of national consultants. As a result, the state issued two reform plans the Plan for Immediate Action and the Louisiana Plan for Choice in Long Term Care. These plans called for and led to further impetus to shift resources and services from institutional to community-based care, a concept often referred to as “rebalancing.”
As a result of these developments, Louisiana has seen a dramatic shift in the setting of service delivery, as well as a shift in the percentage of Medicaid spending going toward HCBS. In fact, between 2005 and 2010, Louisiana’s change in HCBS spending grew faster than any other state for the aged and physical disability group. The state went from 49th nationally in 2000 to 14th in 2009 in percentage of spending for community-based versus institutional LTC for the aged/physical disability group. iii By the end of FY 12, Louisiana was spending 29% of its Medicaid long term care dollars and servicing about 40% of recipients in HCBS.
The Problem Even though in recent years progress has been made in shifting resources and services from institutional to community-based care, consumer demand for home and community based

2
services is not being met as evidenced by the 30,000iv people awaiting home and community-based services through the Office of Aging and Adult Services, Department of Health and Hospitals. Despite a series of rate cuts to HCBS providers necessitated by state budget issues of the last four years, spending for HCBS has remained at a standstill level and almost 5,000 more people are receiving HCBS services. However these favorable short term improvements do not change the fact that, as it is currently structured, Louisiana’s long term care system is financially unsustainable. The primary structural reasons for this are as follows.
In recent years, some Medicaid long term care providers have been shielded from these financial pressures, even as painful cuts were made to other state services. During the 2008-10, the federal government paid 80 percent of the costs of the Medicaid program as a result of the American Recovery and Reinvestment Act (ARRA)v. That match rate has since declined, to 65.51%, meaning Louisiana taxpayers must pay more to maintain existing service levels.
Private nursing homes, which are the single largest providers of Medicaid-financed long term care, have utilized the Medicaid Trust Fund for the Elderly, a dedicated state trust fund established in 2000 with federal dollars, to mitigate cuts. From 2003 to 2009, the balance in the trust fund fluctuated between $852 million and $807 million. Since 2009 the fund balance has been shrinking rapidly, and it currently stands at $424.3 million.vi At current rates, the fund is likely to be depleted within five years, at which point it will require a large increase in state general fund spending or alternate means of financing to replace the portion of the nursing home program now supported by the fund and continue to serve the 29,000 vulnerable Louisianans who depend on these institutions for 24-hour care.
As the Baby Boomer generation enters its retirement years, the cost of services continues to rise, and seniors demand more choices in long term care, forcing policymakers to face a series of difficult decisions as they try to balance these needs against limited state and federal resources. The continued growth of the retirement population will create significant additional demand in the future for long term services and supports. Louisiana’s 65+ population is projected to grow by 82.7%vii as the Baby Boomer generation enters its retirement years.
While some long term care programs may have room for improvement little doubt exists that Louisiana cannot expect to meet the future demand for long term care services, regardless of setting and target population served without new or expanded sources of revenues. With the state already failing to meet the current demand for long term care services, policymakers need to be prepared to address these challenges and develop a sustainable way to finance and deliver long term services and supports.
Recommendations for Analysis To assist Louisiana policymakers, the Study Group recommends the following design for a thorough and complete analysis of funding for long term services and supports. This design and the contents of this report were produced as a result of a six month study of long term care financing, including: research, analysis, presentations from subject matter experts, debate, discussion and dialogue among the members and stakeholders. Following are the additional areas of study, as recommended by Study Group participants. Main topics are in priority order, but the bullets under each are not.
3
1. Increase Revenue
Explore existing LTSS programs/services co-pays o Co-payments for Medicaid services are governed by federal law and by state
law. o Federal rules limit copayments in amount and a failure to receive copayment
may not prevent a Medicaid insured from receiving a service.
Designate new sources of gaming/lottery proceeds to LTSS o Revisions to appropriate statutes.
Explore raising penalties to national average as incentive for improved quality of care across providers
o May require statutory change to increase penalties depending on maximum penalties currently allowed by law.
o Requires notice of rule change by DHH for implementation of additional fees.
Explore existing/new sin taxes for dedication to LTSS o Statutory changes are required for dedication of revenues. o Any increase in tax will require 2/3 vote and can only be proposed in
appropriate sessions of Legislature.
Increase provider fees o Increase existing fees o Dedicate existing/additional fee-like resources versus General Fund o Develop provider fees or provider fee-like resources (new providers, e.g.
homecare, LTPS services, hospitals, etc.) - Federal limitations exist on which providers may be charged fees and
the maximum fees allowable for federal funds matching. - Depending on the provider/service, new fees may require statutory
changes. - Requires notice by DHH of fee implementation, and rule change,
probably by APA process.
Institute continuous process of leveraging all qualified in-state resources (state and local) to draw down maximum federal share
o This may require a statutory authority (or perhaps appropriation language) to give DHH authority to require participation by local governments
Designate LTC provider fines, penalties and over-collections to provider type, where not controlled by state/federal law, leveraging Medicaid match
o Statutory changes and/or DHH rules changes, depending on whether a dedicated (statutory) fund is used, or revenue is committed by designation of self-generated revenue.
Explore strengthening Louisiana laws and regulations to avoid or eliminate loop holes, shielding of assets that limit recovery.
2. Improve Programmatic Revenue
Explore new authorized federal programs and enhanced match available through healthcare reform or other federal programs
Continue to explore managed, coordinated care models, system-wide

4
3. Re-Balancing
Continue to explore better alignment of care of services for patients based on acuity-level system-wide, e.g. adjusting/raising admission standards and reimbursement rates. Explore additional incentives or disincentives to shift the system to more accurately reflect current need and individual preferences (right care, right place, right time, right rate, right payor)
o Many financial changes, including rate changes involving nursing home payment components and major changes in provider qualifications may require statutory change.
o Eligibility changes or admission standards are generally set in DHH rules. 4. LTC Insurance
Research LTC insurance options, premiums, coverage, eligibility and availability
Explore ways to make LTC insurance financially accessible
Assess implementation of existing legislation regarding LTC insurance tax credit
Identify options for educating public on LTC insurance
Maximize Veterans Administration program for providing LTC insurance to war veterans and their spouses
Explore conversion of death beneficiary life insurance policies to pay for LTSS 5. Medicare Coordination
Explore better education for providers, especially physicians, hospitals, nursing homes and HCBS providers to maximize Medicare utilization, as opposed to Medicaid
Identify opportunities for shared savings between Medicare and Medicaid 6. Analysis
Analyze the cost of frequent rebasing and a comparison of Louisiana rebasing frequency with that of other states
Analyze costs and rates of various long term care service providers
Analyze legal/legislative barriers to LTC financing and the potential transformation of the long term care system
Analyze the capacity of the current system of provider types to the current need. Projection of capacity in 5 years, 10 years, using models of what future long term care recipients want. Project demand.
Analyze the long term cost benefits of LTC – does it save money to provide less expensive services to people who are not eligible for care in a nursing home? How can this earlier response prevent higher long term costs?

5
Identify opportunities for modifying rules to improve access, while managing costs
Evaluate how DHH and GOEA would need to extend authority in order to better tailor services to needs of older adults
Analyze the impact of further investments in technology for long term savings, including technology for providers, for recipients and for state agencies
Continue to evaluate and keep abreast of best practice and national trends in LTC Financing, LTSS and innovative strategies.
Implementation In order to continue the progress that has been made, the Study Group recommends that a new study group be commissioned to include the necessary expertise needed for the next phase of work, in partnership with the Legislature and the Department of Health and Hospitals. A new resolution should be drafted to charge this group with facilitating the framework for additional analysis found above. Based on the results of the research and analysis, this group should then develop specific recommendations for creating a financially sustainable system of long term care that gives people genuine choice of providers and settings.
To be successful, it is important to ensure that resources are identified, shared, committed or leveraged to fund the research and analysis. The study timeline should take into consideration that the research should be conducted and recommendations developed in a timely manner to ensure full legislative consideration at the earliest legislative session possible.

6
FRAMING THE FUTURE TOGETHER: LONG TERM CARE FINANCING
Study Group for HR 166
Report to the House of Representatives
Louisiana State Legislature
March 15, 2013
OVERVIEW
Mission House Resolution No. 166 of the 2012 Regular Session by Representative Scott Simon created and provided for the Study Group on Long Term Care Financing to develop the design for a thorough and complete analysis of funding for long term services and supports (LTSS) that will be proposed in the 2013 legislative session with a goal of increasing options for LTSS in Louisiana. The study group was asked to make a written report of its recommendations for study design to the House of Representatives of the Legislature of Louisiana by March 15, 2013.
Study Group Participants House Resolution No. 166 established the Study Group to consist of representatives of stakeholder organizations, as well as representatives of the Department of Health and Hospitals and the Legislature. The following is a listing of Study Group members and the organizations they represent:
Participants Organizations
Lisa Comeaux Louisiana Assisted Living Association
Matthew Rovira Leading Health Care of Louisiana
KaraLe Causey (Vice Chair) Louisiana Enhancing Aging with Dignity Through Empowerment and Respect (LEADER)
Jan Moller Louisiana Budget Project
Patricia R. "Pat" Jones Louisiana Aging Network Association
Maureen Poe Louisiana Association of Nurse Practitioners (LANP)
Stephanie Patrick Advocacy Center
Greg Waddell Louisiana State Medical Society

7
Participants Organizations
Kerry Everitt AARP Louisiana
Joyce McElroy Louisiana Council on Aging Director's Association
Karen Contrenchis LeadingAge Gulf States
Mark Berger Louisiana Nursing Home Association
Michelle Christopher Department of Health and Hospitals (DHH)
Randy Davidson Bureau of Health Services Financing, DHH
Kelly Viator ALS Association representing Coalition for Choice
Hugh Eley Office of Aging and Adult Services, DHH
Laura Brackin Office for Citizens with Developmental Disabilities, DHH
Karen Ryder Governor's Office of Elderly Affairs
David Hood Public Affairs Research Council of Louisiana
Rep. Scott Simon (Chairman) House Committee on Health and Welfare
Dr. Steven Procopio Division of Administration
Angele Davis, The Davis Kelley Group, LLC, served as facilitator.
Definitions In order to guide their work, the Study Group defined long term services and supports to include:
A wide range of assistance, services or devices
Provided over an extended period of time
Designed to meet medical, personal and social needs
In a variety of settings or locations
To enable a person to live as independently as possible,
With a primary focus on individuals 18+. The term long term services and supports (LTSS) is also referred to as long term care. LTSS may be needed by adults of any age, although, they are most commonly used by older adults. The Study Group’s research revealed a preference for the use of long term services and supports, because it suggests more independence than does long term care.

8
HISTORY OF LONG TERM SUPPORTS AND SERVICES IN LOUISIANA
Medicaid Financing Below Average
Long Term Care or Long Term Services and Supports as we know it today began with the passage of the Medicaid program by Congress in 1965. Although originally intended as a program to provide health care primarily to the poor, Medicaid became the default payer for long term care due the fact that the high cost of such care quickly impoverishes most people.
Today Medicaid pays for about 43% of long term care nationally.viii In Louisiana, however, the percentage has always been much higher. In FY 2010, over 60% of nursing home revenue came from Medicaid. With respect to the percent of total Medicaid spending that goes to all long term care, Louisiana is somewhat below the national average, at 29.6% versus 31.5%. However as it relates to nursing home spending and spending on home health and home and community-based services, Louisiana is well below the national average (3.6% below and 8.8% below respectively).ix So, while other payer sources play an important and increasing role, long term care financing in Louisiana remains very much an issue of Medicaid financing.
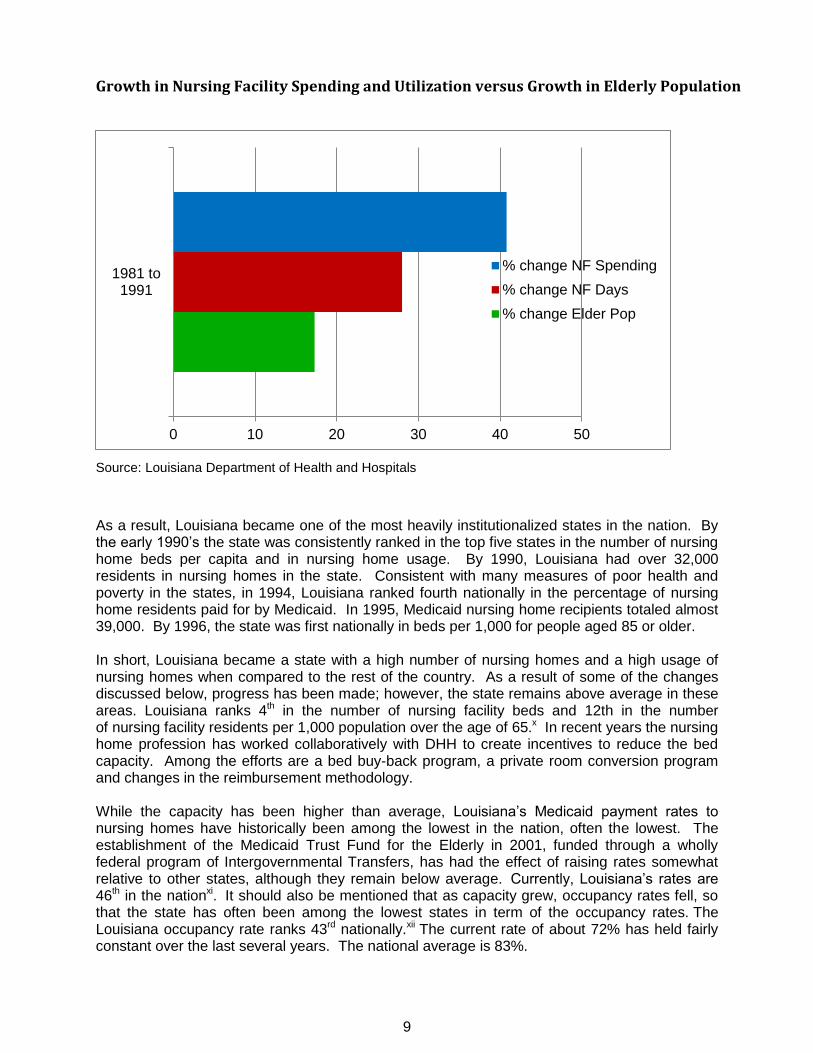
Institutional Bias The other key to understanding long term care in Louisiana is the realization that the state historically relied almost exclusively on institutional care. This is true for all populations in need of long term care, including older adults and persons with developmental, physical, and behavioral disabilities. This is true whether the institutions were primarily privately owned, such as in the case of nursing homes, or publicly operated, such as developmental centers. This reliance on institutions began many years ago with the building of public institutions for persons with disabilities. For older Louisianans and persons with physical disabilities, the primary growth occurred in the 1980’s with a rapid increase in the building of private nursing homes. Much of this growth was in response to the change in hospital delivery and payment systems and the perceived needs for persons 65 years or older requiring long term care. During that decade, nursing home capacity and nursing home Medicaid spending both grew faster than the growth in the elderly population, and nursing homes began caring for a higher level of acutely ill patients than in the past. Nursing home usage grew about 30% and spending grew over 40% while the elderly population only grew about 17%. (See the chart below)
9
Growth in Nursing Facility Spending and Utilization versus Growth in Elderly Population
Source: Louisiana Department of Health and Hospitals
As a result, Louisiana became one of the most heavily institutionalized states in the nation. By the early 1990’s the state was consistently ranked in the top five states in the number of nursing home beds per capita and in nursing home usage. By 1990, Louisiana had over 32,000 residents in nursing homes in the state. Consistent with many measures of poor health and poverty in the states, in 1994, Louisiana ranked fourth nationally in the percentage of nursing home residents paid for by Medicaid. In 1995, Medicaid nursing home recipients totaled almost 39,000. By 1996, the state was first nationally in beds per 1,000 for people aged 85 or older. In short, Louisiana became a state with a high number of nursing homes and a high usage of nursing homes when compared to the rest of the country. As a result of some of the changes discussed below, progress has been made; however, the state remains above average in these areas. Louisiana ranks 4th in the number of nursing facility beds and 12th in the number of nursing facility residents per 1,000 population over the age of 65.x In recent years the nursing home profession has worked collaboratively with DHH to create incentives to reduce the bed capacity. Among the efforts are a bed buy-back program, a private room conversion program and changes in the reimbursement methodology. While the capacity has been higher than average, Louisiana’s Medicaid payment rates to nursing homes have historically been among the lowest in the nation, often the lowest. The establishment of the Medicaid Trust Fund for the Elderly in 2001, funded through a wholly federal program of Intergovernmental Transfers, has had the effect of raising rates somewhat relative to other states, although they remain below average. Currently, Louisiana’s rates are 46th in the nationxi. It should also be mentioned that as capacity grew, occupancy rates fell, so that the state has often been among the lowest states in term of the occupancy rates. The Louisiana occupancy rate ranks 43rd nationally.xii The current rate of about 72% has held fairly constant over the last several years. The national average is 83%.
0 10 20 30 40 50
1981 to1991
% change NF Spending
% change NF Days
% change Elder Pop

10
Alternatives to Institutional Care A significant change in long term care services began to occur during the 1980’s. Federal law was modified to allow states to begin to offer home and community-based services (HCBS), primarily through “waiver” programs. A few states moved quickly to shift services and expenditures from facility-based to HCBS care. Louisiana, however, remained heavily institutionalized, ranking near the bottom nationally in terms of percentage of funds being spent on HCBS. Although some HCBS waiver programs were established, the number of people served remained low, especially for older adults and physical disability groups. In 1999, there were 3,759 waiver recipients in Louisiana, primarily in development disability waivers, compared to a national average of almost 14,000.xiii At the beginning of 2000, the situation in Louisiana began to change. The U.S. Supreme Court ruled in the Olmstead case that states must provide alternatives to institutional care for persons with disabilities, based on the Americans with Disabilities Act. The Advocacy Center filed a follow-up suit in Louisiana known as the Barthelemy case. The state entered into a settlement agreement, which paved the way for growth in the number of waiver “slots” (persons served) and called for the establishment of a new program, Long Term Personal Care Services. This program does not have a specific number of slots and any person who is eligible for Medicaid and who meets the medical or functional criteria for the program may access the service. At the same time, increased advocacy efforts on behalf of persons with developmental disabilities led to large increases in the number of waiver slots for that population. It is difficult to quantify the direct impact that the expansion of HCBS has had on the occupancy rates of nursing homes. In the 10-year period prior to the major expansion of HCBS (1992-2002), Louisiana’s nursing facility occupancy percentage dropped from 90.2% to 77.9% or 12.3 percent. In the 10-year period following (2002-2012) nursing facility occupancy dropped from 77.9% to 72.3% or 5.6 points.
Louisiana Moves to Re-Balancing In 2004, under Governor Kathleen Blanco, the state undertook a significant review of long term care services, including a broad stakeholder input effort and the involvement of national consultants. As a result the state issued two reform plans the Plan for Immediate Action and the Louisiana Plan for Choice in Long Term Care. These plans called for and led to further impetus to shift resources and services from institutional to community-based care, a concept often referred to as “rebalancing.” As a result of these developments, Louisiana has seen a dramatic shift in the setting of service delivery, as well as a shift in the percentage of Medicaid spending going toward HCBS. In fact, between 2005 and 2010 Louisiana’s change in HCBS spending grew faster than any other state for the aged and physical disability group. The state went from 49th nationally in 2000 to 14th in 2009 in percentage of spending for community-based vs. institutional LTC for the aged/physical disability group.xiv By the end of FY 12, Louisiana was spending 29% of its Medicaid long term care dollars and servicing about 40% of recipients in HCBS. The number and percentage of persons served in HCBS grew as well. (See chart below). Despite these increases, waiting lists for HCBS services continue to grow. Today, over 30,000 persons are on the waiting list for the Community Choices Waiver.

11
Source: Medicaid Expenditures
Unexpected Consequences and Growth in Number of Recipients This rapid growth did not occur without some unexpected consequences. In some cases, the pressure for HCBS services, legal imperatives and pent-up demand led to poor program design choices. As a result per person costs grew to greatly exceed national averages, and HCBS spending grew, while institutional spending did not necessarily drop. These problems occurred for several reasons among which were: program decisions were not evidence-based; programs attempted to create a risk-free environment in the home; some stakeholders misunderstood federal cost neutrality rules; and cost control rules built into the programs did not work as intended. In response to these issues, DHH offices implemented a number of changes in their HCBS services. The most notable was the introduction of an acuity based resource allocation system to determine what level of services a person would receive. This was done for both the aged/physical disability and the developmental disability groups. These changes, begun in 2009, also included negotiating an end to Barthelemy. Together with a series of rate cuts to HCBS providers that have been necessitated by the state budget issues for the older adults/physical disability group, spending for HCBS has basically been at a standstill for fiscal years 2009 through 2012, even though the level of services has grown (see chart below). Over that same period almost 5,000 more recipients have been added to the programs. These reductions, while allowing more people to be served in the community, have begun to reverse the trend of spending shifting to HCBS when combined with increased reimbursement and spending for nursing facility care.
HCBS* 19,930
40%
Nursing Facility 29,618
60%
Place of Service State Fiscal Year 2010/11
* ADHC, CCW, PACE & LTPCS
HCBS* 1,030
3%
Nursing Facility 34,727
97%
Place of Service State Fiscal Year 1999/00
*ADHC, EDA, & PCA waivers

12
Expenditures (in millions) vs. Recipients in Community-Based Services
Source: Medicaid expenditures (unduplicated recipients served in ADHC, CCW, LTPCS and PACE)
Additional Sources of Funding
While Medicaid has been and remains the primary payer for LTSS, other programs and sources of funding play important roles. The two most well-known were also enacted into federal law in 1965, Medicare and the Older Americans Act. Medicare does not pay for LTSS per se, but is an important source of payment for shorter term, post-acute nursing facility, rehabilitation, and home health care. The Older Americans Act provides funding to states for a wide variety of services to seniors, ranging from transportation and legal assistance to in-home LTSS services such as home-delivered meals and respite care. These services are provided through a network of Area Agencies on Aging. In Louisiana there are 36 such agencies, which are often the same as the state-created parish Councils on Aging. The Councils were created by state law and predate the Older Americans Act. Prior to the expansion of Medicaid HCBS, they provided most of the in-home HCBS in the state. They continue to serve large numbers of persons in the home and in Senior Centers, and there is no income requirement to be eligible to receive such services. Funding for these services has remained essentially flat for the past several years.
0
5,000
10,000
15,000
20,000
25,000
$0
$50
$100
$150
$200
$250
$300
$350S
FY
-00
SF
Y-0
1
SF
Y-0
2
SF
Y-0
3
SF
Y-0
4
SF
Y-0
5
SF
Y-0
6
SF
Y-0
7
SF
Y-0
8
SF
Y-0
9
SF
Y-1
0
SF
Y-1
1
$ M
illi
on
s
Expenditures
Recipients

13
THE CURRENT PROBLEM
LTSS Funding Is Not Sustainable
Louisiana’s long term care system is financially unsustainable. As the Baby Boomer generation enters its retirement years, the cost of services continues to rise and seniors demand more choices in long term care, policymakers face a series of difficult decisions as they try to balance these needs against limited state resources.
Demographics Are Rapidly Changing Demographic trends tell a harrowing tale. While Louisiana’s overall population is only expected to grow by 8 percent in the next two decades, Louisiana’s over-65 population is projected to grow by 61% over that spanxv. By 2032, fully 7% of the state population will be over 75 – an 81% increase from 2012xvi. Meanwhile, the number of people aged 50 to 64 - people in their highest earning years whose taxes are expected to support the senior population – is expected to decline by 10%xvii. In other words, the not-so-distant future will see fewer workers supporting more retirees who are living longer than ever before.
Source: Census Data
826,839
939,468
1,060,140 1,152,602
1,193,115
0
200,000
400,000
600,000
800,000
1,000,000
1,200,000
1,400,000
2010 2015 2020 2025 2030
State Projections of Population Aged 60 and Over 2010 to 2030
14
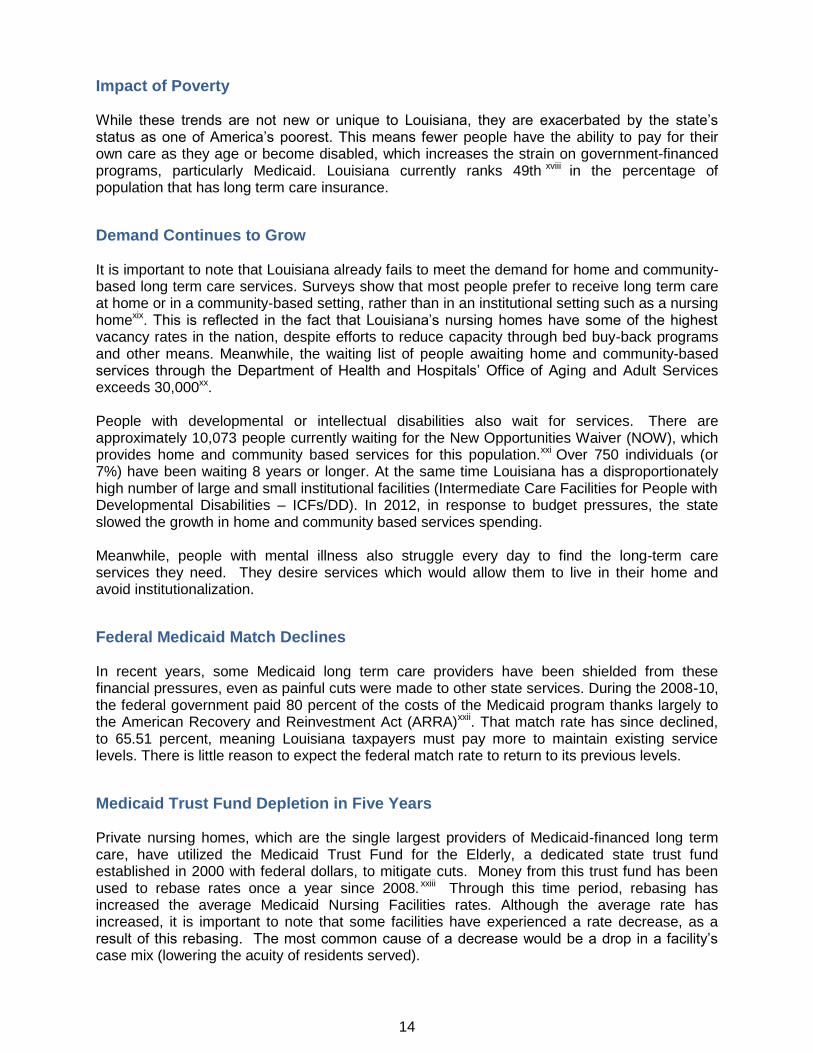
Impact of Poverty While these trends are not new or unique to Louisiana, they are exacerbated by the state’s status as one of America’s poorest. This means fewer people have the ability to pay for their own care as they age or become disabled, which increases the strain on government-financed programs, particularly Medicaid. Louisiana currently ranks 49th xviii in the percentage of population that has long term care insurance.
Demand Continues to Grow It is important to note that Louisiana already fails to meet the demand for home and community-based long term care services. Surveys show that most people prefer to receive long term care at home or in a community-based setting, rather than in an institutional setting such as a nursing homexix. This is reflected in the fact that Louisiana’s nursing homes have some of the highest vacancy rates in the nation, despite efforts to reduce capacity through bed buy-back programs and other means. Meanwhile, the waiting list of people awaiting home and community-based services through the Department of Health and Hospitals’ Office of Aging and Adult Services exceeds 30,000xx. People with developmental or intellectual disabilities also wait for services. There are approximately 10,073 people currently waiting for the New Opportunities Waiver (NOW), which provides home and community based services for this population.xxi Over 750 individuals (or 7%) have been waiting 8 years or longer. At the same time Louisiana has a disproportionately high number of large and small institutional facilities (Intermediate Care Facilities for People with Developmental Disabilities – ICFs/DD). In 2012, in response to budget pressures, the state slowed the growth in home and community based services spending. Meanwhile, people with mental illness also struggle every day to find the long-term care services they need. They desire services which would allow them to live in their home and avoid institutionalization.
Federal Medicaid Match Declines In recent years, some Medicaid long term care providers have been shielded from these financial pressures, even as painful cuts were made to other state services. During the 2008-10, the federal government paid 80 percent of the costs of the Medicaid program thanks largely to the American Recovery and Reinvestment Act (ARRA)xxii. That match rate has since declined, to 65.51 percent, meaning Louisiana taxpayers must pay more to maintain existing service levels. There is little reason to expect the federal match rate to return to its previous levels.
Medicaid Trust Fund Depletion in Five Years Private nursing homes, which are the single largest providers of Medicaid-financed long term care, have utilized the Medicaid Trust Fund for the Elderly, a dedicated state trust fund established in 2000 with federal dollars, to mitigate cuts. Money from this trust fund has been used to rebase rates once a year since 2008. xxiii Through this time period, rebasing has increased the average Medicaid Nursing Facilities rates. Although the average rate has increased, it is important to note that some facilities have experienced a rate decrease, as a result of this rebasing. The most common cause of a decrease would be a drop in a facility’s case mix (lowering the acuity of residents served).

15
The trust fund, first created in 2000, is a finite resource that is rapidly being depleted by the annual rebasing. From 2003 to 2009, the balance in the trust fund fluctuated between $852 million and $807 million. Since 2009 the fund balance has been shrinking rapidly, and it currently stands at $424.3 million.xxiv At current rates, the fund is likely to be depleted within five years, at which point it will require a large increase in state general fund spending or alternate means of financing to replace the portion of the nursing home program now supported by the fund and continue to serve the 29,000 vulnerable Louisianans who depend on these institutions for 24-hour care.
Louisiana’s Comparison with Other States
In 2011, AARP released the a report, State Long-Term Services and Supports Scorecard, a multidimensional approach to measuring state-level performance of long-term services and supports systems that provide assistance to older people and adults with disabilities. The Commonwealth Fund and the Scan Foundation were partners in the research. States were assessed on four dimensions and 25 different indicators. Overall, Louisiana ranked 43rd, landing in the bottom quartile. Also used in the comparison is the Comparative Data Report on Medicaid prepared by the Southern Legislative Conference Council of State Governments. The first chart compares states in the Southern region that ranked in each quartile on the AARP Scorecard.
Comparative Data Report Southern Legislative Conference/AARP Scorecard
Indicator MO VA NC SC AR LA MS AL
Scorecard Rank 13 12 24 38 37 43 51 50
Total Medicaid Expenditure per Capita
$1,334 $747 $1,222 $1,029 $1,232 $1,437 $1,368 $964
Average Payment Per Recipient – All Services
$5,271 $6,053 $5,423 $5,199 $4,338 $4,585 $3,432 $4135
Average Payment Per Recipient in Skilled and Intermediate Nursing Facilities
$22,791 $29,768 $29,006 $29,633 $19,433 $25,971 $33,224 $34,127
Average Payment Per Recipient for Physician Services
$208 $503 $657 $612 $653 $517 $496 $519
Medicaid Recipients per 100,000 in Population
18,284 11,628 18,998 19,869 28,556 26,365 31,560 18,620
Scorecard Rankings: LTSS Scorecard by AARP, the Commonwealth Fund and the Scan Foundation MO, VA – First Quartile NC – Second Quartile SC, AR – Third Quartile LA, MS. AL – Fourth Quartile Data: Comparative Data Report on Medicaid based on 2009 data and published in July, 2012 by the Southern Legislative Conference, Council of State Governments
Another report reviewed by the Study Group compares data on Long Term Supports and Services across top performing and southern states in the third and fourth quartiles.

16
Comparison of Long Term Care Financing Data By Top Performing States, Louisiana and Neighboring States
Data MN WA OR LA AR MS AL
Private long term care insurance policies in effect, 2010
180,578 155,059 86,657 57,721 41,093 40,847 74,291
Private long term care insurance policies per 1,000 40+
73 50 47 28 30 31 33
Total Medicaid expenditures (millions), 2009
$7,425 $6,828 $3,594 $6,581 $3,500 $3,813 $4,417
Federal Medicaid Assistance Percentage (FMAP), 2009
50% 50.12% 62.74% 67.61% 72.78% 75.67% 68.01%
Medicaid HCBS as a % of long term services and supports (LTSS) spending for older people and adults with physical disabilities, 2009
60% 62% 59% 32% 29% 16% 15%
Medicaid LTSS expenditures for older people and adults with physical disabilities, (millions) 2009
$2,166 $1,533 $744 $1,103 $807 $864 $1,103
Source: Across the States, 2012, AARP Note: Minnesota, Washington, Oregon – Top Performers
Arkansas – 3rd
Quartile Louisiana, Mississippi, Alabama – 4
th Quartile

17
Looking Ahead While there may be room for savings in some long term care programs, there is little doubt that Louisiana cannot expect to meet the future demand for long term care services, regardless of setting and target population served without new or expanded sources of revenues. With the state already failing to meet the current demand for long term care services, the time to look for sustainable revenue sources is now.

18
MEDICAID REGULATORY AND LEGAL ENVIRONMENT
Despite Progress, Institutional Bias Continues
As noted earlier, since the passage of the Americans with Disabilities Act and the Olmstead decision, the federal government has been actively encouraging states to expand home and community based services options. Recent federal legislation, especially the Affordable Care Act, offers incentives to states to help insure people receive long term care supports and services in their homes and communities. In 2012, the US Department of Justice actively supported Olmstead efforts and litigation in Texas, Florida, North Carolina and Virginia. In a 2010 letter to state Medicaid Directors, the Center for Medicare and Medicaid Services acknowledged the importance of home and community based services: “While the Nation has made great strides in increasing the availability of HCBS, we must continue our efforts to increase the capacity nationally and to ensure that individuals receive the services and supports necessary to realize the full benefits of community living.”xxv A key legal issue regarding Medicaid payment for LTSS is that despite Olmstead and despite a number of Congressional and CMS actions to expand HCBS options for states, federal law still treats institutional care as an entitlement while requiring most HCBS services to be covered as “waiver” programs and/or as optional services. Often referred to as the “institutional bias”, the effect of these actions is that facility care often remains easier to access than HCBS, even though on a per person basis it is usually more expensive. A few states, such as Vermont, have experimented with eliminating this issue. Vermont used an 1115 Medicaid waiver to establish a system that allows applicants for LTSS to get services in the place of their choice, subject to acuity level. If there are waiting lists due to funding issues, they apply to all settings. A very small baseline service package is generally available to high acuity applicants even while they wait for additional services.
New Federal Programs Promote HCBS, but Flexibility Is An Issue
Congress and CMS have enacted additional programs to encourage states to expand HCBS services, and some come with additional federal funding. The Affordable Care Act contains several such programs. These include but are not limited to the following:
Community First Choice Option (1915 k). This provides an enhanced six percent match for personal care services. Louisiana has applied for this option, which is discussed further below.
Balancing Incentive Program. This provides enhanced match of two percent to most states if they commit to efforts to achieve a 50/50 balance in facility versus HCBS spending within five years. Louisiana has applied for this option as well.
Expanded Money Follows the Person Demonstration. Louisiana was an original participant in this demonstration and it is ongoing, known as My Place Louisiana. It provides enhanced match for one year for services to persons who transition from institutions into waiver programs.

19
Dual Eligible Demonstrations. CMS is providing funding to several states to experiment with integrating Medicare and Medicaid services to persons eligible for both. This is not strictly LTSS but may include such services.
While the availability of these new programs and financing options is positive, the manner in which they are being implemented seems, in some cases, to be accompanied by an effort by the federal Department of Health and Human Services (HSS) to steer states in a specific direction with regard to the delivery of LTSS. State LTSS systems have evolved in a variety of ways, with multiple waivers in some states, managed LTSS in others, large state-funded programs in some, and differences in how and by whom services are authorized and delivered. Recent regulations, interpretations of statutes, and conditions tied to grant funding announcements all seem to indicate less flexibility from the federal level. For example, as noted earlier, Louisiana applied for the Community First Choice Option (1915 k). DHH sought to replace the existing Long Term Personal Care Services Program (LTPCS) with this new program, which provides enhanced matching funds and more flexibility to recipients. However, CMS has interpreted the statutory language regarding eligibility in a way which suggests that the program cannot be limited to the population currently served by LTPCS and other Medicaid state plan personal care services, even though very similar language allows such limitations in other HCBS programs. DHH continues to work with CMS on this issue, but if the interpretation holds, enactment of the program would likely increase state spending, at least in the immediate future. As another example, HHS recently merged the federal Administration on Aging, the Office on Disability and the Administration on Developmental Disabilities into a new agency, the Administration for Community Living (ACL). Since this merger some grant announcements from ACL and CMS have set as conditions of funding that states move toward similar consolidations of programs or services across the various populations that use LTSS. While such a consolidation may ultimately be beneficial, states are not all positioned to move in that direction at the pace HHS or CMS seem to prefer. In Louisiana, national experts recommended as part of the 2004 long term care reform initiative that services for persons with developmental disabilities and services for the aged and those with physical disabilities not be jointly administered. In sum, while the federal government is making more options available, some of which include at least short-term financial incentives, they come with conditions attached. Those conditions often require significant resources, costs, and time to implement. They may also require fundamental changes in the infrastructure that operates LTSS programs.
20
The Potential of Local Funding
Medicaid is a shared program between the state and federal governments. Both federal and state law and rules establish the financial and standards of care environment in which Medicaid covers and pays for health care services. With respect to care and eligibility, the federal rules allow for numerous exceptions to specific parts of minimum state plans. Although federal rules are tighter than in the past, financing options still exist that may increase federal funds available for healthcare. Louisiana has been active in pursuing both coverage and financing options in the past. Federal rules also authorize local governments and some private organizations to play a meaningful role as a provider and as a contributor to the state’s share of program costs. Louisiana has the opportunity to utilize this authority to a more significant degree. These options can, in most cases, be pursued without the need for the resources or changes needed to implement the new programs mentioned earlier. A national trend for states utilizes local governments and local public entities in financing and service delivery as a positive way to increase services for older residents and adults with disabilities. This option is potentially important to Louisiana because the state currently has significant local funds being spent on this population and/or for health related services. For example, there are over $100 million in local tax millages dedicated to some form of health care, aging services, or services to persons with disabilities. While not all of these relate to LTSS, many may and could potentially be used within Federal rules to increase services.
FMAP Decline
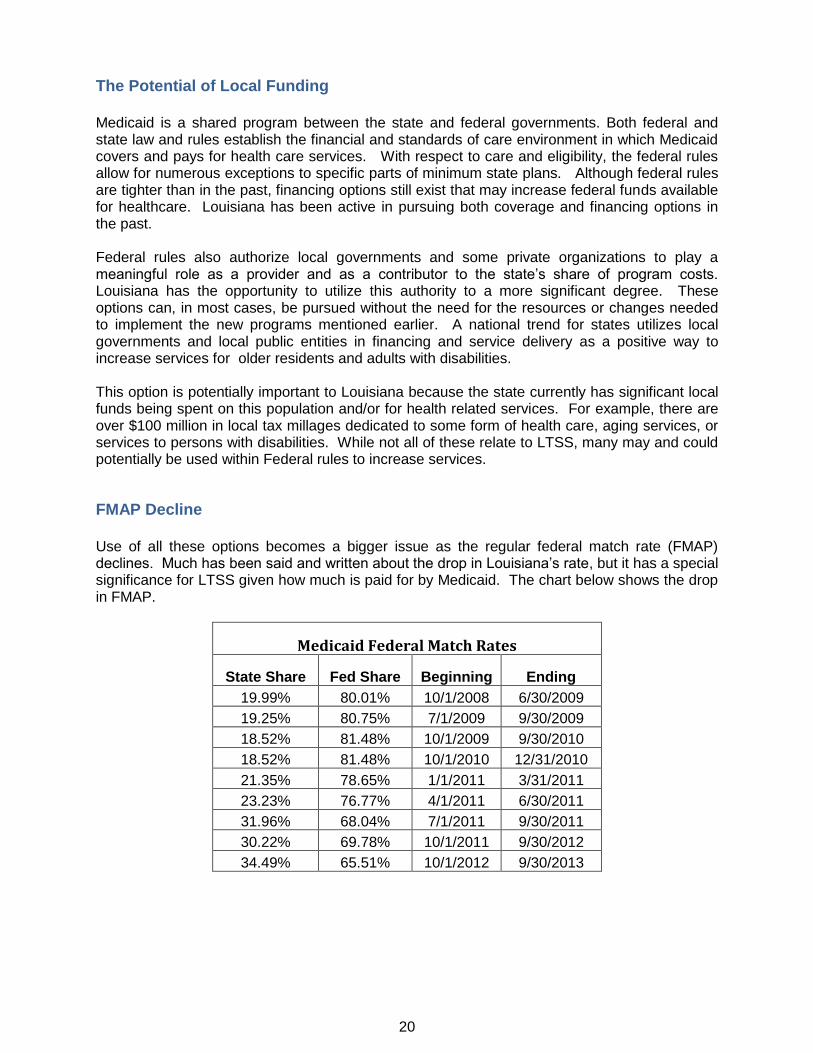
Use of all these options becomes a bigger issue as the regular federal match rate (FMAP) declines. Much has been said and written about the drop in Louisiana’s rate, but it has a special significance for LTSS given how much is paid for by Medicaid. The chart below shows the drop in FMAP.
Medicaid Federal Match Rates
State Share Fed Share Beginning Ending
19.99% 80.01% 10/1/2008 6/30/2009
19.25% 80.75% 7/1/2009 9/30/2009
18.52% 81.48% 10/1/2009 9/30/2010
18.52% 81.48% 10/1/2010 12/31/2010
21.35% 78.65% 1/1/2011 3/31/2011
23.23% 76.77% 4/1/2011 6/30/2011
31.96% 68.04% 7/1/2011 9/30/2011
30.22% 69.78% 10/1/2011 9/30/2012
34.49% 65.51% 10/1/2012 9/30/2013

21
Impact of Regulatory Changes
At a more detailed level, federal and state regulations set quality standards, quantity and modes of care, as well as eligibility and rates. Changes in these regulations often affect the overall cost of care, and these changes can often be quite significant to providers and to recipients. Except when they are part of large scale budget cuts, the financial impact of these changes is not always apparent. Conversely, in a limited resources environment, complacency regarding these changes can result in unpleasant outcomes for particular groups. Thus, the regulatory platform is an area where a well-informed and knowledgeable advocacy effort can make a valuable contribution to the policy making process. Another area where DHH exercises significant authority is in setting licensing requirements for various providers. For medical services these have traditionally been guided by professional organizations and health and safety concerns. However, long term supports and services may include significant non-medical components. Reform efforts such as ‘money follows the person’ recognize that care can take many forms.

22
FINANCIAL AND RATE SETTING OPERATING RULES AND POLICIES
Variations by Funding Source
Financial and rate setting rules and policies vary depending on the funding source. Medicare payments to nursing homes, for example, are set by CMS based on a case-mix model and are beyond the control of states. Older Americans Act dollars are distributed to states based on a population-based funding formula which is also federally determined and within the state via a state established formula. Minimum funding levels or percentages for specific services may also be federally established.
Medicaid Discretion by State
Medicaid is subject to some federal rules, but much discretion is left to the states to set rates subject to CMS approval. For LTSS, DHH sets rates in one of two primary ways. Some providers are reimbursed through an established priced-based reimbursement methodology. This includes Intermediate Care Facilities for the Developmentally Disabled (ICF/DD), Nursing Facilities, and Adult Day Health Care centers. The other primary method is simply a fee schedule established by the Department for a specific program or service within a program; for example, LTPCS or similar personal assistance services provided in a waiver program. Depending upon the program, at some point in the past, these rates may or may not have been based on the actual costs of providing the service, but none are adjusted for current costs. Where price reimbursement methodologies are in place, they vary in approaches. Provider types with median cost are driven by per diem rates, and some with median cost are driven by per quarter hour rates. To add further complexity, a variety of multipliers are utilized to adjust the median costs. Some multipliers are linked to acuity, while others are simply negotiated percentage increases. An important point about the rates is that where established methodologies exist, rates will typically rise as costs rise, subject to availability of funding. Where rates are simply fee based, they tend not to rise despite increases in the cost to providers of providing the service. A high level overview of methodologies by provider follows below. Specific details on methodologies by provider are located in Appendix A.
Nursing Home Rates
Nursing homes rates are established by DHH using a case-mix, price based model with costs submitted by each nursing home and filed on uniform cost reports following prescribed formats and regulations established by DHH and CMS. These cost reports are reviewed or audited by an independent state contractor, and, after this verification, the reported costs are inserted into the reimbursement methodology detailed in Appendix A. Generally, this methodology segregates the costs/price into four main categories:
Direct care and care related costs (costs relate to “hands-on patient care” adjusted for the acuity level of the patient using the nationally recognized uniform case mix system).
Administrative and general costs
23
Fair rental value (the method used to reimburse nursing homes for their capital costs)
Pass through costs (provider fees, property tax and insurance and budgetary adjustments).
Direct care and care related costs and administrative and general costs are aggregated for all nursing homes, and the price that DHH reimburses for these costs is determined. Fair rental value and pass through costs are individually determined based on the unique attributes of each nursing home. As a quality of care measure, nursing homes that do not meet a minimum spending requirement on direct care and care related costs (a floor) are required to reimburse to DHH the difference between the amounts spent on these areas and the floor. Nursing home rates are rebased (recalculated based on the nursing home cost reports) at a minimum every two years. If nursing homes are not rebased, an inflation factor is added to the rates established at the last rebasing.

24
Louisiana Case Mix Nursing Facility Reimbursement Methodology
Prospective Reimbursement System based on Prior Year Actual Costs
÷ = + =
No Year End Cost Settlement Regardless of Amount Spent in Current Year
Prospective Reimbursement System based on Acuity Level of Patients
Total Allowable Cost From Prior Year Medicaid Cost Reports are Divided into Five Categories to Determine
Reimbursement
X
Year End Floor Settlement if Providers do not spend 94% of Direct Care and Care-Related Resident-Day
Weighted Average Median Cost. (Currently this is at 90% due to budgetary reduction rule requirements)
1. Administrative and
General Costs
2. Direct Care Costs
3. Care-Related Costs
4. Capital-Related Costs
5. Pass-Through Costs
A&G pymt= A&G statewide median cost per day X
107.5%
Direct Care Pymt= Statewide resident day
weighted-median cost per day X 112.40%
Care Related Pymt=Statewide resident day
weighted-median cost per day X 112.40%
Facility-Specific
Case Mix Index for
the quarter
Capital-Related Pymt=Not based on facility or
statewide costs. Based on Fair Rental Value (FRV)
which takes into account:
1. Square footage per bed
2. Number of licensed beds
3. Age of the Facility
Pass Through Cost Pymt=Facility’s Property Tax +
Property Insurance ÷ Total Days PLUS Provider
Fee of $8.02 per day PLUS State Budgetary
Reducitons
Two Basic Classifications of Nursing
Facilities for Reimbursement Purposes
TYPE 1: STATE-OWNED OR OPERATED
TYPE 2: NON-STATED OWNED OR OPERATED
Total Allowable
Costs
Total Patient
Days
Medicaid
Payment
per Day
$8.02/day
Provider
Fee

25
Rates for Private Intermediate Care Facilities Private Intermediate Care Facilities for persons with Developmental Disabilities (ICF/DDs) are reimbursed on the Inventory for Client and Agency Planning (ICAP) rate methodology as established by DHH. The methodology is based on the facility’s bed size and the individual’s level of care. The ICAP methodology utilizes 5 levels of care and 4 bed size peer groups. Per Diem rates by level of care are based on information reported on uniform cost reports following prescribed formats and regulations established by DHH and CMS. These cost reports are desk reviewed or audited by an independent state contractor, and, after this verification, the adjusted costs are used in the reimbursement methodology detailed in Appendix A. Generally, the rate setting methodology segregates the costs/rates into four main categories:
Direct care costs
Care related costs
Administrative and operating costs
Capital costs.
Costs, as desk reviewed or audited, in each of these categories are aggregated for all ICF/DDs. The direct care per diem rate is a set percentage over the median adjusted for the ICAP level of care acuity factor and tiered by bed size peer group. The care related per diem rate and the administrative and operating rate are state-wide rates at a set percentage over the median. The capital per diem rate is a state-wide rate set at a percentage over the median and tiered by bed size peer group. All per diems except the capital per diem are also inflated per the rate methodology. Provider fees as computed by DHH are also added to the final per diem rate. ICF/DDs that receive approval for pervasive plus services or medical supply add-on costs or providers with Class B findings are subject to cost settlement of their direct care costs for each cost report period. ICF/DDs that do not meet a minimum spending requirement for direct care costs (a floor) are required to reimburse to DHH the difference between the amount spent on direct care and the floor. ICF/DD rates are rebased (recalculated based on the most current desk reviewed and audited cost reports) periodically as determined by DHH. If ICF/DD rates are not rebased, an inflation factor is added to the rates established for the prior fiscal year.
ADHC Medicaid Reimbursement Methodology Summary Adult Day Health Care (ADHC) providers are reimbursed a per quarter hour rate for services provided under a price-based prospective payment system. All ADHC providers are required to file a uniform cost reporting instrument that captures their allowable costs for reimbursement. These uniform cost reporting instruments are then desk reviewed or audited by the DHH audit contractor before they are utilized in the reimbursement methodology. A database of provider hours information will be utilized by the Department in order to establish the per quarter hour reimbursement rates. The ADHC Medicaid reimbursement methodology contains five distinct cost/rate components. The summation of these cost/rate components will set the per quarter hour reimbursement rate received by the ADHC provider. The five distinct cost/rate components are as follows:

26
1. Direct Care Costs (RN, LPN, CNA, and other expense specified by rule) 2. Care-Related Costs (nurse supervisory staff, dietary staff, raw food, and other
costs specified by rule) 3. Administrative and operating costs (payroll, accounting, housekeeping, laundry,
and other costs specified by rule) 4. Property Costs (depreciation, amortization, property taxes, rent, and other costs
specified by rule) 5. Transportation Costs (vehicle expense, driver expense, non-emergency medical
transportation, and other costs specified by rule). These cost/rate components have established per quarter hour median costs. These median costs will be calculated using an aggregate of all Adult Day Health Care providers. The median costs for each rate component are then multiplied by the specific statewide price percentage to establish the statewide per quarter hour reimbursement price for that cost/rate component. The statewide price percentages are as follows:
1. Direct Care Costs 115.00% 2. Care-Related Costs 105.00% 3. Administrative and Operating Costs 105.00% 4. Property Costs 100.00%.
The transportation cost/rate component is provider specific. The transportation costs captured on the uniform cost reporting instruments will be utilized to establish, on a provider by provider basis, a per quarter hour transportation rate. New providers will receive a statewide average per quarter hour transportation rate. As a quality of care measure, ADHC providers that do not meet a minimum spending requirement on direct care costs (spending floor) are required to reimburse to DHH the difference between the amount spent on those areas and the spending floor established. At least every three years, audited and desk reviewed uniform cost reporting instrument items will be compared to the cost/rate components calculated for the cost reporting year to insure that the reimbursement rates remain reasonably related to costs.
Non-Medicaid LTSS Provided by the State and Others As noted, publicly funded LTSS is primarily Medicaid, but other sources do play an important role. The chart below shows public LTSS spending in Louisiana.

27
Sources of Medicaid Funding
Non-public sources are also important. In fact, informal, unpaid care by family and others remains the source of about 75% of all LTSS. A recent AARP study estimates the value of such care in Louisiana at $5.7 billion per year. Private long term care insurance is a small, but growing payer source, although the same study shows Louisiana ranks 49th in the number of such policies in effect. Private pay is yet another source, though it is difficult to quantify. Private pay for in-home services is a growing market. Private pay assisted living is an estimated $17-18 million dollars in Louisiana, and Medicaid residents in nursing homes pay about $150 million a year towards the cost of their care.
LTSS Spending in LA SFY - 2008 SFY - 2009 SFY - 2010 SFY - 2011 SFY - 2012
Medicaid* $1,803,881,043 $1,925,614,417 $1,943,953,140 $2,044,027,270 $1,978,241,991
Veterans Affairs $32,066,628 $38,033,329 $40,614,953 $42,985,842 $46,690,295
Older Americans Act $19,967,256 $20,383,670 $23,421,988 $21,856,662 $21,225,047
THSCI** $2,618,980 $3,295,559 $3,295,559 $3,170,070 $3,129,204
PSH*** $151,847 $766,205 $2,466,357 $6,861,192 $9,814,855
Other State Funds**** $18,723,140 $21,607,719 $20,816,296 $23,437,433 $20,913,068
Total $1,877,408,894 $2,009,700,899 $2,034,568,293 $2,142,338,469 $2,080,014,460
Source: CMS-64 report
* Includes funding for Nursing Homes, ICF-DD, OCDD - Waivers, OAAS - Waivers, LTPCS, & PACE
** Traumatic Head and Spinal Cord Injury
*** Permanent Supportive Housing
**** Programs in OCDD, OAAS, GOEA such as Individual & Family Support, State Personal Assistance Services, Senior Centers, etc.

28
FRAMEWORK FOR ADDITIONAL ANALYSIS
Focus on Research Framework
The Study Group on Long Term Care Financing was not charged with making recommendations for funding LTSS options that would allow Louisianans access to a broad array of services across the continuum of care. Rather, the group was commissioned to prepare a framework for a thorough and complete analysis in 2013. This multi-year approach was developed because of the scope research and the need to build understanding of the issues. Following is the list of additional areas of study for the 2013 research, as recommended by the Study Group participants. Main topics are in priority order, but the bullets under each are not.
1. Increase Revenue
Explore existing LTSS programs/services co-pays o Co-payments for Medicaid services are governed by federal law and by state
law. o Federal rules limit copayments in amount and a failure to receive copayment
may not prevent a Medicaid insured from receiving a service.
Designate new sources of gaming/lottery proceeds to LTSS o Revisions to appropriate statutes.
Explore raising penalties to national average as incentive for improved quality of care across providers
o May require statutory change to increase penalties depending on maximum penalties currently allowed by law.
o Requires notice of rule change by DHH for implementation of additional fees.
Explore existing/new sin taxes for dedication to LTSS o Statutory changes are required for dedication of revenues. o Any increase in tax will require 2/3 vote and can only be proposed in
appropriate sessions of Legislature.
Increase provider fees o Increase existing fees o Dedicate existing/additional fee-like resources versus General Fund o Develop provider fees or provider fee-like resources (new providers, e.g.
homecare, LTPS services, hospitals, etc.) - Federal limitations exist on which providers may be charged fees and
the maximum fees allowable for federal funds matching. - Depending on the provider/service, new fees may require statutory
changes. - Requires notice by DHH of fee implementation, and rule change,
probably by APA process.
Institute continuous process of leveraging all qualified in-state resources (state and local) to draw down maximum federal share
o This may require a statutory authority (or perhaps appropriation language) to give DHH authority to require participation by local governments.

29
Designate LTC provider fines, penalties and over-collections to provider type, where not controlled by state/federal law, leveraging Medicaid match
o Statutory changes and/or DHH rules changes, Depending on whether a dedicated (statutory) fund is used, or revenue is committed by designation of self-generated revenue.
Explore strengthening Louisiana laws and regulations to avoid or eliminate loop holes, shielding of assets that limit recovery.
2. Improve Programmatic Revenue
Explore new authorized federal programs and enhanced match available through healthcare reform or other federal programs
Continue to explore managed, coordinated care models, system-wide
3. Re-Balancing
Continue to explore better alignment of care of services for patients based on acuity-level system-wide, e.g. adjusting/raising admission standards and reimbursement rates. Explore additional incentives or disincentives to shift the system to more accurately reflect current need and individual preferences (right care, right place, right time, right rate, right payor)
o Many financial changes, including rate changes involving nursing home payment components and major changes in provider qualifications may require statutory change.
o Eligibility changes or admission standards are generally set in DHH rules.
4. LTC Insurance
Research LTC insurance options, premiums, coverage, eligibility and availability
Explore ways to make LTC insurance financially accessible
Assess implementation of existing legislation regarding LTC insurance tax credit
Identify options for educating public on LTC insurance
Maximize Veterans Administration program for providing LTC insurance to war veterans and their spouses
Explore conversion of death beneficiary life insurance policies to pay for LTSS
5. Medicare Coordination
Explore better education for providers, especially physicians, hospitals, nursing homes and HCBS providers to maximize Medicare utilization, as opposed to Medicaid
Identify opportunities for shared savings between Medicare and Medicaid

30
6. Analysis
Analyze the cost of frequent rebasing and a comparison of Louisiana rebasing frequency with that of other states
Analyze costs and rates of various long term care service providers
Analyze legal/legislative barriers to LTC financing and the potential transformation of the long term care system
Analyze the capacity of the current system of provider types to the current need. Projection of capacity in 5 years, 10 years, using models of what future long term care recipients want. Project the demand.
Analyze the long term cost benefits of LTC – does it save money to provide less expensive services to people who are not eligible for care in a nursing home? How can this earlier response prevent higher long term costs?
Identify opportunities for modifying rules to improve access, while managing costs.
Evaluate how DHH and GOEA would need to extend authority in order to better tailor services to needs of older adults
Analyze the impact of further investments in technology for long term savings, including technology for providers, for recipients and for state agencies.
Continue to evaluate and keep abreast of best practice and national trends in LTC Financing, LTSS and innovative strategies.
31
IMPLEMENTATION PLAN FOR RESEARCH ON LTC FINANCING
Pursuant to House Resolution No. 166 of the 2012 Regular Session by Representative Scott Simon, the Study Group on Long Term Care Financing has developed a study design that provides for a thorough and complete analysis of funding for long term services and supports (LTSS). In order to continue the progress that has been made, a new study group, in partnership with the Legislature and the Department of Health and Hospitals, should be commissioned to include the necessary expertise needed for the next phase of work. A new resolution should be drafted to charge this group with facilitating the framework for additional analysis found above. Based on the results of the research and analysis, this group should then develop specific recommendations for creating a financially sustainable system of long-term care that gives people genuine choice of providers and settings. In order to be successful, it is important to ensure that resources are identified, shared, committed or leveraged to fund the research and analysis. The study timeline should take into consideration that the research should be conducted and recommendations developed in a timely manner to ensure full legislative consideration at the earliest legislative session possible.

APPENDICES

Appendix A
Detailed Information on Financial and Rate Setting
Operating Rules and Policies
Long Term Care Providers
Intermediate Care Facility (ICF) for the developmentally disabled, provides services for developmentally disabled individuals that require 24 hours of active treatment per day in a community, group, or residential home setting. There are just over 520 Medicaid participating ICF providers in the state of Louisiana with almost 500 in the 1 – 8 bed category. ICF current reimbursement per diem rates are as follows:
Beds Int. Limited Extensive Pervasive
1 – 8 157.04 165.98 181.2 197.3
9 – 15 148.6 158.1 172.55 187.86
16 – 32 136.95 145.03 158.75 173.29
33+ 128.15 134.99 146.64 158.99
Adult Day Health Care (ADHC) is a program designed to provide services for medial, nursing, social, and personal care needs to adults who have physical, mental, or functional impairments in a community based nursing center. There are currently 47 Medicaid participating ADHC providers in the state of Louisiana. The current average per quarter hour rate is $2.67. The per quarter hour rate has a provider specific transportation component. Nursing Facility (SNF/NF) – Provides 24-hour/day care for rehabilitative, restorative, and ongoing skilled nursing care to patients or residents in need of assistance with activities of daily living. There are approximately 260 Medicaid participating nursing facility providers in the state of Louisiana. The current average statewide per diem rate is $152.11 (including provider fee). The per diem rate is specific to each provider. The estimated number of Medicaid days for SFY 2013 is over 6.7 million.
Long Term Care Rate Setting
Long Term Care providers are reimbursed through price-based reimbursement methodologies, but vary in their approaches. There are provider types with median cost driven per diem rates, median cost driven per quarter hour rates, and other entities whose services are reimbursed through a Medicaid fee schedule. To add to further complexity, there are a variety of multipliers that are utilized to adjust the median costs. Some multipliers are linked to acuity, while others are simply agreed upon percentage increases.
ICF providers’ reimbursement rates are a per diem rate based on the sum of five rate components:
1. Direct Care 2. Care Related 3. Administrative and Operating 4. Capital 5. Provider Taxes

The rate component (excluding provider fee) per diems correspond to statewide median cost amounts that have been multiplied by an agreed upon price percentage. The direct care rate component is the statewide price calculated above multiplied by an acuity adjustment based on ICAP support levels (pervasive, extensive, limited, and intermittent). After the per diem rates are established, they are adjusted based on facility licensed bed capacity
1. 1 - 8 Beds (reimbursed at 100 percent of established per diem rates) 2. 9 - 15 Beds (reimbursed at 95 percent of the 1 - 8 bed per diem rate) 3. 16 - 32 Beds (reimbursed at 95 percent of the 9 - 15 bed per diem rate) 4. 33+ Beds (reimbursed at 95 percent of the 16 - 32 bed per diem rate)
ICF reimbursement rates are rebased at least every three years.
ADHC providers’ reimbursement rates are a per quarter hour rate based on the sum of five rate components:
1. Direct Care 2. Care Related 3. Administrative and Operating 4. Property and Equipment 5. Provider Specific Transportation Rate
The direct care, care related, and administrative and operating rate component per quarter hour rates correspond to statewide median cost amounts that have been multiplied by an agreed upon price percentage. The property and equipment per quarter hour rates correspond to statewide median costs with no additional multiplier. Due to a high variability in transportation cost, each provider receives a transportation per quarter hour rate based on its own cost experience.
Home and Community Based Services are predominantly reimbursed through the Medicaid fee schedule.
Nursing facility reimbursement rates are rebased at a minimum every two years. Nursing facilities are reimbursed through a case mix reimbursement methodology and are provider-specific. Free-standing nursing facilities and hospital-based nursing facilities are both reimbursed under this methodology. The NF case mix methodology is comprised of four rate components:
1. Direct Care/Care Related 2. Administrative and Operating 3. Fair Rental Value 4. Pass-Through
Direct care costs relate to RN, LPN, and CNA expenses. Care related costs relate to raw food, nursing administration, social services, activities, and other costs located in the nursing facility cost center on the Medicare cost report. The direct care/care related costs, from provider submitted cost reports, are utilized to establish a combined median per diem cost. For direct care/care related costs, the statewide median cost is multiplied by a price percentage of 112.40 percent to establish a statewide price. The provider’s direct care percentage of the statewide price is multiplied by the facility’s specific case mix index (CMI) to inflate/deflate the reimbursement rate for acuity. The provider’s CMI is the numerical value associated with the acuity of its residents. The CMI is for all residents of all payer types in the provider’s facility as of a specified point-in-time. The care related portion of the rate component statewide price does not receive a CMI multiplier.

The administrative and operating costs relate to the other non-capital costs that are necessary to run a business. Included costs are dietary, housekeeping, laundry, medical records, administrative costs (payroll, accounting, etc.), and other routine non-capital costs. The administrative and operating costs from provider submitted cost reports are utilized to establish a median cost for the rate component. The statewide median cost is then multiplied by a 107.50 percent price percentage to establish a statewide price. The statewide price is received by all facilities as reimbursement in full for their administrative and operating costs. The FRV rate component is paid in lieu of depreciation, amortization, rent, interest, and other capital costs due to the high variability of these costs. The FRV rate is based on the square footage, age, and licensed beds capacity of the provider. The age of a facility can be modified through the cost of major renovations and improvements to the facility. FRV Gross Facility Value Amounts:
$157.42 per square foot (7/2012).
$15.76 per square foot for land (7/2012).
$6,459 per licensed bed for moveable equipment (7/2012).
There are four types of pass-through components. (1) Property Taxes and (2) Property Insurance which are reimbursed through a combined per diem rate. (3) Provider Taxes which are a broad-based tax that is paid on all occupied licensed beds per day. (4) State Rate Adjustments which may be made when determined necessary by the Secretary of the State and must be uniformly applied to all non-state owned nursing facility provider types.
There are several types of Medicaid reimbursement that nursing facilities may receive, most of which are outside of the traditional per diem.
1. Leave of Absence Rates (Home and Hospital) are both home and hospital leave of absence rates are calculated using the same methodology. If a provider’s occupancy percentage is above 90 percent, it receives 90 percent of its traditional nursing facility per Diem as reimbursement for the allowable leave days. If a provider’s occupancy percentage is below 90 percent, it receives 10 percent of its traditional nursing facility per diem, in additional to the provider fee. For each Medicaid recipient, the provider may receive reimbursement for up to seven hospital leave of absence days per occurrence and 15 home leave of absence days per year.
2. Specialized Care Add-On and rates include infectious disease (ID) specialized care recipients, reimbursed a set rate add-on payment per day in addition to the standard nursing facility per diem rate for the provider (ID Add-On Rate = $178.92 per day); technological dependant care (TDC) recipients, reimbursed a set rate add-on payment per day in addition to the standard nursing facility per diem rate for the provider (TDC Add-On rate = $168.40 per day); and, neurological rehab treatment program (NRTP) recipients, reimbursed a separate per diem rate, and do not receive the standard nursing facility per diem rate for the provider (NRTP rehab services per diem rate = $421.01; NRTP complex care services per diem rate = $295.54)
3. Special Rate Programs include Private Room Conversion where a Medicaid participating nursing facility that converts a semi-private room(s) to a Medicaid-occupied private room is eligible to receive an additional $5.00 per diem payment; and, the Bed Buy Back Program, where a Medicaid participating

nursing facility purchases and closes an existing LA Medicaid participating nursing facility. The buyer(s) will be eligible to receive an incentive payment for five years after the transfer of ownership and closure date of seller facility.
Bed Buy Back Base Capital Incentive Amounts
Effective Date Under 115 Beds
Surrendered Base Amount
115 - 144 Beds Surrendered Base
Amount
145+ Beds Surrendered Base
Amount
7/1/2012 $361,813 $506,504 $713,079
Funding Sources for NF reimbursement includes:
The State General Fund.
Federal Funding through the Federal Medical Assistance Percentage (FMAP).
Patient Liability.
Medicaid Trust Fund for the Elderly – A trust fund established to aid in the reimbursement of nursing facilities. The funds can only be accessed to fund nursing facility rates during a rebase period.
The process for NF reimbursement is as follows:
Before the beginning of each state fiscal year, the total nursing facility estimated expenditures for the fiscal year are determined.
The State General Fund, taking into consideration the associated federal funding through FMAP, determines its fiscal responsibility to the nursing facility expenditures.
As of September 1, 2012 nursing facility rebase, the State General Fund and associated FMAP funding are responsible for $91.24 per day for each nursing facility resident.
Patient liability is traditionally around 17 – 18 percent and is factored into the State General Fund allocations.
The Medicaid Trust Fund for the Elderly and the associated FMAP funds are responsible for any remaining gap in funding between the statewide average nursing facility reimbursement rates and the amounts accounted for through the State General Fund, Patient Liability, and their associated FMAP funds.
As of the September 1, 2012 rebase rates, the current gap is estimated at around $60.87 per day per resident.
The funding gap covered by the trust fund and FMAP recur on an annual basis and may increase given additional state budget cuts or rebase updates.
The nursing facility rate methodology has many moving parts and is always subject to rule and statutory changes. Some current areas of discussion are as follows:
Transitions for MDS assessments from a RUG III grouper to a RUG IV grouper.
Eliminating the specialized care add-on and rate payments and incorporating them into the standard nursing facility per diem rate.

Appendix B
Relevant Research and Data Reviewed
Louisiana’s Plan for Choice in Long-Term Care: Comprehensive Long-Term Care Reform Plan: http://new.dhh.louisiana.gov/assets/docs/OAAS/LTCSysChange/ChoiceinLTCPlan.pdf
Louisiana’s Plan for Immediate Action: Providing Long-Term Care Choices for the Elderly and People with Disabilities: http://new.dhh.louisiana.gov/assets/docs/RFPs/LAPlanforImmediateAction2005.pdf
Raising Expectations: A State Scorecard on Long-Term Services and Supports for Older Adults, People with Physical Disabilities, and Family Caregivers: http://www.longtermscorecard.org
PAR “Working toward a Client-Centered and Cost-Effective Approach to Medicaid Long-Term Care for the Elderly, April 2010
Consumer Involvement in Medicaid Nursing Facility reimbursement: Lessons from New York and Minnesota for State Policy Makers, University of Massachusetts Boston, The Commonwealth Fund, Long Term Care Community Coalition
Funding Options for Services for Persons with Disabilities and The Elderly (HCR 234), The Department of Health and Hospitals, April 2011
On the Verge: The Transformation of Long-Term Services and Supports, AARP Public Policy Institute, February 2012
Weathering the Storm: The Impact of the Great Recession on Long-Term Services and Supports State Profile: Louisiana, AARP Public Policy Institute,
Home and Community-Based Long-Term Services and Supports for Older People, AARP Public Policy Institute, May 2011
Across the States Profiles of Long-Term Care and Independent Living Louisiana, AARP State Long-Term Services and Supports Scorecard What Distinguishes High- from Low-
Ranking States: Case Study: Minnesota, AARP, May 2012 LTC History in Louisiana presentation by Department of Health and Hospitals Aging and
Adult Services, August 17, 2012 Long Term Care Reimbursement Methodology presentation by Myers and Stauffer,
September 28, 2012 LTC Funding in Louisiana presentation by Department of Health and Hospitals Aging and
Adult Services, September 28, 2012 Best Practice Financing Options presentation by Department of Health and Hospitals Aging
and Adult Services, September 28, 2012 Best Practice Financing Options presentation by Department of Health and Hospitals,
October 19, 2012 GOEA Program Funding Report for FYE June 30, 2012 GOEA Taxonomy Fiscal Years Report 2012-2015 Social Services Block Grant, ASAAPS publication, March 2005 DHH Nursing Home Patient Liability/Medicaid Estate Recovery Report, October 19, 2012 Tax Millages Relating to Health Care, Aging Services or Disability Services, excerpt from the
Louisiana Tax Commission Annual Report, 2011 Title XX Social Services Block Grant Intended Use Report, State Fiscal Year July 1, 2011 –
June 30, 2012 DHH Special Rate Program Licensed Bed Impact, October 19, 2012 Louisiana Case Mix Nursing Facility Reimbursement Methodology, October 19, 2012

Medicaid Trust Fund for the Elderly, excerpt from PAR Guide to the 2012 Constitutional Amendments, September 2012
Overview of Top States/Southern States Long Term Care Financing Design presented by AARP, November 16, 2012
Initiatives Under Health Care Reform and Louisiana’s Status presented by AARP and DHH, November 16, 2012
ADL Report, Louisiana Nursing Home Association
i AARP 2008 Member Survey ii Kaiser, Statehealthfacts.org
iii Thomson Reuters, Medicaid Long Term Care Expenditures, 1996-2009
iv “Working Toward a Client-Centered and Cost-Effective Approach to Medicaid Long-Term Care for the Elderly,”
Public Affairs Research Council, April 2010 v DHH-OAAS
vi ibid, December 9, 2012
vii U.S. Bureau of Census
viii Kaiser Family Foundation, 2011
ix Kaiser, Statehealthfacts.org
x AARP, Across the States: Profiles of Long-Term Care and Independent Living, 2012, Note: based on 2010 data
xi Genworth Cost of Care, 2012
xii AARP Across the States Report, 2012
xiii Kaiser HCBS Data Update, 2011
xiv Thomson Reuters, Medicaid Long Term Care Expenditures, 1996-2009
xv AARP Public Policy Institute
xvi ibid
xvii ibid
xviii Louisiana Department of Health and Hospitals, Office of Aging and Adult Services
xix AARP member survey, H.R. 166 Regular session 2012
xx “Working Toward a Client-Centered and Cost-Effective Approach to Medicaid Long-Term Care for the Elderly,”
Public Affairs Research Council, April 2010 xxi
State of Louisiana, Bureau of Health Services Financing (Medicaid) Office of Aging and Adult Services Office for
Citizens with Developmental Disabilities Request for Information: Long Term Services and Supports for Persons Enrolled in Louisiana Medicaid (http://new.dhh.louisiana.gov/assets/docs/BayouHealth/RFI-11282012/LTC-RFI-1129.pdf) xxii
DHH-OAAS xxiii
ibid xxiv
ibid, December 9, 2012 xxv
Center for Medicare and Medicaid Services, Letter to State Medicaid Directors, 5/20/10,
http://downloads.cms.gov/cmsgov/archived-downloads/SMDL/downloads/SMD10008.pdf