framework for measuring performance of trade … for measuring...framework for measuring performance...
TRANSCRIPT
Framework for Measuring Performance of Trade Related Services under Trade Facilitation Process
Biswajit Nag Indian Institute of Foreign Trade,
New Delhi
Work in Progress
Background • The world has witnessed a decline in average tariff • Various Non-Tariff barriers are the major impediments to
achieve the desired gains from International Trade
• Improvement in Trade Facilitation (TF) is expected to provide a significant growth in world trade – WTO claims for a trade growth of US$ 1 trillion if Bali
agreement is in place – Studies find that Trade Costs are between 1%-15% of value of
traded goods – APEC is expected to gain 0.26% of Real GDP if its TF programme is fully implemented
• Countries have taken up efforts to improve TF process either unilaterally or due to WTO commitment or due to commitment in RTAs/FTAs – Simplification of Customs Rules – Transparency and harmonized Regulation – Automation and introduction of Single Window System – Improvement in Logistics and Communication System – Introduced Port Reform
• Number of global organisations ( such as World Bank, OECD, etc) are now
providing information about the status of TF across the world through various indices – Trading Across the Border/Doing Business : World Bank – Logistics Performance Indicator : World Bank – Enabling Trade Indices: World Economic Forum – Trade Facilitation Indicators: OECD
Background
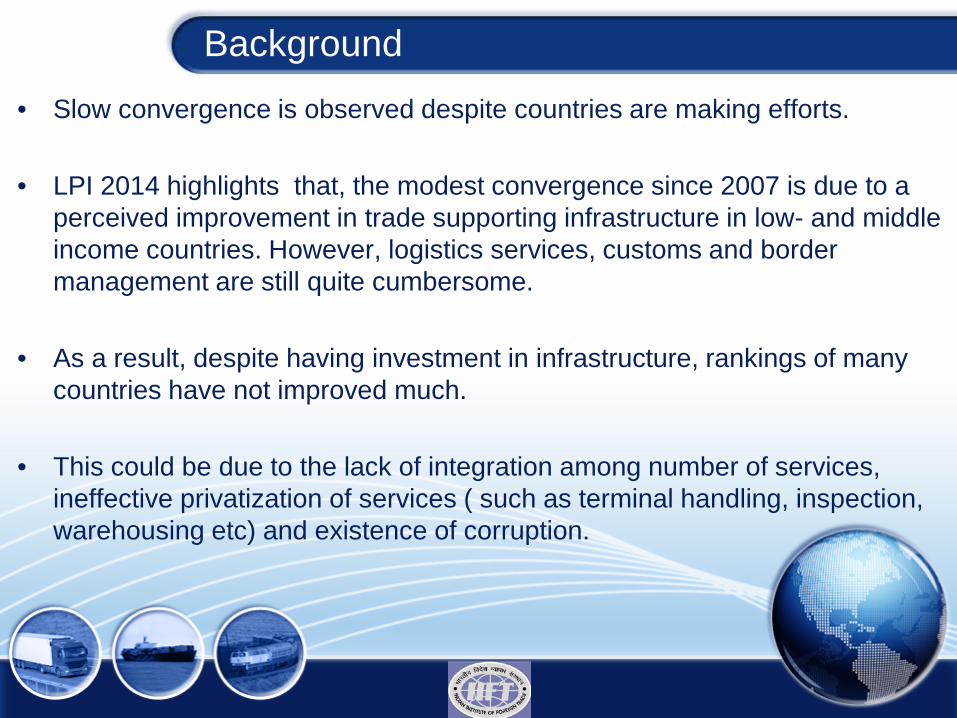
• Slow convergence is observed despite countries are making efforts.
• LPI 2014 highlights that, the modest convergence since 2007 is due to a perceived improvement in trade supporting infrastructure in low- and middle income countries. However, logistics services, customs and border management are still quite cumbersome.
• As a result, despite having investment in infrastructure, rankings of many countries have not improved much.
• This could be due to the lack of integration among number of services, ineffective privatization of services ( such as terminal handling, inspection, warehousing etc) and existence of corruption.
Background
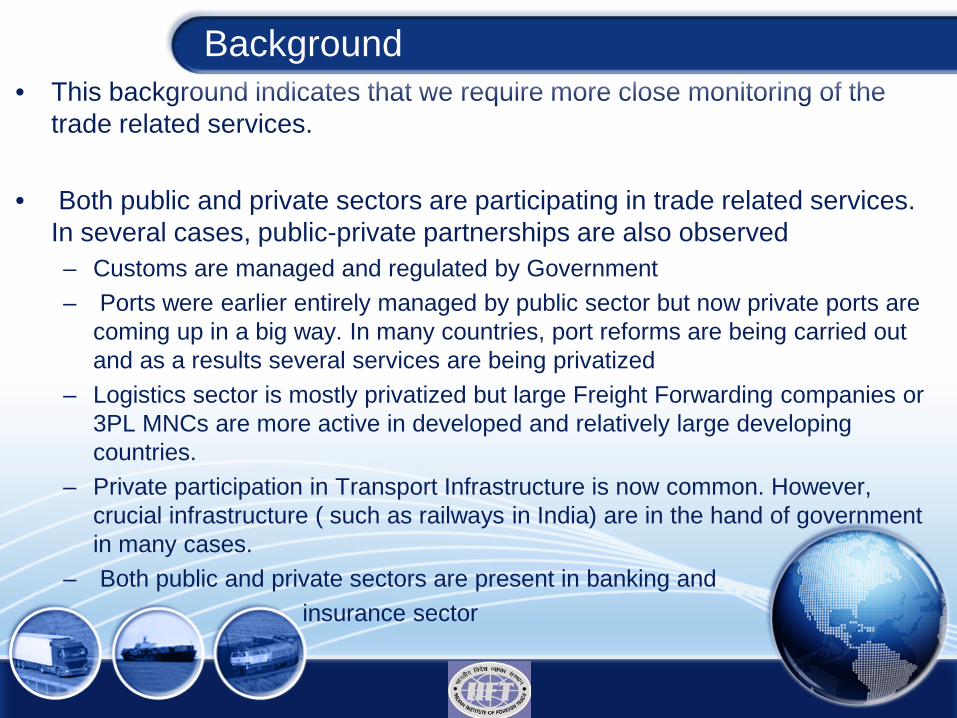
• This background indicates that we require more close monitoring of the trade related services.
• Both public and private sectors are participating in trade related services. In several cases, public-private partnerships are also observed – Customs are managed and regulated by Government – Ports were earlier entirely managed by public sector but now private ports are
coming up in a big way. In many countries, port reforms are being carried out and as a results several services are being privatized
– Logistics sector is mostly privatized but large Freight Forwarding companies or 3PL MNCs are more active in developed and relatively large developing countries.
– Private participation in Transport Infrastructure is now common. However, crucial infrastructure ( such as railways in India) are in the hand of government in many cases.
– Both public and private sectors are present in banking and insurance sector
Background
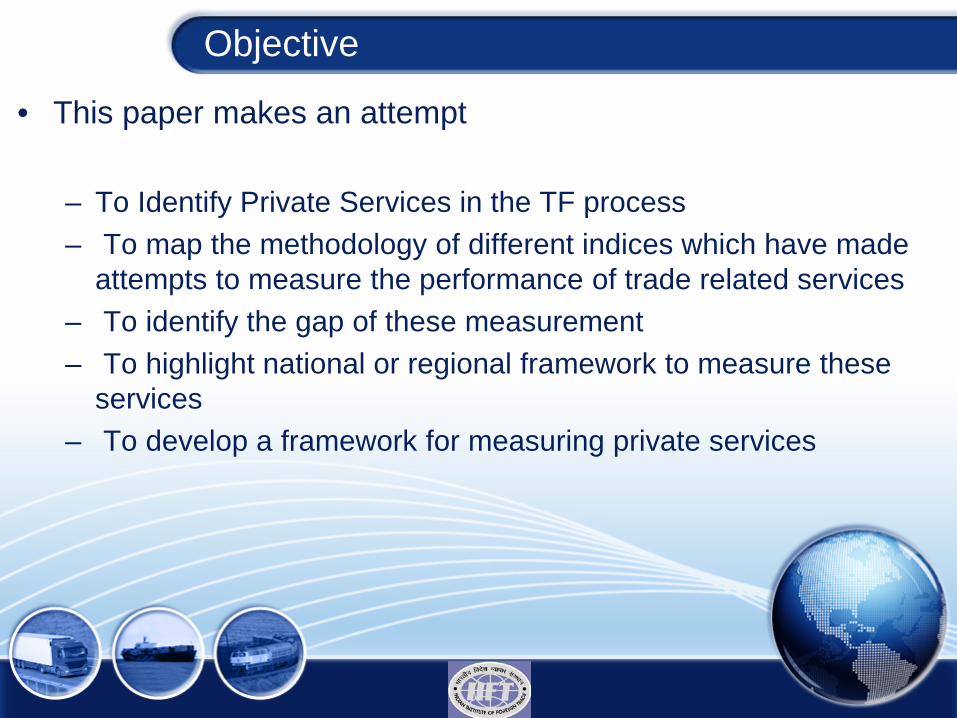
• This paper makes an attempt
– To Identify Private Services in the TF process – To map the methodology of different indices which have made
attempts to measure the performance of trade related services – To identify the gap of these measurement – To highlight national or regional framework to measure these
services – To develop a framework for measuring private services
Objective
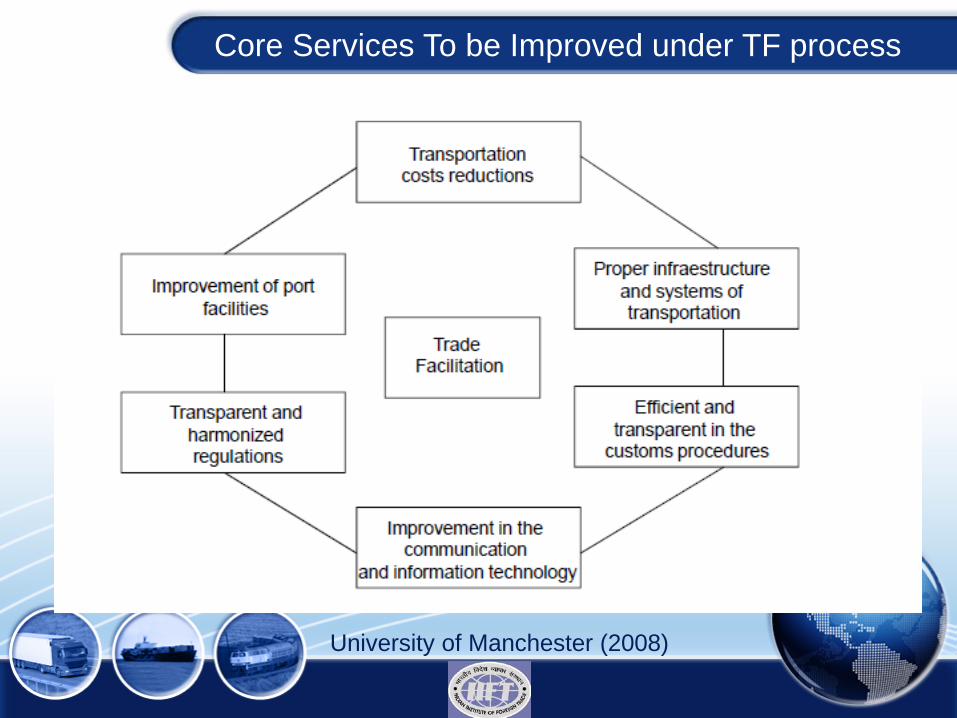
Core Services To be Improved under TF process
University of Manchester (2008)
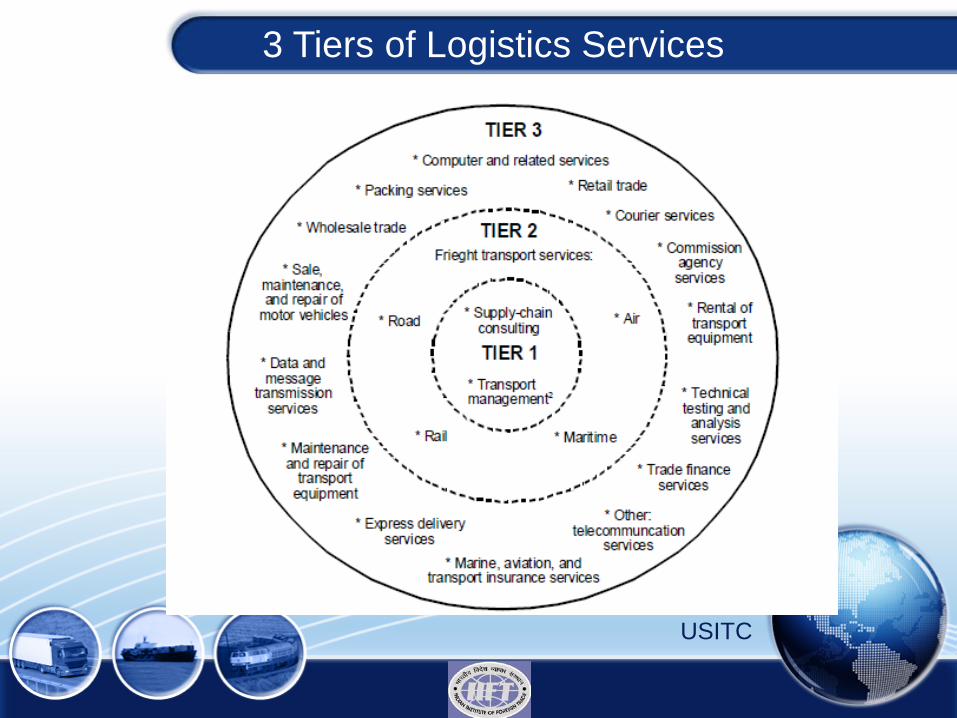
3 Tiers of Logistics Services
USITC
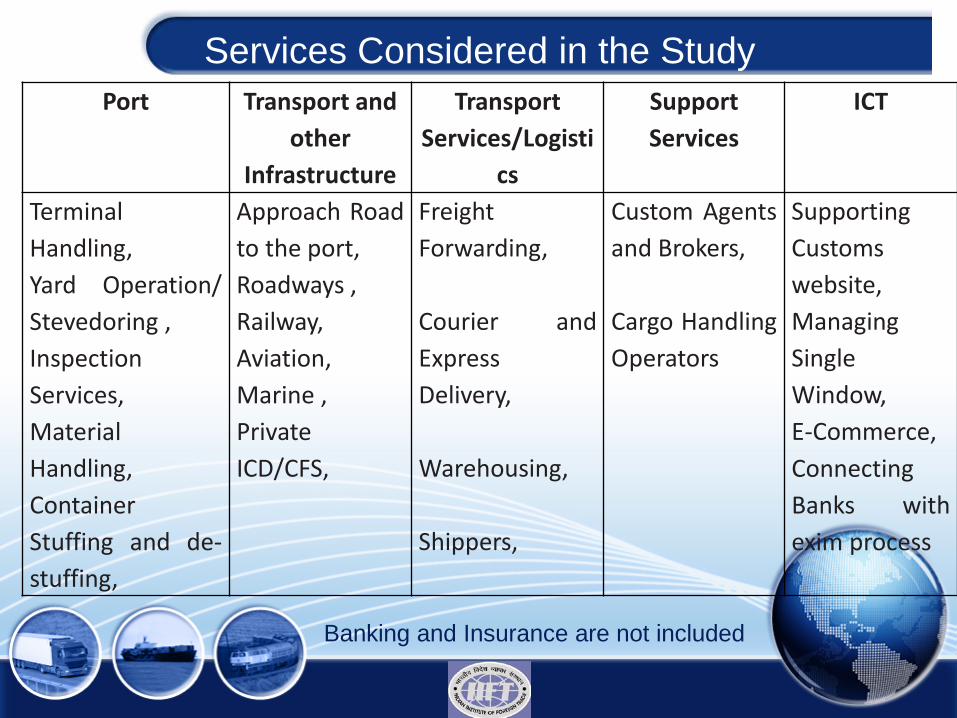
Services Considered in the Study Port Transport and
other Infrastructure
Transport Services/Logisti
cs
Support Services
ICT
Terminal Handling, Yard Operation/ Stevedoring , Inspection Services, Material Handling, Container Stuffing and de-stuffing,
Approach Road to the port, Roadways , Railway, Aviation, Marine , Private ICD/CFS,
Freight Forwarding, Courier and Express Delivery, Warehousing, Shippers,
Custom Agents and Brokers, Cargo Handling Operators
Supporting Customs website, Managing Single Window, E-Commerce, Connecting Banks with exim process
Banking and Insurance are not included
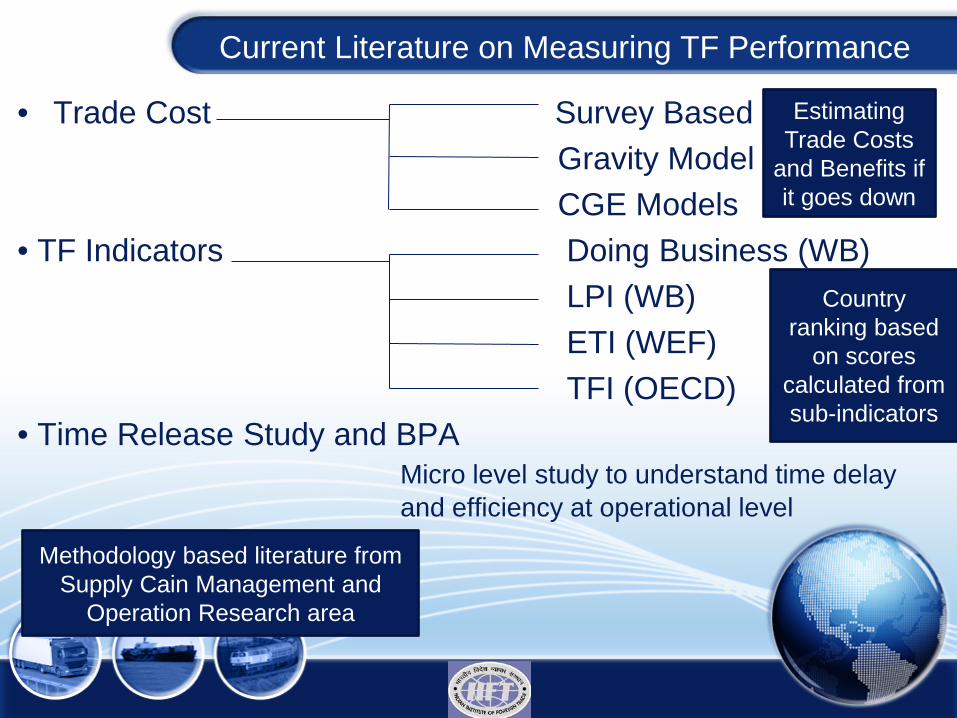
• Trade Cost Survey Based Gravity Model CGE Models • TF Indicators Doing Business (WB) LPI (WB) ETI (WEF) TFI (OECD) • Time Release Study and BPA Micro level study to understand time delay and efficiency at operational level
Current Literature on Measuring TF Performance
Estimating Trade Costs
and Benefits if it goes down
Country ranking based
on scores calculated from sub-indicators
Methodology based literature from Supply Cain Management and
Operation Research area
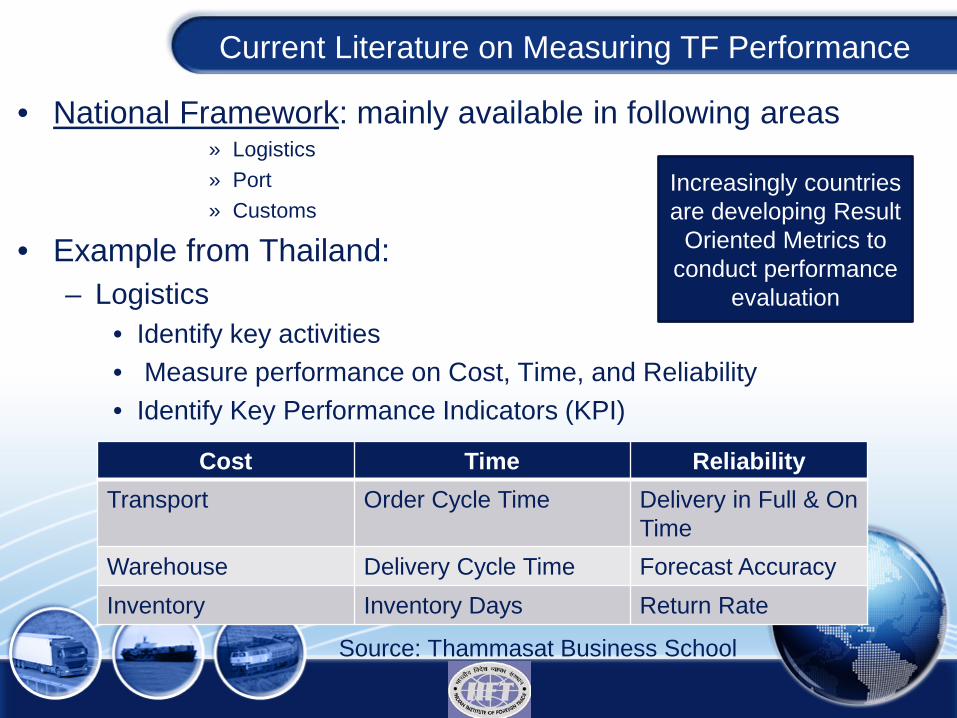
• National Framework: mainly available in following areas » Logistics » Port » Customs
• Example from Thailand: – Logistics
• Identify key activities • Measure performance on Cost, Time, and Reliability • Identify Key Performance Indicators (KPI)
Current Literature on Measuring TF Performance
Cost Time Reliability Transport Order Cycle Time Delivery in Full & On
Time Warehouse Delivery Cycle Time Forecast Accuracy Inventory Inventory Days Return Rate
Source: Thammasat Business School
Increasingly countries are developing Result
Oriented Metrics to conduct performance
evaluation
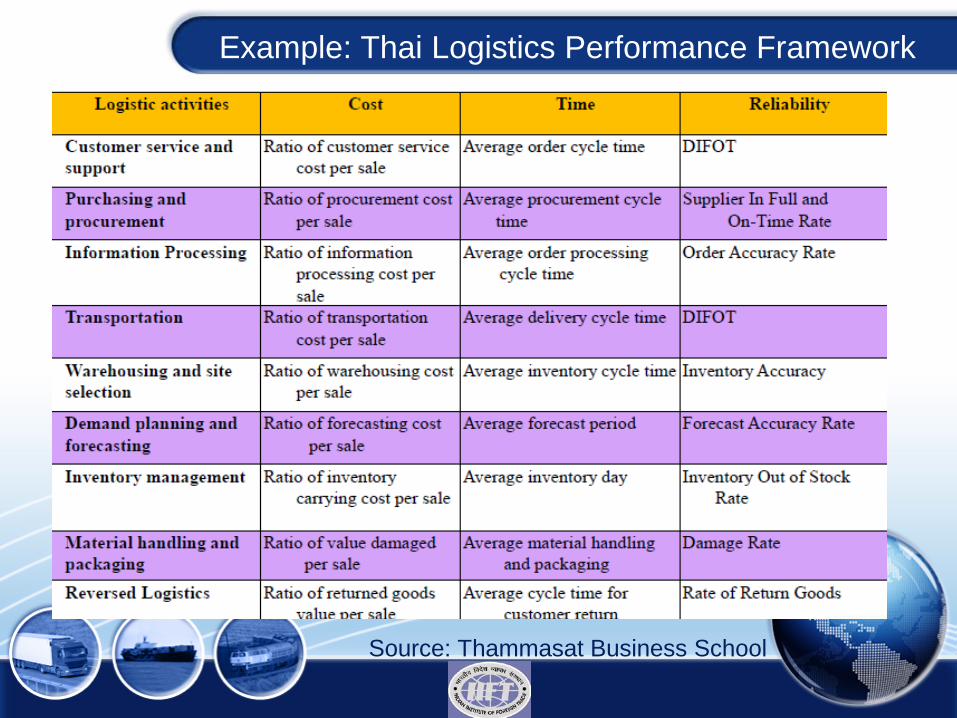
Example: Thai Logistics Performance Framework
Source: Thammasat Business School
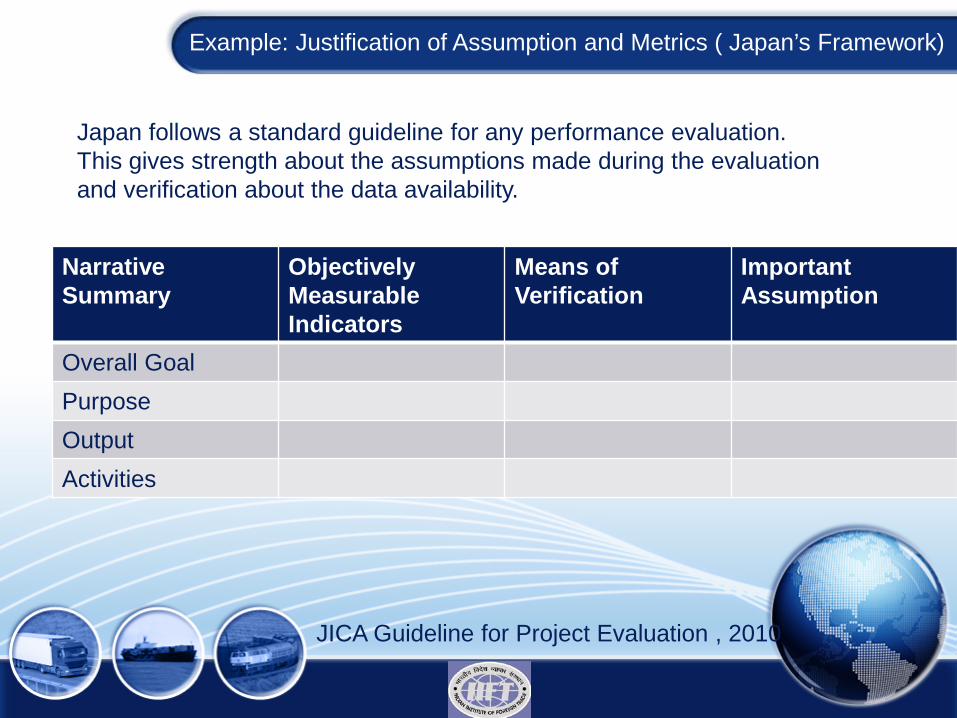
Example: Justification of Assumption and Metrics ( Japan’s Framework)
Narrative Summary
Objectively Measurable Indicators
Means of Verification
Important Assumption
Overall Goal Purpose Output Activities
Japan follows a standard guideline for any performance evaluation. This gives strength about the assumptions made during the evaluation and verification about the data availability.
JICA Guideline for Project Evaluation , 2010
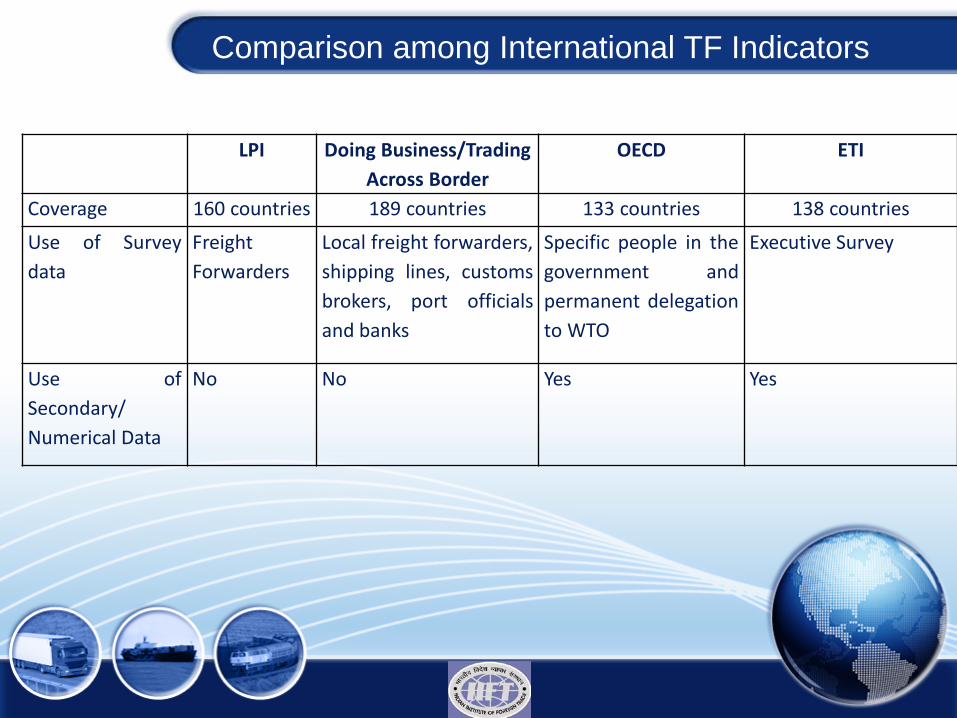
LPI Doing Business/Trading Across Border
OECD ETI
Coverage 160 countries 189 countries 133 countries 138 countries
Use of Survey data
Freight Forwarders
Local freight forwarders, shipping lines, customs brokers, port officials and banks
Specific people in the government and permanent delegation to WTO
Executive Survey
Use of Secondary/ Numerical Data
No No Yes Yes
Comparison among International TF Indicators
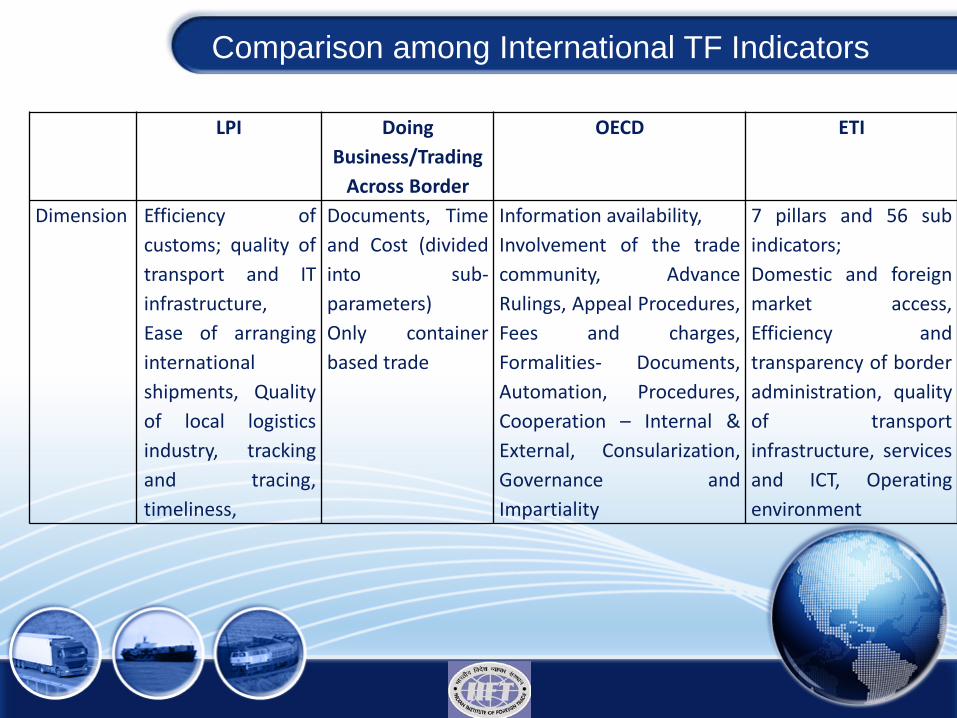
LPI Doing Business/Trading
Across Border
OECD ETI
Dimension Efficiency of customs; quality of transport and IT infrastructure, Ease of arranging international shipments, Quality of local logistics industry, tracking and tracing, timeliness,
Documents, Time and Cost (divided into sub-parameters) Only container based trade
Information availability, Involvement of the trade community, Advance Rulings, Appeal Procedures, Fees and charges, Formalities- Documents, Automation, Procedures, Cooperation – Internal & External, Consularization, Governance and Impartiality
7 pillars and 56 sub indicators; Domestic and foreign market access, Efficiency and transparency of border administration, quality of transport infrastructure, services and ICT, Operating environment
Comparison among International TF Indicators
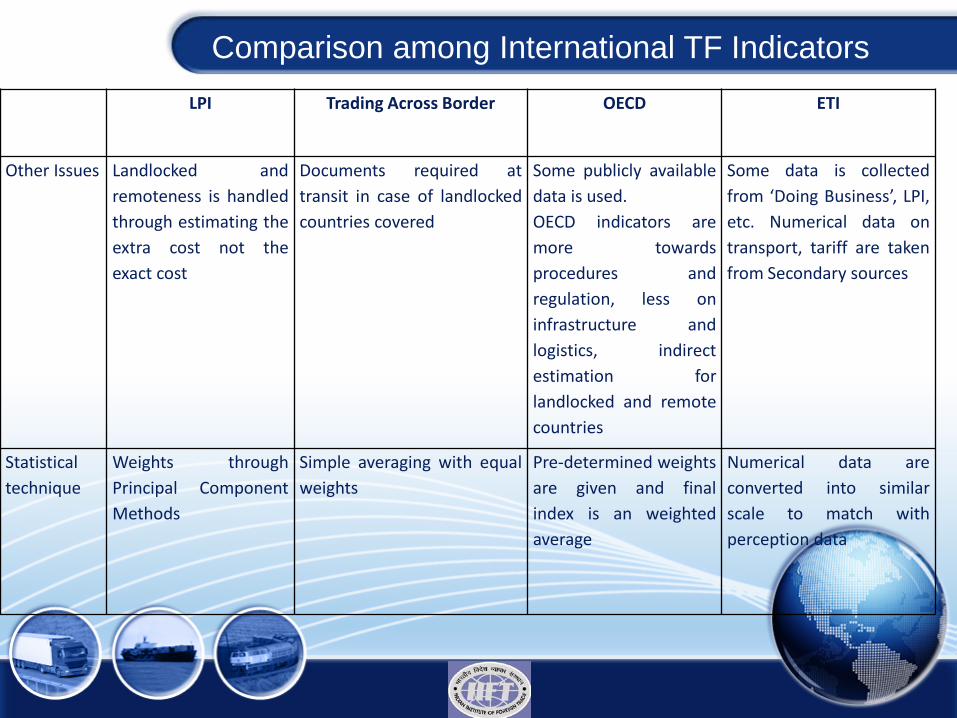
LPI Trading Across Border OECD ETI
Other Issues Landlocked and remoteness is handled through estimating the extra cost not the exact cost
Documents required at transit in case of landlocked countries covered
Some publicly available data is used. OECD indicators are more towards procedures and regulation, less on infrastructure and logistics, indirect estimation for landlocked and remote countries
Some data is collected from ‘Doing Business’, LPI, etc. Numerical data on transport, tariff are taken from Secondary sources
Statistical technique
Weights through Principal Component Methods
Simple averaging with equal weights
Pre-determined weights are given and final index is an weighted average
Numerical data are converted into similar scale to match with perception data
Comparison among International TF Indicators
The global indices prepared by multilateral agencies have been very useful for countries to compare the status of the improvement in trade facilitation activities. For example, OECD indicators hint that India has to improve in fees, charges and streamlining procedures and China in border cooperation.
These indicators are providing a macro perspective but some of them are merely based on perception. There is a need to scientifically connect numerical macro data with the perception data to arrive at more robust result.
Also, hardly these indicators take care of different types of facilitation process required for different products. Similarly, due importance should be given for sea, air and land crossing. Time Release studies (TRS) provide more micro dimension and these learning should be linked to macro studies. For example, in Uganda, land crossing is more effective than airport cargo handling.
Limitation of Current International Framework
Basis of Framework to measure Performance of Trade Related Services
** Three major issues which have influences on the performances of trade services are •Nature of Ports: Sea, Air and Land •Nature of Products: Perishable, liquid, non-bulk (containerised) and bulk (non-containerised) •Geographical Disadvantages: Remote Island and Landlocked countries
** Numerical Data to be used along with Survey data • Data from LPI, Doing Business along with National performance data to be collected • Perception Survey to be conducted among all stakeholders
• Each Service is required to be divided to sub services • Overall goal, purpose, nature of outputs and activities to be mapped • Availability of data, identification of proxy data ( if required) to be identified and checked • Assumption validation through experts is required
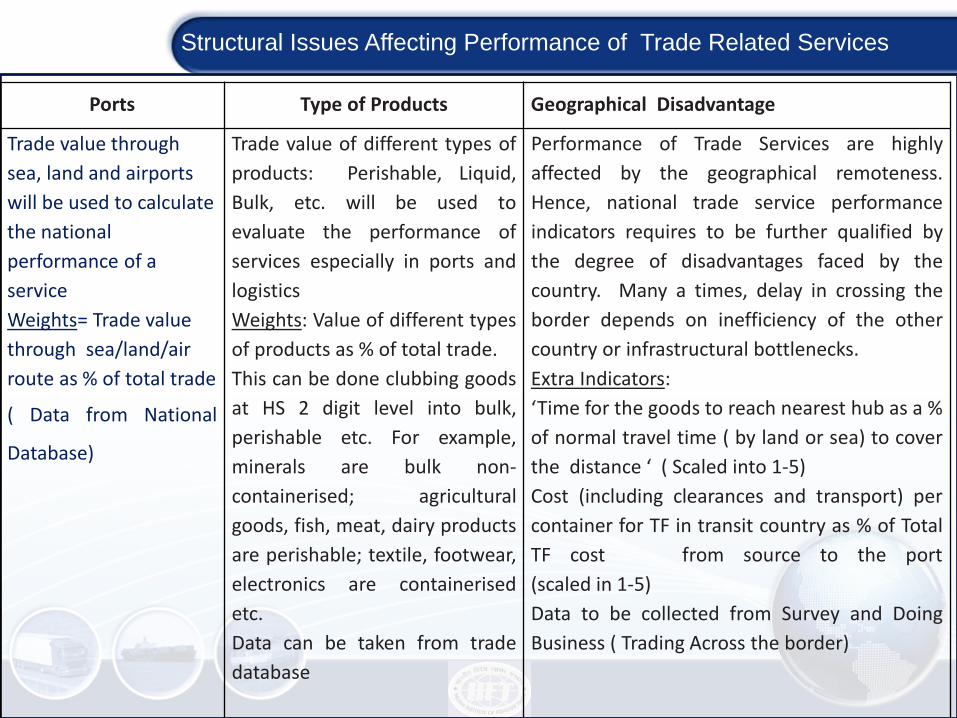
Structural Issues Affecting Performance of Trade Related Services
Ports Type of Products Geographical Disadvantage
Trade value through sea, land and airports will be used to calculate the national performance of a service Weights= Trade value through sea/land/air route as % of total trade
( Data from National
Database)
Trade value of different types of products: Perishable, Liquid, Bulk, etc. will be used to evaluate the performance of services especially in ports and logistics Weights: Value of different types of products as % of total trade. This can be done clubbing goods at HS 2 digit level into bulk, perishable etc. For example, minerals are bulk non- containerised; agricultural goods, fish, meat, dairy products are perishable; textile, footwear, electronics are containerised etc. Data can be taken from trade database
Performance of Trade Services are highly affected by the geographical remoteness. Hence, national trade service performance indicators requires to be further qualified by the degree of disadvantages faced by the country. Many a times, delay in crossing the border depends on inefficiency of the other country or infrastructural bottlenecks. Extra Indicators: ‘Time for the goods to reach nearest hub as a % of normal travel time ( by land or sea) to cover the distance ‘ ( Scaled into 1-5) Cost (including clearances and transport) per container for TF in transit country as % of Total TF cost from source to the port (scaled in 1-5) Data to be collected from Survey and Doing Business ( Trading Across the border)
Framework for Trade Service Performance Indicators
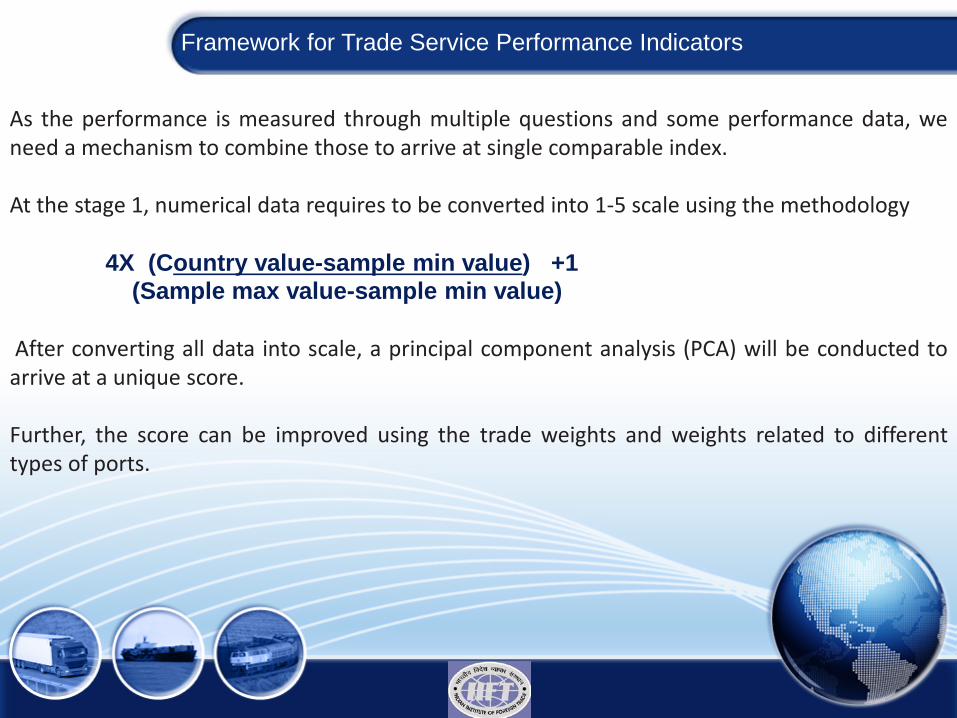
As the performance is measured through multiple questions and some performance data, we need a mechanism to combine those to arrive at single comparable index. At the stage 1, numerical data requires to be converted into 1-5 scale using the methodology 4X (Country value-sample min value) +1 (Sample max value-sample min value) After converting all data into scale, a principal component analysis (PCA) will be conducted to arrive at a unique score. Further, the score can be improved using the trade weights and weights related to different types of ports.
Framework for Trade Service Performance Indicators
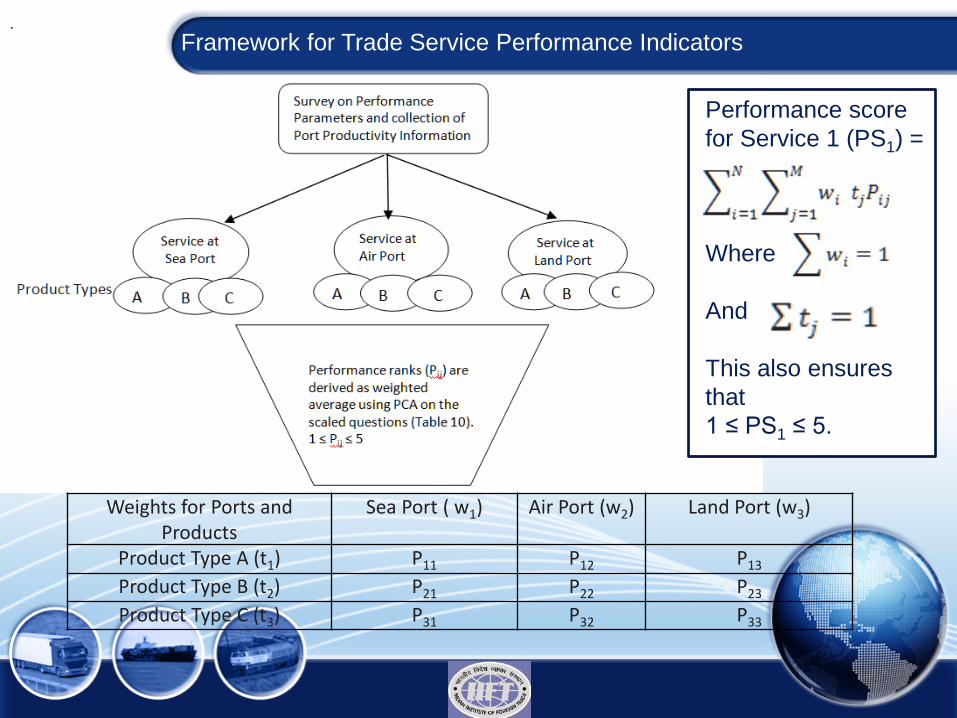
Weights for Ports and Products
Sea Port ( w1) Air Port (w2) Land Port (w3)
Product Type A (t1) P11 P12 P13 Product Type B (t2) P21 P22 P23 Product Type C (t3) P31 P32 P33
Performance score for Service 1 (PS1) = Where And This also ensures that 1 ≤ PS1 ≤ 5.
.
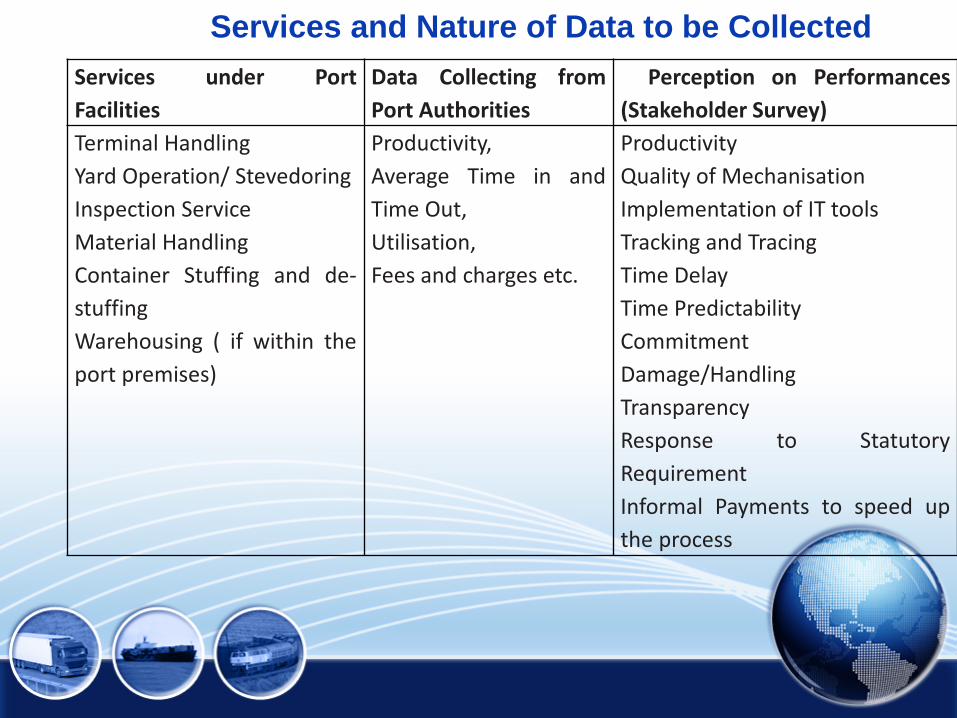
Services and Nature of Data to be Collected Services under Port Facilities
Data Collecting from Port Authorities
Perception on Performances (Stakeholder Survey)
Terminal Handling Yard Operation/ Stevedoring Inspection Service Material Handling Container Stuffing and de-stuffing Warehousing ( if within the port premises)
Productivity, Average Time in and Time Out, Utilisation, Fees and charges etc.
Productivity Quality of Mechanisation Implementation of IT tools Tracking and Tracing Time Delay Time Predictability Commitment Damage/Handling Transparency Response to Statutory Requirement Informal Payments to speed up the process
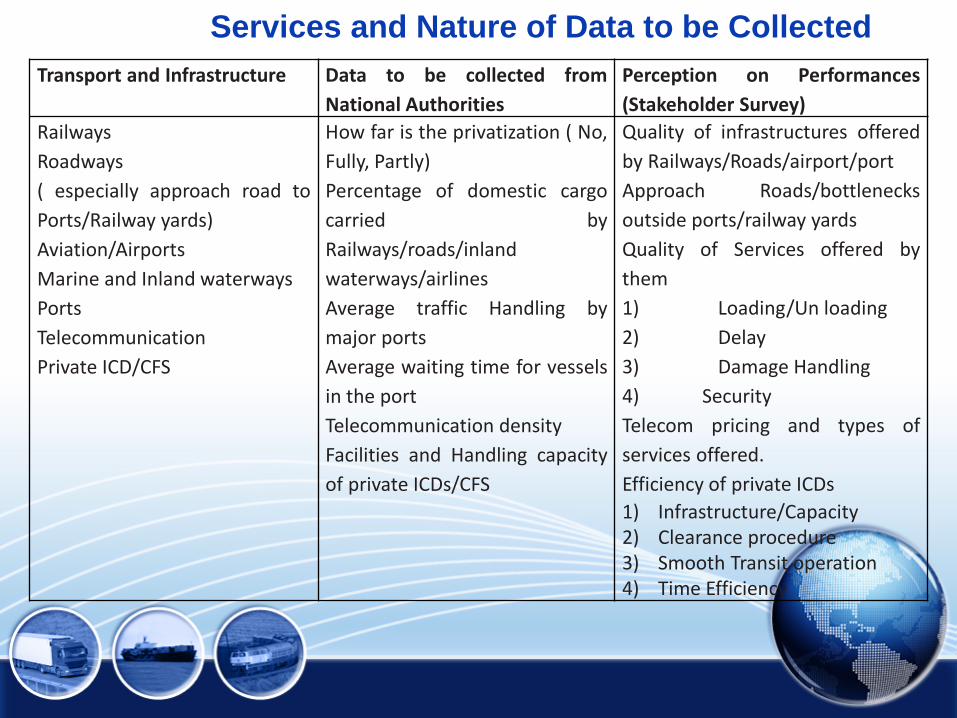
Services and Nature of Data to be Collected Transport and Infrastructure Data to be collected from
National Authorities Perception on Performances (Stakeholder Survey)
Railways Roadways ( especially approach road to Ports/Railway yards) Aviation/Airports Marine and Inland waterways Ports Telecommunication Private ICD/CFS
How far is the privatization ( No, Fully, Partly) Percentage of domestic cargo carried by Railways/roads/inland waterways/airlines Average traffic Handling by major ports Average waiting time for vessels in the port Telecommunication density Facilities and Handling capacity of private ICDs/CFS
Quality of infrastructures offered by Railways/Roads/airport/port Approach Roads/bottlenecks outside ports/railway yards Quality of Services offered by them 1) Loading/Un loading 2) Delay 3) Damage Handling 4) Security Telecom pricing and types of services offered. Efficiency of private ICDs 1) Infrastructure/Capacity 2) Clearance procedure 3) Smooth Transit operation 4) Time Efficiency

Services and Nature of Data to be Collected Services Data to be collected from National
Authorities Perception on Performances
(Stakeholder Survey) Freight Forwarding Courier and Express Delivery Warehousing Shippers
How far is the privatization ( No, Fully, Partly) Whether 3PL companies are present Contd. From Col. 3 Value Added Service such as barcoding, labelling, light assembly Shippers Cost effectiveness Value for Money Services Time Delay Commitment Response to Statutory Requirement
For Freight Forwarders: Cost effectiveness Value for Money Services Time Delay Tracking Service Cargo Handling Helping in Custom Clearance For Courier and Express Delivery: Pick up service Delivery service Time Delay Tracking Service Warehousing: Damage /Handling Refrigeration Cost Effectiveness Contd. To Col. 2
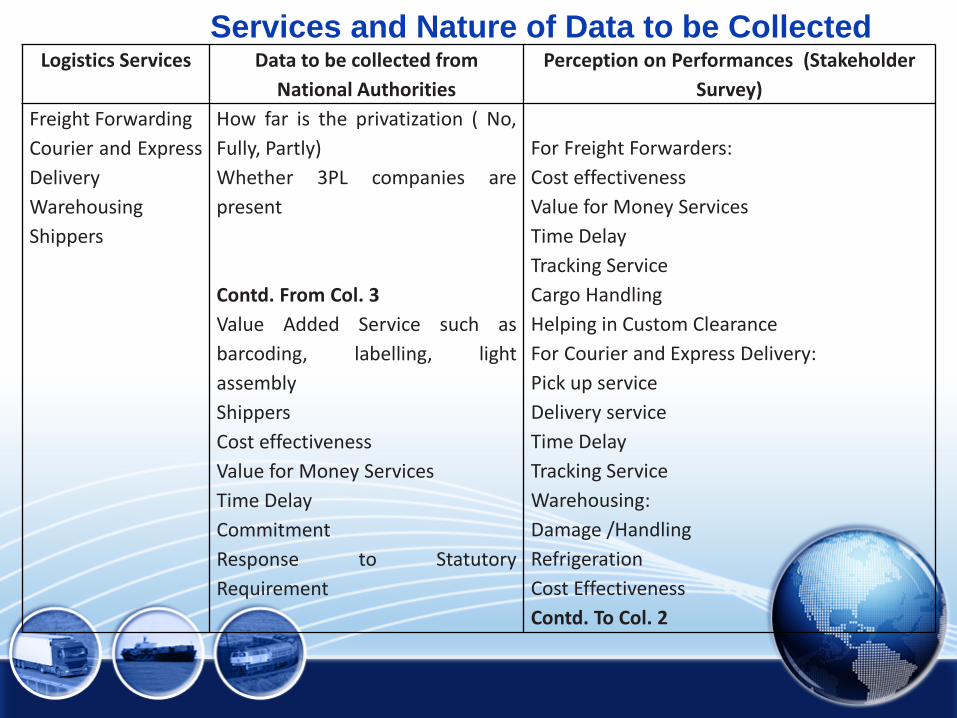
Services and Nature of Data to be Collected Logistics Services Data to be collected from
National Authorities Perception on Performances (Stakeholder
Survey) Freight Forwarding Courier and Express Delivery Warehousing Shippers
How far is the privatization ( No, Fully, Partly) Whether 3PL companies are present Contd. From Col. 3 Value Added Service such as barcoding, labelling, light assembly Shippers Cost effectiveness Value for Money Services Time Delay Commitment Response to Statutory Requirement
For Freight Forwarders: Cost effectiveness Value for Money Services Time Delay Tracking Service Cargo Handling Helping in Custom Clearance For Courier and Express Delivery: Pick up service Delivery service Time Delay Tracking Service Warehousing: Damage /Handling Refrigeration Cost Effectiveness Contd. To Col. 2
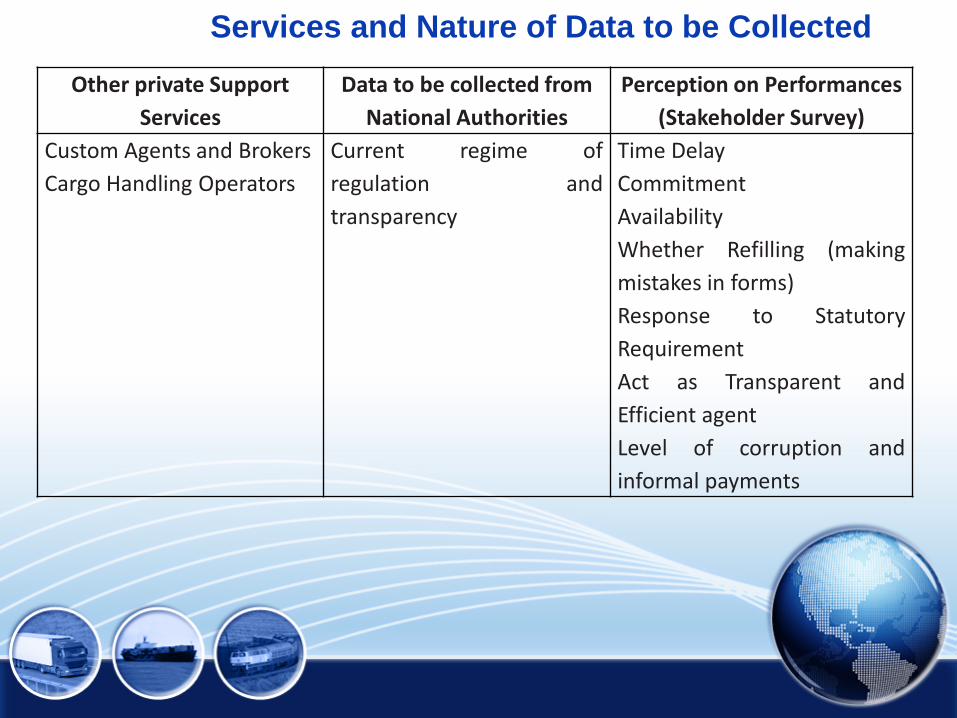
Services and Nature of Data to be Collected Other private Support
Services Data to be collected from
National Authorities Perception on Performances
(Stakeholder Survey) Custom Agents and Brokers Cargo Handling Operators
Current regime of regulation and transparency
Time Delay Commitment Availability Whether Refilling (making mistakes in forms) Response to Statutory Requirement Act as Transparent and Efficient agent Level of corruption and informal payments
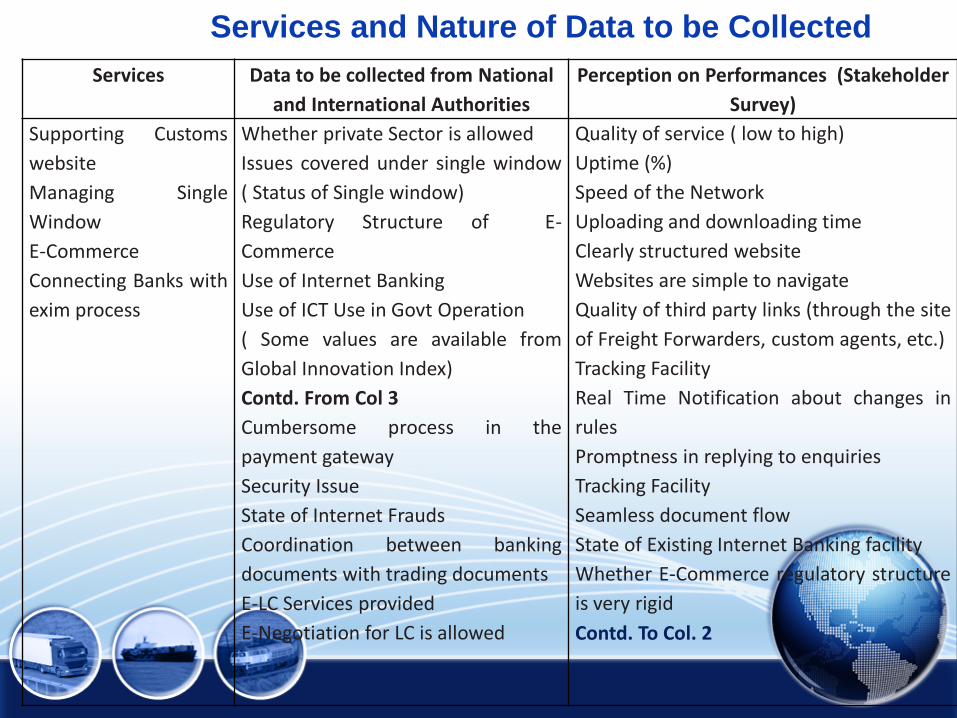
Services and Nature of Data to be Collected Services Data to be collected from National
and International Authorities Perception on Performances (Stakeholder
Survey) Supporting Customs website Managing Single Window E-Commerce Connecting Banks with exim process
Whether private Sector is allowed Issues covered under single window ( Status of Single window) Regulatory Structure of E-Commerce Use of Internet Banking Use of ICT Use in Govt Operation ( Some values are available from Global Innovation Index) Contd. From Col 3 Cumbersome process in the payment gateway Security Issue State of Internet Frauds Coordination between banking documents with trading documents E-LC Services provided E-Negotiation for LC is allowed
Quality of service ( low to high) Uptime (%) Speed of the Network Uploading and downloading time Clearly structured website Websites are simple to navigate Quality of third party links (through the site of Freight Forwarders, custom agents, etc.) Tracking Facility Real Time Notification about changes in rules Promptness in replying to enquiries Tracking Facility Seamless document flow State of Existing Internet Banking facility Whether E-Commerce regulatory structure is very rigid Contd. To Col. 2